Abstract
To address issues of climate change, people are more and more being presented with the greenhouse gas emissions associated with their alternatives. Statements of pounds or kilograms of CO2 are showing up in trip planners, car advertisements, and even restaurant menus under the assumption that this information influences behavior. This research contributes to the literature that investigates how travelers respond to such information. Our objective is to better understand the “value of green” or how much travelers are willing to pay in money in order to reduce the CO2 associated with their travel. As with previous work, we designed and conducted a mode choice experiment using methods that have long been used to study value of time. The contributions of this paper are twofold. First, we employ revealed preference data, whereas previous studies have been based on stated preferences. Second, we provide new insight on how the value of green is distributed in the population. Whereas previous work has specified heterogeneity either systematically or with a continuous distribution, we find that a latent class choice model specification better fits the data and also is attractive behaviorally. The best fitting latent class model has two classes: one large class (76% of the sample) who are not willing to spend any time or money to reduce their CO2 and a second class (24% of the sample) who value reducing their CO2 at a very high rate of $2.68 per pound of reduction–our so-called small group with a big heart. We reanalyzed three datasets that we had previously collected and found considerable robustness of this two class result.
1. Introduction
Urban areas today go to great lengths to mitigate the damages associated with many people driving private vehicles. The three largest of these damages are economic losses due to compromised safety, added congestion, and air pollution. Dubner and Levitt [1] estimate these cost the United States $220 billion, $78 billion, and $20 billion per year respectively. For the most part, these problems of the modern world are addressed independently rather than collectively. Lanes are often added to freeways that can temporarily alleviate some congestion, vehicle manufacturers are mandated to install specific safety features to reduce the frequency and severity of accidents, and fuels and on-board technologies are regulated to reduce the harmful pollutants in exhaust gasses. However, an improvement in one measure often means a decline in another; adding a lane to the freeway might reduce congestion but it will probably also increase air pollution, for example. Sometimes there is also an eventual decline in the measure of interest as is the case when better access to an area served by a new freeway induces greater travel demand which in turn leads to worse congestion than before the bottleneck was removed. Even if there was a desirable way to physically build a solution to the problems associated with so many people driving alone, the extraordinary cost of new infrastructure is often prohibitive, which leaves some type of mode shift as the preferred solution to the safety concerns, congestion, and environmental impacts associated with our current transportation network. Encouraging this type of a shift with a carrot such as a dramatically improved transit system is not as effective as the models predict [2], and using a stick such as road pricing is politically impossible many places in the world. On the other hand, the provision of information to users of the transportation network is practically free, and while traveler response to information about time and cost has been heavily studied, there are currently a lot of unknowns about how people react to various types of information, such as the environmental footprint of a trip.
With all the talk of “green” products and actions, climate change, and carbon pricing, it is reasonable to believe that people might desire to reduce their environmental footprint and perhaps even that the simple act of giving people information about the emissions associated with their transportation decisions could be used to encourage some mode shift towards walking, biking, and transit and away from driving alone. However, it is not well understood how people value reducing their environmental impact or how they react to being informed of their emissions. This type of information is becoming more and more popular, as shown in Figure 1 on the online trip planner for San Francisco’s Bay Area Rapid Transit, which prominently displays the reduced emissions relative to making the trip by car.
Using stated preference experiments, it has been shown that some people do make choices that indicate that they value reducing their emissions, and that there is substantial variation in how much value people place on these reductions. The aim of this research is to determine whether this willingness to pay for emissions reductions persists when peoples’ decisions in their day-to-day lives (revealed preferences) are analyzed as well as to further investigate how the value of green is distributed in the population. While this desire to mitigate emissions cannot necessarily be extrapolated immediately to mode shifts as a response to information provision, it is an important first step to investigate the tradeoffs people make when choosing their daily actions.
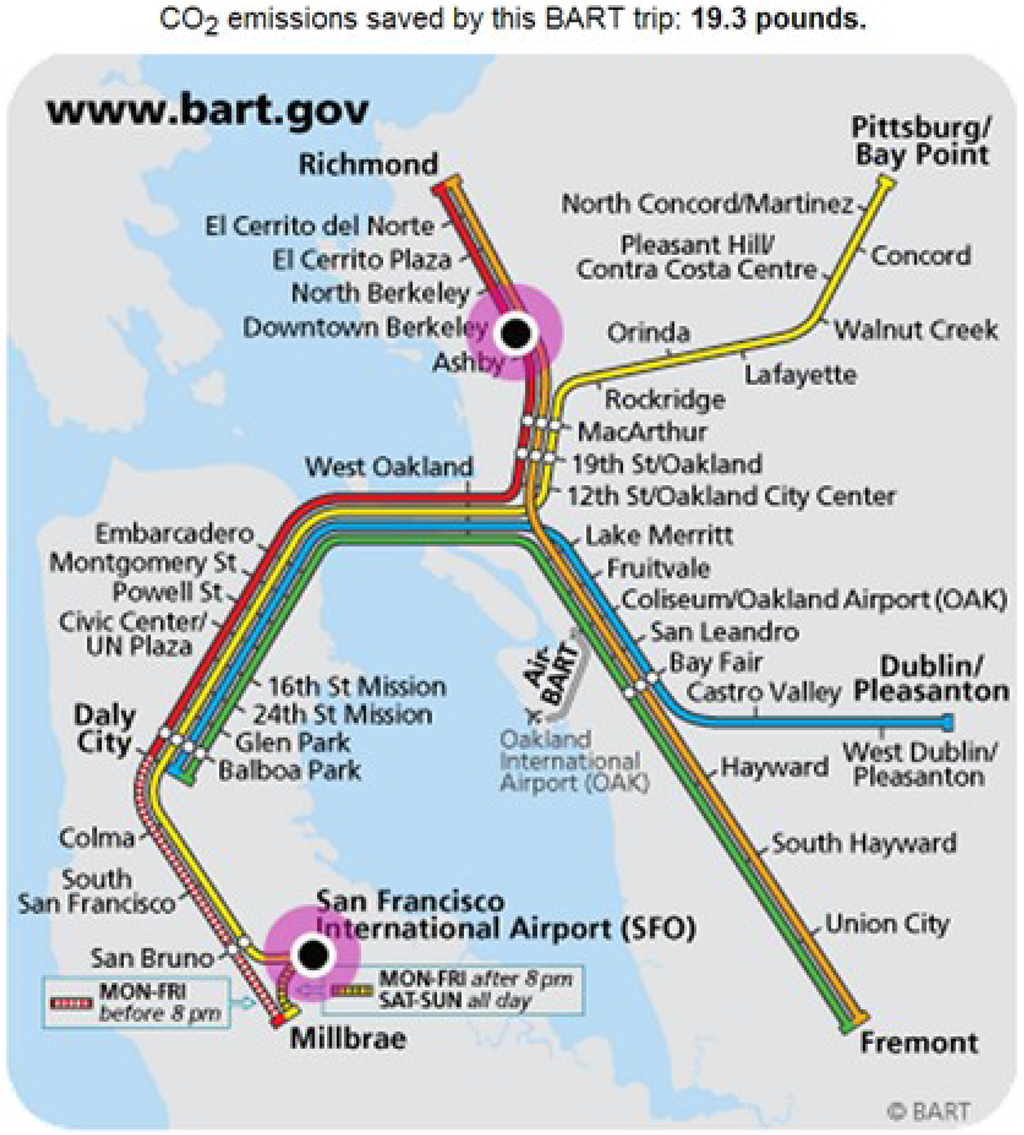
Figure 1.
Emissions savings displayed on BART trip planning online tool [3].
2. Literature Review
According to micro-economic theory, decision makers will be willing to trade one attribute for another without being any better or worse off. This is known as the marginal rate of substitution (MRS) between the two attributes. The common MRS in transportation decisions is between time and money, known as the value of time. This estimation is the average amount of one attribute (dollars in this case) the subjects would be willing to give up in order to gain a single unit of the other attribute (an hour of travel time). Value of time as well as other MRSs, are commonly estimated from logit models. For example, if time and cost enter the utility linearly, then the value of time is the ratio of the time parameter divided by the cost parameter. Such analysis of the value of time has become standard and is well summarized by Mackie et al. [4]. However, the willingness to pay for emissions reductions or the “value of green” has only recently been investigated. Here we review the literature in the transportation realm that has investigated how people value reducing their environmental footprint.
As an effort to reduce air pollution, especially in the South Coast Air Basin, in 1990, the California Air Resources Board passed requirements for the fuel use and emissions of new vehicles. In order to forecast how households in the area might decide which (not-yet-available) car to buy, Bunch et al. [5] designed an experiment that presented households in Southern California with three hypothetical vehicles described by their purchase price, operating cost, range, emissions, and fuel availability. They found that their subjects value reducing the emissions associated with their next vehicle. In the trade-off between purchase price and emissions, a decrease of emissions from 100% to 50% of then-current (1991) vehicles would have to be paired with a purchase price increase of $4000 in order to maintain the same choice probability. This trade-off is not found to be linear, however; a decrease of emissions from 50% to 10% would require an additional price increase of $6000. The emissions of concern at the time were primarily local pollutants rather than those contributing to climate change, but this research shows that people are willing to incur personal costs for the benefit of society at large.
Also investigating the decision of which car to buy, Achtnicht [6] estimated a marginal rate of substitution between carbon dioxide emissions and monetary cost by using a stated preference experiment. He found that German car buyers are willing to pay €349 per tonne ($0.22 per pound) of CO2 mitigated, which is substantially higher than the typical price for carbon on the open market. He also found systematic heterogeneity in his sample; females, people younger than 45, and people with higher educational achievement have a higher willingness to pay for emissions reductions. To investigate the difference between environmentalists and non-environmentalists, Daziano and Bolduc [7] used a hybrid choice model which included both latent variable and discrete choice models and showed that environmentally conscious consumers are more supportive than their counterparts of fossil fuel taxation and policies promoting green technologies, an explicit example of taste heterogeneity. In studying the revealed preferences of Californians, Martin [8] found that while some households purchase efficient vehicles based on cost savings alone, others exhibit a willingness to pay personal costs for the reductions of emissions and other public costs when their expectations regarding life of a car, such as duration of ownership and discount rate, are included in the calculation. In identifying this frontier between those who value environmental benefits and those who do not, Martin illustrates that there are some people with zero willingness to pay for emissions reductions as well as some who place positive value on societal benefits. This finding of a discrete distribution for willingness to pay for public goods such as emissions reductions supports our research which aims to quantify how many people care as well as how much they care.
In our previous work [9], we designed and conducted two experiments in the laboratory using UC Berkeley undergraduates as subjects. We found that they were willing to pay $0.24 per pound of emissions when buying a car and when choosing a route. The fact that the subjects were able to consistently place value on the pollution is particularly interesting because the emissions were presented in units of tons per year in the auto purchase choice and in units of pounds per trip in the route choice. Again using UC Berkeley undergraduate students as subjects, we further investigated the tradeoffs students make and found that their subjects were consistently willing to pay $0.15 per pound of greenhouse gas emissions across decisions such as which car to buy, which mode to use, and which route to take [10]. While we found systematic heterogeneity in that females have a higher value of green, we also found that a statistically superior model included a continuous distribution of willingness to pay for emissions reduction within the sample, as is shown in Figure 2. Because these distributions are log-normal, all subjects have a positive value of green, but the shape of the distribution in the mode choice experiment in particular indicates that there is a substantial proportion of the sample with near-zero willingness to pay for emissions reductions.
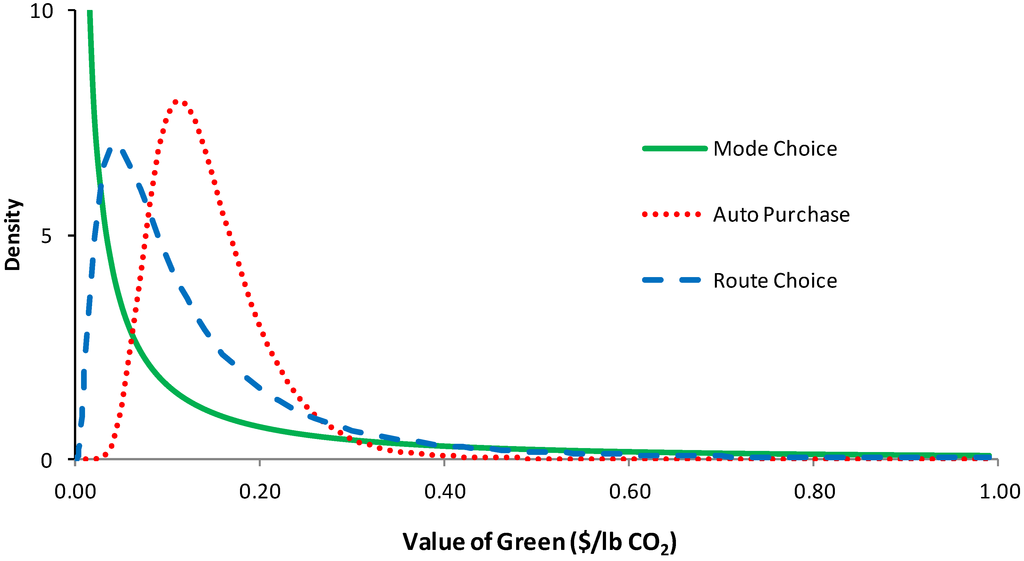
Figure 2.
Distribution of the marginal rate of substitution between cost and emissions [10].
Building on this previous work, the objectives of this paper are twofold. First to investigate the value of green using revealed preference data, whereas the previous work uses only stated preference data. Second to further explore the heterogeneity of the value of green in the population, in particular the hypothesis that there may be a segment of the population that places zero value on green and will not change their transport behavior to reduce CO2 emissions.
3. Survey and Experiment Design
While a primary objective of this work was to estimate the value of green based on a revealed preference dataset, the classic issue in revealed preference mode choice data of time and cost being highly correlated is amplified in the value of green setting where CO2 is highly (and sometimes perfectly) correlated with time and/or cost. Therefore, we designed and conducted a mode choice experiment in which we collected both stated and revealed mode choice decisions from our subjects.
The survey was conducted all online and via email and each subject participated in the experiment for two weeks. There were four parts to the survey: a stated preference questionnaire inquiring about mode choices for hypothetical trips, a set of survey questions related to their household characteristics and transportation profiles including common trips, delivery to the subjects of modal alternatives and their attributes for the subject’s reported common trips, and a two-week travel diary to report revealed preferences on these common trips.
Subjects were first sent a link to an online survey that included both the stated preference questions and the questions regarding the household characteristics and transportation profile. In the stated preference portion, each subject was asked 5 hypothetical mode choice questions for 5 different trip purposes: to buy something small at a grocery store, to drop off a document at an office, to go to lunch, to buy a shirt, and to meet friends for coffee. An example survey question is shown in Figure 3. The available travel modes for these trips were walking, biking, driving, walking to a bus stop and taking a bus, walking to a train station and riding the Bay Area Rapid Transit (BART), and biking to a train station and riding BART. Each mode was described by access time, travel time, transfer time, cost, calories, and emissions. While the main benefit of stated preference experiments is that correlation between attributes, such as time and cost, can be eliminated, we chose to base our stated preference experiment on a more realistic set of alternatives and thus retained correlation between the attributes. This decision was based on feedback we got from our previous experiments that the alternatives we presented were too unrealistic. We based the hypothetical choices on estimated attributes of five actual trips in the San Francisco Bay Area.
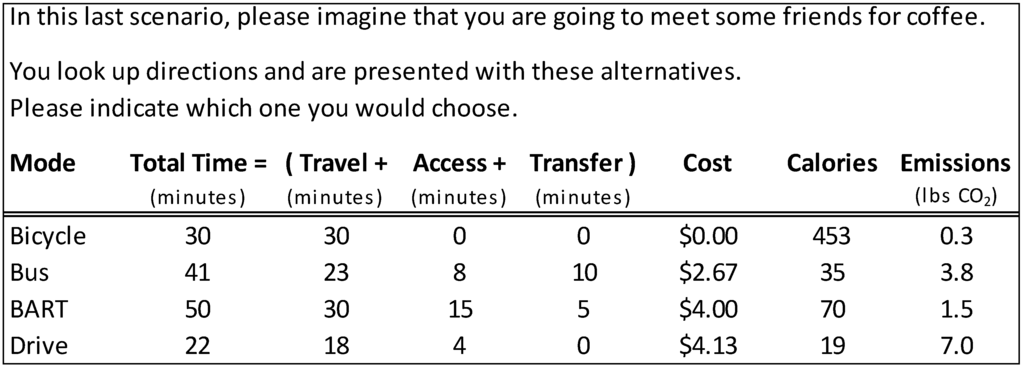
Figure 3.
Stated preference mode choice.
The trip times and distances were estimated with Google Maps for each mode. Emissions, costs, and calories were then calculated based on travel mode and distance traveled. For the car alternative, we assume single occupancy and fuel economy of an average vehicle (20 miles per gallon) to calculate emissions and fuel costs [11]. Marginal costs and emissions were used for driving because our focus group felt that lifecycle calculations unfairly punished people who drive very little with very high per-mile emissions. For transit alternatives, we assume average occupancy with each rider sharing responsibility for the emissions associated with propulsion of the transit vehicle, and we use the estimates of Chester and Horvath [12]. For BART trips the greenhouse gas emissions associated with active vehicle operations are 39 grams per passenger kilometer traveled, and for bus trips they are 166 grams per passenger kilometer traveled. Transit costs were based on actual fares. We assumed average body size and physical intensity of walking and biking. An average person will burn 100 calories per mile walked [13] and 50 calories per mile biked [14]. The marginal emissions associated with biking and walking are a result of the additional food a person will consume to replenish the calories burned. There are approximately 1.7 pounds of CO2 associated with each 500 calories of a balanced diet [15].
The first estimate of these attributes had perfect correlation between attributes such as cost and emissions of driving because both are a linear function of the amount of fuel burned. We decreased the correlation by adjusting each attribute according to an orthogonal design of 125 choice sets divided into five blocks for the five trip types. This design included five levels for each attribute: 0.5, 0.7, 1, 1.5 or 2. The original estimates of the trip attributes were then multiplied by these levels to create 25 choice sets for each trip purpose. Each participant was randomly presented with one choice set for each of the five trip purposes, where each choice set was presented approximately the same number of times.
After the five stated preference mode decisions, the subjects answered a series of questions regarding their household characteristics and transportation profiles, including demographics, car ownership and type, car-share membership, bicycle ownership and operability, and transit pass availability. The subjects also outlined three of their common trips, providing information such as origin, destination, typical mode, time of day, and physical and schedule constraints. In particular, they were asked to provide details for their commute, their trip to their most-visited grocery store, and a common social trip. They were prompted to provide details for these particular trips in order for us to observe the greatest number of mode decisions during the two week experiment. Lastly, the subjects entered their e-mail address in order to participate in the last part of the experiment.
The next stage of the experiment was to report to the subjects the available modes and their attributes for the common trips that each subject reported. Using Google Maps, we estimated the time and distance traveled for of the feasible and available alternatives for each of these trips and e-mailed these choice sets to the subjects. As with the stated preference choice sets, the attributes included access time, travel time, transfer time, cost, calories, and emissions. The specifics of the choice set were tailored to the specific situation of the subject. The only modes included in these choice sets were those that were both available to the subject and reasonably competitive with modes typically used. The calculations for transit emissions varied depending on whether the subject believed (as stated in response to a survey question) that a rider should be responsible for emissions based on vehicle ridership, based on the average of the entire transit system, or not at all. The shares of subjects with these beliefs are approximately 20%, 40%, and 40% respectively. This strategy of presenting transit emissions is different from the stated preference experiment because of our knowledge of each individual’s belief about which method of emissions accounting is appropriate. The cost of transit was calculated based on the services used while controlling for the type of transit pass held by the subject. Tailpipe emissions as well as monetary costs for private vehicles were calculated based on the EPA estimated fuel economy of the subject’s actual vehicle and occupancy for the trip [16]. As in the stated preference experiment, calories burned were calculated using distance biked or walked and associated emissions were then estimated based on the calories burned. An example of the choice sets for the actual trips is displayed in Figure 4.
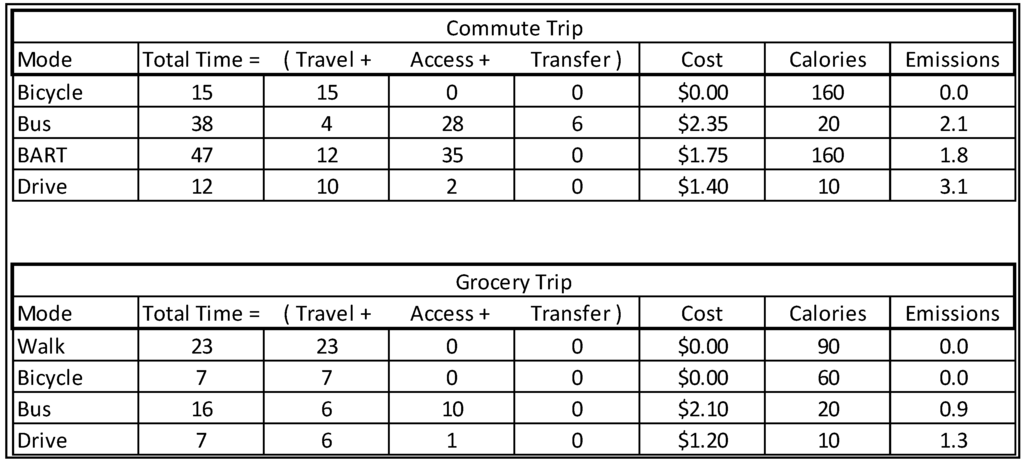
Figure 4.
Choice sets for revealed preferences using subjects’ origins, destinations, and mode availabilities.
After participants were sent the attributes of the feasible alternatives for their personal trips, they were asked via e-mail on a daily basis about their mode decisions for these trips for two weeks in order to collect revealed preference data. This open interaction also provided a way for subjects to provide corrections regarding their choice sets or more details about their choices such as the inconvenience of needing correct change for the bus.
4. Subjects
The subjects for this experiment were residents of the San Francisco bay area who made regular trips for which they had more than one feasible alternative. One-hundred twenty-two subjects were recruited through a variation of a snowball sampling technique; the authors asked their colleagues to ask a few of their colleagues to participate. It is possible that some of the subjects were familiar with the type of research done by the authors thereby inducing some bias in the results, but this sampling strategy was chosen because of the exploratory nature of this study.
Although not representative of the San Francisco Bay area, this sample provides us with insight into the decisions of people outside of the UC Berkeley community. Forty-eight percent of our subjects are male. Thirty-four percent are UC Berkeley graduate students, 13 percent are UC Berkeley faculty and staff, and the remainder are employed elsewhere. The non-students in our sample have a median annual income between $50,000 and $75,000. Seven percent of the sample have children living in their household. Sixty-nine percent have a bicycle to use that is in operable condition, and 83% have access to a vehicle.
Our 122 subjects collectively made 603 stated preference mode decisions, and the 46 who completed the experiment collectively made 583 revealed preference mode decisions.
5. Model Specification and Results
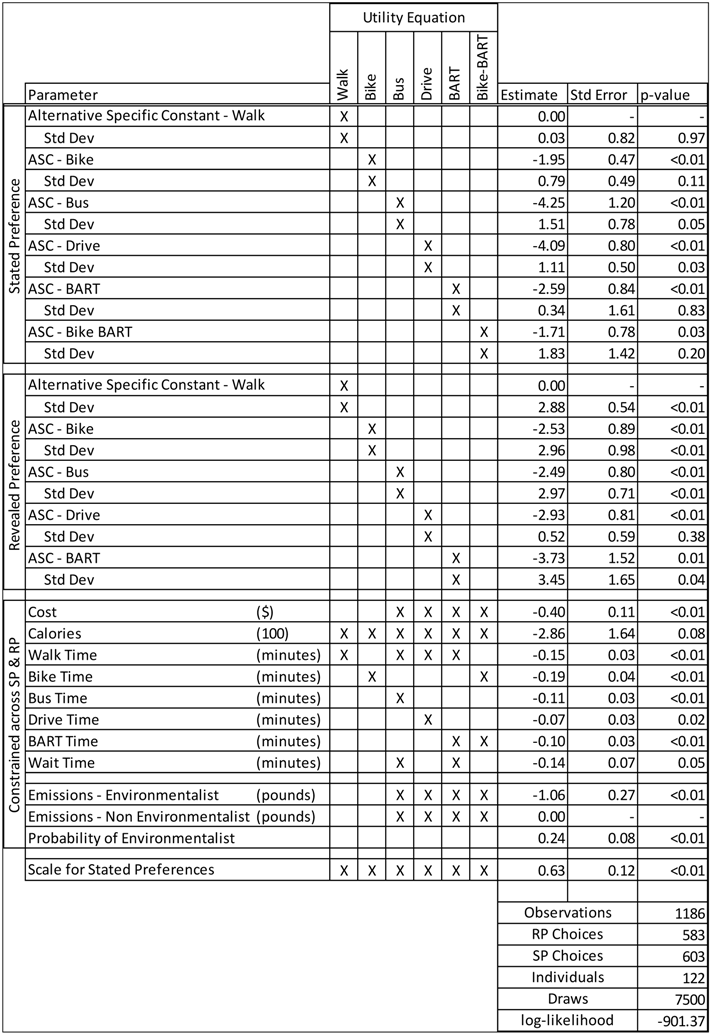
Using the data as described above, we estimated a mode choice model from the combined dataset that included both the stated and revealed preferences from all subjects. We explored many model structures, including different specifications for the systematic utility, for the imposed constraints across the RP and SP models, and for the error structure, including the specification of the heterogeneity of the value of green. The final estimation results are shown in Table 1. First we will describe and motivate the model specification and likelihood function, and then we will discuss the estimation results.
The systematic utility includes alternative specific constants (ASC) and the cost, time, and calories of the alternatives, where each enters the utility function linearly. There were very few subjects who chose to utilize the combination of biking to BART in their actual trips, and therefore it was eliminated from the available modes in the revealed preference dataset. The time parameters are specified to be separate for each mode of travel and entered the utility equations for each leg of the trip rather than only for the primary mode of the trip. For example, time spent walking to a destination and time spent walking to access a car, bus stop, or train station are both included as walk time.
As a major objective of this work was to explore the heterogeneity of value of green, many different specifications were explored for the emissions parameters. These included both the systematic heterogeneity and continuous random distributions (for example, lognormal as in Figure 2) of our previous work as well as new specifications based on discrete mixtures. The discrete mixture is a form of latent class choice model in which there are different distinct segments of the population, each of which has a different value they place on emissions (i.e., a different emissions parameter). This specification is appealing because it is able to capture our hypothesized segment that does not place any value on emissions (i.e., has a $0 value of green). For each segment of the population (i.e., each class), an emissions parameter is estimated specific to the class, and a proportion parameter is estimated that represents the percent of the population that belongs to the class (i.e., a naïve class membership model). Based on our hypothesis of the 0 value of green group, we fixed the parameter on emissions to be equal to 0 for one of the classes. In estimating such a model, the number of classes is determined by estimating models with different numbers of classes and then using measures of fit such as the AIC to determine the best model [17]. Based on this exploration of systematic, continuous random (lognormal) and discrete mixtures, we found that the discrete mixture with 2 classes fit the data significantly better than all other specifications. The estimation results in the Table 1 report the resulting 2 emissions parameters (one for each class, one of which is fixed to 0) and the probability of belonging to the first class. We call the class whose decisions indicate a desire to reduce emissions “environmentalists.” The emissions parameter for non-environmentalists is fixed at zero.
While the latent class model to capture heterogeneity in the value of green introduces a discrete mixture to the specification, we also include a continuous mixture to capture correlation across utility errors from a single individual. Conceptually, this captures the fact that while some people might view walking or biking as enjoyable activities for reasons other than those presented as attributes, other people generally prefer to avoid these options, and likewise for the transit alternatives or driving. This is introduced by specifying the alternative specific constants (ASC) with normal distributions, and estimating the means and standard deviations of these distributions. The mean is the ASC that is estimated in a logit model. The standard deviations of the distribution are reported just after each ASC. The value is held constant across responses from the same individual to build in correlation across their multiple responses.
The final wrinkles in the model have to do with the combination of the RP and SP data. First, some parameters are constrained to be the same across the RP and SP and some are not. In this case the mean and standard deviations of the ASC distribution are allowed to be different across the RP and SP. In contrast, the parameters associated with the attributes (time, cost, calories, and emissions) are constrained to be the same across the RP and SP. The model also included a scale parameter to allow the variance of the unobserved variables term to be estimated for stated preferences relative to the normalized revealed preferences [18].

Table 1.
Joint-estimation results for stated and revealed preferences.
The model was estimated by maximizing the following likelihood function, which reflects the specification described in more general terms above. The model takes the form of a Hybrid Choice Model [19] to capture the random continuous taste heterogeneity included in the alternative specific constants, the random discrete heterogeneity of the value of green, and the joint SP/RP specification.
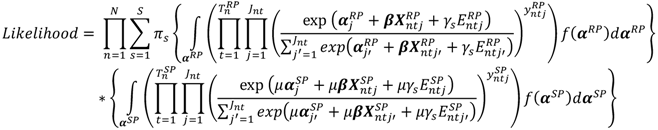
The indicies are n = 1,…,N for individual, j = 1,…,J for alternative, t = 1,…,T for choice instance, s = 1,…,S for class, and an SP/RP designation for choice experiment. The likelihood function has two primary components: the likelihood that an individual chooses the observed set of stated preferences and the likelihood that an individual chooses the observed set of revealed preferences. Both of these likelihoods are conditioned on the individual belonging to a specific class s. yntj (with associated SP/RP designation) is the choice indicator, which is equal to one if person n chose alternative j in choice instance t of the SP/RP experiment and equal to zero otherwise. The product of these two likelihoods is the likelihood that an individual chooses the observed set of stated and revealed preferences, conditioned on the individual belonging to a specific class. To remove the conditionality on s, the conditional likelihoods are marginalized over the probabilities that the individual belongs to different classes (denoted by parameter πs) to obtain the likelihood function for each individual. The likelihood function for the sample population then equals the product of the likelihood function for each individual taken over all individuals n = 1,…,N.
Within the utility specification, the explanatory variables are the scalar Entj for the emissions attribute and the column vector Xntj for all of the other attributes, αj are the alternative specific constants, each of which is independently, normally distributed. f(αRP/SP) are the products of these normal distributions, for which the mean and standard deviation of each are estimated. The SP and RP conditional likelihoods are integrated over this distribution. β is a row vector containing the parameters for all of the attributes except for the environmental variable. γs is the parameter for the emissions variable, which is estimated separately for each class s. Finally, μ is the scale parameter for the SP model (estimated relative to the RP scale which is fixed to 1).
6. Analysis and Findings
The results of the joint model using both the stated and revealed preferences are shown in Table 1.
The first thing to notice is that all parameters have the expected sign; the negative time and cost parameters mean that relatively more expensive and longer duration modes have lower utility and therefore a lower probability of being chosen. Interestingly, the parameter for calories burned is negative, indicating that on average, people want to avoid transportation options that include a physical fitness component. This could also be interpreted as a desire not to be sweaty upon reaching one’s destination because people likely make a connection between burning calories and working out, as was expressed by a subject in one of the daily e-mails.
Beyond checking to make sure that the signs are as expected, the relative magnitudes of the parameters provide further insight into the decisions the subjects make. The standard deviations for the alternative specific constants for the revealed preference modes have larger magnitudes than those for the revealed preference modes. This indicates that unobserved attributes of the modes have a greater influence in the revealed preference than in the stated preference mode decisions. The significant scale term for the stated preferences provides further support for the conclusion that the unobserved attributes are more influential in revealed preferences than in stated preferences. The ratio of two parameters that enter the utility equation linearly is the marginal rate of substitution of one attribute for another, so it is simple to investigate how our sample value one factor relative to another. For example, the value of time spent driving can be found by taking the ratio of the parameter for drive time and the parameter for cost and multiplying by 60 to convert dollars per minute to dollars per hour. As an indicator that our subjects were making reasonable decisions, their estimated value of time ranges from $10.42 per hour driving up to $28.18 per hour biking as can be seen in Table 2 below. Similarly, Björklund and Carlén [20] found that the value of travel time for cycling far exceeds the value of travel time for other modes. These reasonable values of time indicate that the model performs well because these values of time are similar to the subjects’ hourly pay.
Table 2.
Estimated Marginal Rates of Substitution between Time and Cost.

By taking the ratio of the emissions parameter and the cost parameter, we find that our environmentalists, who constitute 24% of our sample, value reducing their greenhouse gas emissions at a rate of $2.68 per pound of carbon dioxide, and the non-environmentalists simply ignore this information when making transportation decisions. This makes intuitive sense in that while everybody cares about saving time and money, the desire to reduce environmental impact is not universal; some people care and some do not. This estimate is substantially higher than the previous estimations, but that is likely because in previous studies a single willingness to pay for emissions reductions was estimated for the entire sample rather than allowing for distinct groups with varying tastes [10], and that our current sample is better educated than previous samples which Achtnicht [6] found is associated with a higher willingness to pay for emissions reductions.
In previous research we found that a random continuous distribution for the value of green explained transportation decisions better than systematic heterogeneity [10]. By specifying a random discrete distribution for the value of green instead, we reanalyze the data from these earlier experiments using the latent class specification described and employed above. These previous datasets include an auto purchase experiment, a route choice experiment, and a mode choice experiment. With all except one of the data sets, we find that the model with two mass points describes the behavior of the subjects better than any other number of mass points, better than a model with random continuous heterogeneity, and better than a model with systematic heterogeneity that controls for trip purpose or demographics. Further, one of the mass points in each dataset is estimated to be at zero dollars per pound of emissions, rather than constrained to zero as in the analysis for the experiment above. Each of the class membership models is naïve, meaning that they include no explanatory variables such as demographics or environmental sentiment. We did not find that including demographics or other explanatory variables improved the fit of the models enough to justify the additional complexity. This is likely due to our small sample size and to the low variation in the education and age of our subjects. Results for models incorporating a random discrete distribution of the value of green are shown in Table 3.
Table 3.
Random discrete distribution of the value of green for previous and current datasets.

The consistent finding that there exists a small group of people whose decisions show that they care a lot about reducing greenhouse gas emissions lends credibility to the results of the experiment presented in this paper. Further, the estimated parameters for the earlier mode choice experiment are remarkably close to the results of the RP/SP model, even though the old experiments had a considerably different design and were collected from undergraduate students rather than the broader demographic sample. Future research will be aimed at using demographics, political affiliation, and environmental sentiment to better explain what influences whether or not someone belongs in this group of people with a strong willingness to pay for reduced emissions as well as investigating whether there exist discrete distributions for other parameters such as the multiplier for calories burned.
7. Conclusions
The topics of sustainability and reducing environmental impacts are frequently discussed everywhere from academic institutions to dinner parties, and information about carbon is being presented to people facing a wide array of decisions. This information, however, remains substantially under-studied. While there have been several investigations into the amount people are willing to pay to reduce their environmental footprint, all known experiments attempting to quantify the value of “green” have relied on participants’ stated preferences in decisions ranging from which car to buy to which route to take. The findings of this research are instead calculated including transportation mode decisions people actually face in their day-to-day lives. Our subjects both made stated preference decisions for which mode they would take for realistic trips and reported their revealed mode choice preferences for a period of two weeks after being presented with information about the feasible alternatives for their specific origins and destinations. In so choosing they made tradeoffs between attributes such as time spent, money spent, calories burned, and greenhouse gasses emitted. After a thorough exploration of the heterogeneity of the value of green, the best models indicate a discrete distribution in which some people do not care about emissions but there exists a small group that cares a lot. Using a mixed logit model we find that 24% of our subjects value reducing their emissions at a rate of $2.68 per pound both in their stated preferences and in their revealed preferences. Through their willingness to take on personal costs for the benefit of the public, this small group shows that they have a big heart. These findings are validated both by the reasonable values of time estimated and by the similar results from reanalyzing data (all stated preferences) from earlier experiments. This consistency represents a crucial step in understanding peoples’ desires and the heterogeneity of the tradeoffs they make when faced with decisions involving personal and societal costs and benefits. These findings contribute to the existing literature by estimating the proportion of the sample that has a desire to reduce emissions and by quantifying how much they care in their revealed preferences.
Acknowledgments
The authors of this paper would like to acknowledge the Qualtrics staff for their help creating the survey, Akshay Vij for technical support and Matlab code, and the National Science Foundation and the University of California Transportation Center for their generous funding.
The choice sets were designed using SAS. The RP/SP joint estimation model was estimated using Biogeme [21], and the models for reanalyzing datasets from previous experiments were estimated using code provided by Akshay Vij using the EM algorithm [22].
Conflict of Interest
The authors declare no conflict of interest.
References
- Dubner, S.J.; Levitt, S.D. Not-So-Free Ride. The New York Times. April 2008. Available online: http://www.nytimes.com/2008/04/20/magazine/20wwln-freakonomics-t.html?_r=1&scp=1&sq=the+not+so+free+ride&st=nyt (accessed on 19 January 2013).
- Flyvbjerg, B.; Holm, M.K.S.; Buhl, S.L. How (in)accurate are demand forecasts in public works projects? The case of transportation. J. Am. Plan. Assoc. 2005, 71, 131–146. [Google Scholar] [CrossRef]
- Bay Area Rapid Transit. Available online: http://bart.gov (accessed on 19 January 2013).
- Mackie, P.J.; Wadman, M.; Fowkes, A.S.; Whelan, G.; Nellthorp, J.; Bates, J. Values of Travel Time Savings UK; Working Paper 567; Institute of Transport Studies, University of Leeds: Leeds, UK, 2003. [Google Scholar]
- Bunch, D.S.; Bradley, M.; Golob, T.F.; Kitamura, R.; Occhiuzzo, G.P. Demand for clean-fuel vehicles in california: A discrete-choice stated preference pilot project. Transp. Res. A 1993, 27, 237–253. [Google Scholar]
- Achtnicht, M. German Car Buyers’ Willingness to Pay to Reduce Co2 Emissions; Center for European Economic Research Discussion Paper No. 09-058; ZEW: Mannheim, Germany, 2009. [Google Scholar]
- Daziano, R.A.; Bolduc, D. Incorporating pro-environmental preferences towards green automobile technologies through a bayesian hybrid choice model. Transportmetrica 2011, 9, 1–33. [Google Scholar]
- Martin, E.W. New vehicle choice, fuel economy and vehicle incentives: An analysis of hybrid tax credits and the gasoline tax. Ph.D. Dissertation, University of California, Berkeley, CA, USA, 2009. [Google Scholar]
- Gaker, D.; Zheng, Y.; Walker, J.L. Experimental economics in transportation: Focus on social influences and provision of information. Transp. Res. Record 2010, 2156, 47–55. [Google Scholar]
- Gaker, D.; Vautin, D.; Vij, A.; Walker, J.L. The power and value of green in promoting sustainable transport behavior. Environ. Res. Lett. 2011, 6, 1–10. [Google Scholar]
- Staniford, S. US Fleet Fuel Economy. Early Warning: Rational Analysis of Global Civilization Risk. 2011. Available online: http://earlywarn.blogspot.com/2011/05/us-fleet-fuel-economy.html (accessed on 24 May 2013).
- Chester, M.V.; Horvath, A. Environmental assessment of passenger transportation should include infrastructure and supply chains. Environ. Res. Lett. 2008, 4, 1–8. [Google Scholar]
- Ford, W. Calories Burned per Mile. Available online: http://www.funonfoot.fileburst.com/Article1002Calories.pdf (accessed on 24 May 2013).
- Schwartz, J. Calories Burned Biking One Mile. Available online: www.livestrong.com/article/135430-calories-burned-biking-one-mile/ (accessed on 24 May 2013).
- The.CO2List.org. Available online: http://www.co2list.org/files/carbon.htm (accessed on 19 January 2013).
- EPA. Available online: http://www.fueleconomy.gov (accessed on 19 January 2013).
- Akaike, H. A new look at the statistical model identification. IEEE Trans. Autom. Control 1974, 19, 716–723. [Google Scholar] [CrossRef]
- Ben-Akiva, M.; Morikawa, T. Estimation of switching models from revealed preferences and stated intentions. Transp. Res. A 1990, 24, 485–495. [Google Scholar] [CrossRef]
- Ben-Akiva, M.; McFadden, D.; Train, T.; Walker, J.; Bhat, C.; Bierlaire, M.; Bolduc, D.; Boersch-Supan, A.; Brownstone, D.; Bunch, D.; et al. Hybrid choice models: Progress and challenges. Market. Lett. 2002, 13, 163–175. [Google Scholar]
- Björklund, G.; Carlén, B. Valuation of Travel Time Savings in Bicycle Trips; Swedish National Road and Transport Research Institute: Linköping, Sweden, 2012. [Google Scholar]
- Bierlaire, M. BA: A Free Package for the Estimation of Discrete Choice Models. In Proceedings of the 3rd Swiss Transportation Research Conference, Ascona, Switzerland, March 2003.
- Dempster, A.P.; Laird, N.M.; Rubin, D.B. Maximum likelihood from incomplete data via the EM algorithm. J. R. Stat. Soc. 1977, 39, 1–38. [Google Scholar]
© 2013 by the authors; licensee MDPI, Basel, Switzerland. This article is an open access article distributed under the terms and conditions of the Creative Commons Attribution license (http://creativecommons.org/licenses/by/3.0/).