2.1. Hybrid Evaluation
Results demonstrated that there were significant differences for phenomorphological traits and ear characteristics measured across 15 hybrids developed in the half-diallel mating design. The following sources of variation were significant (
p ≤ 0.05) for all traits: environment, density, hybrid, and hybrid-by-environment interaction (
Table 1). In addition, significant environment-by-density effects existed for yield, ear height, wet weight, dry weight, ear length, ears ha
−1 and moisture. Hybrid-by-density interaction was significant for all traits except for kernel size. All traits with significant hybrid effects and equal variances were further analyzed for combing ability, with significant GCA effects found in all traits, and significant SCA effects found in all cases except tiller number (
Table 1). Spearman rank correlations indicated that traits could be pooled across all environments, with the exception of yield, dry weight, ear length, kernel depth and ears ha
−1.
Averaged across all environments (2010 and 2011 growing seasons in West Madison and Arlington, Wisconsin) the least square mean estimates for plant height ranged from the shortest hybrid, P51 × P39, at 207.4 cm, to the tallest hybrid, Ia5125 × C68, at 267.9 cm (
Table 2). Ear height was lowest on P39 × IL101t at 71.1 cm, and highest on Ia5125 × C68 at 116.0 cm. Ia5125 × C68 had only 0.5 tillers plant
−1, while P39 × IL101t had 2.8 tillers plant
−1. The hybrid with the lightest wet weight ear
−1 was P51 × P39 at 126.5 g, and the heaviest was C68 × C40 at 247.7 g. The narrowest ears were found on P51 × P39 at 33.8 mm, and the widest ears were from Ia5125 × C68 at 42.4 mm. At harvest, IL101t × Ia5125 dried down to 45% moisture, and C68 × C40 retained the most water at 59% moisture. These same two hybrids were the earliest and latest maturing, respectively, across the 2010 and 2011 West Madison, WI environments (data not shown).
For the traits that could not be pooled across all environments, most were analyzed separately between 2010 and 2011, while pooling the locations within years. In both the 2010 and 2011 environments, P51 × P39 had the lowest yields at 0.86 and 2.41 metric tons ha
−1, respectively (
Table 3). Ia5125 × C68 had the highest yields at 2.36 and 3.32 metric tons ha
−1, respectively. P51 × P39 had the lightest dry weights ear
−1 in the 2010 and 2011 environments, respectively, at 39.6 and 84.8 g. C68 × IL101t had the heaviest dry weight ear
−1 (96.1 g) in the 2010 Arlington and West Madison environments, and Ia5125 × C40 had the heaviest dry weight ear
−1 (122.8 g) in the 2011 Arlington and West Madison environments. For ear length, the shortest ears in both years were found on P51 × P39 at 11.6 cm in 2010 and 14.0 cm in 2011. The longest ears in both years were from hybrid IL101t × C40 at 15.5 cm in 2010 and 16.8 cm in 2011. P51 × P39 had the most shallow kernels in both years, at 4.4 mm in 2010 and 5.8 mm in 2011. In the 2010 Arlington and West Madison environments, Ia5125 × C68 had the largest kernel depth at 7.2 mm. In the 2011 Arlington and West Madison environments, IL101t × Ia5125 had the largest kernel depth at 7.7 mm.
Table 1.
Significance of mean squares from analysis of variance for agronomic traits of 15 hybrids from a six line half-diallel measured in Arlington, WI and West Madison, WI in 2010 and 2011.
Table 1.
Significance of mean squares from analysis of variance for agronomic traits of 15 hybrids from a six line half-diallel measured in Arlington, WI and West Madison, WI in 2010 and 2011.
| | | Source of variation |
|---|
| Trait | Environment | Density | Environment × Density | Hybrid | GCA | SCA | Hybrid × Environment | Hybrid × Density |
|---|
| Yield | *** | ** | *** | *** | *** | *** | *** | *** |
| Plant height | *** | ** | ns | *** | *** | *** | *** | *** |
| Ear height | *** | ** | * | *** | *** | *** | *** | ** |
| Tiller number | ** | *** | ns | *** | *** | ns | ** | * |
| Wet weight | *** | *** | *** | *** | *** | *** | *** | *** |
| Dry weight | *** | *** | ** | *** | *** | *** | *** | *** |
| Ear length | *** | *** | ** | *** | *** | *** | *** | *** |
| Ear width | *** | *** | ns | *** | *** | *** | *** | *** |
| Kernel depth | *** | *** | ns | *** | *** | *** | *** | ns |
| Moisture | *** | * | ** | *** | nc | nc | *** | *** |
| Ears ha−1† | *** | *** | ** | ** | nc | nc | *** | *** |
| Tip blanking† | *** | *** | ns | *** | nc | nc | *** | *** |
Table 2.
Least square means for agronomic traits of 15 hybrids from a six line half-diallel measured in Arlington, WI and West Madison, WI in 2010 and 2011.
Table 2.
Least square means for agronomic traits of 15 hybrids from a six line half-diallel measured in Arlington, WI and West Madison, WI in 2010 and 2011.
| Hybrid | Plant height (cm) | Ear height (cm) | Tiller # | Wet weight (g) | Ear width (mm) | Moisture (%) |
|---|
| C40 × P39 | 224.33 | 90.30 | 2.61 | 212.54 | 37.92 | 53.04 |
| C40 × P51 | 219.41 | 89.82 | 2.40 | 191.54 | 36.06 | 55.68 |
| C68 × C40 | 251.68 | 108.51 | 1.56 | 247.71 | 39.44 | 58.92 |
| C68 × IL101t | 249.54 | 94.75 | 1.68 | 245.75 | 39.58 | 57.18 |
| C68 × P51 | 250.80 | 101.66 | 1.56 | 218.46 | 38.02 | 57.21 |
| Ia5125 × C40 | 246.48 | 106.83 | 1.39 | 234.32 | 41.52 | 53.26 |
| Ia5125 × C68 | 267.86 | 115.99 | 0.50 | 243.33 | 42.40 | 56.20 |
| Ia5125 × P51 | 234.50 | 99.21 | 1.25 | 187.67 | 39.90 | 49.30 |
| IL101t × Ia5125 | 231.67 | 86.46 | 1.39 | 170.17 | 39.52 | 45.11 |
| IL101t × C40 | 218.25 | 80.17 | 2.49 | 213.58 | 36.16 | 55.63 |
| P39 × C68 | 242.01 | 97.35 | 1.78 | 212.12 | 38.29 | 56.98 |
| P39 × Ia5125 | 225.80 | 94.29 | 1.48 | 165.29 | 38.98 | 48.44 |
| P39 × IL101t | 211.99 | 71.08 | 2.80 | 149.87 | 36.02 | 48.35 |
| P51 × IL101t | 212.50 | 75.31 | 2.63 | 164.29 | 36.13 | 49.21 |
| P51 × P39 | 207.40 | 82.82 | 2.63 | 126.54 | 33.79 | 49.07 |
| CV | 0.03 | 0.06 | 0.27 | 0.11 | 0.03 | 0.06 |
| LSD (0.05) | 6.33 | 4.65 | 0.27 | 38.77 | 1.56 | 5.81 |
Table 3.
Least square means for agronomic traits of 15 hybrids from a six line half-diallel, averaged across specified years in Arlington, WI and West Madison, WI.
Table 3.
Least square means for agronomic traits of 15 hybrids from a six line half-diallel, averaged across specified years in Arlington, WI and West Madison, WI.
| | Yield (metric tons ha−1) | Dry weight (g) | Ear length (cm) | Kernel size (mm) |
|---|
| Hybrid | 2010 | 2011 | 2010 | 2011 | 2010 | 2011 | 2010 | 2011 |
|---|
| C40 × P39 | 1.90 | 2.70 | 87.25 | 109.17 | 13.67 | 16.18 | 6.71 | 6.63 |
| C40 × P51 | 1.78 | 2.78 | 69.42 | 99.33 | 13.67 | 15.19 | 6.21 | 6.08 |
| C68 × C40 | 2.15 | 3.26 | 89.00 | 115.58 | 13.96 | 15.45 | 6.67 | 6.77 |
| C68 × IL101t | 2.18 | 3.21 | 96.08 | 114.58 | 14.17 | 14.74 | 7.15 | 7.48 |
| C68 × P51 | 2.13 | 2.79 | 87.00 | 99.75 | 13.50 | 14.49 | 6.58 | 6.02 |
| Ia5125 × C40 | 2.29 | 3.11 | 93.42 | 122.75 | 14.16 | 15.49 | 7.05 | 7.49 |
| Ia5125 × C68 | 2.36 | 3.32 | 93.25 | 120.12 | 13.25 | 14.78 | 7.21 | 7.49 |
| Ia5125 × P51 | 1.90 | 3.31 | 64.42 | 114.50 | 13.53 | 14.76 | 5.65 | 7.27 |
| IL101t × Ia5125 | 1.32 | 2.91 | 57.50 | 117.17 | 13.22 | 14.90 | 6.00 | 7.71 |
| IL101t × C40 | 1.90 | 2.75 | 80.11 | 107.58 | 15.51 | 16.75 | 6.47 | 6.71 |
| P39 × C68 | 2.13 | 2.58 | 83.08 | 99.08 | 13.67 | 14.94 | 6.25 | 6.29 |
| P39 × Ia5125 | 0.99 | 2.88 | 50.50 | 109.00 | 12.62 | 14.80 | 5.17 | 7.19 |
| P39 × IL101t | 1.17 | 2.70 | 50.08 | 97.67 | 13.75 | 15.03 | 4.85 | 6.44 |
| P51 × IL101t | 1.67 | 2.93 | 63.67 | 98.42 | 13.89 | 14.92 | 5.81 | 6.46 |
| P51 × P39 | 0.86 | 2.41 | 39.58 | 84.83 | 11.63 | 14.00 | 4.38 | 5.83 |
| CV | 0.19 | 0.15 | 0.13 | 0.09 | 0.07 | 0.04 | 0.10 | 0.08 |
| LSD (0.05) | 0.27 | 0.48 | 12.45 | 9.97 | 1.07 | 0.52 | 0.48 | 0.45 |
Pearson correlation coefficients were generated for agronomic traits of interest from the means of the fifteen hybrids, pooled across all environments. Yield was found to be highly correlated (
p ≤ 0.001) with plant height (r = 0.83), and was also positively correlated with ear width (r = 0.74), moisture (r = 0.68), and total ears ha
−1 (r = 0.64) (
Table 4). Yield was negatively correlated with tiller number (r = −0.60). Plant height was highly correlated with ear width (r = 0.85), correlated with moisture (r = 0.59), and negatively correlated with tiller number (r = −0.86). Tiller number was also negatively correlated with ear width (r = −0.90). Finally, ear length was positively correlated with tip blanking (r = 0.56).
GCA and SCA effects were analyzed for selected traits across all environments and all densities, as well as separately for each density. Data from analysis at the highest density is reported here. C68 had the largest GCA at the highest density for the following traits: plant height (21.7 cm), ear height (12.3 cm), wet weight (35.7 g), and dry weight (8.1 g) (
Table 5). Both C68 and C40 had the largest GCA at the highest density for yield (0.3 metric tons ha
−1). C40 also had the largest GCA for ear length (0.9 cm). Ia5125 had the largest negative GCA for tiller number (−0.8) at the highest density, as well as the widest ears (2.1 mm) and deepest kernels (0.4 mm). P39 had the greatest negative GCA at the highest density for yield (−0.5 metric tons ha
−1), plant height (−15.5 cm), wet weight (−23.2 g), dry weight (−7.7 g), ear width (−1.4 mm) and kernel depth (−0.7 mm). P39 also had the highest GCA for tiller number (0.5). Analysis of SCA showed few hybrids with significant effects, either averaged across all densities or separately at each density. The predictability of determining progeny performance using GCA ranged from 0.90 to 1.00, based on the ratio of 2MS
GCA to 2MS
GCA + MS
SCA [
25]. Ear length had the lowest predictability at 0.90, while ear height had the highest predictability at 1.00 (
Table 6).
Table 4.
Pearson correlation coefficients for selected agronomic traits from the means of 15 hybrids from a six line half-diallel measured in Arlington, WI and West Madison, WI in 2010 and 2011.
Table 4.
Pearson correlation coefficients for selected agronomic traits from the means of 15 hybrids from a six line half-diallel measured in Arlington, WI and West Madison, WI in 2010 and 2011.
| Trait | Ears ha−1 | Moisture | Plant height | Tiller number | Ear length | Ear width | Tip blanking |
|---|
| Yield | 0.64* | 0.68** | 0.83*** | −0.60* | ns | 0.74** | ns |
| Ears ha−1 | | ns | ns | ns | ns | ns | ns |
| Moisture | | | 0.59* | ns | ns | ns | ns |
| Plant height | | | | −0.86*** | ns | 0.85*** | ns |
| Tiller number | | | | | ns | −0.90*** | ns |
| Ear length | | | | | | ns | 0.56* |
| Ear width | | | | | | | ns |
Table 5.
General combining abilities for agronomic traits of 15 hybrids from a six line half-diallel measured at the highest density in Arlington, WI and West Madison, WI in 2010 and 2011.
Table 5.
General combining abilities for agronomic traits of 15 hybrids from a six line half-diallel measured at the highest density in Arlington, WI and West Madison, WI in 2010 and 2011.
| Inbred | Yield (metric tons ha−1) | Plant height (cm) | Ear height (cm) | Tiller # | Wet weight (g) | Dry weight (g) | Ear length (cm) | Ear width (mm) | Kernel depth (mm) |
|---|
| C40 | 0.3 | ns | ns | ns | 22.6 | 8.0 | 0.9 | ns | 0.3 |
| C68 | 0.3 | 21.7 | 12.3 | −0.5 | 35.7 | 8.1 | ns | 1.6 | 0.3 |
| Ia5125 | ns | 14.8 | 12.1 | −0.8 | ns | ns | −0.5 | 2.1 | 0.4 |
| IL101t | ns | −9.0 | −14.5 | 0.3 | −19.1 | −6.2 | ns | −1.1 | ns |
| P39 | −0.5 | −15.5 | −7.8 | 0.5 | −23.2 | −7.7 | ns | −1.4 | −0.7 |
| P51 | ns | −9.6 | −4.9 | ns | −12.8 | ns | ns | −1.3 | −0.4 |
| LSD (0.05) | 0.2 | 4.9 | 3.7 | 0.3 | 11.4 | 5.1 | 0.5 | 0.7 | 0.3 |
Table 6.
Predictability of GCA for agronomic traits measured on 15 hybrids from a six line half-diallel in Arlington, WI and West Madison, WI in 2010 and 2011.
Table 6.
Predictability of GCA for agronomic traits measured on 15 hybrids from a six line half-diallel in Arlington, WI and West Madison, WI in 2010 and 2011.
| Trait | Mean squares: GCA | Mean squares: SCA | Predictability† |
|---|
| Yield | 1.04 | 0.12 | 0.96 |
| Plant height | 3450.31 | 64.00 | 0.99 |
| Ear height | 1739.41 | 12.47 | 1.00 |
| Tiller number | 5.07 | 0.01 | 0.99 |
| Wet weight | 14365.02 | 856.37 | 0.97 |
| Dry weight | 1572.82 | 174.07 | 0.95 |
| Ear length | 4.54 | 0.95 | 0.90 |
| Ear width | 55.15 | 2.96 | 0.97 |
| Kernel depth | 3.59 | 0.38 | 0.95 |
2.1. General Discussion
Similar to prior research, this experiment found that morphological traits and ear characteristics are affected by crop density [
13,
22,
26]. Averaged across all hybrids, plant height and ear height increased with higher densities, while tiller number decreased (
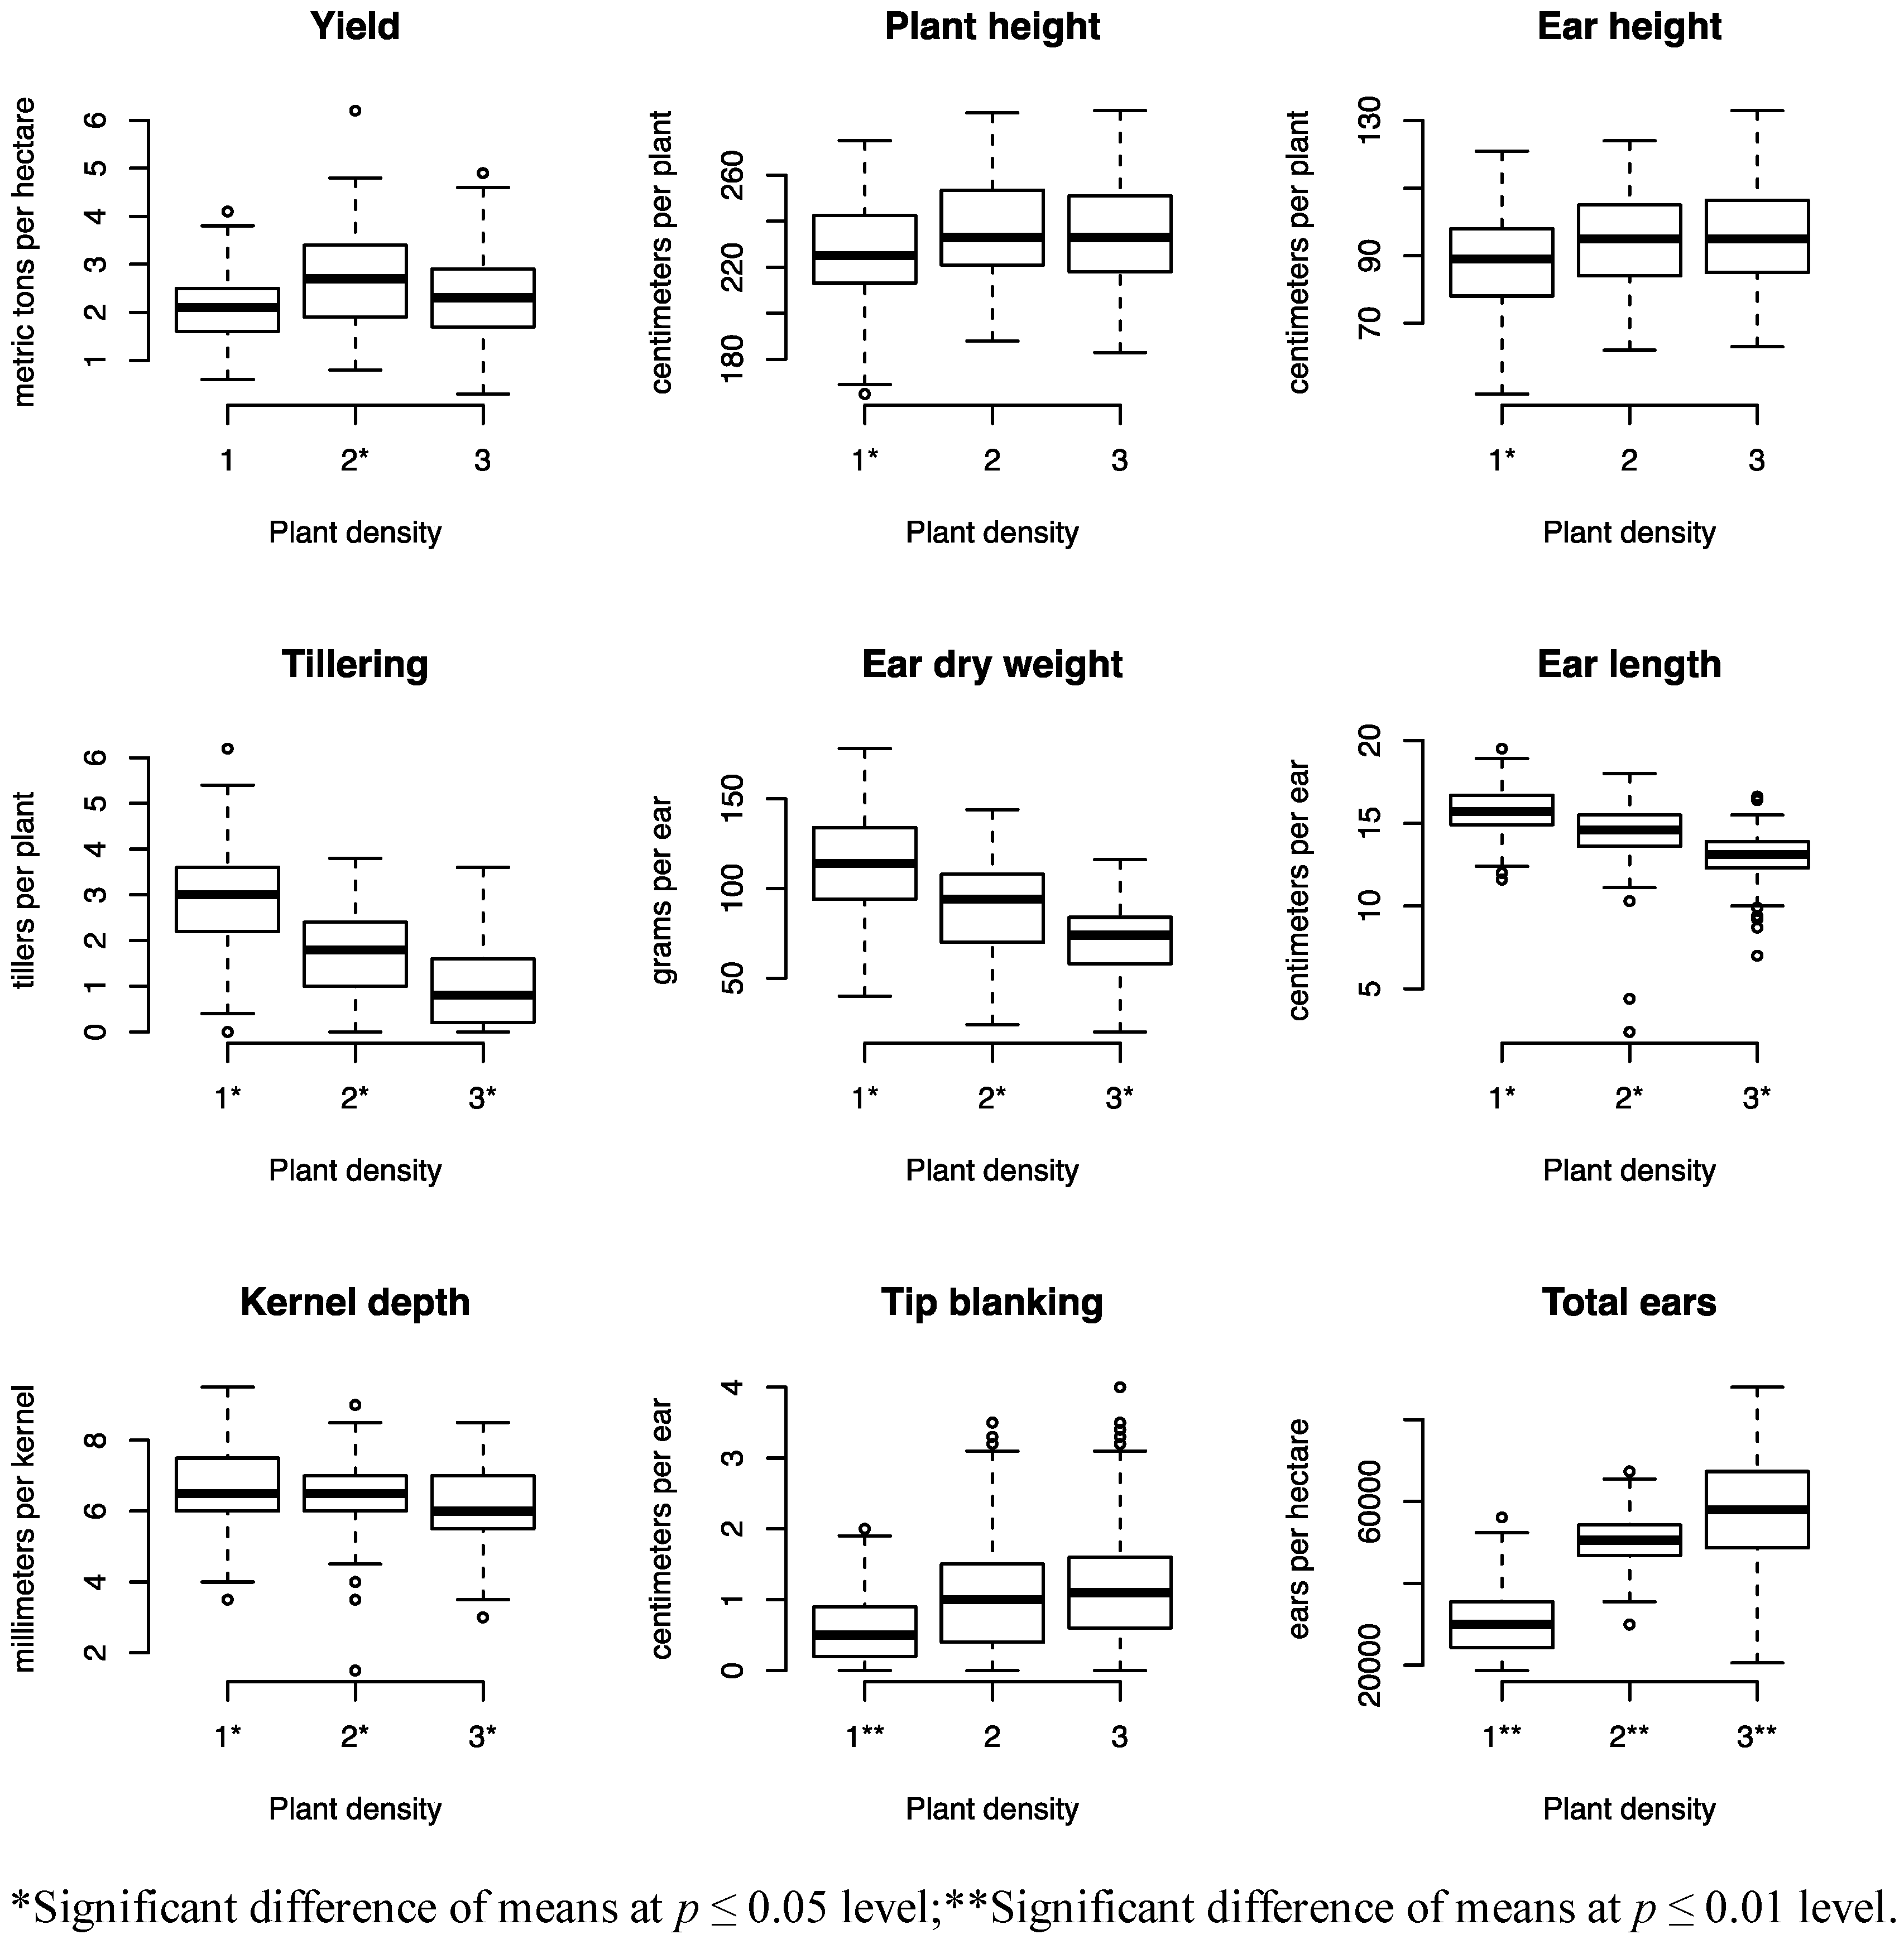
Figure 1). As expected, ear weight, ear length, and kernel depth decreased at higher densities, while tip blanking increased. Interestingly, although the total ears per hectare increased as the density increased, the overall yield, measured in metric tons per hectare and adjusted to 15.5% moisture, was highest at the mid density. These results suggest the importance of identifying inbred lines and hybrid combinations that maintain ear size at higher density plantings.
Figure 1.
Box and whisker plots for agronomic traits of 15 hybrids from a six line half-diallel measured in Arlington, WI and West Madison, WI in 2010 and 2011 at three plant densities (1 = 29,936 plants ha−1, 2 = 63,615 plants ha−1, 3 = 97,293 plants ha−1). The box depicts the middle 50% of the data and the solid line within the box indicates the median. The whiskers extend to 1.5 times the interquartile range, and the open circles are data values beyond this range.
Temperature and rainfall patterns may explain some of the genotype by environment rank change interactions observed in yield, dry weight, ear length and kernel depth responses. Year 2010 was wetter compared to 2011, with rainfall amounts throughout the entire growing season in 2010 almost double those of 2011. Temperature was less variable, although cumulative growing degree days were consistently higher in West Madison, WI compared to Arlington, WI for both years.
In a previous experiment, Zystro
et al. [
27] analyzed the effects of phenomorphological traits of the same inbred parents used in the present study on sweet corn weed competitiveness, and found plant height to be highly correlated with increased weed suppressive ability. In the present study, plant height was also highly correlated with yield and ear width (
Table 4). In addition, plant height was correlated with moisture, suggesting that the taller plants may take longer to dry down and/or reach physiological maturity. While maturity was highly correlated with moisture (
p ≤ 0.001) in the 2010 and 2011 West Madison, WI environments, plant height and maturity were not correlated (data not shown). Tiller number, on the other hand, was negatively correlated with plant height, yield and ear width, indicating that a tall plant with minimal tillers may be a desired phenotype for higher density tolerance. Correlation is not causation, however, and as noted by Zystro
et al. [
27], plant height and tiller number may be the observed trait that is linked to unmeasured factors increasing high density tolerance.
Zystro
et al. [
27] also used a similar diallel analysis, identifying C68 as the most competitive inbred due to its height and its production of hybrids with the highest yields and lowest weed biomass. Results from the present study further suggested the utility of C68 as a parental line to improve density tolerance and potential weed competitiveness in sweet corn. When grown at the highest density, C68 had the largest positive GCA effects for plant height, ear height, wet weight and dry weight (
Table 5). It also shared the largest GCA effect at the highest density for yield along with C40 (
Table 5). The wet weight advantage of C68 may be a factor of higher moisture content at harvest, as the five hybrids with the highest percent moisture all contained C68 as a parent (
Table 2). However, when dried to constant moisture, the GCA effect of C68 remained the greatest (
Table 5).
Another inbred to consider, given observed ear characteristics at the highest density, is C40. C40 had positive GCA effects for yield, wet weight, dry weight, kernel size, and the largest GCA effect for ear length. Ia5125 also performed well, with the highest GCA effects for ear width and kernel depth. Although it had a negative GCA effect for ear length, Ia5125 was found to have the second greatest GCA effect for plant height and ear height, and the most negative GCA effect for tiller number. In contrast, the performance of P39 suggests that it does not tolerate increased plant populations. At the highest density, P39 had the most negative GCA effects for yield, plant height, ear width, kernel depth, wet weight and dry weight (
Table 5). P39 also had the greatest positive GCA effect for tiller number. These results also confirm Zystro
et al.’s [
27] finding that P39 was the least competitive.
At the highest density, significant SCA was rare for all traits. This indicates that the actual performance of each hybrid did not deviate from its expected performance, based on the mean of all hybrid combinations and the general combining ability of the inbred parents.
Predictability can be used as a measure to determine how relevant significant SCA mean squares are in determining hybrid performance [
25]. When the ratio of mean squares of GCA to the total hybrid mean squares (mean squares of GCA and SCA) is close to one, then the predictability of traits can be based solely on GCA. The predictability of all traits analyzed in this experiment was quite high, ranging from 0.90–1.00, suggesting that GCA effects were better indicators than SCA effects of higher density tolerance (
Table 6). Thus, based on GCA alone, this study concludes that C68, C40 and Ia5125 were useful inbred parents that could be used in future breeding programs to develop sweet corn tolerant to higher planting densities. In addition, inbred lines with tall plant heights, reduced tiller numbers, and wide ears may be more tolerant of higher planting densities.
At least two limitations of this study restrict the inferences that can be made and suggest areas of further research. First, because the inbred lines used in this study were specifically selected for their diverse morphologies, they do not represent a random sample of publicly available inbred sweet corn lines. Strictly speaking, the conclusions drawn cannot be extrapolated beyond the 6 inbred lines and 15 hybrids tested in this experiment. While some inferences can be made regarding the plant morphologies that may contribute to density tolerance, continued experimentation with modern inbreds may identify more parent lines useful to breeders working to improve density tolerance.
Second, the goal of this experiment was to provide useful information about the genetics of traits that confer high density tolerance to sweet corn, which may serve as a means of weed competitiveness for organic growers. It is important to note that density tolerance is also a useful trait for conventional growers. This experiment was conducted under conventional agronomic practices, and the results are applicable to both farming systems. However, as has been shown in previous studies, genotype by environment interactions can cause rank changes to occur in the performance of cultivars between conventional and organic systems [
28,
29]. While this study suggests inbred parents that have the potential to adapt to higher planting densities, lines identified for organic farming systems should be tested under organic conditions to evaluate their performance in the environment of intended use.


