1. Introduction
When the “The Limits to Growth” (LTG) report [
1] was published for the first time in 1972, it generated great interest, but also considerable criticism. As described in detail in “The Limits to Growth Revisited” [
2], over the years, the debate veered more and more towards a political struggle until the study was widely rejected and forgotten in the 1990s. In general, a fundamental element of the debate was the inability of most people to understand the methods and the aims used for the LTG study. This problem occurred despite considerable efforts made by the authors to explain the basis of their model, which they called “World3”. The 1972 book even included a graph that illustrated all the elements of the model and the relationships among them. The result, however, was a very complex graph that, most likely, few readers understood. Not understanding how a specific system works “under the hood” is normally not a serious shortcoming for the practical use of that system. After all, most people drive their cars without understanding the thermodynamics of an internal combustion engine. However, in the specific case of the LTG study, without a clear understanding of the principles that stood behind the model, most people simply could not trust its results. Thus, one of the reasons for the rejection of the study and of its recommendations was the inability of most people to understand how the model worked.
The lack of understanding, however, was not the only reason for the widespread rejection of the LTG results. A fundamental role was played by the difficulty that most people have in accepting bad news. Several (although by no means all) of the scenarios presented in the LTG study generated the collapse of the industrial economy and, ultimately, of the world’s population. Such results were difficult to accept for many people, and this attitude was likely the main reason for the success of the demolition campaign that was unleashed against the study in the 1980s and 1990s [
2]. Today, however, as the result of widespread resource depletion and the rapidly growing threat to civilization generated by climate change, we seem to be approaching the crisis that had been foreseen by LTG 40 years ago. At this point, we badly need to go back to models that can tell us where we are going and what measures can be taken to avoid an economic and ecosystem collapse that appears to be well underway. However, for this purpose, we need to inform the public and the decision makers. We cannot do much to change the psychological factors that lead to the rejection of bad news, as they appear to be ingrained in the way the human mind works. We can, however, at least try to remedy the problem that developed with the 1972 study, that is, the difficulty of understanding complex models based on system dynamics. This problem appeared to exist also with scientifically trained people who also found it very difficult to understand the system dynamics approach, as it was not directly related to more traditional fields, such as economics. Therefore, the present paper tries to address the problem by developing simple “mind-sized” models that nevertheless maintain the basic purposes and aims of more complex models. These models turn out to reproduce the main results of more complex models and also to be able to describe real-world systems. This effort is inspired by the work of Seymour Papert in
Mindstorms [
3], who introduced the concept of modeling that is easy to understand in “mind sized bites.” This choice has to do with the basic purpose of models: it is a gross misunderstanding to think that models can predict the future. It is true, however, that models can affect the future. In other words, acting on the results of a good model, it is always possible to work in the direction of a better future. However, in order to use a model wisely, one must be able to understand it.
2. World Modeling
2.1. System Dynamics and the Limits to Growth
System dynamics (“SD”) is a way of modeling the physical world using concepts revolving around the idea of “stocks” and “flows”. Stocks are aggregates of something, often, but not necessarily, physical quantities. Flows are transfers from one stock to another which are regulated by “valves”. These valves, in turn, may be affected by the level of stocks they are connected to and, as a consequence, create feedback effects. That is, the flow from or into a stock may be reduced by a negative (or “balancing”) feedback or increased by a positive (or “self-reinforcing”) feedback.
The relations among the various elements of the model are described by a set of differential equations that describe how stocks and flows vary with time. SD models are often built and represented in a graphical form where stocks are represented as rectangles (“boxes”), flows as double-edged arrows, valves as butterfly-shaped graphic elements, and controls as single-edged arrows. These elements and their graphical representation were already known in the 1960s, and system dynamics is at the basis of the “World3” model used for the “The Limits To Growth” study [
4].
The World3 model was built around five main stocks: (1) population, (2) non-renewable (mineral) resources, (3) renewable (agricultural) resources, (4) capital resources, and (5) pollution. In the model, the relations among these stocks were determined from the historical data available up to then. The model was used to create a series of scenarios that described the behavior of some of the variables of the world’s economic system up to the end of the 21st century. These scenarios were created on the basis of different assumptions on the starting parameters and with different assumptions on the relationship among the various elements of the systems and on how governments could act on the system by laws and international treaties. Scenarios created using “business as usual” assumptions generated the eventual collapse of the world’s economy and, later, of the human population as a result of a combination of gradual resource depletion and of increasing pollution. These trends did not qualitatively change, even starting from very optimistic assumptions on the availability of natural resources, or on other elements such as the development of new technologies and the ability of the ecosystem to absorb human-generated pollution. Only a series of specific global actions designed to curb economic growth and stabilize the world’s population could generate a stable trajectory of the economic system throughout the 21st century. 40 years after the publication of the original LTG report, the results of the study have been confirmed by updates, the most recent one published in 2004 [
5]. Studies have highlighted how the trajectory of the world’s economy has followed rather closely the trajectory of the “base case” scenario of the report [
6]. Several of the features of the present turmoil of the world’s economic system could be interpreted as a consequence of the start of the collapse that the base-case scenario estimated as likely to occur within the first two decades of the 21st century.
2.2. The Physics behind System Dynamics World Models
What makes stocks flow? This is a fundamental question implicit in all system dynamics models which, if they are to describe the real world, must obey the laws of physics. We know that all changes occurring in the universe are the result of the tendency of entropy to increase. A practical way to view transformations in non-isolated systems is by means of the concept “thermodynamic potential” that combines the first and the second law of thermodynamics. It is normally expressed in the form of a state function called “Free Energy”. The rule is that any spontaneous transformation in any system must move in the direction of reducing the value of the free energy, i.e., of the potential.
This rule is very general. It thus follows that a system dynamics model of the system must behave in the same way if it is to describe real world, physical systems. If we consider a stock that flows into another, a thermodynamic potential that generates the flow must exist. For instance, a bathtub that empties through a draining pipe does so as the result of a thermodynamic potential (gravitational, in this case). We might use a pump to invert this flow, but in this case, we need to assume that, somewhere, a higher thermodynamical potential is dissipated in order to create the electric power necessary to operate the pump.
The SD model of a bathtub does not need to (and usually does not) consider the whole chain of stocks and flows that leads from a power plant to the pump that moves water into the tub. However, these parameters cannot be forgotten when it is question of understanding in which direction the system moves. This point is especially important when we consider world models. If we consider, for instance, a model of fossil fuels extraction and utilization, then the system always moves towards the dissipation of the thermodynamic potentials of the fuels, in this case, a chemical potential that results from fuel combustion. At the global level, it is not possible to invert the process, because we do not have (at least at present) a source of energy not based on fossil fuels that could produce the enormous amount of energy necessary for this purpose. Hence, the flows of any model of the world’s economy model are ultimately driven by thermodynamic potentials that lead to the dissipation of potentials stored in fossil fuels (and also, in smaller amounts, in fissile uranium and in solar energy).
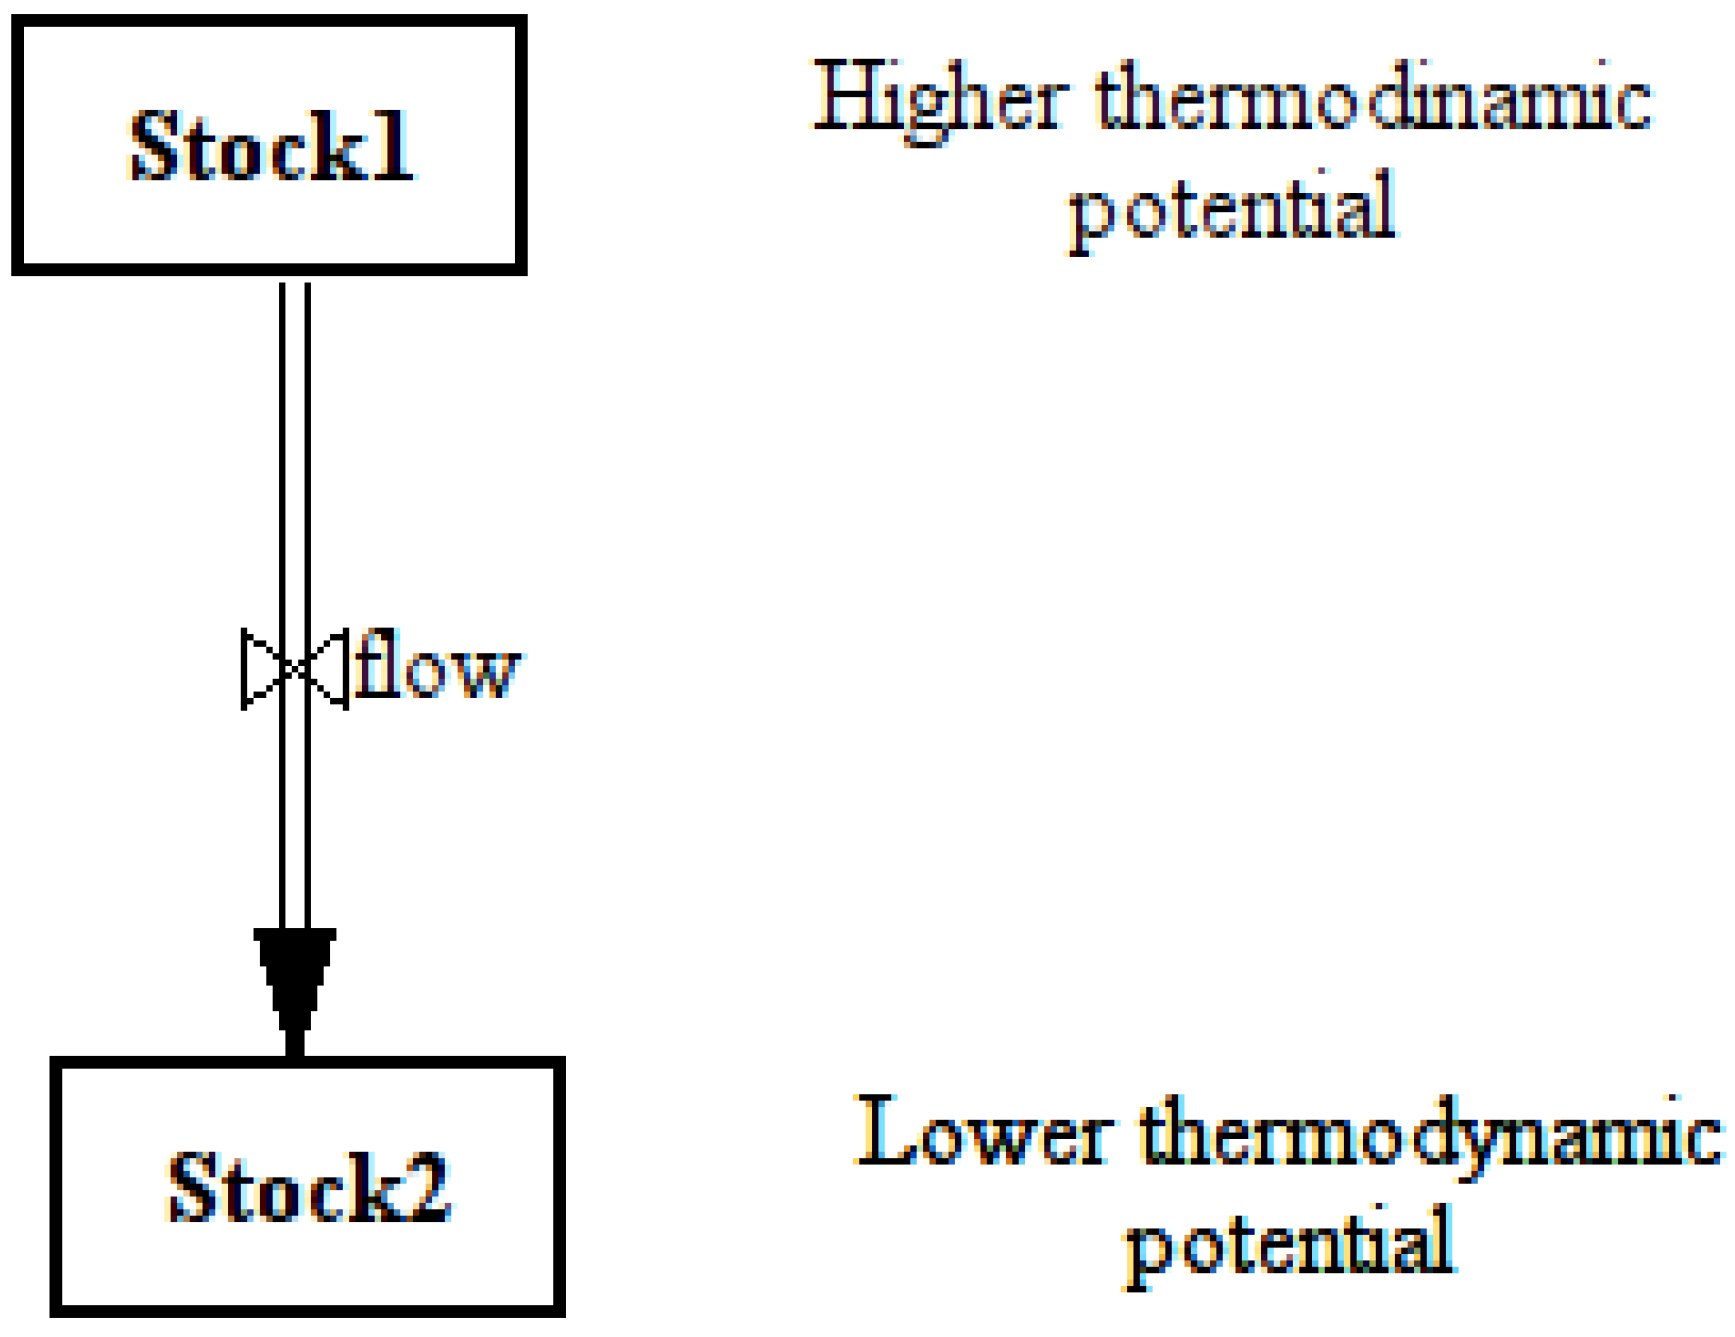
Thermodynamic potentials are implicit in the equations that describe the behavior of SD models. However, there does not exist a graphic convention that can be used to visualize these potentials. In some cases, this lack of an “arrow of time” in the model hampers the understanding of what makes the system move. In view of the approach of the present paper, however, a qualitative description will be sufficient. I will use a convention that draws stocks higher up in the graphic representation of the model as a qualitative measure of their thermodynamic potential, as shown in
Figure 1. This representation sees stocks as flowing water affected by the gravitational field and has, therefore, an intuitive value.
Figure 1.
Convention for flows from stock to stock used in the present paper. Higher thermodynamic potential stocks are represented as “higher up” in the image.
Figure 1.
Convention for flows from stock to stock used in the present paper. Higher thermodynamic potential stocks are represented as “higher up” in the image.
In general, the speed of dissipation of the potentials of the system cannot be directly related to thermodynamic potentials. For instance, simply mixing gaseous hydrogen and oxygen at pressures close to atmospheric and at room temperature does not normally lead to a measurable reaction rate for the formation of water, even though the chemical potential of the reaction is large. However, the reaction can become so fast as to appear instantaneous in the presence of a catalytic platinum surface. Thus, in this case, as in many others, there is no direct relation between a reactant’s concentration and reaction speed. However, it is also true that the chemical potential of a species is directly proportional to the number of molecules available for the reaction. Often, it is found that, for the same conditions, the reaction speed is proportional to the concentration of the i-th species, and hence to the overall thermodynamic potential. In many cases, therefore, system dynamics models can assume that, all other things remaining the same, flows are proportional to the size of the stock to which they are connected. We will see that this is often the case in world models.
3. Mind Sized World Models
The LTG authors made considerable efforts to explain their model, and the present paper is not to be understood as a criticism of their work. However, we need to do better in order to accurately convey the message that the LTG already tried to disseminate in 1972. We need to take specific measures to avoid the collapse of both the economic system and the ecosystem. In order for people to act on a problem, this problem must be recognized and understood within their mental models. It must therefore be asked: can global dynamic models be expressed in “mind sized” terms?
There is no fixed definition for what kind of model could be built in such a way to be understandable (and also trusted) by people, and in particular by decision makers. However, as a working hypothesis, such a model could be built according to the following definitions:
- (1)
-
Realistic: the system should be driven by known physical laws
- (2)
-
Simple: it should be formed of a limited number of elements
- (3)
-
Structured: it should be composed of a small number of basic building blocks linked together
- (4)
-
Testable: the model should describe at least some historical cases.
As we can see, “mind sized” does not mean merely “simplified,” although such a characteristic is normally a bonus. For instance, an interesting attempt of a graphically simple depiction of the World3 model was performed by Magne Myrtveit [
7], who used graphical icons to illustrate the five main stocks of the World3 model and arranged these elements in the form of a centered square with connecting arrows. This is a step forward toward mind size, but Myrtveit’s graphical arrangement does not indicate to readers what makes the system behave the way it does.
Creating mind sized world models means reducing the number of stocks while maintaining at least some of the characteristics of a global model and, in particular, making explicit the assumptions about what makes one stock into the other. It means maintaining the purposes of the original model by asking: what was the process to be simulated and what were the questions that the model was supposed to answer? Oversimplification is an obvious risk, but the idea is to catch the main elements of the system being studied while remaining sufficiently mind sized to be understandable (at least in theory) by lay people. Accordingly, I will describe here a series of progressively complex models arranged as a function of the number of stocks, from one (the simplest possible case), to a number corresponding to the main stocks of the World3 model. All these models were created using the Vensim software package [
8].
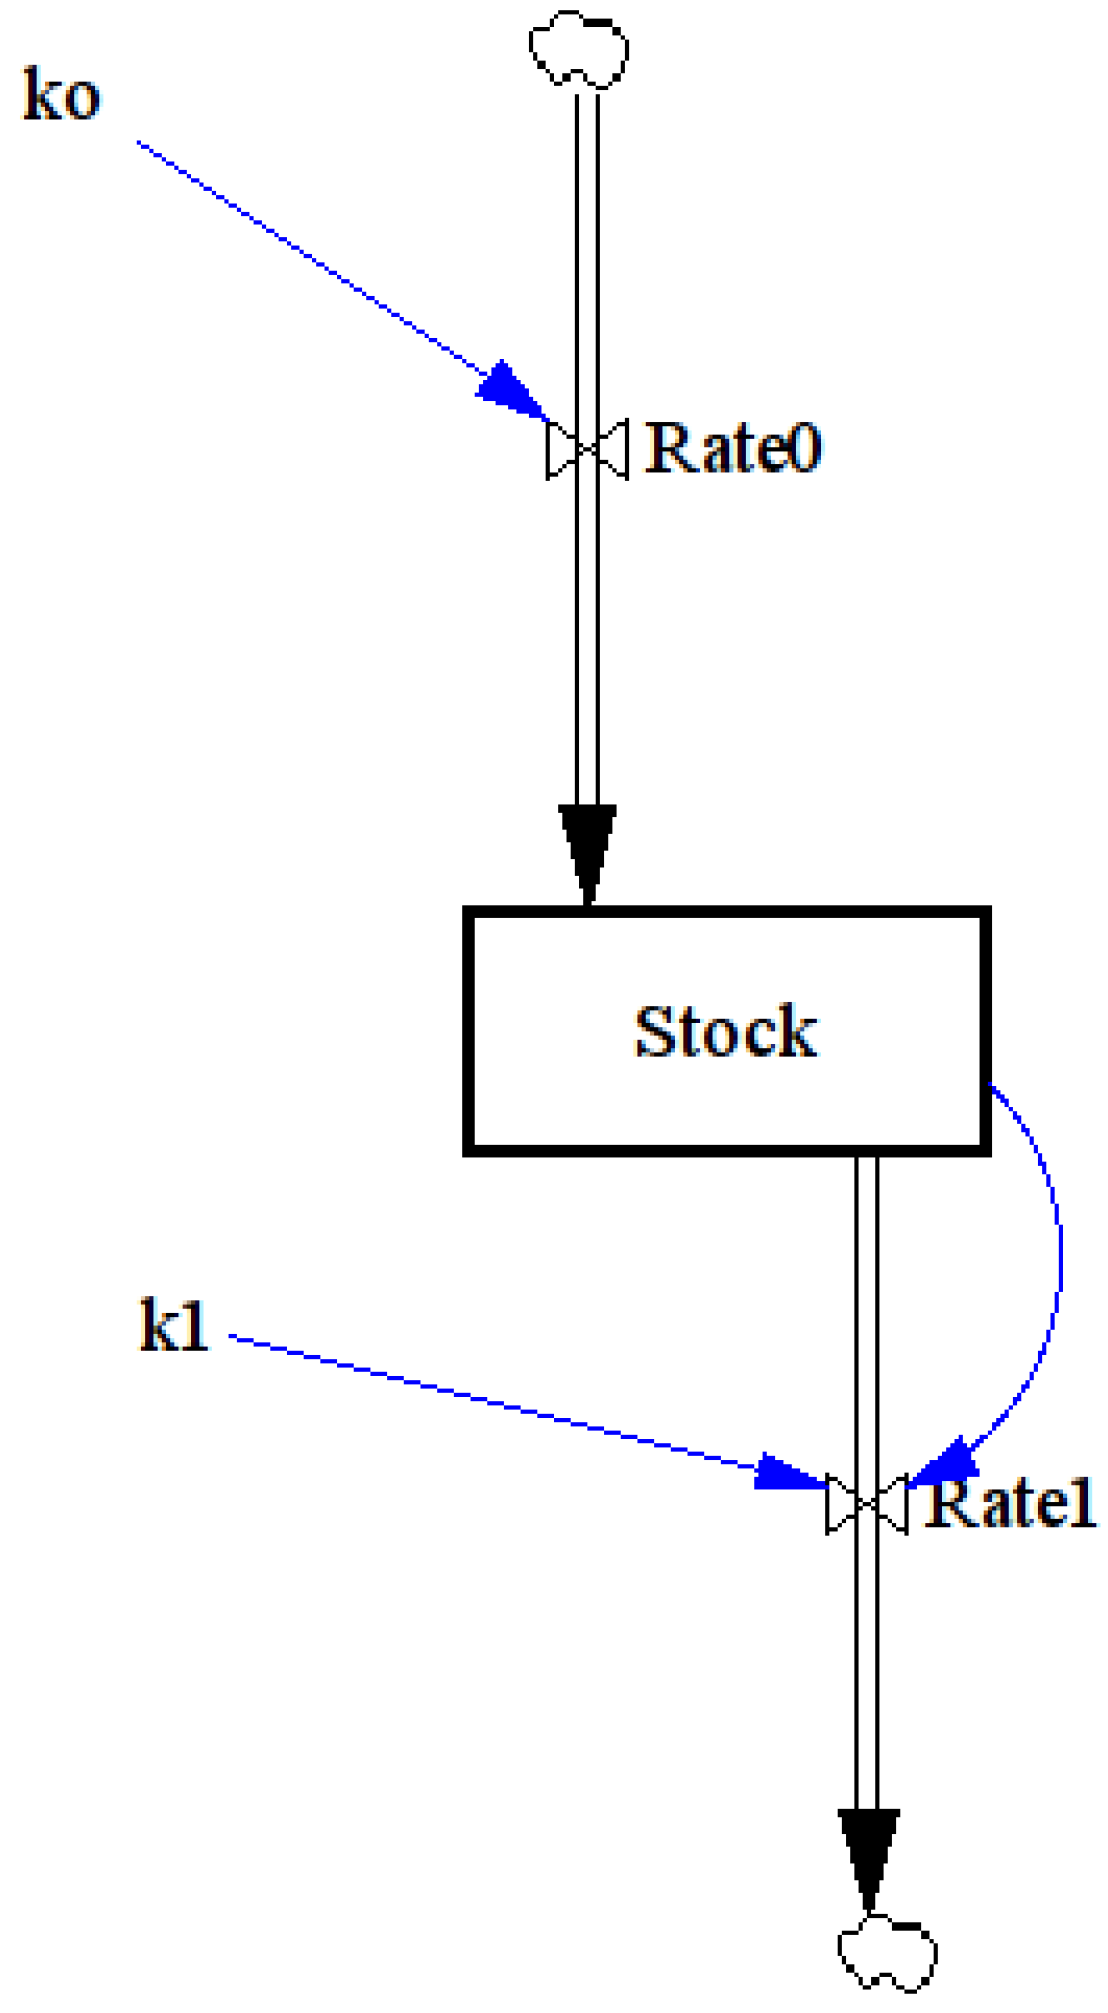
3.1. One-Stock Model
The “one-stock” model is a case often referred to as the “bathtub model” and it is the classic entry level model in system dynamics.
The model is shown in
Figure 2 using the conventions used in the present paper, that is, the stocks flow “down” from higher to lower thermodynamic potentials, as shown in
Figure 2. Considering it as a bathtub model, the water source, which is emptied into the stock through the tap called “rate0,” is supposed to be very large. The variation of this stock is not taken into account. The flow from the tap is supposed to be regulated only by the valve controlled by the constant “k
0”. The outflow of the model (the “drain”), instead, is controlled not only by the constant “k
1”, but also by a feedback loop that correlates the flow with the stock level. In other words, the amount of water flowing out of the stock is supposed to be proportional to the amount of water present in the stock. This makes sense in physical terms because the flow through a pipe depends on the pressure drop at the two ends of the pipe (Poiseuille’s law) and the pressure at the inlet depends on the level of the fluid in the tank.
Figure 2.
One-stock model.
Figure 2.
One-stock model.
The results of dynamic modeling of this system normally leads to a condition of dynamical homeostasis where the outflow exactly balances the inflow (if the capacity of the stock is assumed to be limited, it can also lead to unending overflow, which is also a form of homeostasis). The model provides a trajectory for the system to gradually reach this condition. If, at the beginning, the inflow is larger than the outflow, the water level in the tank will rise up until pressure can push water through the drain at a higher speed; matching the tap inflow.
In terms of modeling an economic system, this model may be seen as similar, in some respects, to the well-known “Hotelling Rule” [
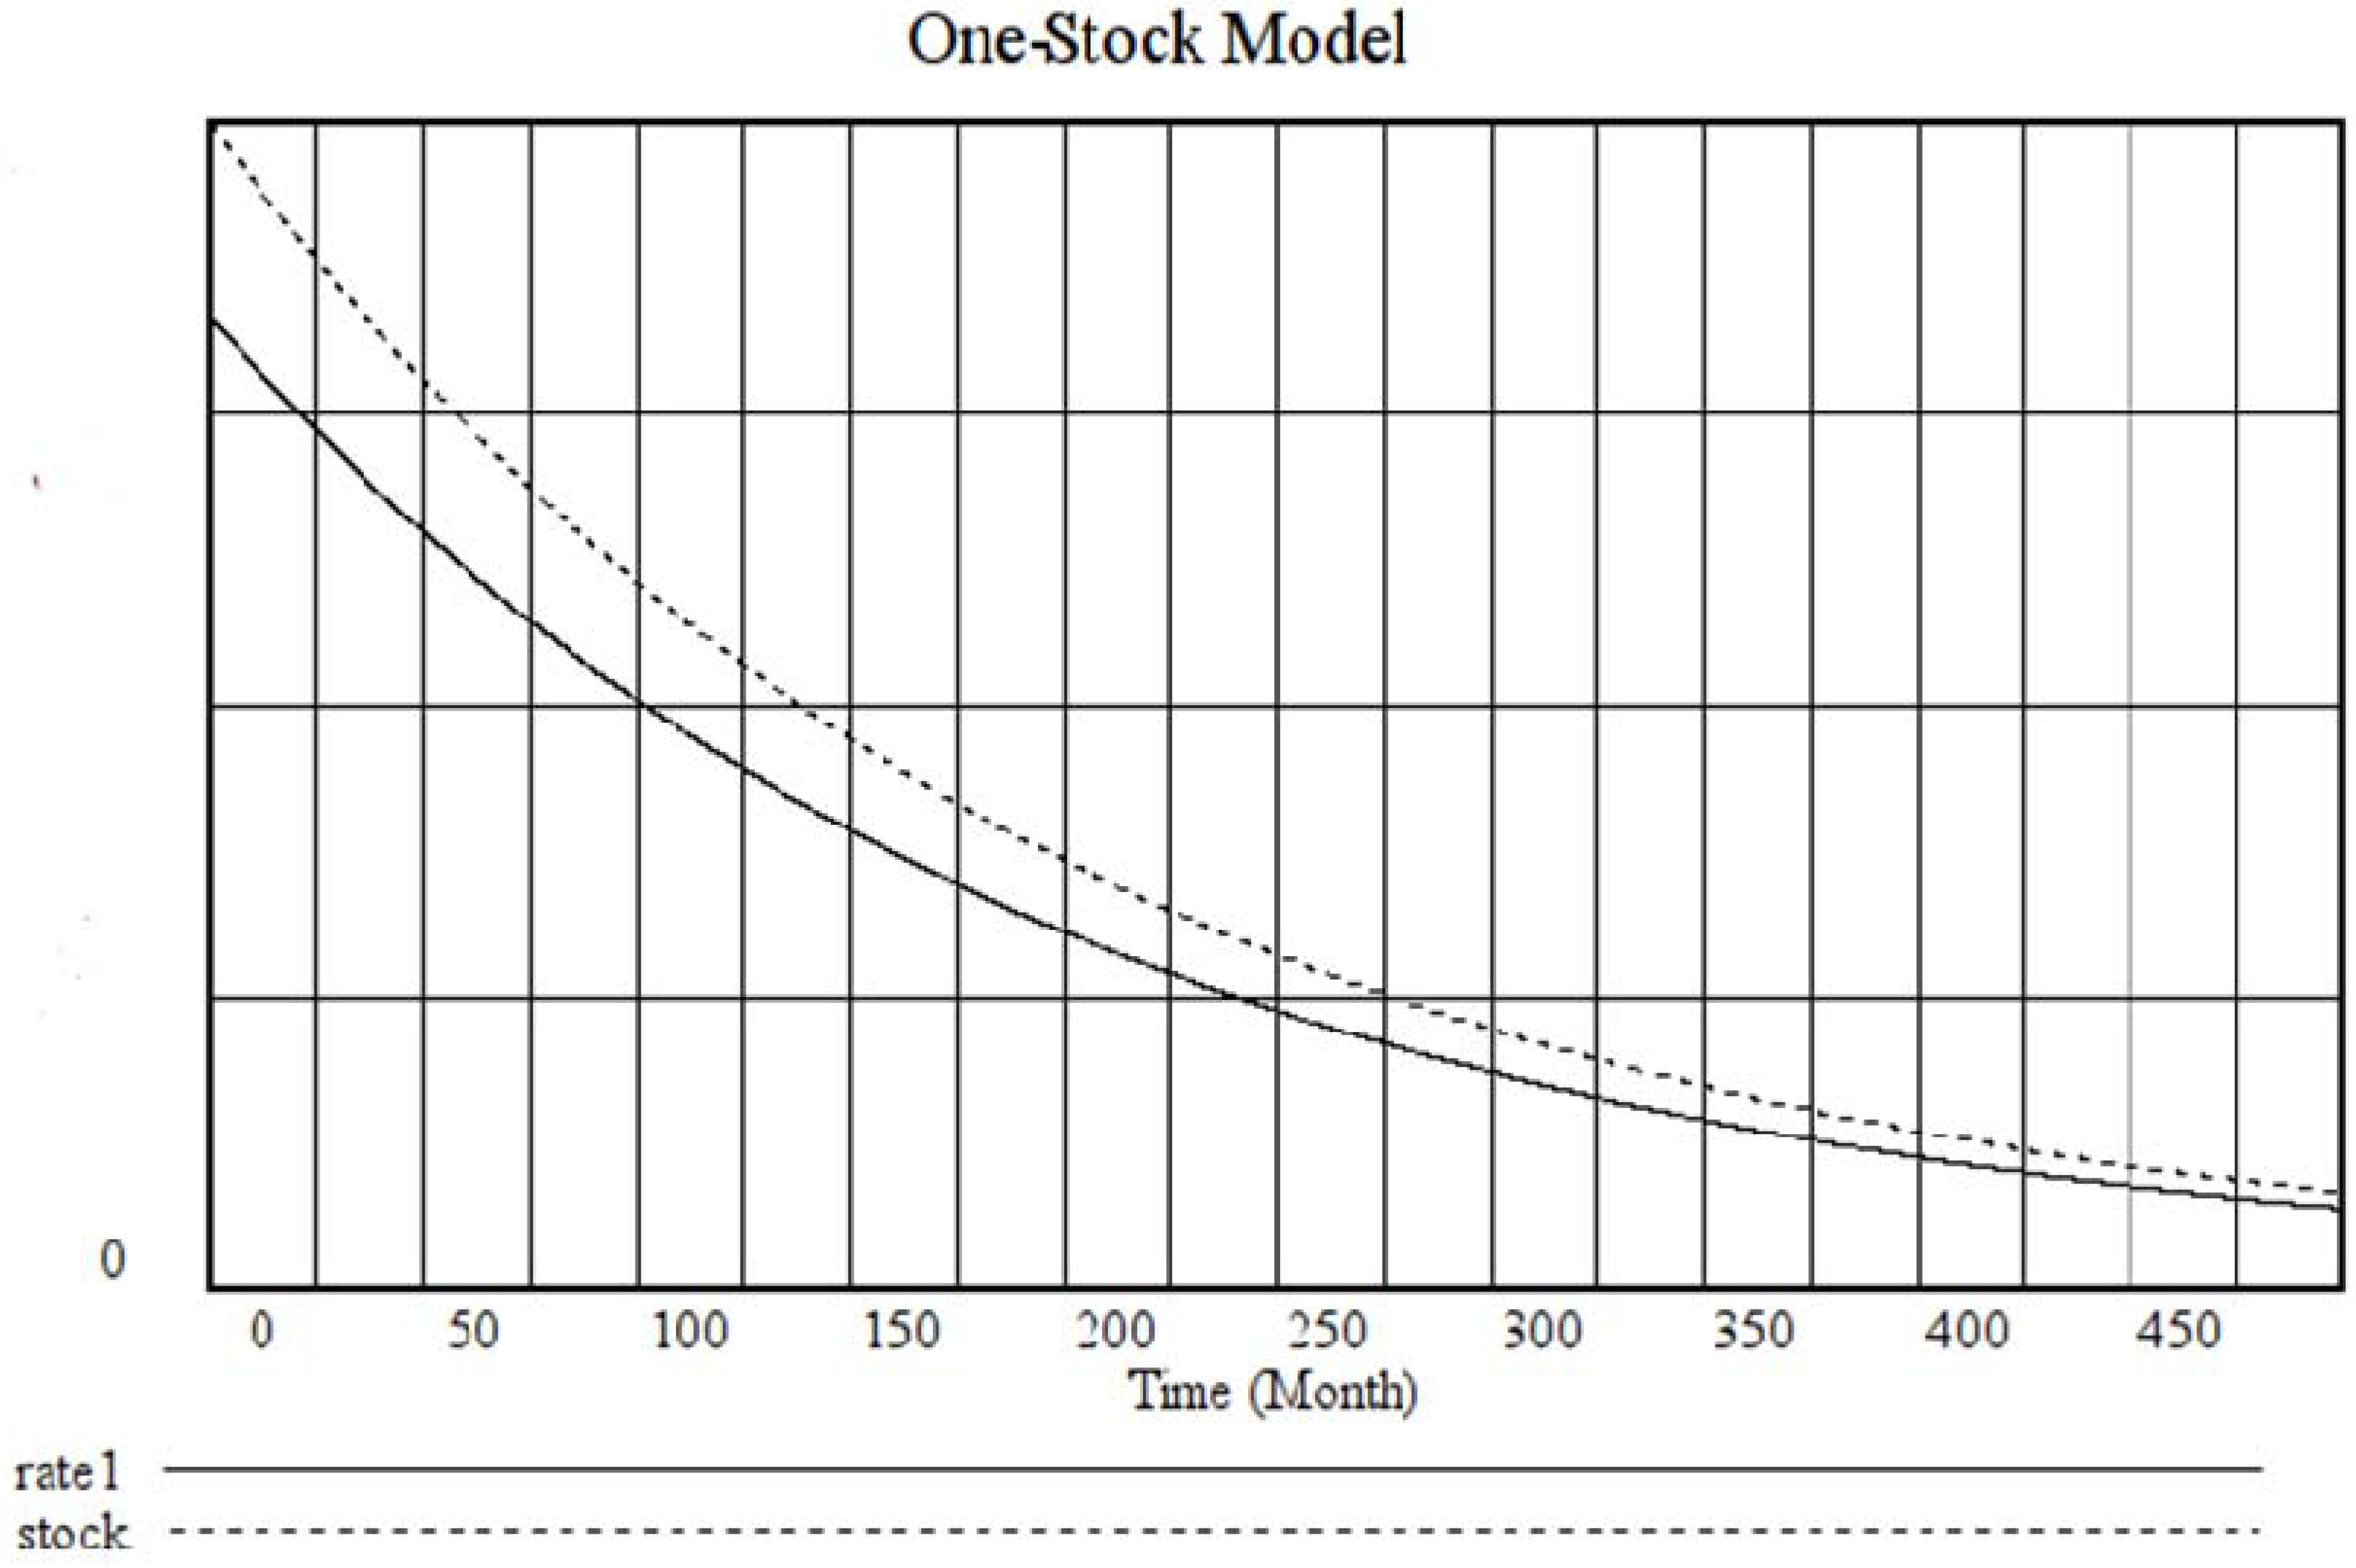
9]; that is, a model where the economic system is based on the exploitation of a single, non-renewable resource. If there is no input from an external source, in both the Hotelling rule and the one-stock model, the depletion of the resource stock is gradual (as shown in
Figure 3. However, there are not many known cases of real economic systems that behave in this way, so the one-stock model is not very relevant in economic terms.
Figure 3.
Dynamic behavior of the one-stock model. In this run, k0 = 0, k1 = 5 × 10⁻³, Stock(init) = 1.
Figure 3.
Dynamic behavior of the one-stock model. In this run, k0 = 0, k1 = 5 × 10⁻³, Stock(init) = 1.
The one-stock model is still useful to describe some physical systems, such as the sun–earth–space energy flow. In this case, the model illustrates how the “greenhouse effect” acts on the outflow of energy increasing the heat content of the stock (the earth), thereby increasing its temperature. This is obvious to scientifically trained people, but in the fervent debate on climate change, there are many who claim that the earth’s average temperature is altering merely as a consequence of changes in solar irradiation intensity and that any other explanation contrasts with the first or the second law of thermodynamics (or both). This is not to say that this model will automatically convince them, yet it may help the debate to move toward correct considerations and, hopefully, to convince bystanders.
3.2. The Two-Stock Model
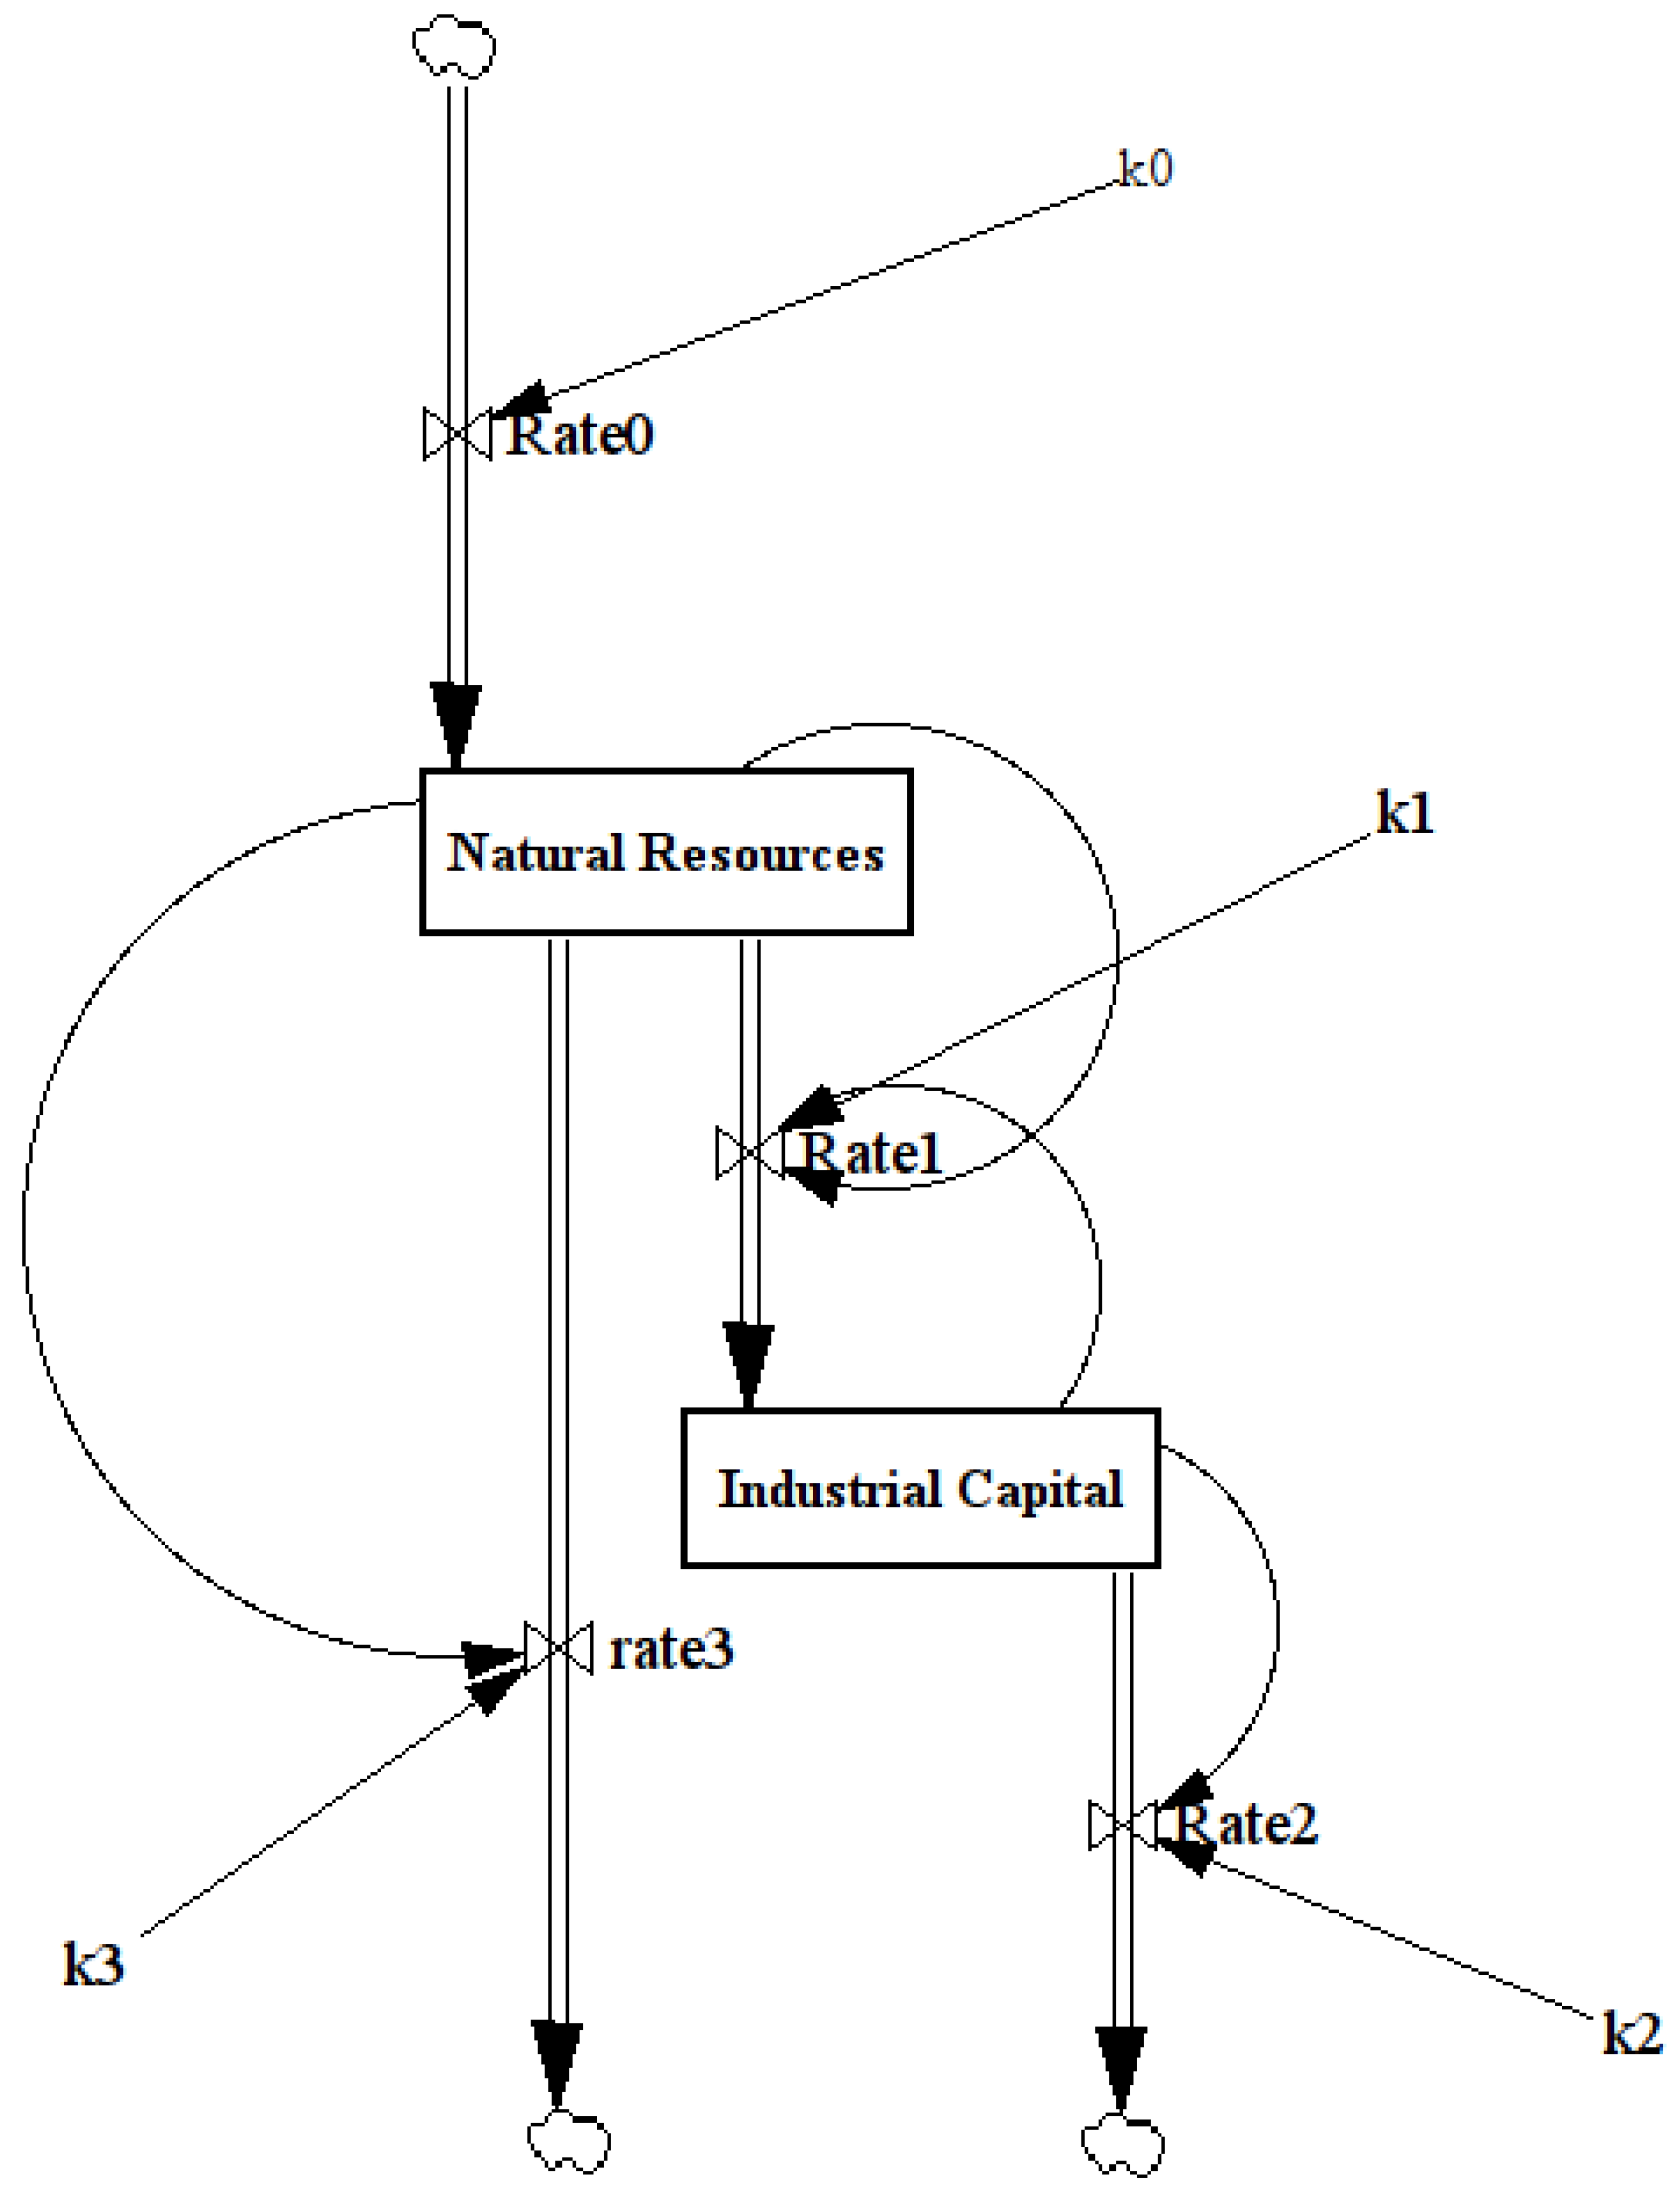
The two-stock model describes a case in which the thermodynamic potential of a stock is dissipated in two stages, flowing first into a second stock, at a lower potential, and then into the environment, that we can take as “zero potential”. The first stock may also, in part, flow directly towards the zero-potential environment. The model (shown in
Figure 4) may also assume the existence of a higher potential, “infinite” source of energy that keeps filling the first stock (perhaps sunlight).
We can see this model as a version of the well-known “Lotka–Volterra model”, where the higher stock is said to represent “rabbits”, and the second stock, “foxes”. In its simplest version, the model generates infinite oscillations in both stocks; that is, the populations of both rabbits and foxes tend to go up and down as foxes exterminate rabbits and then, in turn, die of starvation. “Damping” can be introduced in the system to generate a stable number of individuals of each species.
Figure 4.
The two-stock model. In this case the model can be seen as equivalent to the empirical “Hubbert model” that describes some cases of cycles of exploitation of petroleum resources.
Figure 4.
The two-stock model. In this case the model can be seen as equivalent to the empirical “Hubbert model” that describes some cases of cycles of exploitation of petroleum resources.
The two-stock model is built around the concept that the thermodynamic potential of the resource being exploited is proportional to the amount of the resource being exploited. This concept is intuitive in many cases. For instance, in the case of crude oil, it is reasonable to assume that the higher energy yield resources (larger fields, lower depth, convenient geographical location, high quality oil,
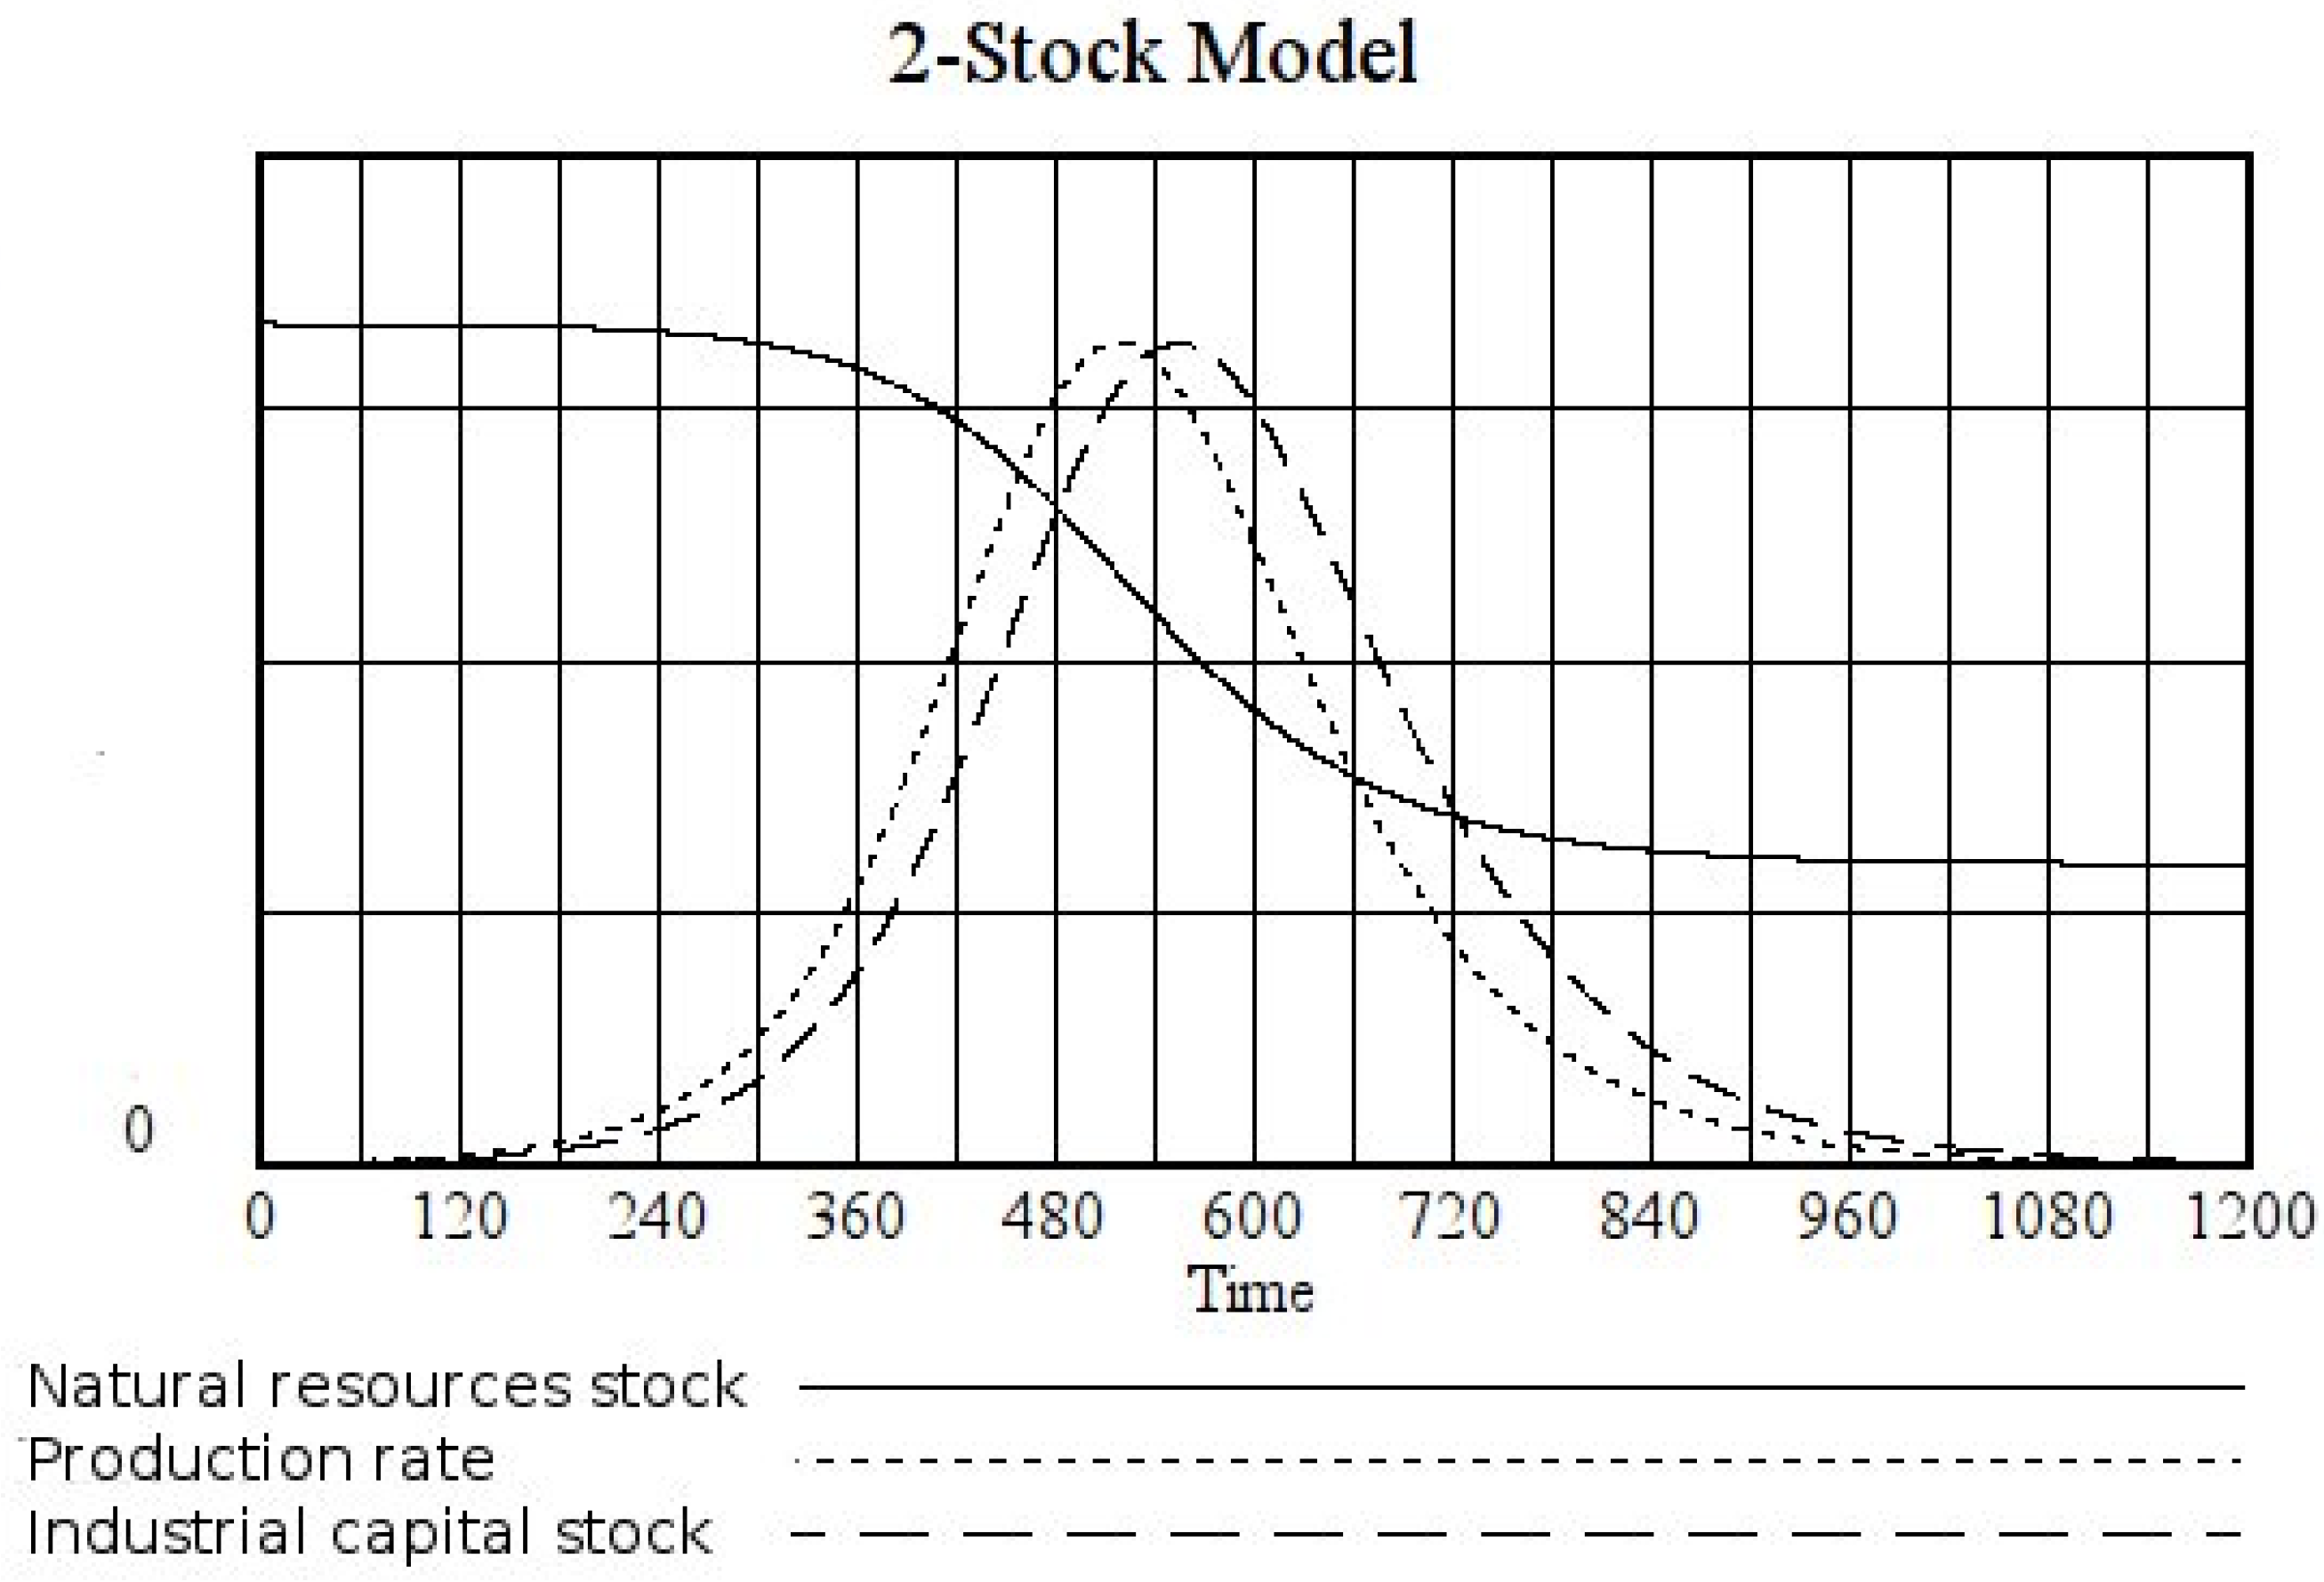
etc.) are exploited first. As resources are gradually depleted, the diminishing yield of the resource is initially compensated by the increase of the potential of the capital stock. However, as that stock is also gradually dissipated, the system evolves toward a lower rate of dissipation (production) from one stock to the other. The overall result (
Figure 5) is a bell-shaped curve, as described in [
10].
Figure 5.
Behavior of the two-stock model for a completely non-renewable higher potential stock, the values of the parameters are: k0 = 0, k1 = 0.04, k2 = 0.025, k3 = 0, Natural resources (initial) = 1, Industrial capital (initial) = 10−4.
Figure 5.
Behavior of the two-stock model for a completely non-renewable higher potential stock, the values of the parameters are: k0 = 0, k1 = 0.04, k2 = 0.025, k3 = 0, Natural resources (initial) = 1, Industrial capital (initial) = 10−4.
In this form, the two-stock model can be seen as equivalent to the empirical “Hubbert model” [
11] that describes a number of cases of oil extraction in large productive regions. The “bell-shaped” curves that are generated by this model are also qualitatively similar to the curves generated by the Word3 model used in the LTG studies. As described in [
12], the ratio of the energy flow and outflow into and from the industrial capital stock can be used to determine the “EROEI” (energy return for energy invested) of the system
Although very simple, the two-stock model provides very important “mind sized” insight on how a world economy based on non-renewable resources (e.g., oil) can function. It is (or it should be) obvious to everybody that the exploitation of a finite resource cannot last forever, but it is not clear which exact path that exploitation will follow. The model provides an answer proposing that the path will go through phases of “fat cows” and “lean cows,” and that the lean cows phase will start way before the total of the theoretically available resources will have been harvested.
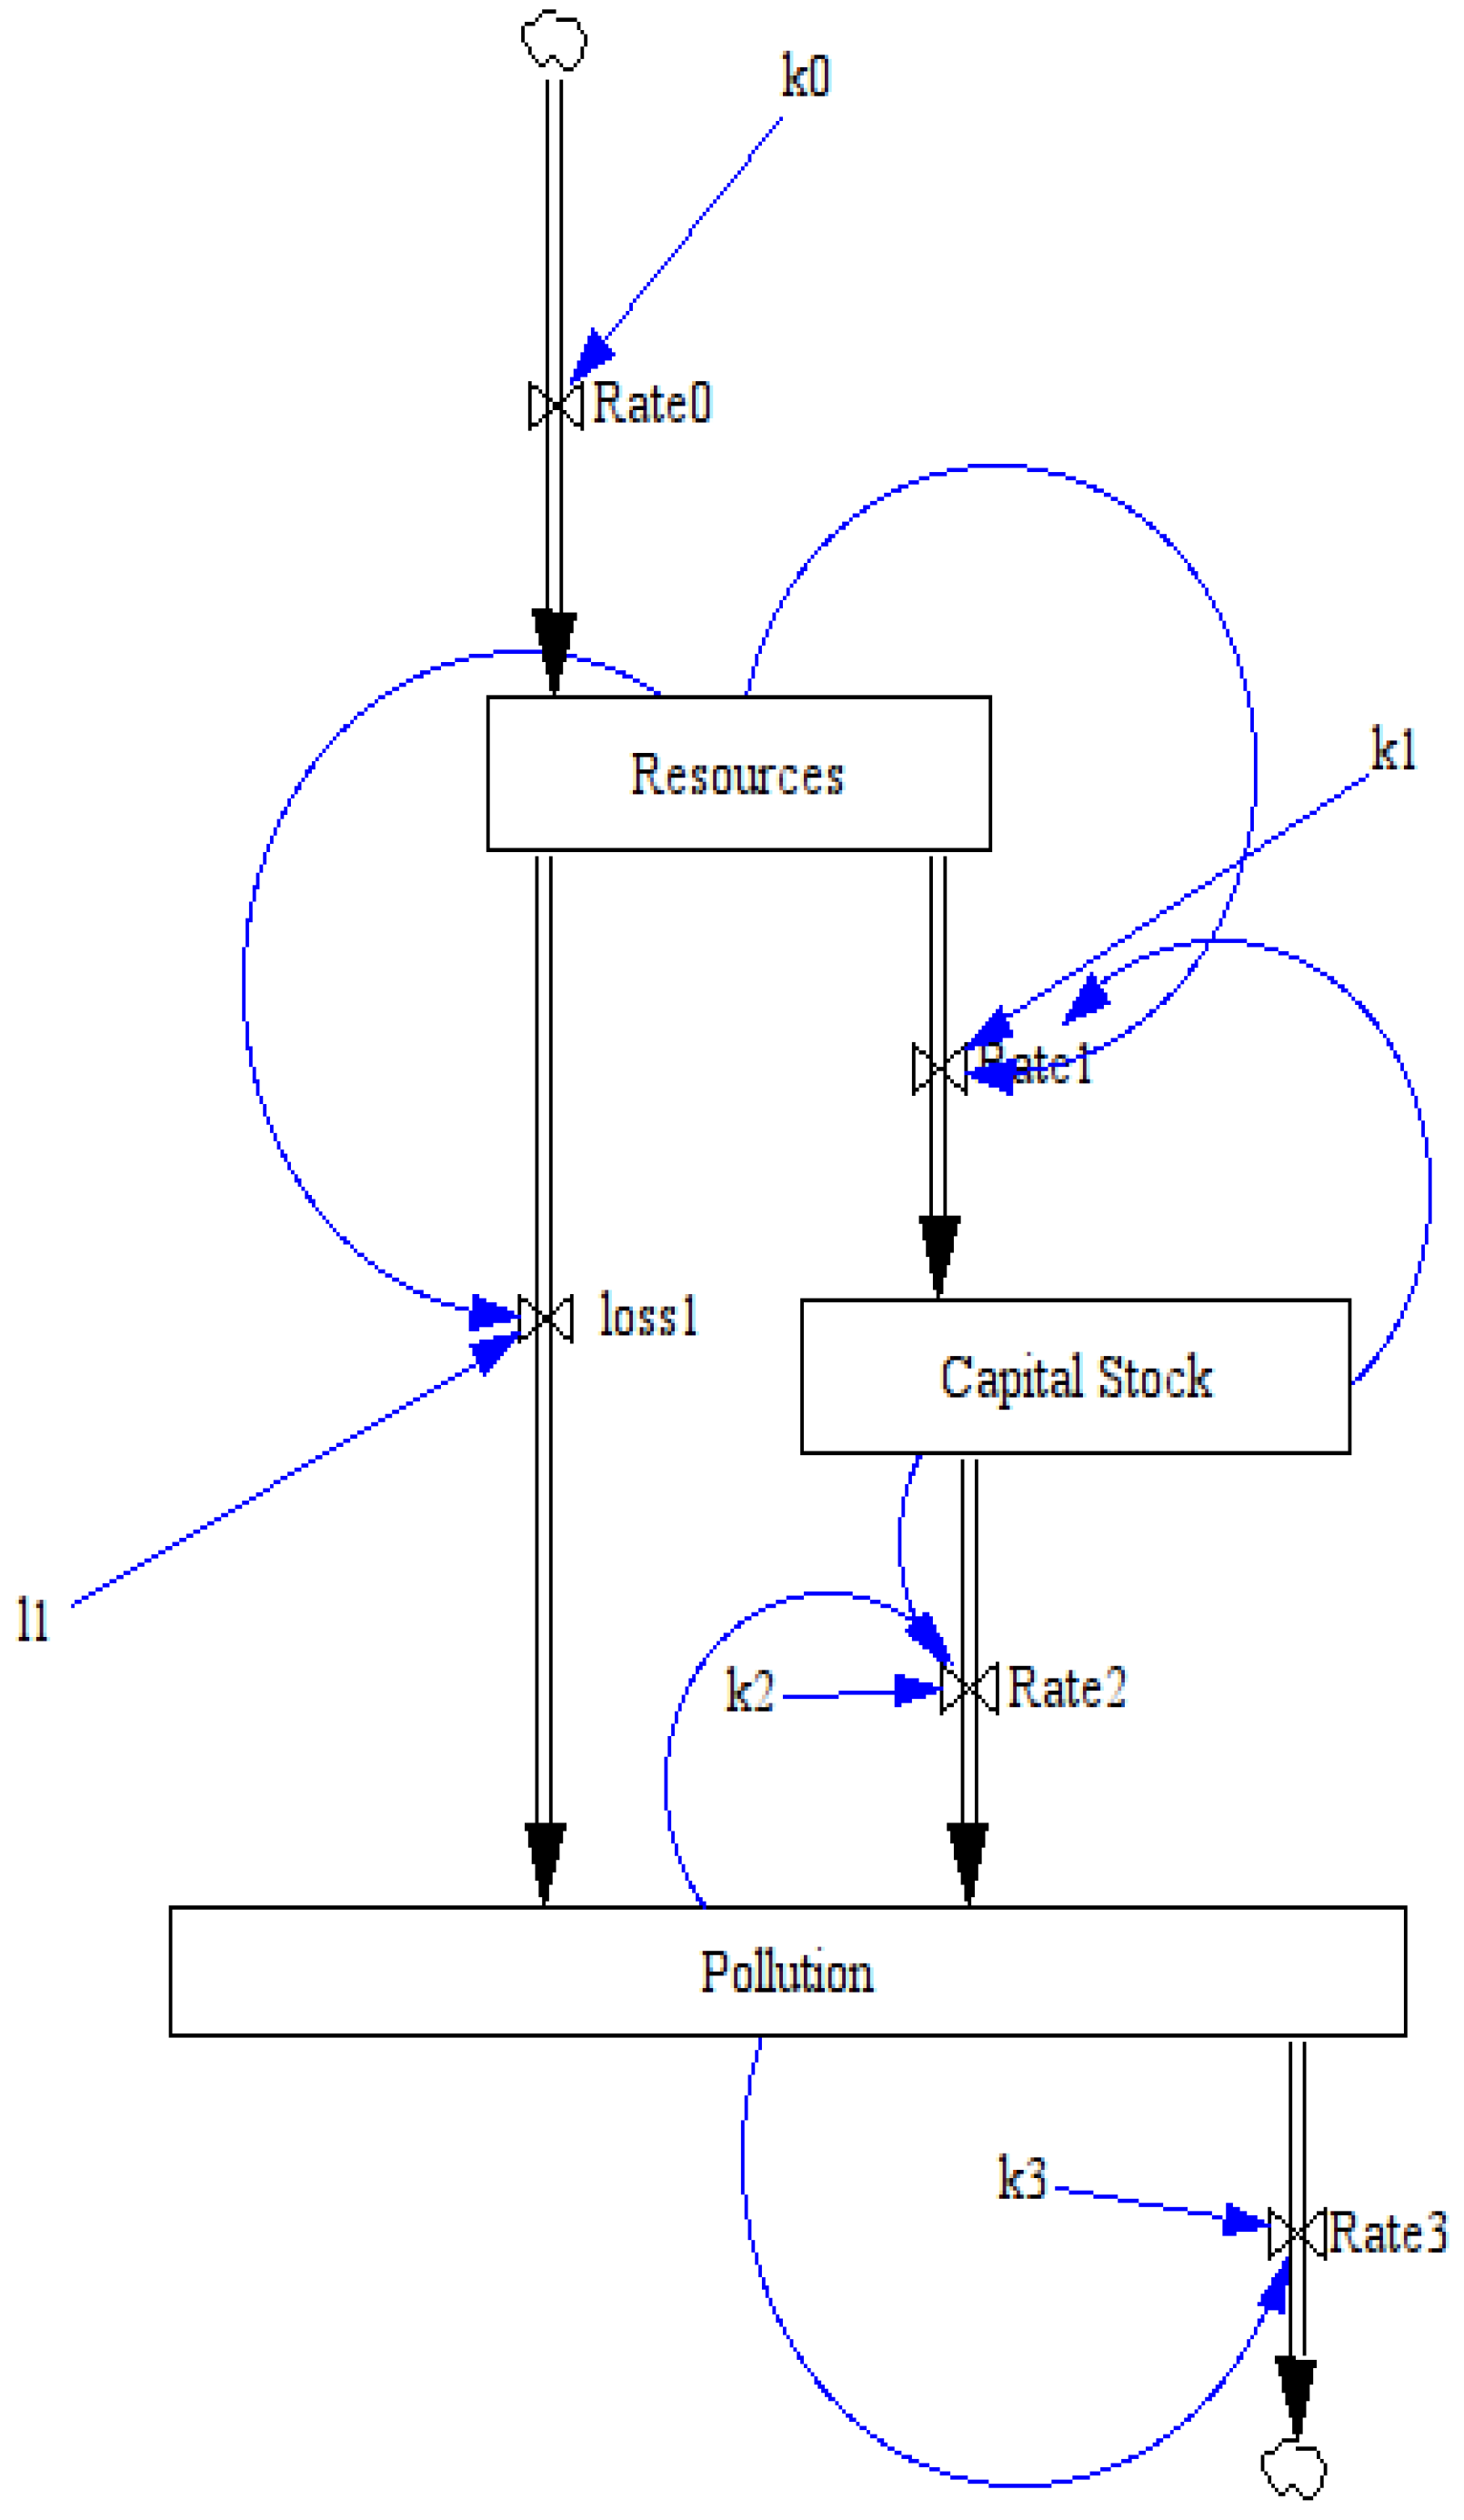
3.3. Three-Stock Model (The “Seneca Model”)
The three-stock model is a straightforward evolution of the two-stock model. In this case, we have a further reservoir which accumulates the resource being dissipated before its final disappearance. The model is shown in
Figure 6. Apart from the extra stock, the model is the same as the two-stock one and it illustrates, among other things, the idea of building up models progressively by adding identical “building blocks”.
Figure 6.
Stock and flow graphical representation of the three-stock model.
Figure 6.
Stock and flow graphical representation of the three-stock model.
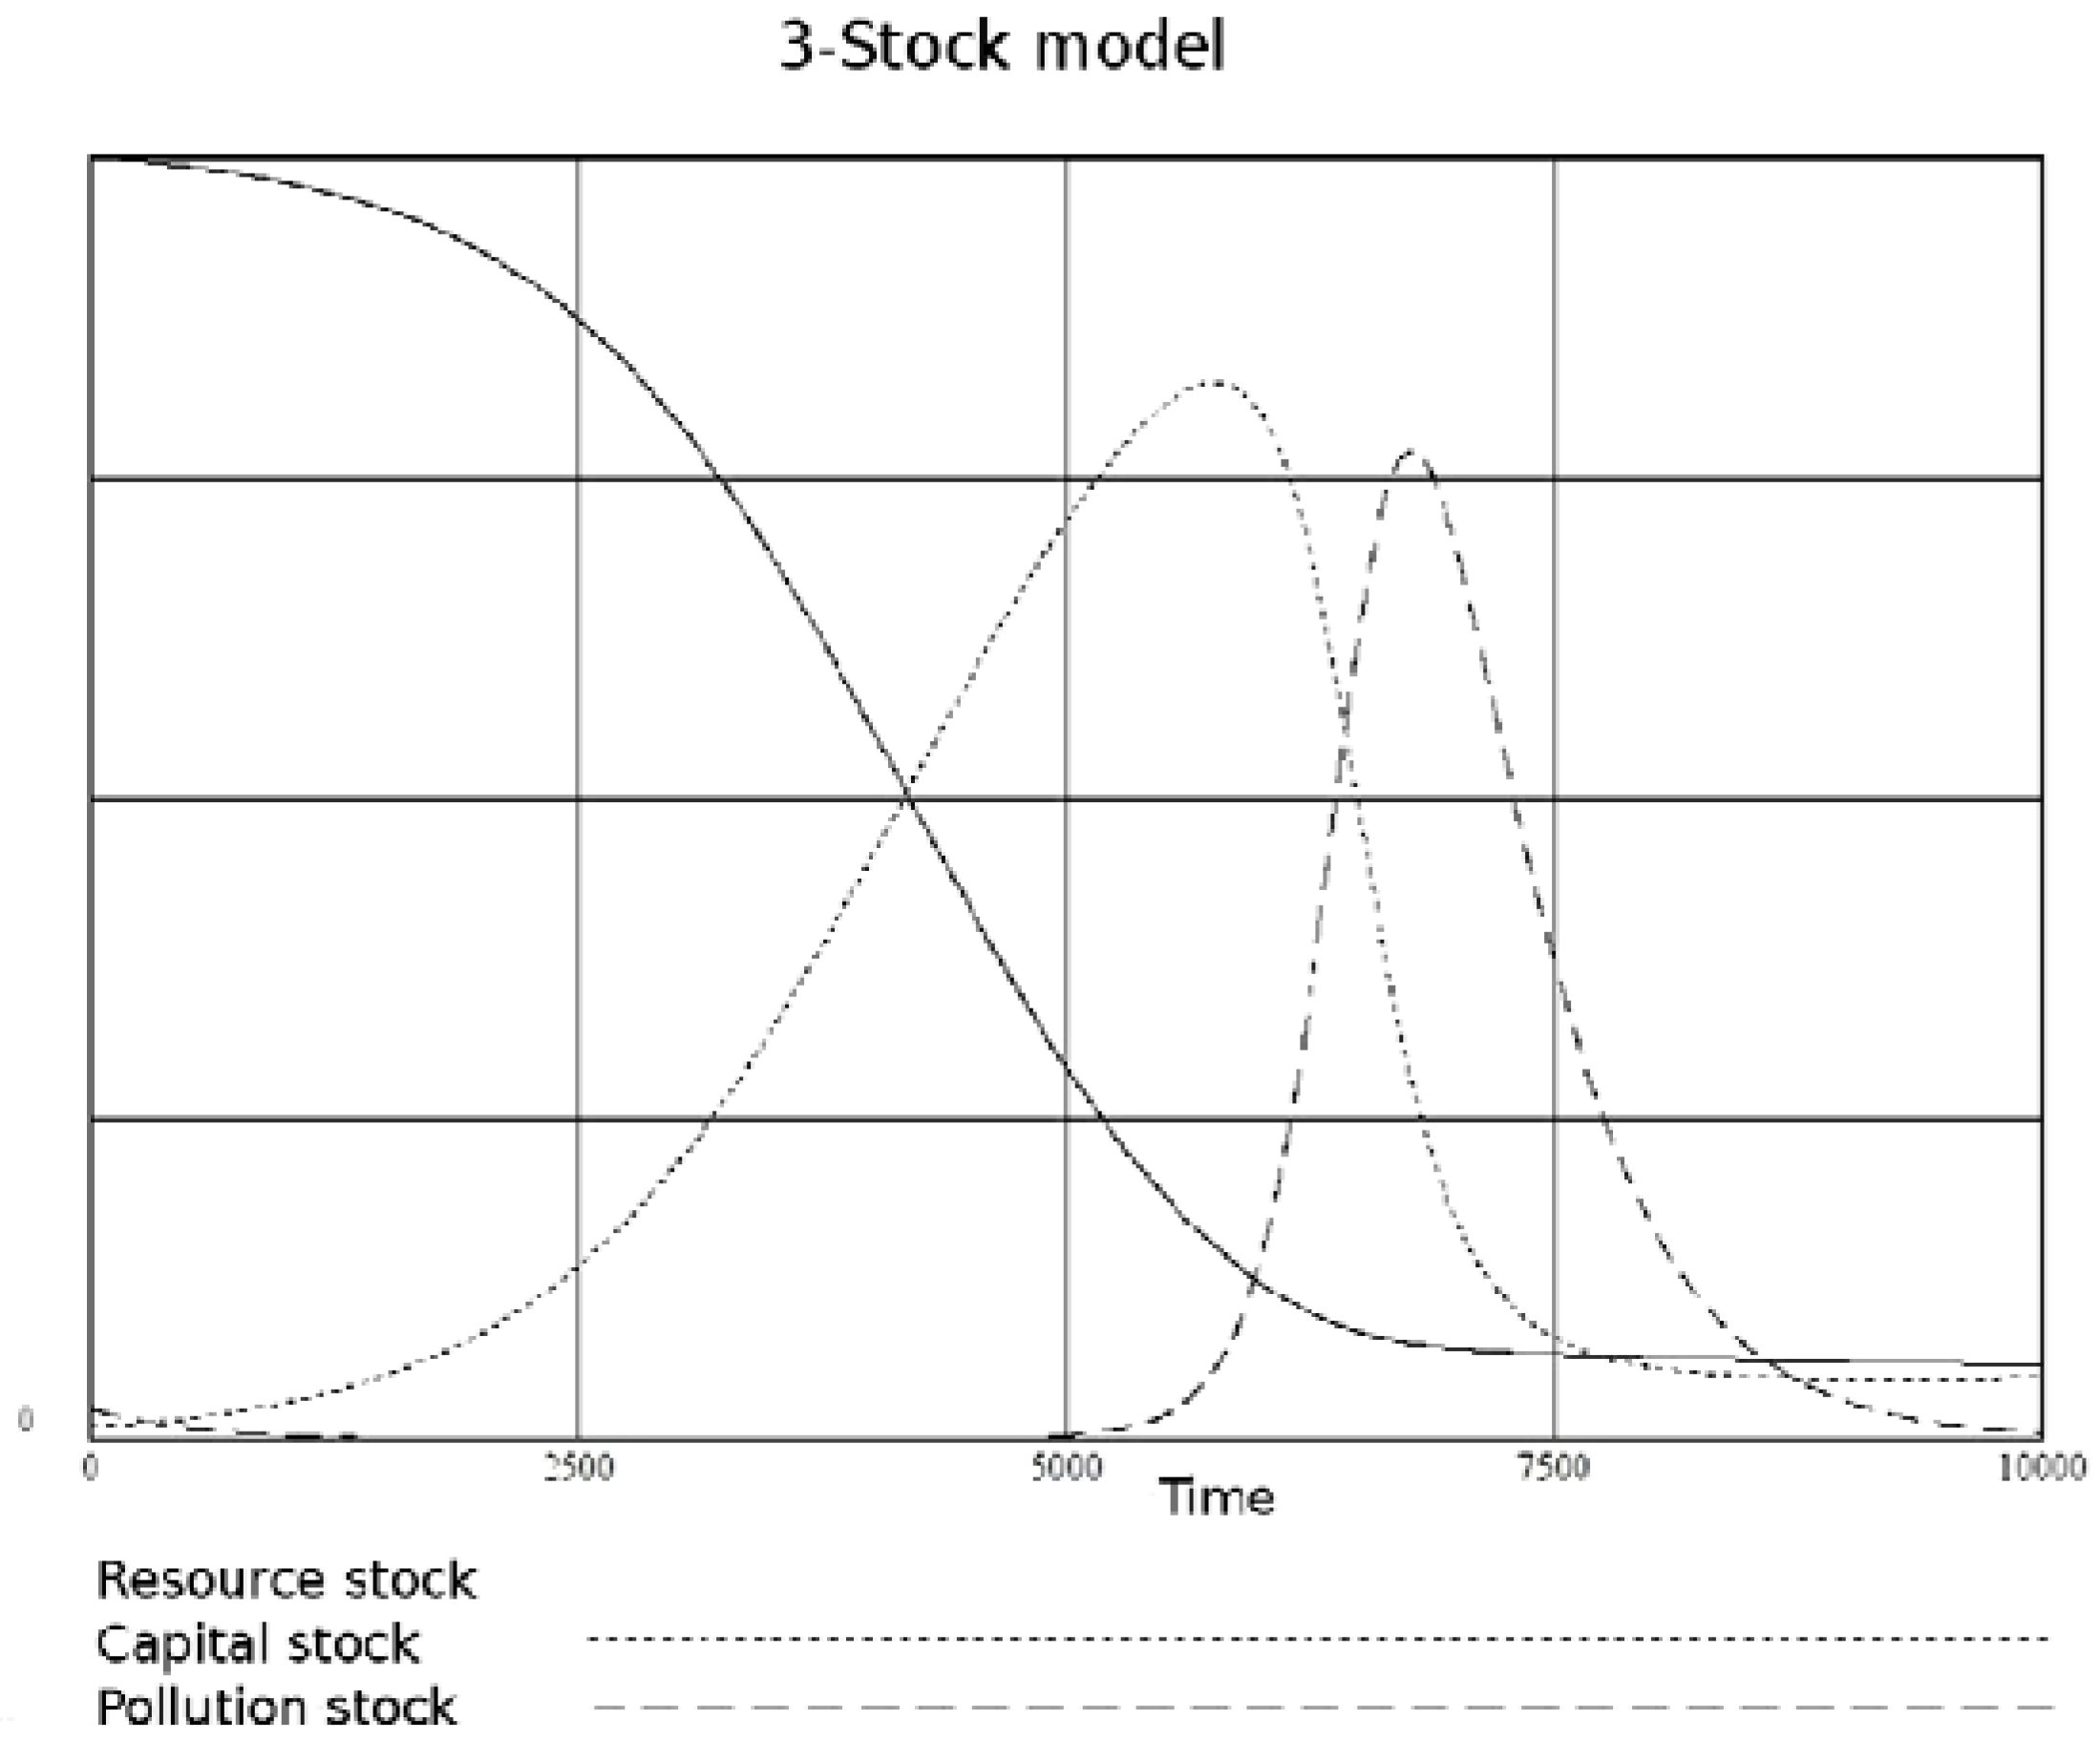
As one would expect, the three-stock model produces results similar to the two-stock one, that is, the gradual dissipation of the initial potential in three stages, where the stocks first are filled up and then emptied following a bell-shaped curve. In this case, however, the model often (although not necessarily) produces asymmetric, forward-skewed curves (
Figure 7). It is this asymmetry leading to a rapid collapse after a slow growth, that prompted the author to name the model after the Roman philosopher Lucius Annaeus Seneca who, in his “Letter to Lucilius,” stated that “increases are of sluggish growth, but the way to ruin is rapid.”
Figure 7.
A typical behavior of the Seneca model. k0 = 0, k1 = 0.117, l2 = 0.75, l3 = 0.0021, Resources (init) = 1, Economy(init) = 10−4, Pollution(init) = 10−4.
Figure 7.
A typical behavior of the Seneca model. k0 = 0, k1 = 0.117, l2 = 0.75, l3 = 0.0021, Resources (init) = 1, Economy(init) = 10−4, Pollution(init) = 10−4.
In the three-stock model, the stocks can be labeled as “resources”, “industrial capital” and “pollution” (or “externalities”). Hence, we see that, although simple, the model has much in common with the five-stock model of “The Limits to Growth” and, indeed, it leads to similar results, at least qualitatively. In both cases, we observe that the production curves are bent forward, leading to a collapse that occurs faster than the previous growth. This result is qualitatively understandable. As we said, the model is similar to the simpler two-stock (or “Hubbert”) model but, in this case, the “externalities” stock acts on the capital stock and causes it to deplete faster. As a result, the economy collapses more rapidly than it does in the simpler model.
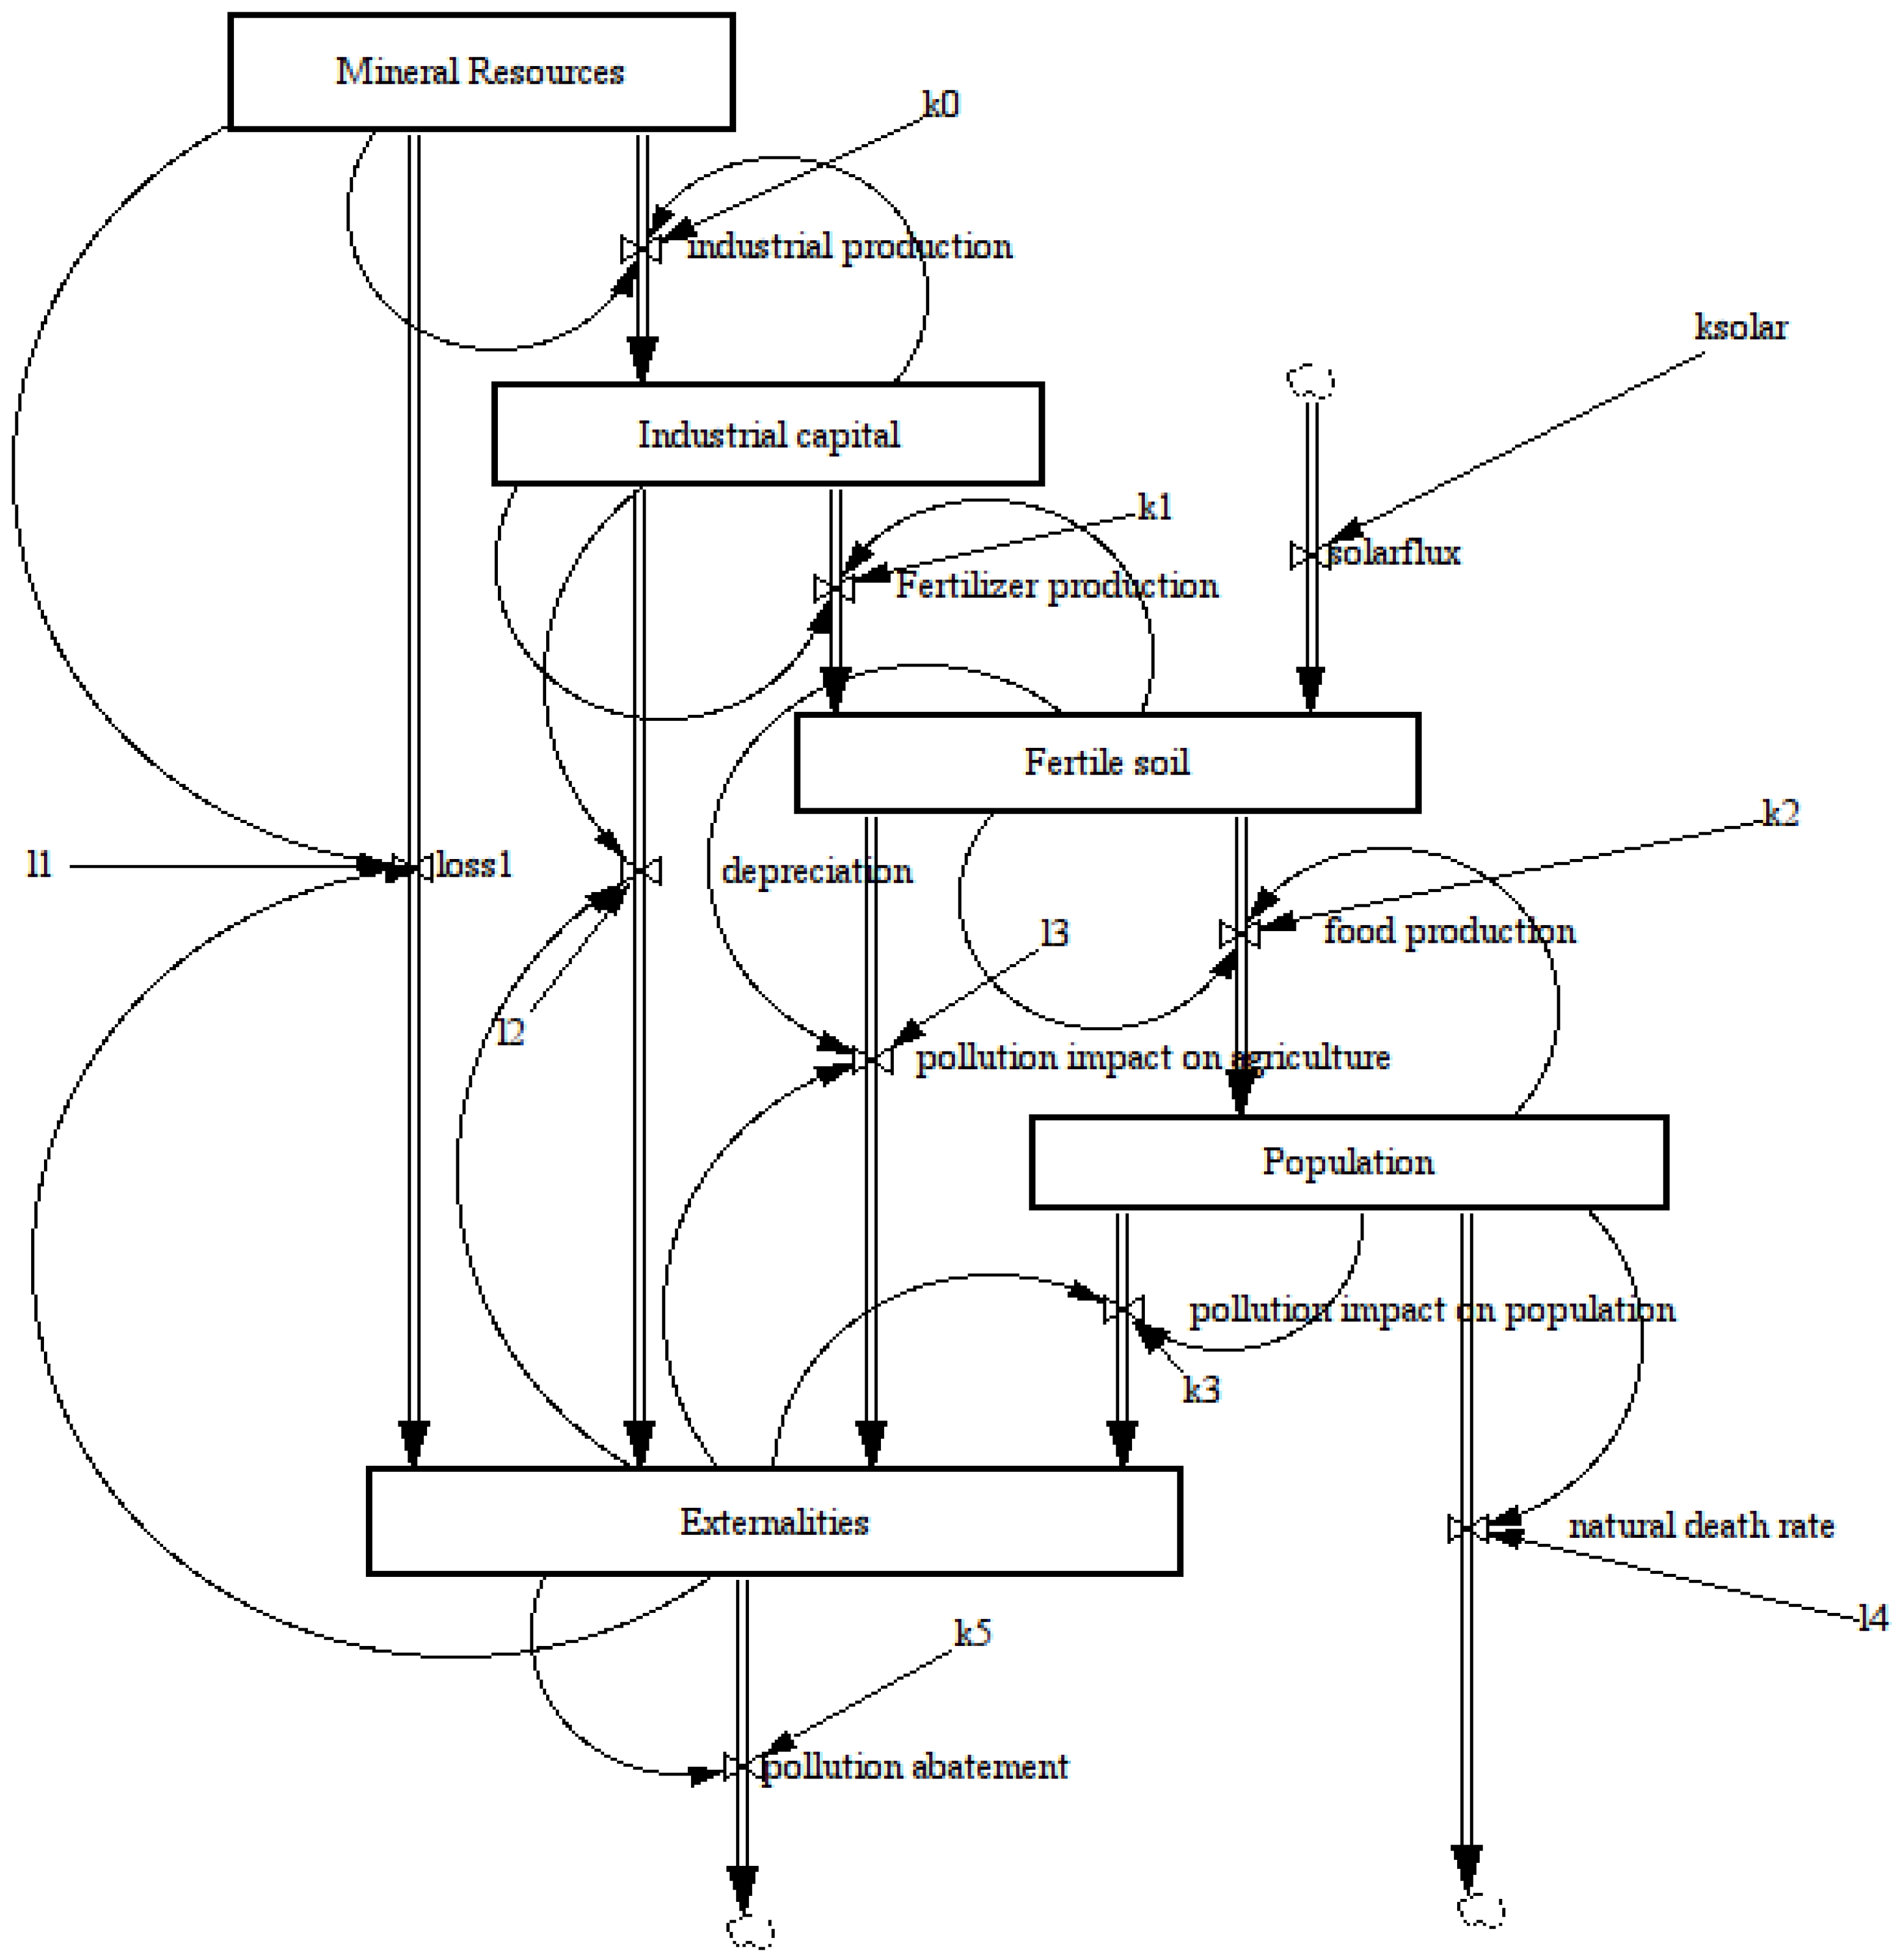
3.4. The Multi-Stock Model: Five Stocks
Multi-stock models can be built simply by adding more stocks arranged as identical building blocks. Here, I describe a model built as a qualitative interpretation of the World3 model used in “The Limits to Growth” (
Figure 8).
The model shown here is only one of the several possibilities of arranging stocks in such a way to generate a simplified graphic version of the original “World3” model. It is not supposed to provide a quantitative replication of the results of the World3 model, but only as an exercise in “mind sized” model building. That is, it is thought as an illustration of the logic of the arrangement of the elements in a dynamical model that attempts to reproduce the main physical factors that move the world’s economic system within the planetary ecosystem.
Figure 8.
The five-stock model, or the “Limits to Growth” model.
Figure 8.
The five-stock model, or the “Limits to Growth” model.
The system is assumed to be driven by an initial stock of mineral resources, supposed to be fully non-renewable. These resources are extracted and processed in order to produce a stock of industrial capital. Part of this capital is used to produce fertilizers that generate a stock of fertile soil. This stock is partly renewable, that is, regenerated by a continuous influx of sunlight. The population stock is generated by the availability of fertile soil, which is assumed to be proportional to food production. In turn, population decays as an effect of pollution and of the natural death rate. Finally, all stocks are affected by the “externalities” (or “pollution”) stock, which tends to drain them in proportion to their size.
In the following Figure (
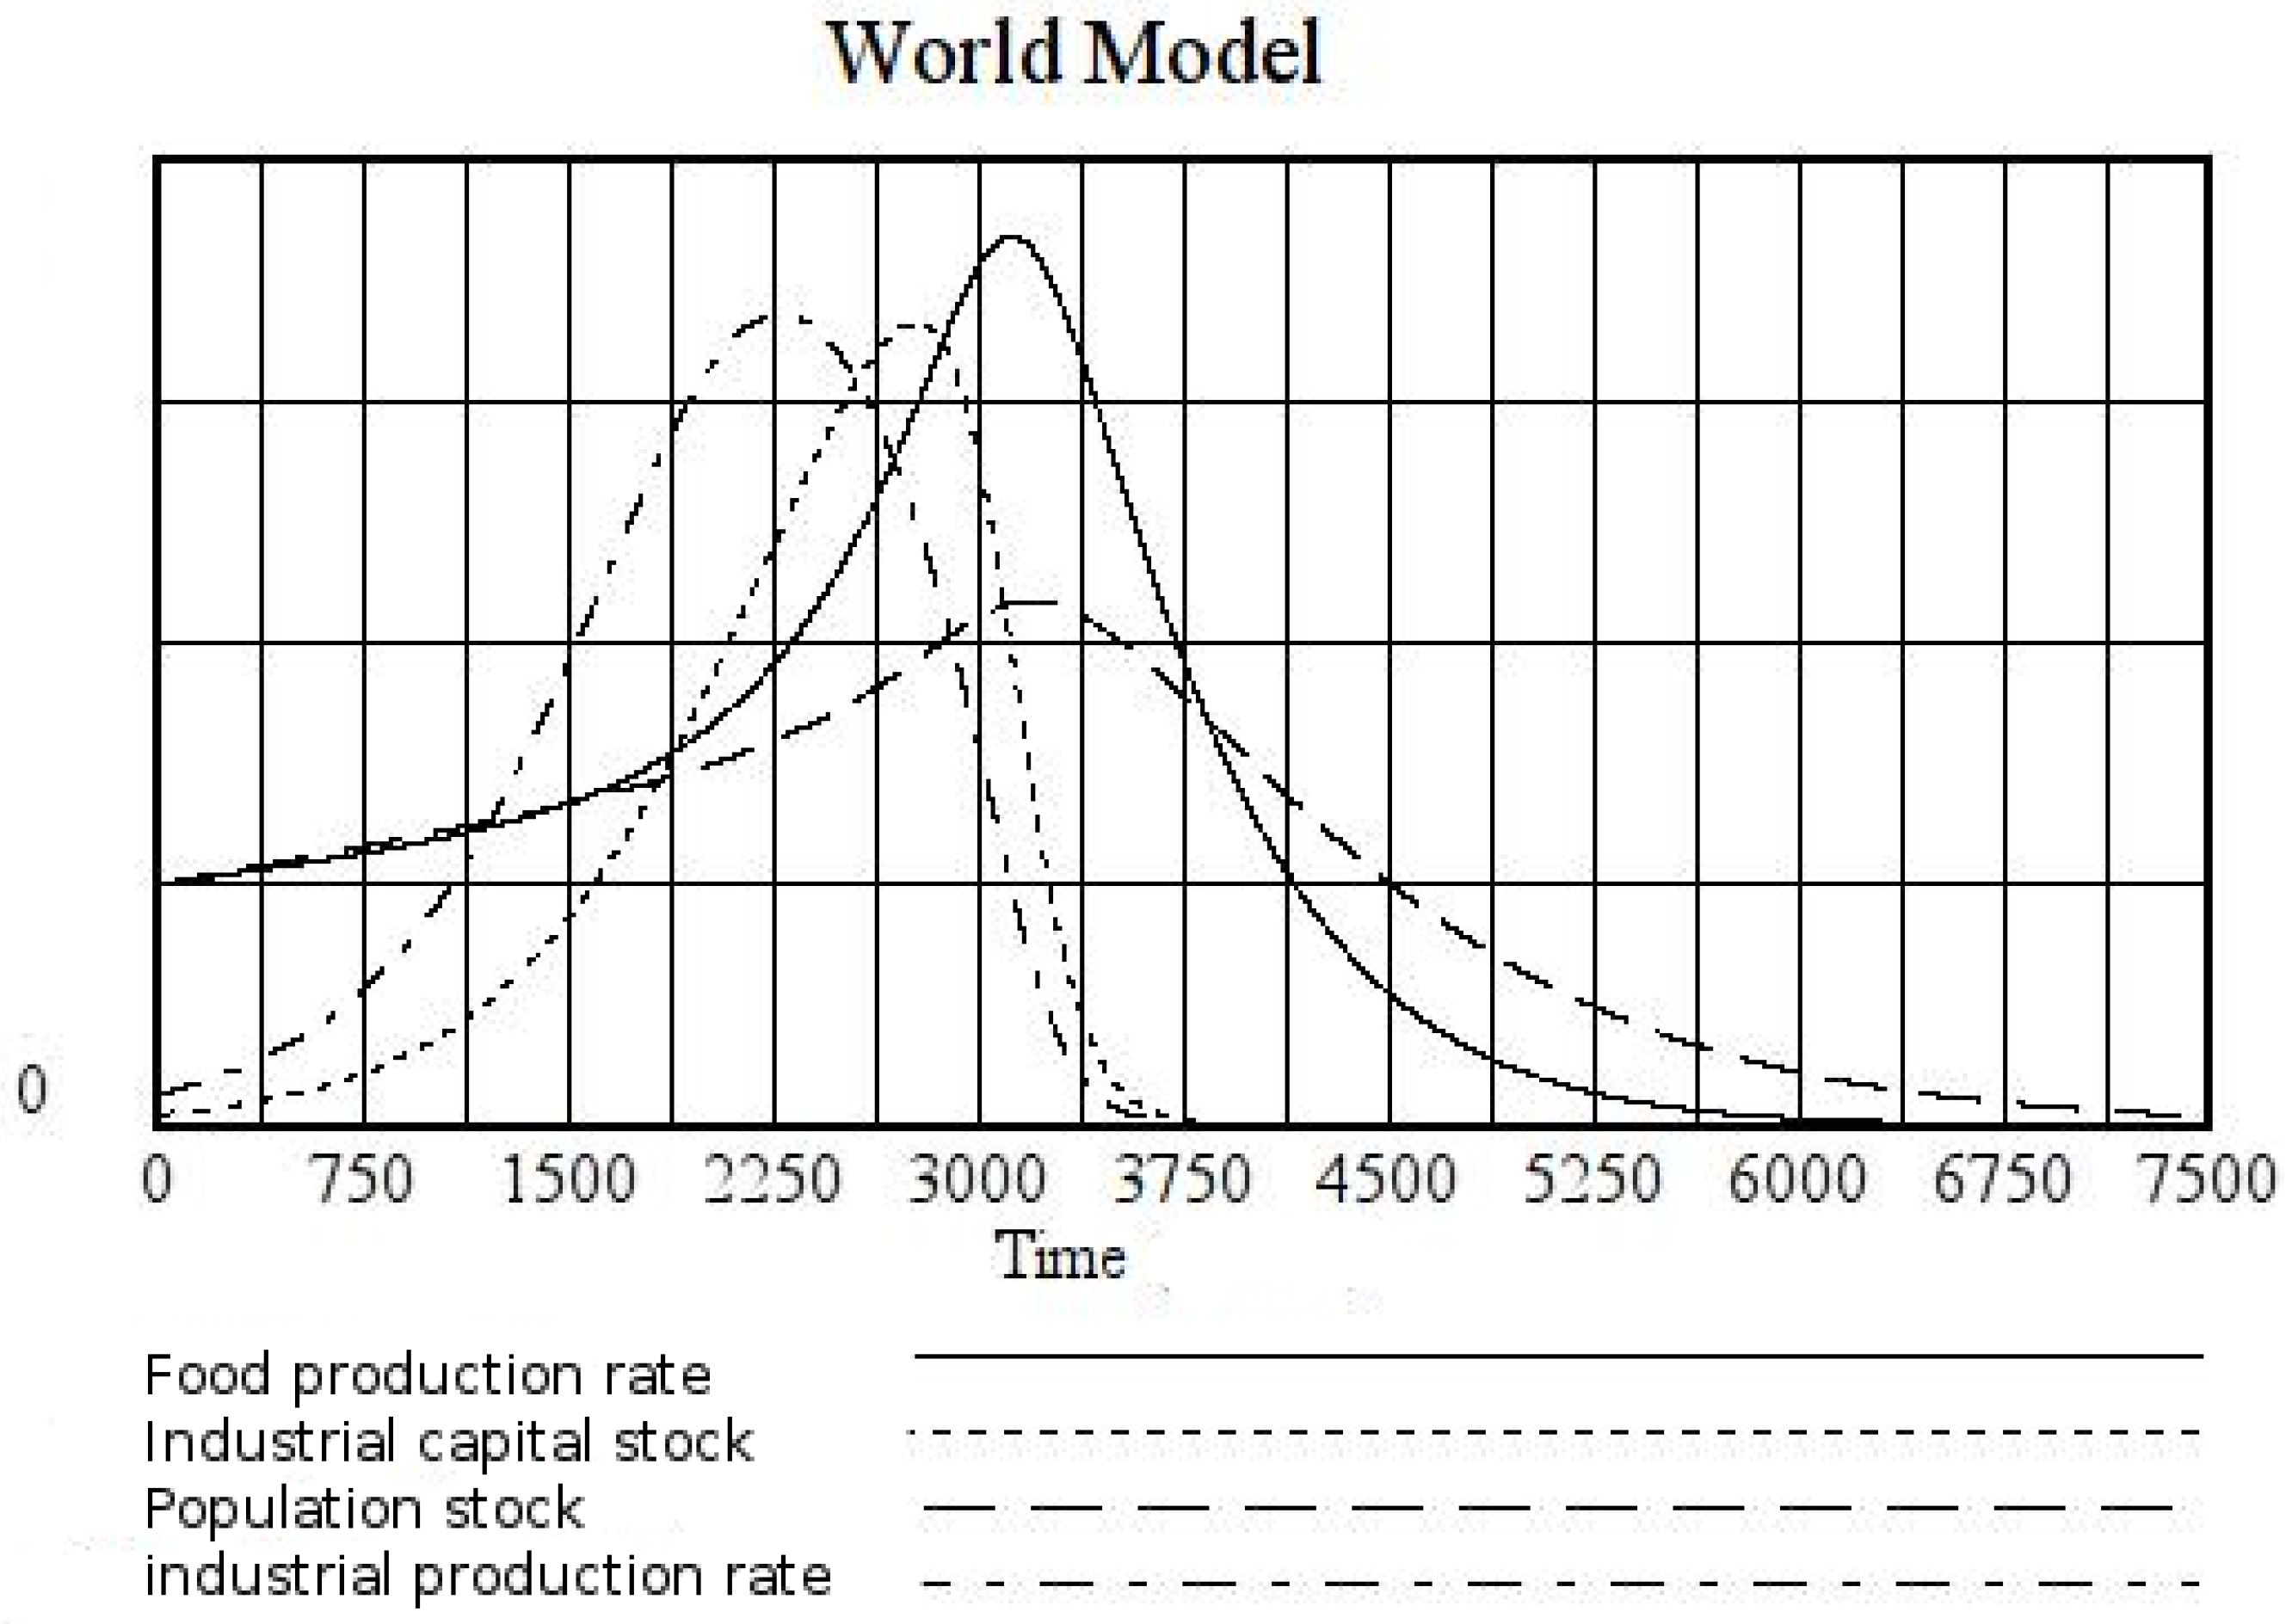
Figure 9), typical results of this model are shown. For simplicity, in this run, pollution abatement and sunlight are assumed to be negligible. The final result is qualitatively similar to the various runs of the World3 model reported in the various editions of “The Limits to Growth”.
Figure 9.
The five-stock model, typical results (this run was obtained with the following parameters: k0 = 2 × 10⁻³, k1 = 1 × 10⁻³, k2 = 5 × 10⁻², k3 = 1 × 10⁻³, l4 = 3 × 10⁻⁴. All the other constants are set to zero. Mineral resources(init) = 1, industrial capital(init) = 1 × 10⁻², fertile soil (init) = 1 × 10⁻², population (init) = 1 × 10⁻³, externalities (init) = 1 × 10⁻⁴.
I would like to reiterate that this model does not pretend to substitute the World3 model, nor does it attempt to generate quantitative results. It is presented here only to demonstrate how such a model could be built as an arrangement of simpler building blocks that show at least some elements of a “mind sized” structure.
3.5. Quantifying the Results
For the models described here, the comparison with historical cases can be qualitative or quantitative. As mentioned earlier on, the one-stock model can be seen simply as restatement of known laws of physics—it could easily be used for the quantitative discussion of simple physical systems, but it would bring no advantage in comparison to the usual methods.
The multi-stock models, instead, are non-linear systems that can be compared to complex systems belonging to the real world. The simplest one, the two-stock model is equivalent to the well-known Lotka–Volterra (LV) model. It is interesting to note that the LV model, despite having been presented to generations of biology students, finds almost no quantitative verification in the real world of biological systems, except for some limited cases of laboratory systems, such as bacteria in a Petri dish [
13]. Evidently, the ability of the LV model to qualitatively catch the behavior of biological systems is considered sufficient to diffuse it as a cornerstone of population dynamics in biology, despite the lack of quantitative validation.
With economic systems, instead, the “two-stock” model (equivalent to the LV model) does describe real-world systems. In a recent study [
10], it was shown that the model could
quantitatively describe a number of historical cases of economic systems based on the exploitation of non-renewable or slowly renewable resources. Among these systems, we have gold mining, whaling in the 19th, century, and oil extraction in some of the world’s regions. In these cases, the first stock describes the amount of available resources, and the second stock, the “capital” generated by the exploitation (the gold mining industry, the whaling industry, the oil industry,
etc.). This quantitative description could be obtained by a curve fitting procedure where the input parameters were varied until the best fit with the historical data was obtained. The procedure was found to generate unique sets of “best fit” parameters for each model.
Going to more complex models, we face problems with this approach. If we consider the three-stock model (termed here also the “Seneca model”), so far, it has not been quantitatively fitted to historical data, but from a qualitative viewpoint, we find some examples of asymmetric, forward-skewed production curves, such as in the production of Caspian sturgeon [
14]. It is likely that it will be possible to describe the historical data by a curve-fitting procedure similar to the one used in [
10] for the two-stock system, However, the experience with the two-stock model shows that a quantitative fitting is complex and it becomes difficult to manage already with a small number of parameters. It is not known, at present, if it would be possible to find unique sets of parameters for these more complex systems. There are, therefore, limits to this approach, especially if we consider the possibility of applying it to a multi-parameter system as was the “five-stock” model described here as potentially equivalent to the World3 model used for the LTG studies. That does not mean that multi-stock models cannot describe the real world. Indeed, the World3 model has correctly described the behavior of the real-world variables up to now. It remains to be seen how well it will continue to do so in the future, but it is clear that the model does catch some fundamental elements of the world system.
These considerations highlight several fundamental points that have to do with the modeling of complex, non-linear systems. Already with the first edition of LTG, in 1972, it had been remarked that the purpose of the model was not “prediction”, intended as the common meaning of the term. In general, the future cannot be predicted—but it can be understood. Thus, if a model has to help human minds in understanding the future, a fundamental factor is that it must be testable on a real-world system. The results obtained for the two-stock model on an economic system that went through a complete exploitation cycle of mineral or biological resources (10) gives us confidence that “mind sized” models can be trusted as tools for understanding what the future may have in store for us.
