Article

Environmental Attitudes and Environmental Behavior—Which Is the Horse and Which Is the Cart?

1
School of Education, Institute of Sustainability and Innovation (ISI), Victoria University, P.O. Box 14428, Melbourne, Victoria 8001, Australia
2
Faculty of Architecture and Town Planning, Technion—Israel Institute of Technology, Technion City, Haifa 32000, Israel
*
Authors to whom correspondence should be addressed.
Sustainability 2012, 4(9), 2210-2246; https://doi.org/10.3390/su4092210
Submission received: 13 August 2012 / Revised: 3 September 2012 / Accepted: 3 September 2012 / Published: 14 September 2012

Abstract

:
The present article challenges the prevailing perception in the field of environmental education that acquisition of environmental behavior is an ultimate goal of the educational process, in comparison to acquisition of environmental attitudes, which is perceived as a minor goal. The article presents a compilation of results obtained from two studies that shed new light on the relationship between influences on environmental attitudes and influences on environmental behavior. The results suggest that: (a) among adults, the strategies required for influencing attitudes are different from those required for influencing behaviors; (b) the mechanisms for achieving influence among children are different from those among adults; and (c) conventional educational approaches, such as behavior modification, can influence behavior more easily than they can influence attitudes. The results provide grounds for questioning the prevailing belief that individual acquisition of responsible environmental behavior can drive changes on the global political scale. We suggest increasing the focus of environmental education on construction of attitudes.

1. Introduction

Throughout the 1980s and 1990s, the relationships between acquisition of environmental attitudes and acquisition of environmental behavior were a topic of much research and debate in the field of environmental education (e.g., [1]). Early models of environmental education, beginning in the 1970s, assumed some type of linear relationship between attitudes and behavior, where: (a) positive attitudes lead to positive behavior [2,3]; and (b) positive behavior is perceived as an ultimate goal of environmental education [1,4,5,6,7,8,9,10]. Through continuous research, the linear model of relationships was discredited (e.g., [11,12,13,14,15,16]). Yet, while the idea of a linear progression has subsided, the perception of acquisition of environmental behavior as an ultimate goal of the educational process has maintained a strong hold in the environmental education community [17,18].
The turn of the century and the new millennium saw a shift in the focus of environmental education research. The traditional emphasis on predefined educational outcomes gave way to emphasis on open-ended processes in which the goals of education are not predetermined [19,20]. This shift can probably be attributed to the combination of relatively poor results of the old approaches together with paradigm shifts in environmental education. New research trends emphasize development of systems thinking, resilience, and other emerging ideas (e.g., [21,22]).
In abandoning the old model, which is now perceived as simplistic, many researchers also abandoned questioning the goals of environmental education. In this sense, to some degree, ‘the baby was thrown out with the bath water’. In other words, whereas the old model’s first assumption (regarding the linear and causal relationship between attitudes and behavior) was examined and disproved, the other assumption (regarding the greater importance of behavior over attitude) was to a certain extent taken for granted and left to linger on as a living fossil.
The present article aims to re-open the study of the relationships between processes of influence on environmental attitudes and on environmental behavior, as well as to question the taken-for-granted approach in which acquisition of environmental behavior is perceived as a ‘higher’ and more desired achievement compared with acquisition of environmental attitudes. The article analyzes these open questions in environmental education by employing different approaches and methodologies from previous research regarding these issues.
The present article puts forward the following claims:
  • • The influence of environmental education is composite and multifaceted. The same sources of influence will influence children and adults in different ways, and among adults—the strategies required for influencing attitudes differ from those required for influencing behavior;
  • • The separation between influences on environmental attitudes and influences on environmental behavior gradually develops with maturation;
  • • Conventional strategies commonly applied by formal school education and by the media can influence the behavior of students’ parents more easily than they can influence their attitudes. A comparison between formative influences on behavior and formative influences on attitudes reveals that the educational strategies required for successfully influencing adults’ attitudes are more complex than those required for influencing their behavior;
  • • Accumulating evidence suggests that there is a need to re-evaluate the status of achieving behavioral change as an ultimate goal of environmental education and to reconsider the status of attitudinal changes as an important goal of environmental education.
To support the above claims, the article will present a compilation of results obtained from two different studies using different methodologies. The following theoretical background provides the foundations for the two studies and for the analysis of their results.

2. Theoretical Background

The relationships between attitudes and behavior have been a matter of debate in psychological and sociological research for decades, with thousands of studies addressing various aspects of these relationships. In the field of environmental education research, however, there has been relatively much less investigation and, as mentioned above, aspects of the relationships between attitudes and behavior have to some degree been taken for granted. In what follows we provide an overview of these relationships, with an emphasis on the complexity involved in the development of attitudes.

2.1. Definition

2.1.1. Defining “Attitude”

The term “attitude” has been defined in various ways. Following are three definitions proposed in the literature:
  • • An enduring combination of motivational, emotional, perceptual and cognitive processes with respect to some aspect of our environment [23];
  • • Learned predisposition to respond in a consistently favorable or unfavorable manner with respect to a given object [24];
  • • A person’s overall evaluation of persons (including oneself), objects, and issues [25].
The presented studies focus on attitudes towards environmental issues.

2.1.2. Defining “Behavior”

The term “behavior” is mostly intuitively understood and most psychological and sociological research into behavior has not suggested definitions of the term. However, in the context of the present studies, we understand the term as any active responsiveness to current environmental issues, believed to be pro-environmental by the person performing the response.

2.2. The Environmental Education Perspective

The most widely accepted notion among scholars in the field of environmental education is that the ultimate goal of environmental education is to influence behavior and to develop active citizenship [1,5,9,26,27,28,29,30].
Environmental attitudes are commonly perceived as preconditions for achieving environmental behavior. Hines and colleagues [1] conducted a meta-analysis of the relationships between pro-environmental attitudes and behavior. They viewed ‘intention to act’ as a determinant of pro-environmental behavior. ‘Intention to act’ itself was described as a composite factor, composed of attitudes among other variables. Bamberg and Moser [31] repeated the meta-analysis of Hines et al. [1] on a larger and more up-to-date sample of studies and reached similar results. Such findings led many researchers to perceive attitude acquisition as a ‘step along the way’ towards acquisition of environmental behavior [5,7,32,33,34].
For example, in a 1993 survey that was held in 22 countries, Dunlap and colleagues [35] found high levels of environmental attitudes and low levels of environmental behavior. Chawla [32] refers to Dunlap et al.’s findings as indicating low achievement in environmental education since “it is ultimately people’s actions that make a difference” (p. 367). Marcinkowski [18], who developed a General Logic Model for Resource Education Programs, refers to influences on attitudes as an ‘outcome’, whereas influences on behaviors are regarded as ‘impacts and benefits’. In Hungerford and Volk’s [5] model of variables involved in environmental behavior, the variables ‘environmental sensitivity’ and ‘attitudes’ are regarded as ‘entry-level’, implying that these factors constitute no more than basic prerequisites that are insufficient for a comprehensive environmental education.
The important role of acquisition of environmental behavior is often explained by the assumption that changes in environmental behavior on a personal level can lead to changes in sustainability on a societal level. In other words: if everyone behaves responsibly with environmental sustainability in mind, the society will perform sustainably. Coyle [36], in his 2005 report regarding results obtained from 10 years of NEETF/Roper surveys of environmental literacy in the U.S., demonstrates this claim with the following words: “With nearly 300 million people living in the United States, small changes in behavior can have a huge impact” (p. 33). He also states that “[m]any of today’s leading pollution problems are increasingly the result of individual actions…”, thus implying that environmental sustainability is a linear additive effect of behaviors.
The above reasoning, which underlies the goals of environmental education, can also be found in official documents referring to the goals of education for sustainable development. For example, the UN Decade of Education for Sustainable Development implementation scheme puts forward the claim that “ESD aims to move us to adopting behaviours and practices which enable all to live a full life without being deprived of basics” ([37], p. 4). A possible interpretation of this statement is that if behaviors change on a personal level, they will lead to a change on the overall level.

2.3. Beyond Environmental Education

Beyond the environmental education literature, investigations into the nature of the relationships between attitudes and behavior date back as far as the 1930s. In 1934, LaPiere [38] published results of an empirical study in which a Chinese couple entered 251 businesses, such as hotels and restaurants, in the United States and asked for service. They were refused service only once. Half a year later, in response to a letter from LaPiere, 118 of the 128 businesses that responded claimed that they would not accept members of the Chinese race as customers. LaPiere concluded that attitudes could be easily and quantitatively measured but were largely irrelevant to the prediction of behavior. The findings of LaPiere were reiterated in further studies. In 1969, Wicker [39] published a review of 47 empirical studies of attitudes and behavior. His conclusion was that attitudes rarely account for more than 10% of the behavioral variance, and therefore attitudes are “unrelated or slightly related to overt behaviors” ([34], p. 65). A later meta-analysis by Kraus [40] showed more complex relationships between the variables. The conclusion of 88 attitude-behavior studies was that from a theoretical perspective, attitudes significantly predict further behavior. At the same time, it was also concluded that the ability to actually predict behavior on the basis of attitudes is in effect very low due to a combination of reasons. The first is the relatively low mean correlation that was found between the two variables (r = 0.38). Another major obstacle is that moderating effects of various types were found to be significant intervening variables to the extent that they acted as predicting variables themselves. Various studies have aimed to identify the moderating effects that can predict behavior. Petty and colleagues [41] claimed that the common finding of the various studies was that attitudes that are based on high amounts of issue-relevant thinking are more likely to influence behavior. By the mid-20th century, research regarded behavior as an outcome of situational rather than dispositional influences [41,42,43].
Research regarding influence processes on attitudes indicates that strong attitudes are more stable over time and have a larger impact on behavior compared with weak attitudes [44]. Strong attitudes can be identified by their extremity [45], by their accessibility (e.g., [46]), and by the confidence of the attitude-holders [47]. A wide variety of variables can influence the development of strong attitudes. Such variables include extensive issue-relevant thinking [41,48], a heritable component [49], and a consistent and organized belief structure [50].
Attitudes have often been described as having an affective component and a cognitive component [40]. Disinger and Tomsen [51] perceive attitudes as being closely related to the term “worldview” that was discussed by Norton [52]. According to Norton, “the axioms of a worldview, while often inexplicit and hidden, represent rock-bottom commitments that the holders of a worldview would eventually cite as supporting the larger edifice of their beliefs…” ([52], p. 75). At the same time, worldviews are dynamic and changeable. They are constructed and reconstructed by the influences of knowledge and new experiences [51,53].
Various models have been proposed for explaining processes that influence attitudinal change. The Elaboration Likelihood Model of attitude change [25,54] provides a theory for explaining the processes through which attitudes and the strength of those attitudes can change [25]. Other explanations include the following: (i) interaction between attention, comprehension, learning, acceptance, and retention of the message and its conclusion [55]; and (ii) a mere exposure effect [56,57]. It is now accepted that influential processes on attitudes involve complex processes and complex effects [25].
From a theoretical perspective, the theory of cognitive dissonance, which was introduced by Festinger [58], provides a basis for understanding the relationships between attitudes and behavior. Contrary to the accepted notion that in order to change people’s behavior there is a need to first change their attitudes, the theory postulates that if one induces a person to change his or her behavior, an attitude change will follow in order to fit the new behavior. Because behavior is usually difficult to undo, dissonance can be reduced by changing beliefs and attitudes to bring them in line with the behavior (i.e., convincing oneself that the behavior reflects one’s true position). This prediction was confirmed by repeated laboratory tests [59,60,61,62,63]. In the most famous dissonance experiment, students at Stanford University engaged in a rather boring task of turning pegs on a board, and then were induced to tell a waiting subject that the task was interesting, in exchange for either a sufficient ($20) or an insufficient ($1) incentive. When later asked how interesting they actually found the task to be, students reported that the task was more interesting the less they were paid [62]. Evidence suggests that attitudinal changes that are induced by behavior are relatively enduring [25].

2.4. Influencing Children versus Influencing Adults

Various studies have examined the effect of age on attitudes’ susceptibility to influence. Children were found to be more open to suggestion (e.g., [64,65]). Other research has indicated that attitude stability is greater among older individuals than among younger individuals (e.g., [66]). There is an indication that people generally become less susceptible to influence as they grow older (e.g., [67]). There is currently no theory regarding the mental processes that drive such changes in susceptibility or regarding the characteristics of these changes.
The following studies examine processes of influence on environmental attitudes and on environmental behavior. The first study examines differences in the processes by which environmental schools influence students versus students’ parents. The second study examines how various formative environmental experiences interact to influence adults’ attitudes and behavior. The second study also analyzes the role of the environmental school as a formative influence on students’ parents. The compilation of the results provides new insights into the relationship between attitudes and behavior with regard to environmental education.

3. The Studies

Two separate studies were carried out by the authors, in Israel. The aim of the first study, which was conducted in the years 2007–2009, was to evaluate the influence of environmental schools on their communities. The aim of the second study, which was carried out in the years 2009–2010, was to assess how various formative experiences influence the environmental attitudes and behaviors of adults in Israel. For the purposes of the two studies, we define an ‘environmental school’ as a school with an environmental education program that was in place for at least two years prior to the beginning of the studies, and that is certified as a ‘Green School’ by the Israeli Ministry of Environmental Protection.
The two studies were seemingly unrelated. They posed different research questions and employed different methods of analysis. Yet, they yielded similar results regarding the relations between influences on environmental attitudes and influences on environmental behavior. The present article will refer to these joint insights by presenting relevant analyses and results from the two studies.
Following are presentations of the methods, results and conclusions of each study separately. The subsequent discussion section will highlight results of both studies in compilation.

3.1. Study 1: Evaluation of Environmental Schools’ Influences on Their Communities

3.1.1. Research Objectives and Background

Environmental schools can influence parents’ attitudes and behavior by two major paths, as follows: (a) directly, through activities that involve parents and correspondence with them; and/or (b) indirectly, through intergenerational influences of students who internalize their learning and pass it on to their parents [30,68,69,70,71,72,73,74,75]. Therefore, when examining the impact of environmental schools, it is important to look at both direct and indirect influences.
Twelve indicators were developed for evaluating the influence of environmental schools on students and on their parents [73]. The indicators assessed aspects of schools’ direct influences and of their indirect influences through intergenerational influences and intra-generational influences. We studied the following aspects of influence: influence on sustainability agenda; influence on attitudes; and influence on behavior.
The key characteristics of the applied methodology employed relative comparisons of various variables. We compared children to schools’ programs and we compared parents to schools’ programs and to the children. Relative comparisons enabled us to identify flows of influences from within the web of influences that are operative in the system. In the real world of environmental education, influences flow at multi directions from various sources. It is unlikely to find one influence source operating in a cause-effect linear way. Being a nonlinear and complex system a pre-post testing methodology is inappropriate, as there is no way of isolating variables and controlling them. By developing a set of indicators that are capable of characterizing the system and by employing comparative analyses and cross validations analyses between the 12 indicators, we were able to present valid conclusions regarding the schools’ influences on parents and on children in the aspects of agenda, attitudes and behavior.
Herein we present the analyses of the 4 indicators (out of 12) that provided information relevant to claims put forward in the present article. We note that the results of these analyses form part of a broader matrix that is structurally built to provide a comprehensive evaluation. Within this larger framework, no one indicator stands alone. The overall evaluation is an outcome of cross comparisons between results obtained from the various indicators. Though the four indicators presented here are removed from their larger context, their explanatory capacity is not reduced, as regards to the present context.
The following sections describe relevant components of the study: (a) participants; (b) data sources; and (c) methods of analysis, results and conclusions for each of the four indicators.

3.1.2. Participants

Six Israeli environmental schools and members of their communities participated in study 1. The study sample included principals and leading environmental education teachers, school students, and their parents. Appendix A presents descriptors of the sampled schools and communities (Table 1.1).
The schools in the sample included five elementary schools and one school with both an elementary school and a junior high school combined under one administration. Schools were chosen in accordance with the following criteria: (a) the school has an established environmental education program that has been implemented for at least 2 years; we note that the duration of implementation of the EE program varies between schools, making it possible to evaluate influences at different stages of program maturity; (b) the school is recommended by EE experts; and (c) the school is located in a medium to large city. The reason for the latter criterion is that 92% of Israel’s population lives in urban communities. Schools and their communities were chosen on the basis of whether they reflect the dominant urban lifestyle in Israel. Most of the EE schools in Israel are located in two major metropolitan areas: Haifa and Tel Aviv. The schools we chose are located in cities whose cluster membership in the socio-economic index is 6–8 (medium–high) [76]. Allocation of students to schools is done in accordance to geographical proximity.
Though the sample is representative of the Israeli urban middle class population, we assume that with appropriate verifications, the sample could also be representative of similar communities in western countries. The assumption is based on the characteristics of the participants, who are highly connected to Western cultures, often travel to these countries, and carry out business and studies outside Israel.

3.1.3. Data Sources

Data sources for the analyses presented below included written questionnaires that were handed out in each school to the school principal and to leading environmental education teachers, parents, and students. Table 1 presents a summary of the number of returned questionnaires in each school. All students in the sampled classes filled in the questionnaires during class sessions (see Appendix A, Table 1.1, column 4 for number of sampled classes at each school). Each student at the sampled classes was asked to deliver a questionnaire to one of their parents. There is no information regarding how many questionnaires were in effect delivered and how many of these were answered.
Table 1. Number of returned questionnaires by school.
School numberNumber of principals and teachers Number of students Number of parents
1414752
2310528
314716
4 22119
528036
6 6812
Total10668163

3.1.4. Methods of Analysis, Results and Conclusions, by Indicator

The following sections present analyses and results for four relevant indicators. Each analysis provides information regarding the following aspects of influence:
  • • Indicator A—Schools’ direct influence on parents’ environmental behavior;
  • • Indicator B—Schools’ direct and indirect (combined) influence on parents’ environmental attitudes;
  • • Indicator C—Schools’ indirect influence on parents’ environmental behavior through intergenerational influence; and schools’ influence on students’ environmental behavior;
  • • Indicator D—Schools’ influence on students’ environmental attitudes.
In what follows, the analysis for each indicator is presented according to the following sequence: (a) the indicator; (b) data sources; (c) methods of analysis; and (d) results and conclusions.

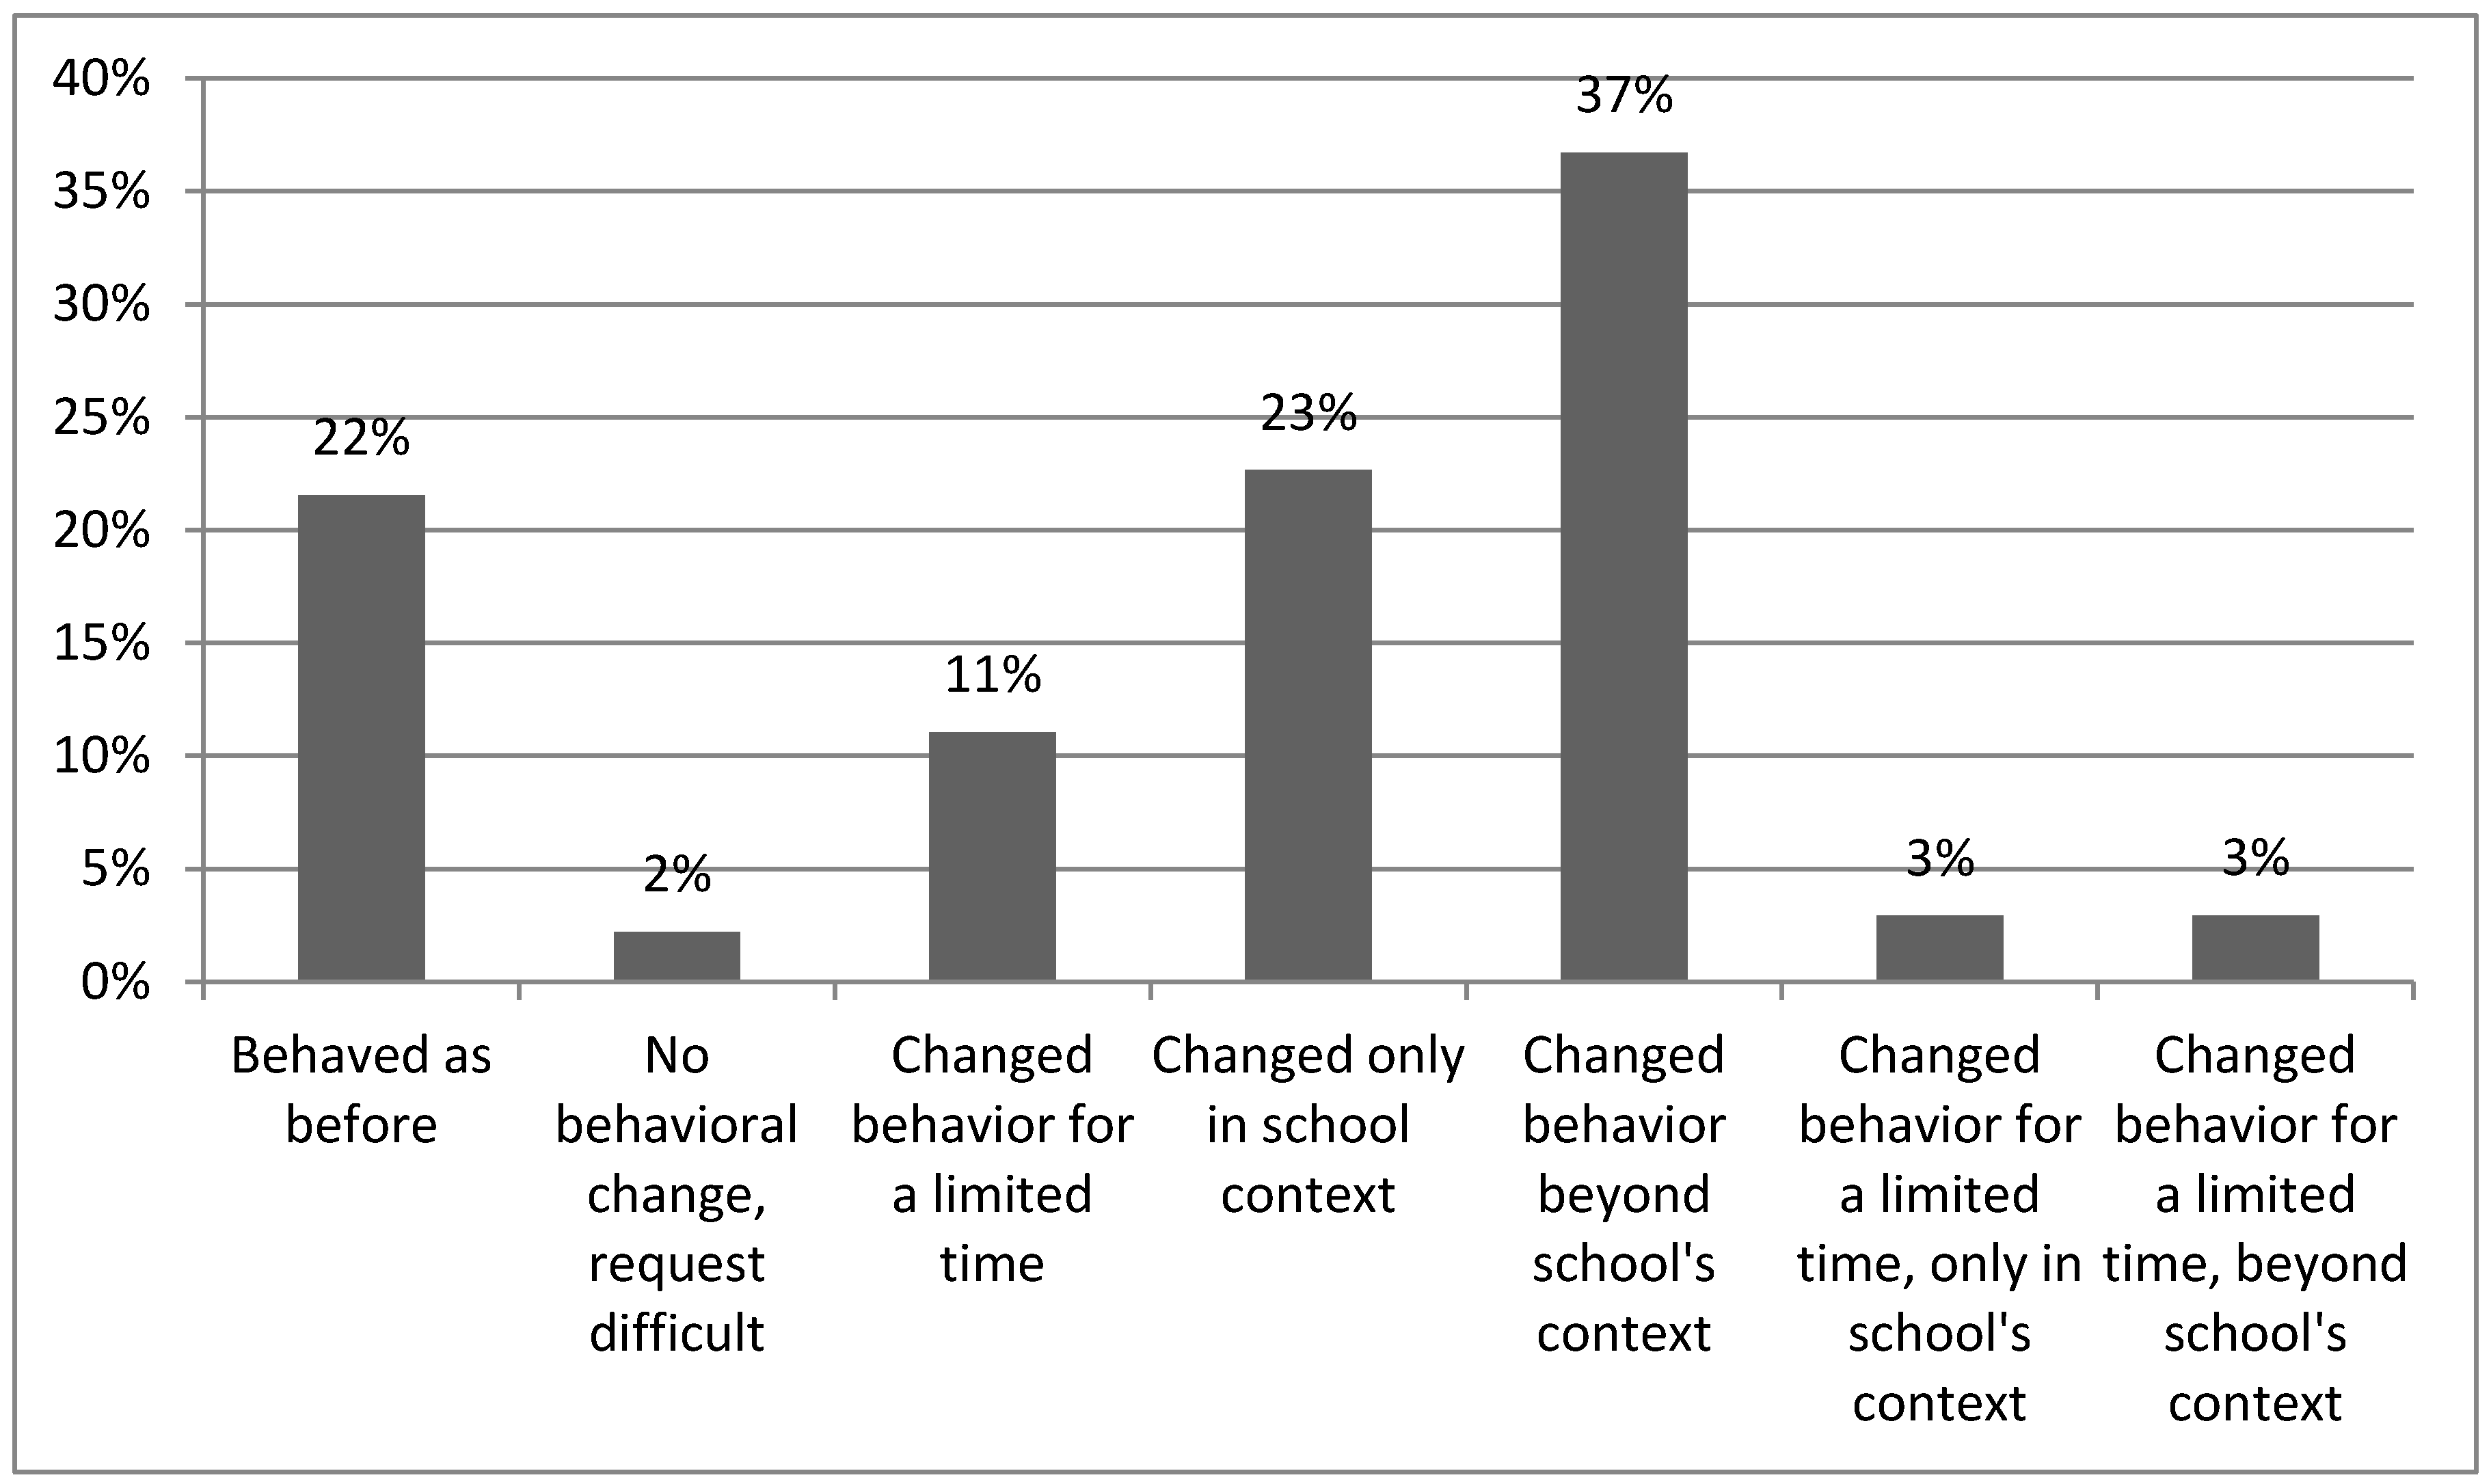
3.1.4.1. Indicator A: Degree to which Parents Adopted Responsible Environmental Behavior in Response to the School’s Regulations/Requests

The aim of indicator A is to assess the outcomes of the schools’ direct efforts to influence parents’ behaviors.
Data sources. We gathered information for indicator A by asking parents to report whether their child’s environmental school had ever asked them to comply with behavioral requests and, if so, to report regarding the effects of such requests. For verification, school principals and leading EE teachers were also asked whether they had approached parents with requests concerning environmental behavior and, if so, what the requests had been.
Method of analysis. Each of the participating schools had requested that parents comply with some behavioral requests. Typical school requests were of the following nature: Asking parents to send lunches in non-disposable packaging, send plastic bottles for the schools’ recycling bins, participate in an environmental project organized by the school (e.g., cleaning a natural site) or, prepare costumes from reused materials. The purpose of the analysis was to answer the question: How did the school’s behavioral requests affect the parents’ environmental behavior?
To analyze the influences, we calculated the frequency distribution of parents’ answers to the question regarding their response to the school’s request (see Table 2 and Figure 1). On the basis of the frequency distribution, we defined four categories of influences according to the following two variables: (1) the duration of time for which the behavior is sustained (short-term or extended term); and (2) the extent of influence, in terms of context of behavioral change (see Table 2). The latter refers to the question of whether parents changed their behavior only in the context of school (for example, by preparing their children’s school lunches in non-disposable packaging) or internalized the change, adopting the behavior in broader contexts, beyond school (for example, by preparing their own lunches for work in non-disposable packaging).
Table 2. Potential behavioral change correlated with behavior requested through school-based education programs, by school.
Categories of Behavioral effectSchool 1 (N = 52;V = 26)School 2 (N = 28;V = 24)School 3 (N = 16;V = 13)School 4 (N = 19;V = 15)School 5 (N = 36;V = 31)School 6 (N = 12; V = 5)TOTAL Percent of sample (V = 114; N = 163)
1—No behavioral change; same behavior as before15%21%23%33%16%50%22%
2—No behavioral change; request unreasonable or difficult2%4%8%0%0%0%2%
3—Changed behavior for a limited time8%21%15%20%3%0%11%
4—Changed behavior only in school context25%8%31%20%32%0%23%
5—Changed behavior beyond school context46%29%23%20%45%50%37%
6—3 + 4 Changed behavior for a limited time, only in school context2%8%0%0%3%0%3%
7—3 + 5 Changed behavior for a limited time, beyond school context2%8%0%7%002%
N = number of returned questionnaires; V = valid cases: number of questionnaires that were completely answered and included in the analysis.
Figure 1. Distribution of percentages of behavioral effects on parents, by category of effect.
Sustainability 04 02210 g001
Results and conclusions. Frequency distributions of parents’ responses regarding behavioral changes induced by the schools’ influence are presented in Table 2 and Figure 1.
The results indicate that parents have a high level of compliance with behavioral requests posed by schools. The above frequency distribution reveals the following results:
  • • 2% (2 cases) of parents in all schools did not comply with the school’s request, because the request was perceived as unreasonable or too difficult to perform.
  • • 22% (25 cases) of parents in all schools had pro-environmental behavior prior to the schools’ requests;
  • • 76% (87 cases) of parents changed their behavior, adopting environmentally friendly behavior in compliance with the school’s direct request;
A comparison of effects according to merged categories of time span and extent of influences yields the results presented in Table 3 (see original categories in Table 2, above).
Table 3. Time span and extent of schools’ behavioral influence on parents.
Time span & extent of influence categoriesFrequencies Grouping of categories of behavioral effect
No influence271 + 2
Influence in short-term/limited context 433 + 4 + 6
Influence in short-term/broader community context27
Influence in extended-term/broader community context 425
TOTAL114
Regarding the extent of schools’ influence on parents’ behavior, 39% (44 cases) of all the parents in the sample reported a behavioral change beyond the school context. This group constitutes 51% of all influenced parents.
Regarding the duration of schools’ influence on parents’ behavior, 37% (42 cases) of all the parents in the sample reported that their behavior was influenced over the extended-term; these parents constitute 48% of all influenced parents. The remaining 52% of the influenced parents reported a short-term behavioral change.
The above results suggest that most parents who modify their behaviors in response to schools’ influences carry these changes with them beyond the school context into their daily conduct within their communities.

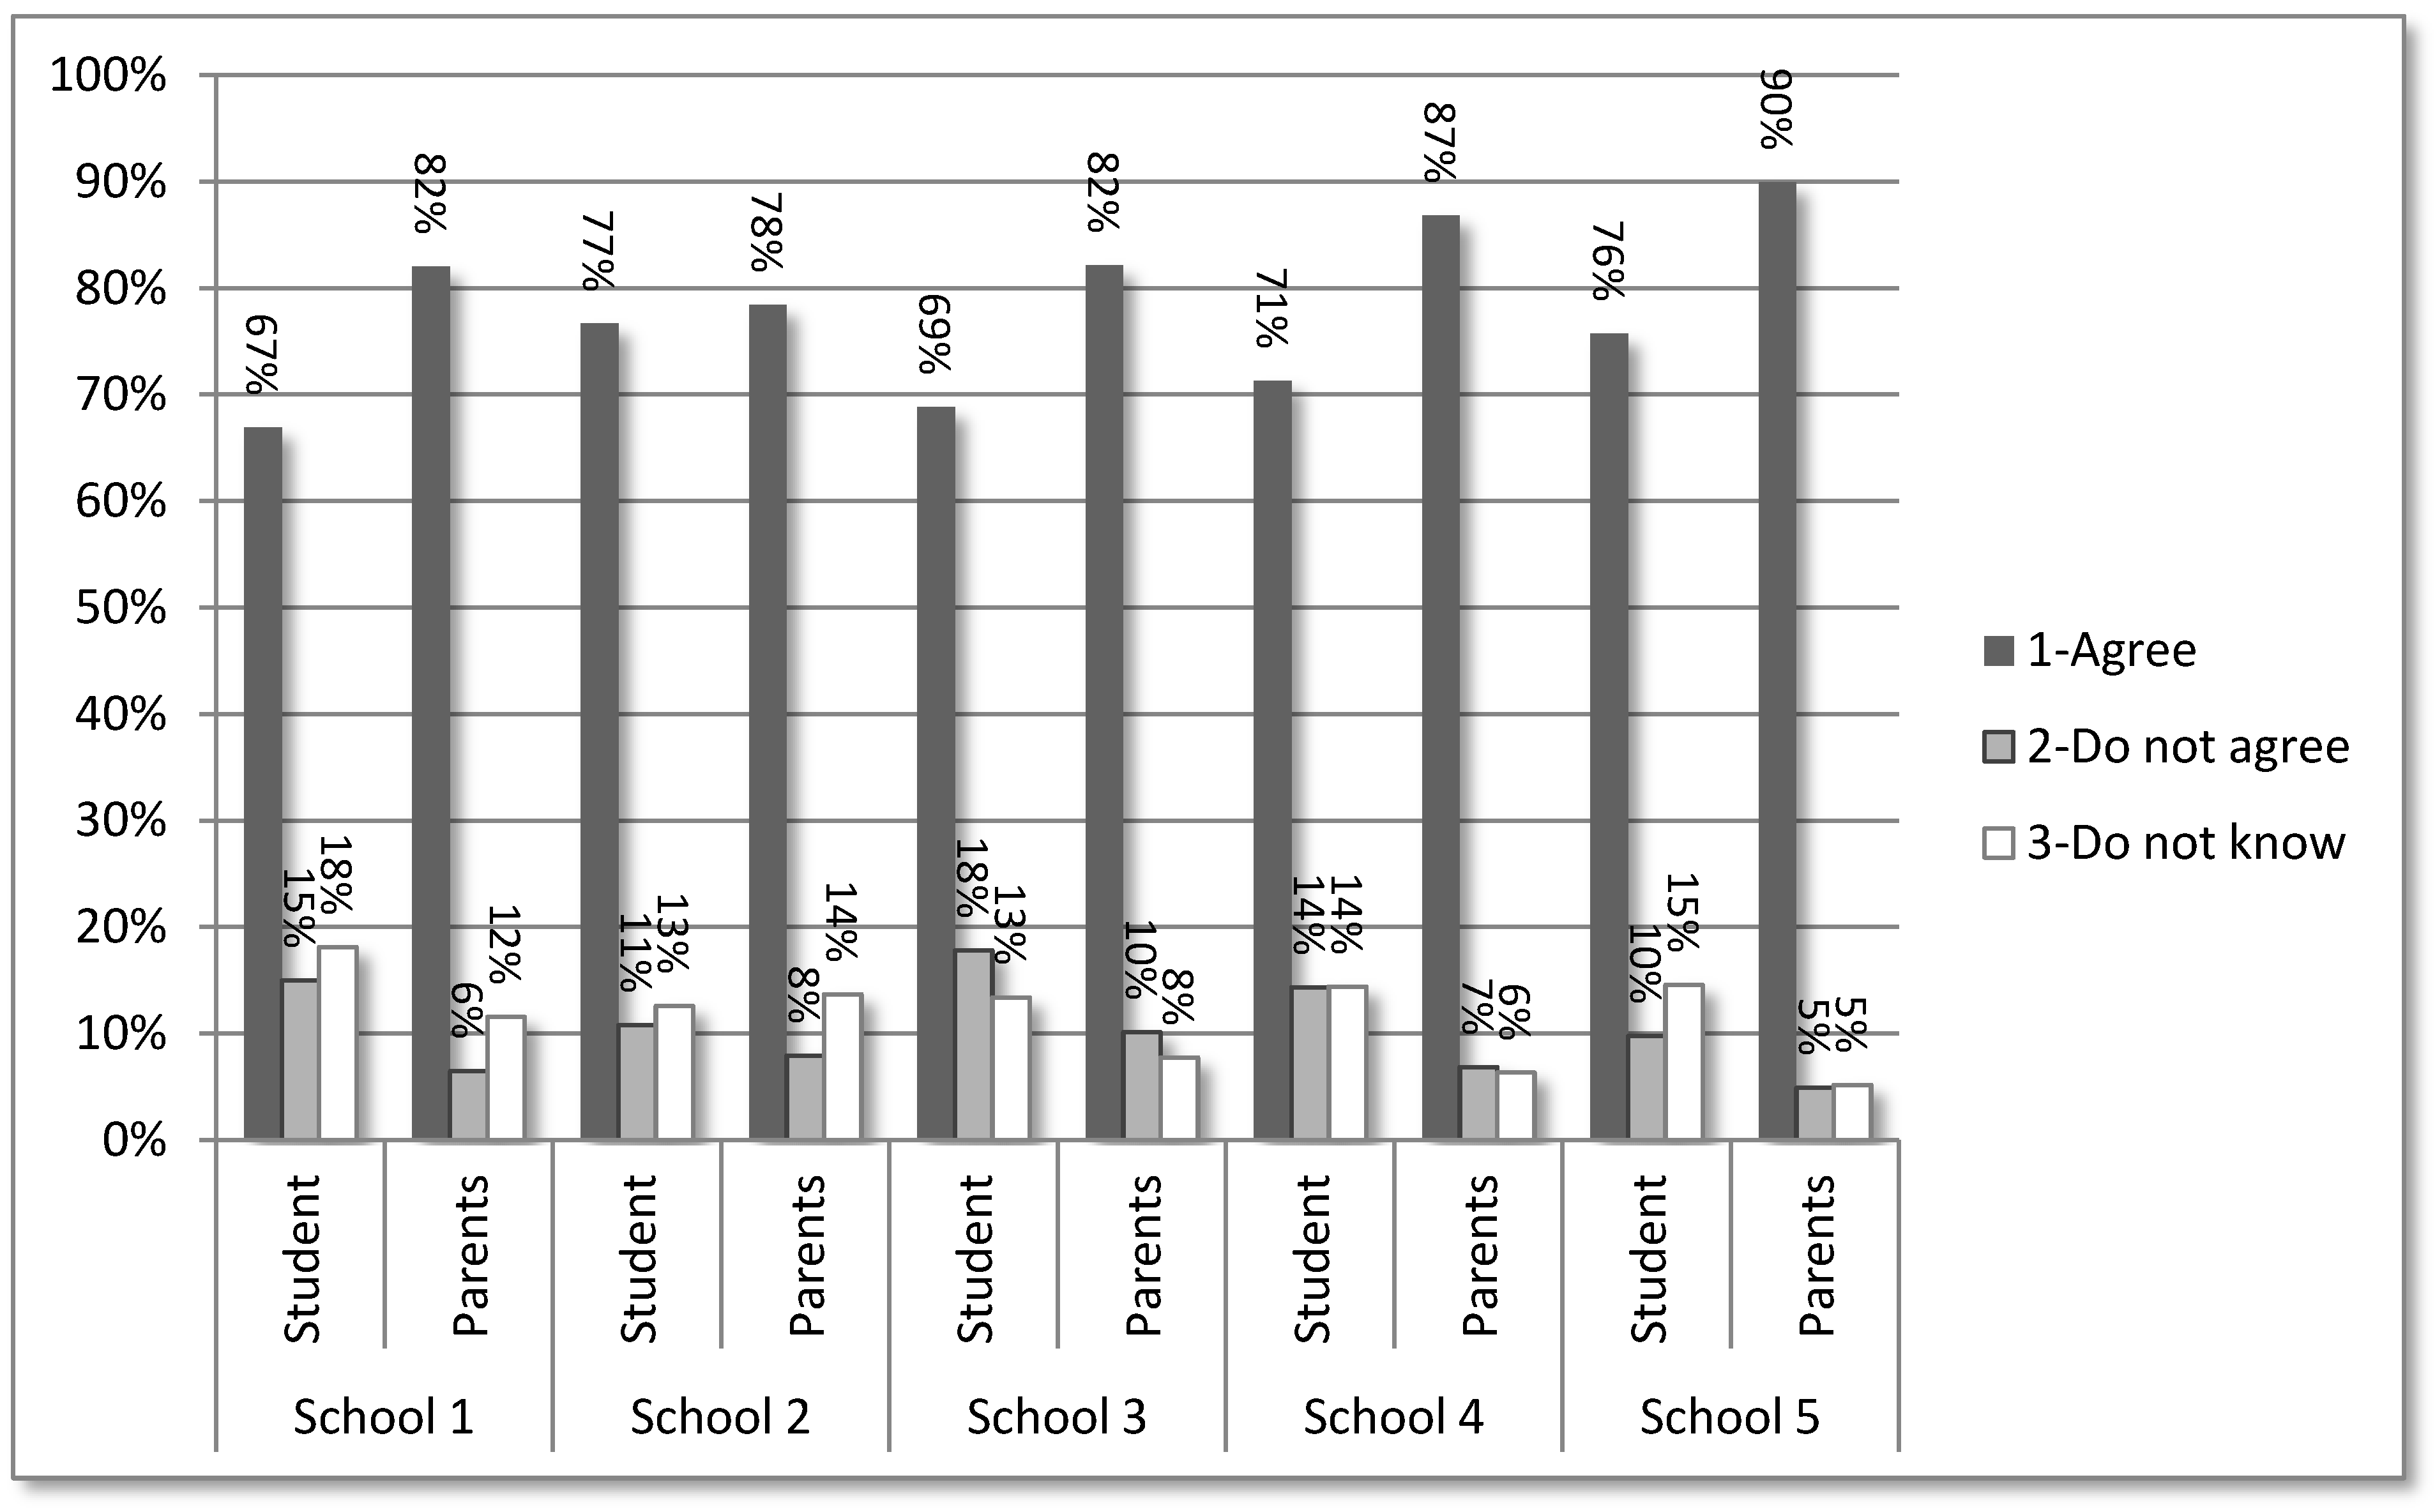
3.1.4.2. Indicator B: Degree of Closeness between the Environmental Attitudes of Parents and Students in Comparison to the Broader Community

The aim of indicator B is to assess schools’ influence on parents’ environmental attitudes. The underlying assumption is as follows: If schools are the source of influence, we would expect a gradient of environmental attitudes in which schools are the most pro-environmental, students less so, and parents the least. In contrast, if the gradient of influences flows in a reverse direction, from the broader community on to parents and on to their children, we would expect the level of environmental attitudes to decrease as one proceeds from the broader community to the students.
Indicator B can be analyzed by a set of comparisons between environmental attitudes that are enhanced by the schools’ EE programs, attitudes of students, attitudes of their parents and attitudes of the broader community. In the present study, an alternative approach was applied for analyzing the degree of closeness between environmental attitudes of parents and students in comparison to those of the broader community. Alternatively, we posed the question: Whose attitudes are more pro-environmental: parents’ or students’? The results would determine the direction of influence flow. It is assumed that if schools are the source, the students will score higher than the parents, whereas if the community is the source, the parents will score higher than their children. In order to ensure that the attitudes we assessed were relevant to the actual school programs, we focused on attitudes that schools reportedly aimed to influence through their EE programs.
Data sources. We gathered information for indicator B by asking parents and students to rank the level of their agreement with each of 13 statements expressing environmental attitudes that were relevant to the schools’ environmental education programs.
The list of attitudinal statements presented in the questionnaire was composed on the basis of the schools’ reports regarding attitudes enhanced by the school program. The method for developing the list was based on four stages as follows: (a) Interviews were held with school principals and leading environmental teachers. Participants were asked to state the attitudes that the EE program enhances with regard to each topic in the environmental education program; (b) We developed a list of attitudinal statements based on the responses of all six schools. Additional statements were drawn out of the Secondary School Environmental Literacy Assessment Instrument [77] and were added to the list, forming a list of 62 attitudinal statements altogether; (c) The list was handed out to the school principals and leading environmental teachers, and they were asked to mark only statements that reflected attitudes that were enhanced by the school program; (d) Thirteen statements that were marked by all six schools were chosen to be included in the questionnaires to parents and children.
Attitudes have cognitive as well as affective components [78,79]. Because of these characteristics, it is sometimes difficult to distinguish between attitudes, opinions and knowledge [80,81]. Since both knowledge and opinions merge into a single construct of attitudes [80], the attitudinal statements presented in the questionnaire form of a combination of all three, thus allowing a more reliable presentation of the concept of attitudes as perceived by schools.
The structure of the questionnaire adhered to the following guidelines: (a) adherence to the same level of generality in each statement [80]; (b) using a set of statements rather than one question as in opinion questionnaires [82]; (c) using statements that reflected all three components of attitudes: cognitive, evaluative and behavioral [83]. When developing the list of statements, we referred to Sudman and Bradburn’s ‘checklist of major points’ in measuring attitudes ([83], p. 121).
The statements were as follows: (1) There is no connection between human behavior and the state of the environment; (2) Human beings should not be held responsible for global warming; (3) Cars do not affect air pollution; (4) It is better to reduce in advance waste production than to recycle waste; (5) It is everyone’s duty to reduce energy consumption; (6) It saddens me to see that nature is being destroyed in order to build buildings; (7) There is no need to reduce oil consumption in Israel despite the fact that oil consumption pollutes the environment; (8) There is a need to produce electricity in less polluting ways, even if it increases electricity prices; (9) The production of goods pollutes the environment; therefore it is better to avoid buying new products and to recycle existing products; (10) The waste I produce adversely affects the environment; (11) If I recycle batteries, plastics, and aluminum cans, it will improve the environment; (12) Everyone can influence environmental quality; and (13) People have the right to use nature as they please.
For each of the above statements, respondents were asked to mark whether they ‘agree’, ‘disagree’, or ‘do not know’.
Methods of analysis. The responses of parents and students were ordered on a 1–3 scale. Answers that expressed highly pro-environmental attitudes (the reply: ‘agree’) received a score of 1; less pro-environmental attitudes (the reply: ‘do not know’) received a score of 2; and non-pro-environmental attitudes (the reply: ‘disagree’) received a score of 3. We used a three-point scale rather than the standard five-point scale in order to simplify use of the scale for the students. This consideration directed the use of the same scale for the parents as well. The frequency distribution of replies of parents and students is presented in Table 4. The percentage distribution is presented in Figure 2.
To assess, for each school, whether the attitudes expressed by parents were more or less environmental than those expressed by students, a multinomial logistic regression was applied (see Table 5). Multinomial logistic regression is the extension for the (binary) logistic regression when the categorical dependent outcome has more than two levels. In this case, the scores of parents and children had three levels: 1, 2, and 3. This method allows comparison of multiple groups through a combination of binary logistic regressions. Group comparisons are equivalent to the comparisons for a dummy-coded dependent variable, with the group with the highest numeric score used as the reference group. Nominal-level independent variables are dichotomized in the analysis. In this case, ‘school’ is a nominal-level independent variable, and therefore a reference group must be used. School 5 was used as a reference group, to which the four other schools were compared.
Table 4. Frequency distribution of replies, by school and by students and parents.
ReplySchool 1School 2School 3School 4School 5
StudentsParentsStudentsParentsStudentsParentsStudentsParentsStudentsParents
1—Agree9613698112183291381561165427331
2—Do not agree21529114228517314135518
3—Do not know26052133386413315128219
TOTAL143645010582784781682190190564368
Figure 2. Percentage distribution of replies of students and parents, by school.
Sustainability 04 02210 g002
Table 5. Multinomial regression results for parents vs. students, by school.
ParameterSchoolORWald 95% Confidence LimitsPr > ChiSq
Group—parents vs. students12.171.672.82<0.0001
21.480.781.080.651
33.191.332.060.0012
44.071.722.65<0.0001
54.522.143.11<0.0001
The analysis enabled us to determine statistically which group (parents or students) scored higher in pro-environmental attitudes and whether the differences were significant.
Results and conclusions. When analyzing the responses of parents and students, three possible results can be expected, each one leading to a different conclusion, as follows:
  • 1. Students display more positive environmental attitudes than parents: This result suggests that a school’s environmental program can be a source of environmental influence.
  • 2. Parents display more positive environmental attitudes than students: The conclusion one would draw from such a result is that schools’ environmental programs are not a source of environmental influence.
  • 3. Parents and students display equally positive environmental attitudes. Based on this analysis, no conclusion can be drawn regarding schools’ environmental programs as a source of influence.
Table 4, Figure 2 and Table 5 present the following: (a) frequency distribution of replies; (b) percentage distribution; and (c) the results of the multinomial regression that was applied in order to examine differences between the parents and students at each school.
The comparison of percentages reveals that the percentage of parents who replied “agree” to pro-environmental statements is consistently higher than that of students.
We used a multinomial regression to assess the significance of the results. The odds ratio (OR) value indicates the probability of parents receiving a higher score than students. Parents are likely to receive higher scores than students if OR >1. The significance of the probability is indicated by the Pr > ChiSq value.
The OR values in Table 5 indicate that in all five schools, parents have a higher probability than students to receive a score of 1 (pro-environmental attitudes). The results are significant in schools 1, 3, 4, and 5. In school 2 the higher probability is non-significant (OR = 1.48; p = 0.651). Therefore, most of the parents in the sample ranked the statements in a way that reflects attitudes that are more pro-environmental than those of their children.
Although parents’ attitudes were not compared directly to the attitudes of the broader community, the direction of the gradient flow suggests that the parents’ sources of influence are derived from sources that are not directly related to the schools’ influence. The statements that parents and students were asked to rank were produced following a process of selection of the main attitudes that the schools’ environmental programs aimed to influence. It is therefore possible to assume that if schools acted as the sole source of influence, the percentage of parents who replied ‘agree’ to pro-environmental statements would be lower than the percentage of students who chose this reply, since students are naturally more exposed to the school’s influences. Therefore, the results indicate that schools do not act as a major source of influence on parents’ attitudes.

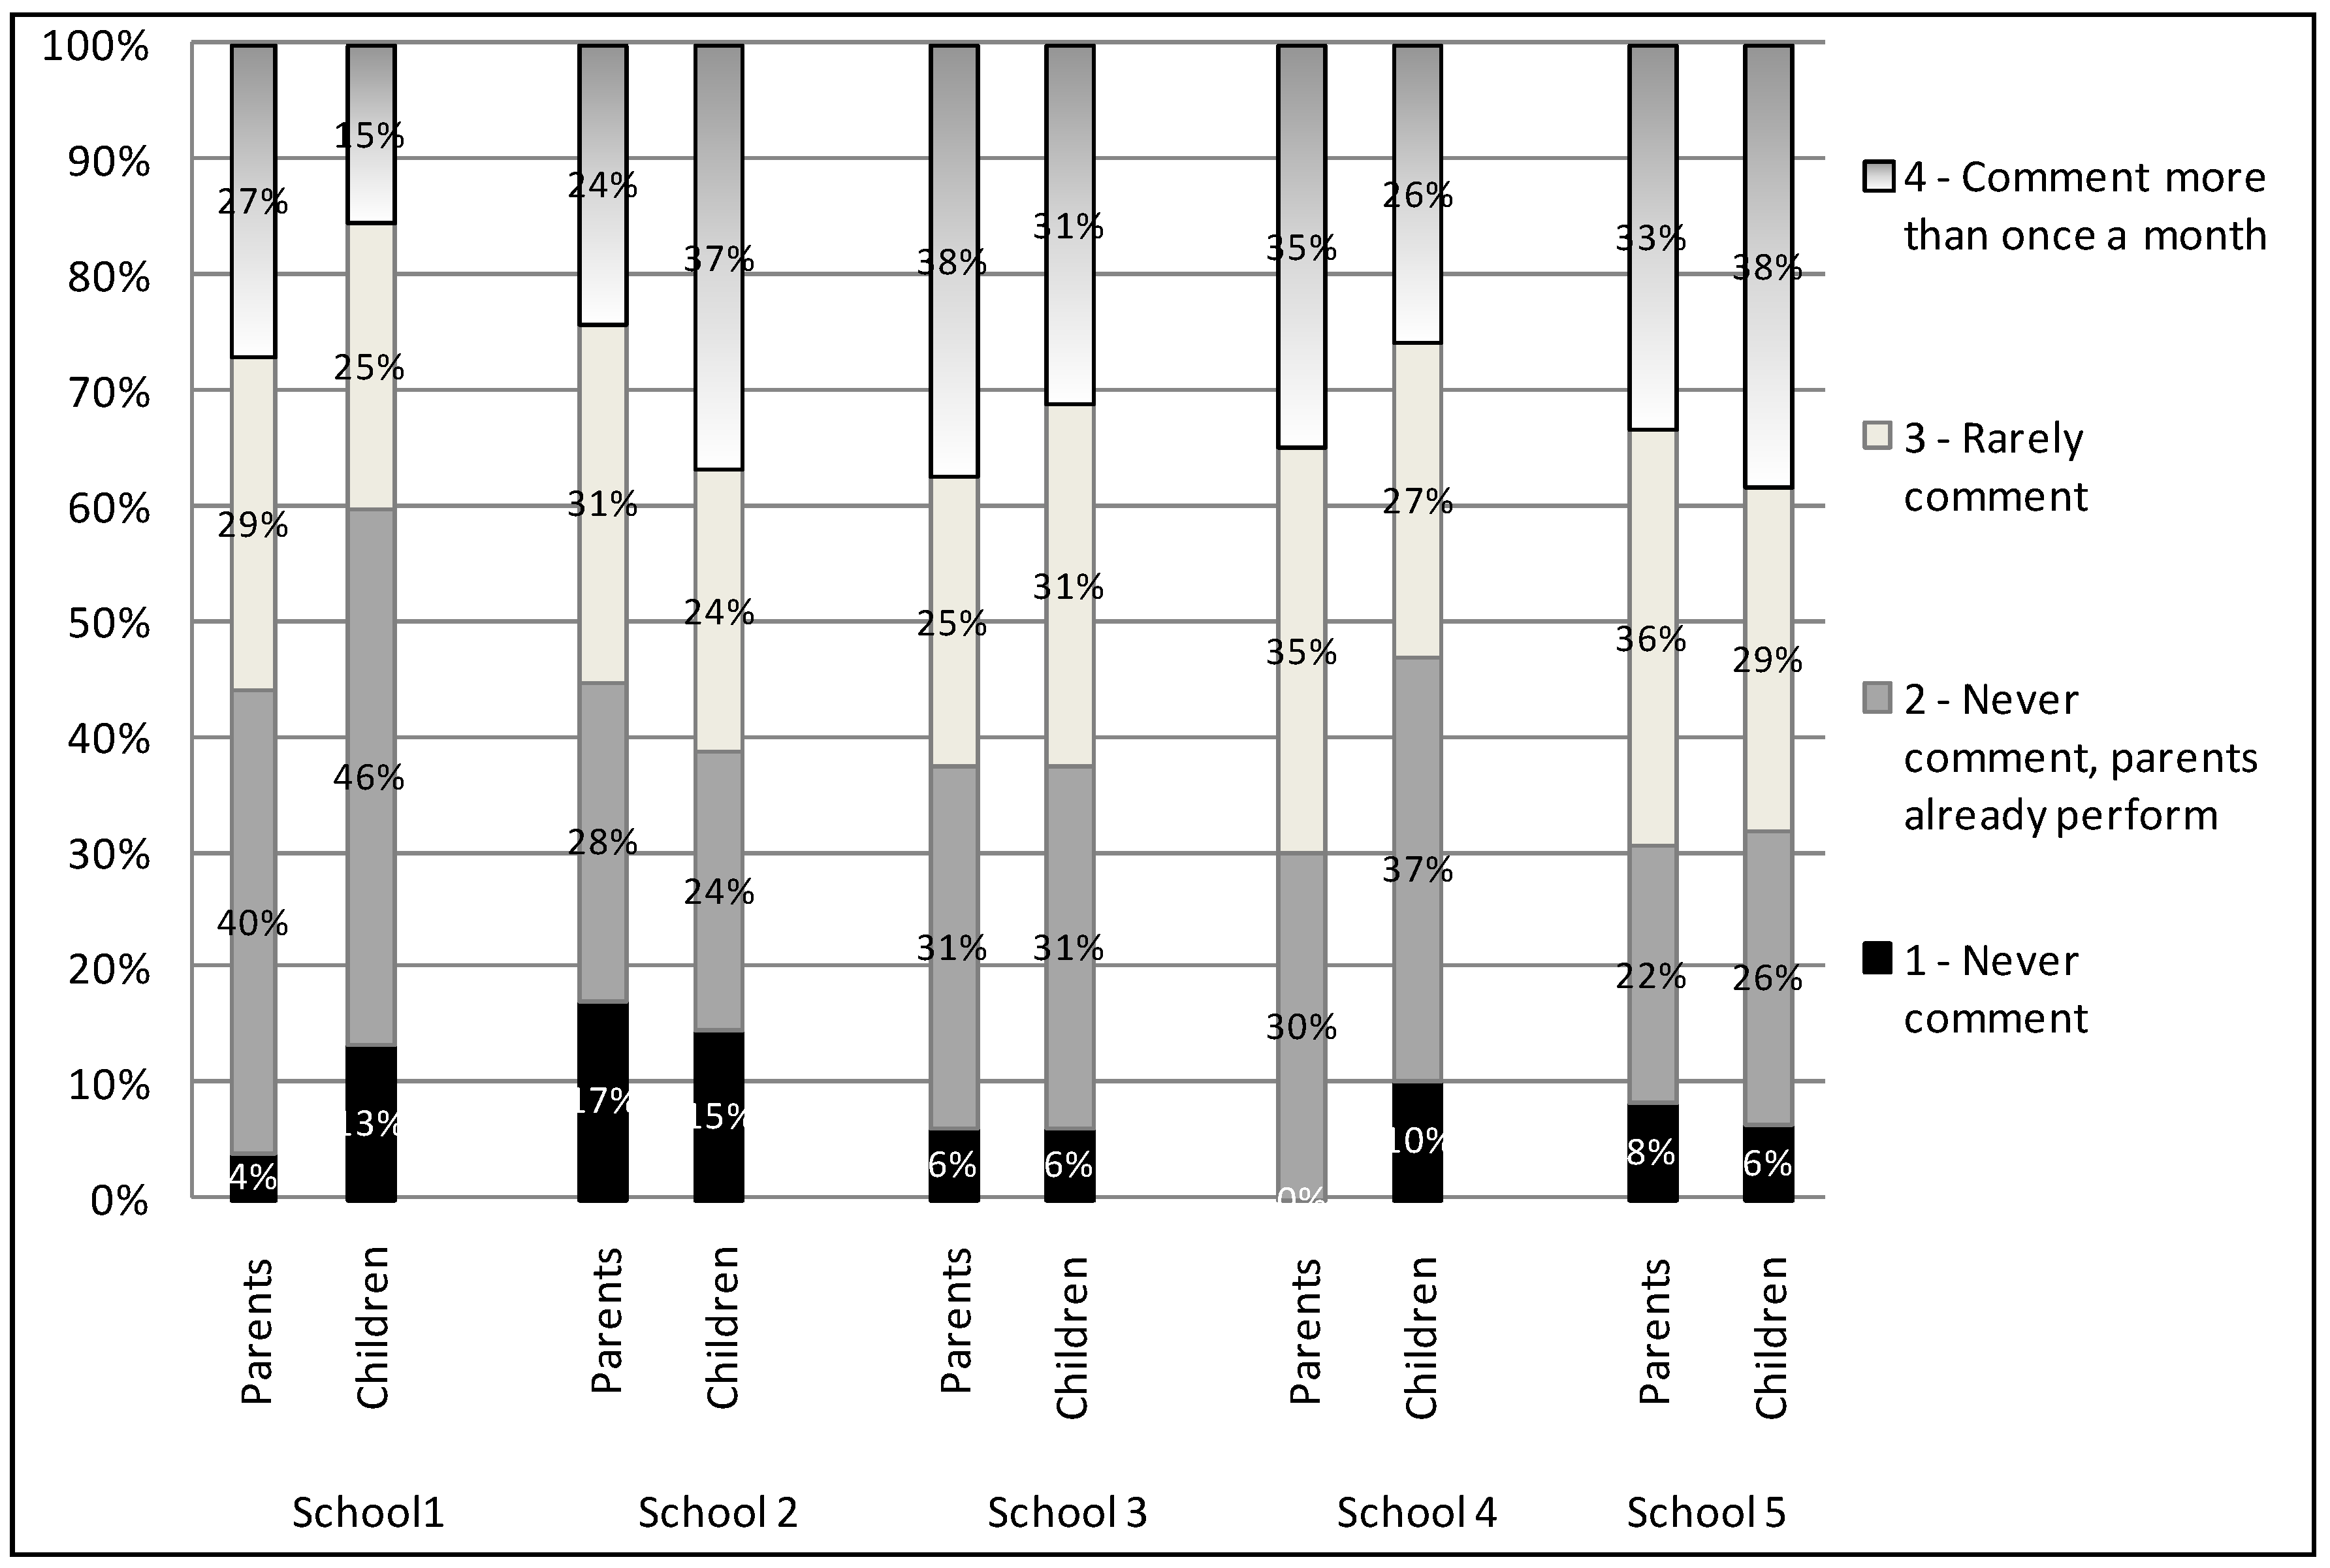
3.1.4.3. Indicator C: Children’s Deliberate Influence on Parents through Comments Aimed at Improving Environmental Behaviors of Family Members

Indicator C has two aims as follows:
  • A. To assess children’s intergenerational influence on their parents regarding environmental behavior; and
  • B. To indirectly assess students’ environmental behavior through assessment of their active commenting on behavioral issues.
When students comment at home, this could mean that they have internalized the school’s environmental influence and that they perceive environmental behavior as important. Commenting can be perceived as a form of responsible environmental behavior that is expressed in the form of persuasion [1,5,7,8,18,84,85,86], and an aspect of active participation [19,87,88,89,90,91]. Though the sources of environmental influences can be multiple and varied, we assume that the sources of influence on environmental commenting by children, is the school’s influence. The assumption is derived from our underlying model which perceives influence flows as gradients. The closer one is to the source of influence, the stronger is the influence. The farther one moves away from the source, the weaker is the influence. The model directs that if the children were mainly influenced by sources in the wider community and not the school, we could assume that the parents would also be exposed to the same or similar sources and there would be no need for children to try to influence their parents. Whereas, if the school is the source of influence, then the children who are in closest proximity would hold the potential to pass on the influence to the parents who are in less proximity.
Data sources. We gathered information for indicator C by asking students and parents to rank the degree to which they (for students) or their children (for parents) comment at home regarding their family’s environmental behavior.
Methods of analysis. The assessment of students’ deliberate influence on parents through comments aimed at improving environmental behavior consists of presenting the frequency distributions (presented as percentages) of replies by parents and by students next to each other in a column chart (see Figure 3). This procedure enables cross-validation of results by comparing one set of results to the other in a descriptive way.
Figure 3. Distribution of replies regarding behavioral comments at home, presented as percentages, by school and by parents and students.
Sustainability 04 02210 g003
Results and conclusions. Figure 3 presents the distribution of the replies according to clause number, for students and for parents at each school.
The results presented in Figure 3 reveal that more than 53% of students in schools 2, 3, 4, and 5, and 40.1% of students in school 1, replied that they comment at home regarding their families’ environmental behavior.
Regarding parents, more than 55.2% of parents reported that students attempt to exert intergenerational influence at home, as expressed by commenting on environmental behavior. The highest frequency of reports on students’ comments is in school 4 (70%).
Figure 3 presents the above distributions in a stacked column chart.
Both parents and students reported that students actively attempt to influence environmental behavior at home. When children try to influence others, whether successful or not, they are exerting persuasive behavior which can be perceived as form of active participation.
The results indicate that in most of the sampled schools, more than half the students were highly influenced by the schools’ EE programs to the degree that they actively attempted to exert intergenerational influence. The results obtained from the students’ questionnaires were confirmed by their parents in all six schools. Furthermore, the parents even perceived that their children commented more than the students reported. This difference can imply that students’ commenting was highly noticed by the parents.

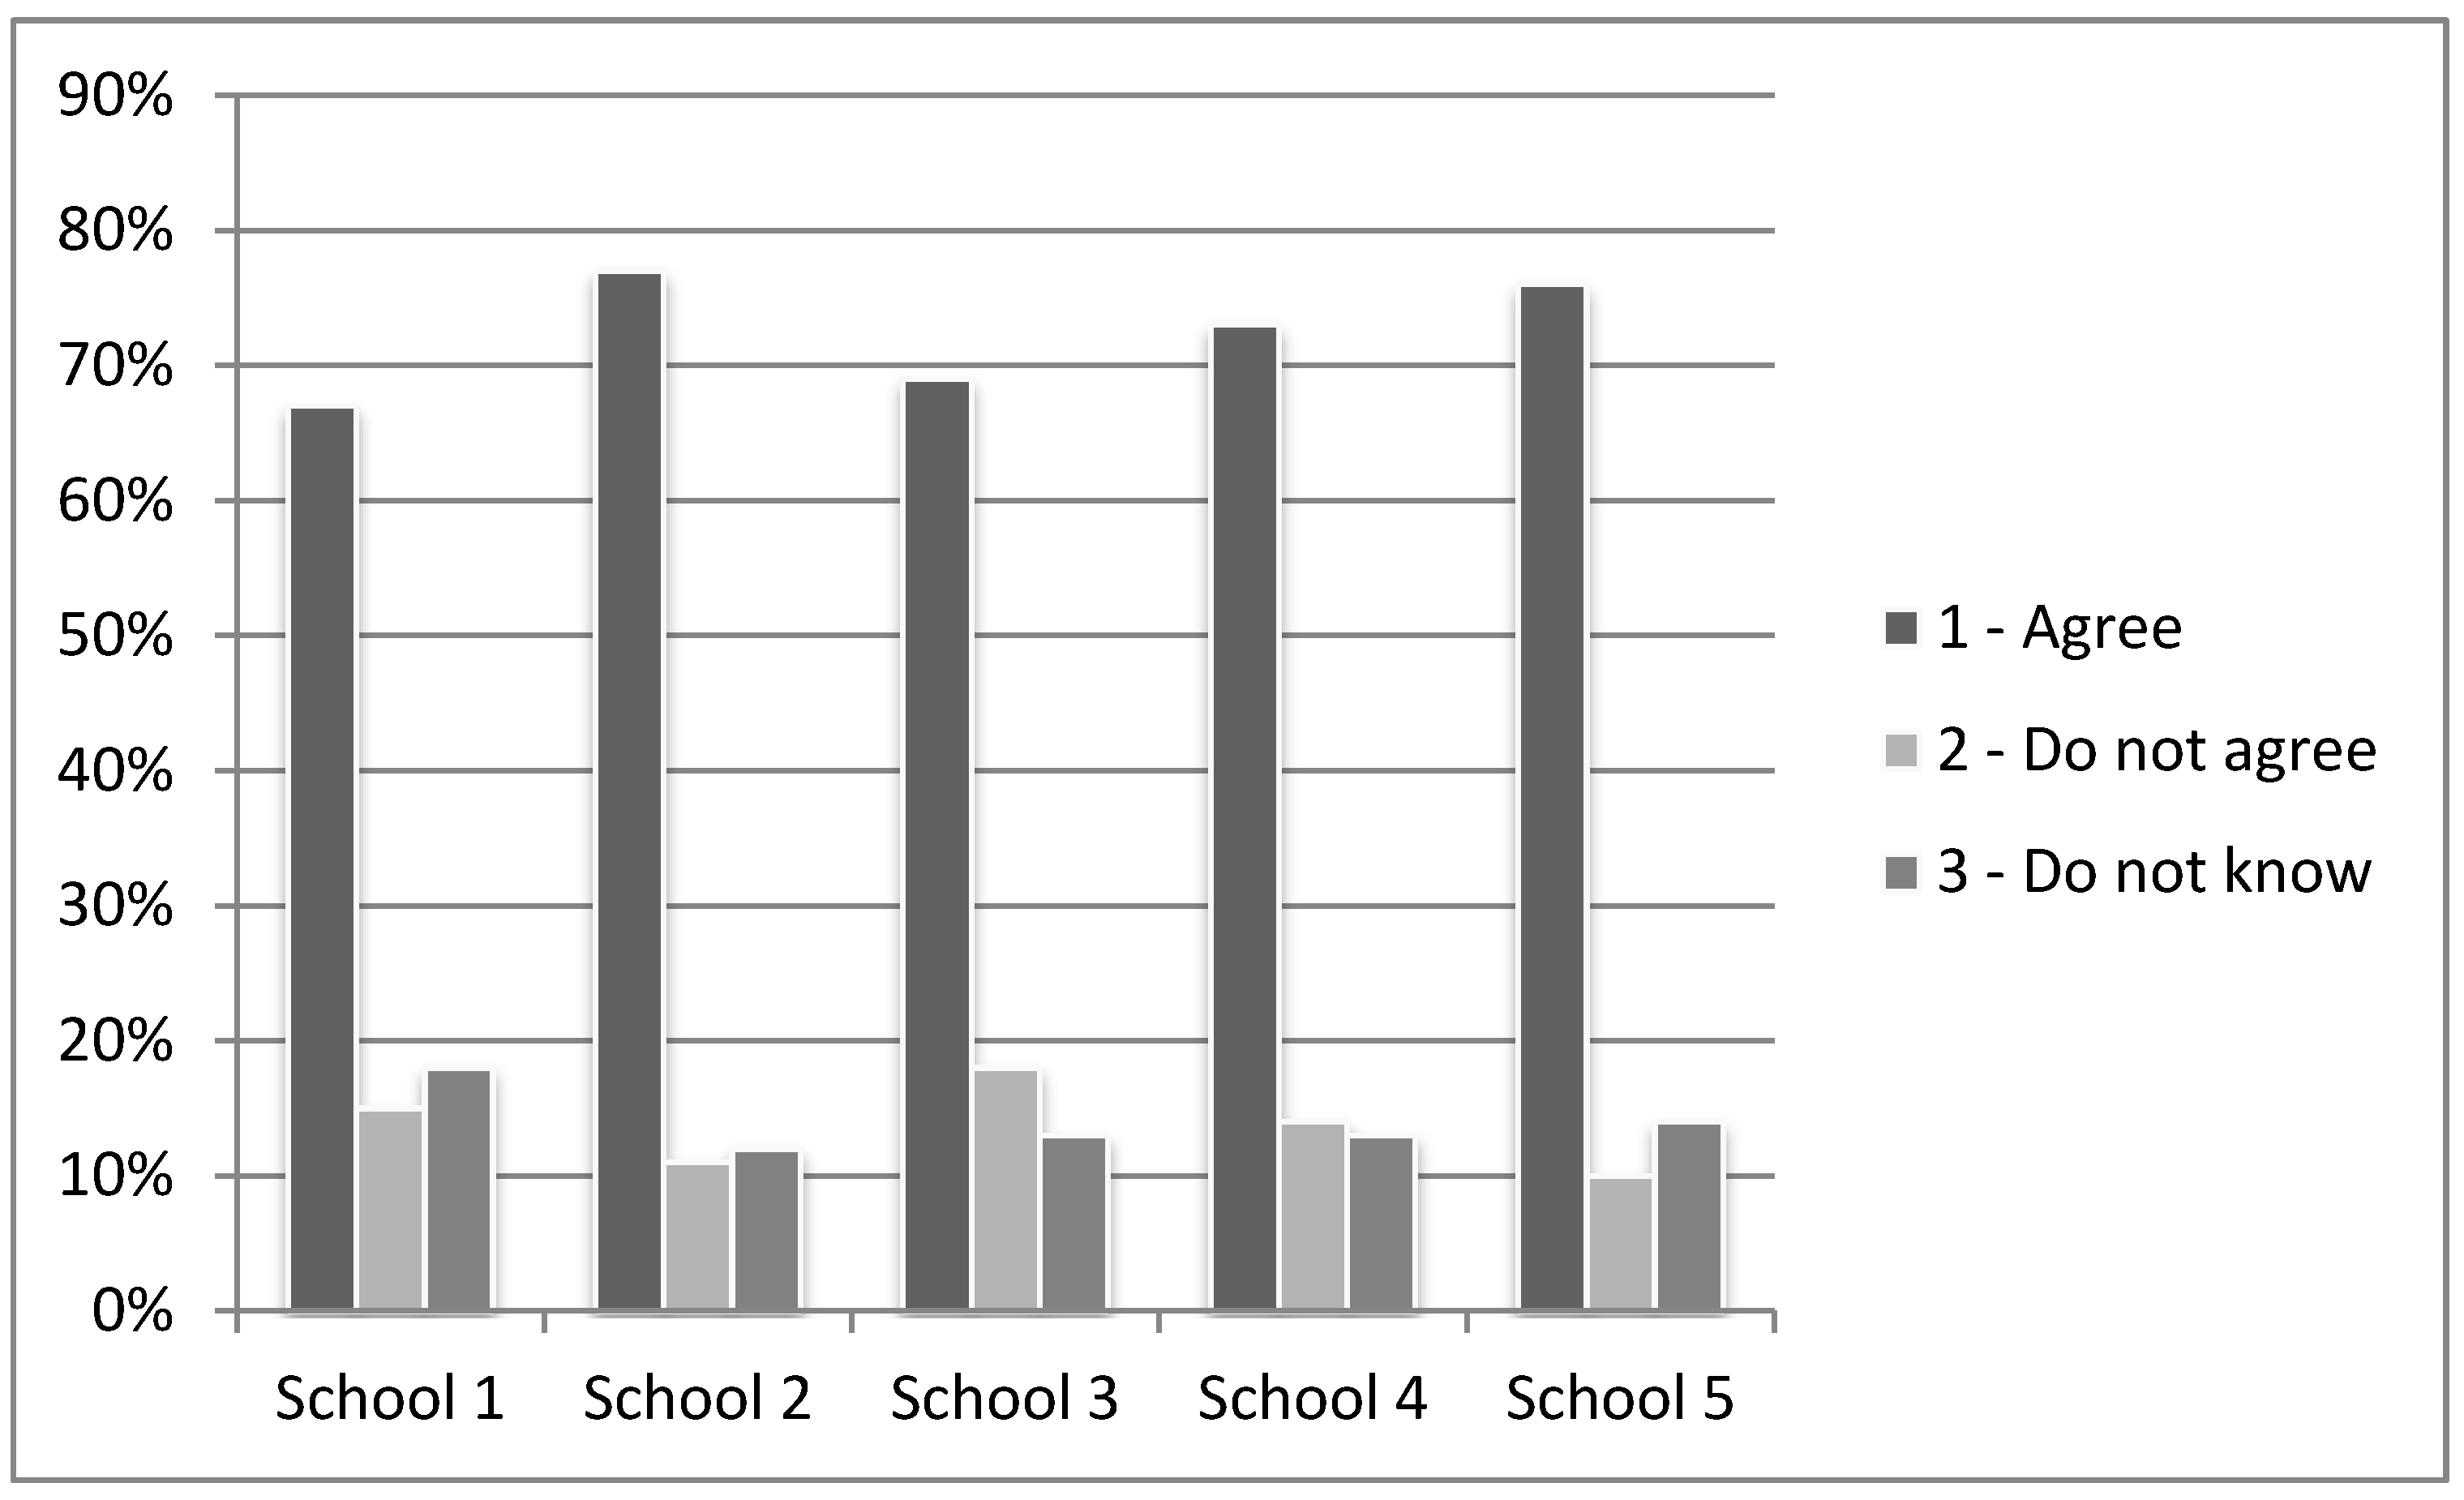
3.1.4.4. Indicator D: Influences on the Students’ Environmental Attitudes

The aim of indicator D is to determine whether students’ environmental attitudes were influenced. Influences on students’ attitudes can be an outcome of influences by the school, by parents, by the media or by other influencing agents. By administering questionnaires in which students had to rank attitudes that were closely related to attitudes that schools stated that they enhanced, we increased the possibility that schools constituted a major source of influence on the development of these attitudes among students. A more precise identification of the sources of influence requires more complex analyses, which are beyond the scope and immediate purposes of the present article. The main interest is in analyzing whether students developed attitudes that were compatible with attitudes enhanced by schools. We used the following method in order to provide an answer to this question.
Data sources. Data were collected from the students.
Students were asked to rank on a scale of 1 to 3 their level of agreement with 13 statements expressing environmental attitudes. These statements used here to analyze influences on students’ attitudes were the same as those used for indicator B to compare between students and parents. Please see the section above on the data sources for indicator B.
Methods of analysis. Frequency distributions of students’ replies regarding environmental attitudes were plotted in a column chart (see Figure 4).
Figure 4. Degree of students’ agreement with pro-environmental statements, by school.
Sustainability 04 02210 g004
Results and conclusions. The results reveal that the students’ attitudes are highly pro-environmental; more than 67% of responses expressed agreement with pro-environmental statements. By compiling this information and information gathered by other analyses [73], it was concluded that students’ highly pro-environmental attitudes are a cumulative result of schools’ influences combined with parents’ positive feedback to these influences.

3.1.5. Main Conclusions of Study 1

Following are the main conclusions of the analyses presented above regarding the influences of environmental schools in Israel on parents and on students:
  • Influence on parents’ environmental behavior: Environmental schools are very successful in creating direct influence on parents’ environmental behavior and in creating indirect influence through intergenerational attempts to influence behavior;
  • Influence on parents’ environmental attitudes: Schools’ environmental programs are not a major source of influence on parents’ environmental attitudes;
  • Influence on students’ environmental behavior: Environmental schools are successful in influencing students’ environmental behavior; and
  • Influence on students’ environmental attitudes: Environmental schools are successful in influencing students’ environmental attitudes.
The above conclusions provide a basis for the following two claims:
  • • Among school children, influences on behavior carry influences on attitudes and vice versa.
  • • Among adults, conventional strategies of influence exerted by environmental schools are more effective in achieving influences on behavior than in achieving influences on attitudes. In other words, among adults, the two aspects of influence are more compartmentalized, meaning that influences on behavior do not necessarily carry with them influences on attitudes.

3.2. Study 2: Evaluation of the Influence of Formative Experiences on Environmental Attitudes and Behaviors of Adults

3.2.1. Background of Study 2

The aim of Study 2 [92] was to evaluate the influence of various formative experiences on acquisition of environmental attitudes and behaviors among adults.
The study was carried out in Israel among a population that was mixed with regard to environmental attitudes and behaviors. A sample of adults was requested to rank on a Likert scale the degree of influence of 20 variables representing formative experiences (see details below). The ranking was done separately for influences on attitudes and on behaviors.
For the purposes of the present article, only analyses and results regarding differences between influences on attitudes and influences on behavior have been selected for presentation.
The research was carried out by applying methods of factor analysis and cluster analysis. Factor analysis is a method that enables categories (factors) of variables to be identified on the basis of levels of correlation between variables. Each variable in our analysis is a formative influence, and each factor comprises formative influences that are interconnected. The factors are an a posteriori product of the analysis procedure. The methodological approach is based on the assumption that formative influences are not isolated variables, but rather interact with each other to form influential effects. Therefore, analysis of the interactions can provide insights into the different ways by which attitudes and behaviors are formed.
We used cluster analysis to examine how the same formative influences can have different effects on different people. Unlike factor analysis, which allocates variables into categories, cluster analysis allocates participants into categories, thus allowing groups of respondents to be distinguished from one another according to their responsiveness to a given set of experiences. In the present paper we analyze the differences that were found between groups of respondents with regard to influences on attitudes and on behavior.

3.2.2. Participants

The research was carried out in two cities with similar population densities. The first city is Haifa, the core city of the northern metropolitan area. Haifa’s population size is 265,000, and its urban density is 4183.2 people per km2 [76]. The second city is Raanana, located at the middle ring of the central metropolitan area of Tel Aviv. Raanana’s population size is 70,000, and its urban density is 4046.5 people per km2 [77]. Data for the research were collected during the years 2009–2010.
The sample was composed of adults whose environmental attitudes and behaviors were not known in advance. In order to control demographic variables that could influence environmental attitudes and behaviors, we attempted to choose a homogeneous sample, thus ensuring that differences between participants could be mostly attributed to personal characteristics, rather than to socio-economic and cultural background. All participants met the following criteria: (a) ages ranged from 30 to 50 years; (b) were parents to children in the ages of 11–15 years; and (c) had higher education. All participants were living in secular Jewish communities with a cluster membership of 8–9 in the socio-economic index [76].
The sample included 95 participants. Gender distribution of participants compatible with the above criteria was 64% females and 36% males.
The sample was composed of two groups of adults. One group consisted of parents of students who were attending environmental schools (ENV) (N = 67), and the other group consisted of parents to students who were not attending environmental schools (N-ENV) (N = 28) but rather attended regular schools located in the same types of neighborhoods with the same population characteristics as those of the environmental schools. The parents in the ENV group are not necessarily more environmentally committed compared with those in the N-ENV group. The parents in the ENV group enrolled their children in an environmental school on the basis of their vicinity to the school and not by parents’ choice. The difference in the sizes of the two samples is derived from differences in data collection methods. More details follow regarding data collection from each of the groups.

3.2.3. Data Collection from the ENV Group

Data collection from the ENV group was done by distributing questionnaires to parents of children in two environmental schools, one school in Haifa and one in Raanana. We handed out 580 questionnaires to the students at the schools. The students were asked to deliver the questionnaires to their parents and return them completed: 157 questionnaires were filled in by the parents (mostly by the mothers) and returned, and 67 questionnaires were compatible with the above criteria for participation, and were used for analyses.

3.2.4. Data Collection from the N-ENV Group

We collected data by handing out 150 questionnaires to parents living in the above two cities whose children were attending non-environmental schools. These schools were located in similar neighborhoods to those of the environmental schools. The questionnaires were handed out directly to the parents as they were coming out of parents’ meetings at schools. Eighty-seven questionnaires were filled in and returned. Only 28 questionnaires were compatible with the above criteria for participation and were used for analyses.

3.2.5. The Questionnaire

The written questionnaire to participants was composed of two parts. The first part included a request for demographic details. The second part included three questions, as follows:
Question 1: Self-ranking of environmental attitudes and behavior. Participants were asked to rank on a Likert scale between 1 (very low) and 5 (very high) the following two statements: (a) “The degree of importance I attribute to environmental issues is…”; and (b) “The degree to which I consider my behavior as environmentally friendly is…”.
Question 2: Sources of influence on attitudes. Question 2 was phrased as follows: “Following is a list of possible sources of influence. Please rank the degree of influence of each source on the development of your attitudes regarding the environment.” Participants were asked to rank on a Likert scale ranging from 1 (“no influence”) to 5 (“very influential”) the following items: books, newspapers, television, internet, movies, the school in which my child studies, conversations, meetings and interactions with people, the schools in which I have studied, certain teacher(s), my personality, a leader/a guide, a group activity, parents and family, my child(ren), time spent in nature or certain experiences that are related to nature, youth movements, academic studies or continuation studies, work/occupation, the community in which I live, political or institutional formats, constitutive experience, being a parent, other.
Question 3: Sources of influence on behaviors. Question 3 was phrased identically to Question 2 above, with one difference: Parents were asked to rank the sources of influence on their behaviors towards the environment.

3.2.6. Methods of Analysis, Results and Conclusions

3.2.6.1. Factors Influencing Attitudes; Factors Influencing Behavior

To analyze formative influences on attitudes and formative influences on behavior, two sets of factor analysis were applied. Factor analysis is a statistical test that explores which variables in a data set are most related to each other [93]. The first set analyzed factors influencing attitudes, and the second set analyzed factors influencing behaviors. The analyses were applied to the total sample comprising the ENV and N-ENV groups pooled together (only valid cases were considered; N = 65).
Following are the results of the analyses by factor title, variables and their influence (presented as percent of variance). Table 6 presents the analysis of influences on attitudes, and Table 7 presents the analysis of influences on behavior. A glance at the two tables reveals that there are qualitative (as expressed in the factors’ components) and quantitative (as expressed in percent of variance) differences between factors that influence attitudes and factors that influence behaviors.
Table 6. Factors influencing attitudes, by title, variables and their influence (% of variance).
Factor numberFactor titleVariablesInfluence (% of variance)
1My past and present close relationships and myself as a citizenMy child; being a parent; parents and family; my community; political/ institutional informants; my child’s school15.28
2Personal and interpersonal interactions with informal educational agents and with natureNature; personality; youth movement; a leader/guide13.83
3My early formal educationMy teacher/s; schools in which I’ve studied 10.31
4The media—'fast intake' information sourcesTelevision; internet; newspapers 9.42
5Formal, cognitive informative sources Work/occupation; academic/continuation studies9.39
6Informal, 'medium-to-slow-intake' informative sourcesMovies; books; discussions/ interactions with people 8.32
TOTAL % of variance66.55
Table 7. Factors influencing behavior, by title, variables and their influence (% of variance).
Factor numberFactor titleVariablesInfluence (% of variance)
1My early formal education, books and institutional formative sourcesSchools in which I’ve studied; my teacher/s; books; political/ institutional informants14.48
2The media –'fast intake' formative sources Newspapers; television; internet; movies14.28
3My present intimate relationships and its related circle My child; my child’s school; my community; being a parent11.96
4My past close relationships, myself and interpersonal relationships Discussions/ interactions with people; personality; parents and family11.00
5Formal, Cognitive informative sourcesWork/occupation; academic/continuation studies10.52
6Interpersonal interactions with informal educational agents and with natureA leader/guide; youth movement; nature9.9
TOTAL % of variance72.14
The factor analysis reveals that six factors form categories of influence on attitudes. Factors 1, 2, and 6 (accounting together for 37.43% of the total explained variance) represent mainly a person’s informal, personal and intimate relationships and experiences. Factors 3–5 (accounting together for 29.12% of the total explained variance) represent the more remote and formal circles that influence our lives: past and present formal education (Factors 3 and 5), and the media (Factor 4).
The factor analysis reveals that six factors form categories of influences on behavior. Factors 3, 4, and 6 (accounting together for 32.86% of the total explained variance) represent a person’s close circles and intimate relationships in the present and in the past. Factors 1, 2, and 5 (accounting together for 39.28% of the total explained variance) represent formal formative influences and the media.
When we used the factor analyses to compare influences on attitudes to influences on behavior, we observed that with regard to influences on attitudes, a higher percent of the variance (37.43%) is explained by formative experiences that are related to a person’s closest circles and intimate experiences and relationships, whereas with regard to influences on behavior, a higher percent of the variance (39.28%) is explained by formal formative influences and the media.
The above results indicate that factors that influence attitudes are different from those that influence behavior. Most of the influences on environmental attitudes incubate by slow processes that involve personal and interpersonal experiences, whereas most of the influences on behavior involve more formal experiences and/or rather rapid intake processes (as expressed by the ‘media’).
On the basis of the above results, we conclude that institutional formal networks of influences and the media are expected to be more successful in influencing people’s behavior than in influencing people’s attitudes. In order to be able to influence people’s attitudes, there is a need for strategies that are directed to more personal and interpersonal formative experiences. These ideas will be further elaborated in the discussion.

3.2.6.2. Identifying Types of Participants by Reactions to Formative Experiences

We used cluster analysis to identify types of people who exhibit similarities in their reactions to potentially influential experiences. The analysis was applied to the rankings of the ENV group (N = 67), separately for formative influences on attitudes and for formative influences on behaviors.
The cluster analysis allowed the sample to be separated into two types (clusters) of respondents. Cluster 1 was termed the ‘social type’, and cluster 2 was termed the ‘private type’. One of the main differences between the two clusters was that people who belonged to cluster 1 (‘social’) were more influenced by formative experiences than were people who belong to cluster 2. We used the term ‘social’ types to denote participants who belonged to cluster 1, because of their high responsiveness to external influences.
Further analysis examined the distribution of participants between clusters. The results are presented in two tables. Table 8 presents the distribution of cases between clusters with regard to influences on attitudes, and Table 9 presents the distribution between clusters with regard to influences on behavior. The results shown in the two tables were compared, and conclusions were drawn regarding influences on attitudes in comparison to influences on behavior.
Table 8. Distribution of cases between clusters regarding influences on attitudes.
ClusterNo. of casesPercent of cases
1—Social type3859%
2—Private type2641%
Invalid cases3-
Total valid cases64100%
Table 9. Distribution of cases between clusters regarding influences on behavior.
ClusterNo. of casesPercent of cases
1—Social type4872%
2—Private type1528%
Invalid cases3-
Total valid cases64100%
The results regarding influences on attitudes show a difference of 18% between the number of participants in cluster 1 and that in cluster 2.
The results regarding influences on behavior show a difference of 44% between the number of participants in cluster 1 and that in cluster 2.
A comparison between Table 8 and Table 9 regarding distribution of cases shows that the difference between the two clusters with regard to influence on behavior is substantially larger than the difference between the two clusters with regard to influence on attitudes (2.4 times greater; 44% difference between clusters of behavior, as compared to 18% difference between clusters of attitudes).
The above result implies that the adults in the sample are more open to accepting influences on their behavior than they are open to accepting influences on their attitudes.

3.2.6.3. Analysis of Environmental Schools’ Influence

The aim of the following analysis is to determine in which aspect of influence (attitudes versus behavior) environmental schools in Israel have more effective influence on students’ parents. To this end, the following procedure was applied: Of the 20 variables that were ranked by parents in the ENV group, the six variables that received the highest mean rankings by cluster and by influence aspect were singled out and depicted in a comparison table. Table 10 presents a comparison between clusters regarding variables with the highest impact in influencing attitudes and in influencing behavior.
Table 10. The six most influential variables, by cluster (‘social’, ‘private’) and by aspect of influence (attitudes vs. behavior).
Cluster Type
Cluster 1—SocialCluster 2—Private
Attitudes (N = 38)Behavior (N = 48)Attitudes (N = 26)Behavior (N = 15)
VariableMean rankingVariableMean rankingVariableMean rankingVariableMean ranking
Personality4.40My child4.40Newspapers3.40Television4.10
My child4.30Personality4.20Television3.90Newspapers3.90
Nature4.30Nature4.10Nature3.50Internet3.70
Internet4.20Being a parent3.90My child3.40Personality3.50
Newspapers4.03My child’s school3.77Internet3.20My child3.20
Television4.03My parents and family3.75Personality3.20Nature3.10
The following observations emerge from Table 10 regarding the direct influences of environmental schools and the indirect influences through intergenerational influences by children:
  • Regarding influences on attitudes:
    • A. The variable ‘my child’s school’ does not appear as one of the six most influential variables on the parents’ attitudes, neither in cluster 1 (‘social’), nor in cluster 2 (‘private’). There is no indication for environmental schools’ direct influence on the attitudes of the students’ parents;
    • B. The variable ‘my child’ appears among the six most influential variables in both clusters 1 (‘social’) and 2 (‘private’). Therefore, there is a strong indication for environmental schools’ indirect influence on the attitudes of parents through intergenerational influence.
  • Regarding influences on behavior:
    • A. The variable ‘my child’s school’ appears among the six most influential variables on behavior for parents who belong to cluster 1 (‘social’) and not for parents who belong to cluster 2 (‘private’). Environmental schools appear to be highly effective in exerting direct influence on the behavior of parents who belong to the ‘social’ type, which comprises the majority of the sample (72%);
    • B. The variable ‘my child’ appears among the six most influential variables in both clusters 1 (‘social’) and 2 (‘private’). Therefore, there is a strong indication for environmental schools’ indirect influence on the behavior of parents through intergenerational influence.
With regard to environmental schools’ direct influence on students’ parents, the above results imply that environmental schools in Israel are more successful at influencing the parents’ behavior than at influencing the parents’ attitudes towards the environment, and that this success is limited to influencing the ‘social’ type.

3.2.7. Main Conclusions of Study 2

Following are the main conclusions of Study 2 regarding the influences of environmental formative experiences on adults who are parents to students:
  • • Influences on attitudes are more effectively achieved through formative experiences that are related to personal, interpersonal and a person’s closest circles.
  • • Influences on behavior are more effectively achieved through formal formative influences and the media.
  • • Adults are more susceptible to influences on their behavior than to influences on their attitudes. Application of cluster analysis indicates that as regards susceptibility to influences, the attitudes of the adults in the sample are consistent with the metaphor of ‘rock bottom commitments’ [51], whereas behaviors are more prone to being influenced.
  • • Environmental schools in Israel are more effective in directly influencing parents’ behavior than in directly influencing their attitudes. Non-direct, intergenerational influence affects behavior and attitudes equally.
The above conclusions provide a basis for the following claims:
  • A. Among adults, different strategies need to be employed for influencing attitudes and for influencing behavior; and
  • B. Among adults, conventional formal education strategies can achieve influences on behavior more easily than they can achieve influences on attitudes.
The following discussion will elaborate on these findings.

4. Discussion

The aims of the present article were twofold: (a) to readdress the relationships between attitudes and behavior with a view towards stressing the more complex and constructivist characteristics of development of environmental attitudes, as compared to development of environmental behavior; and (b) to challenge the long-lived perception that acquisition of environmental behavior is a more advanced achievement of environmental education compared to acquisition of environmental attitudes.
To achieve these aims, we presented the results and conclusions of two studies. The main insights that emerge from the two studies are as follows: Environmental education influence is not a unified effect, but rather composite; attitudes are developed and influenced by different processes compared with behavior; the strategies required for influencing adults’ attitudes differ from those required for influencing their behavior; as a person matures, the processes that influence attitudes diverge from those that influence behavior; adults are more susceptible to influences on their behavior than to influences on their attitudes; and the conventional behavioral approach of Israeli schools’ environmental education programs is more effective in influencing adults’ attitudes than in influencing their behaviors.
The present discussion will analyze the above results in relation to previous research of attitude–behavior relationships.

4.1. Strategic Differences in Influencing and Evaluating Attitudes and Behavior

Previous research in the field has taught us that behavior and attitudes belong to different cognitive domains and are not directly interrelated [1,5,11,18,40,45,94]. Furthermore, evidence from the field of cognitive psychology has revealed that cognition is not necessarily related to behavior in ways that can be predicted a priori [38,39,95,96,97]. Our results support these claims by showing that the factors that influence attitudes are different from those that influence behavior.
The studies presented above indicate that among adults, different variables interact to produce different degrees of influence on participants’ attitudes and on participants’ behavior. Factor analyses revealed that most of the influences on attitudes were derived from slow processing of interpersonal experiences, whereas most of the influences on behavior were derived from more formal and remote formative experiences such as experiences in the workplace and exposure to the media. These findings are consistent with previous research that highlighted the interpersonal and constructivist nature of attitude development [40,51].
The distinction made here between influences on attitudes and influences on behavior has implications for a wide range of issues in environmental education research and practice. If adults’ attitudes and their behavior are influenced by different processes, then when designing environmental programs, there is a need to employ different strategies for influencing acquisition of environmental attitudes and for influencing acquisition of environmental behavior. Therefore, the first question that needs to be asked prior to planning a program is, which aspect of influence does the program aim to achieve? More research is required in order to identify effective strategies for influencing each of these aspects.
These findings imply that, in the context of environmental education, a clear distinction needs to be made between evaluation of influences on attitudes and evaluation of influences on behavior. Uzzell [98] studied the conditions that allow schools to exert catalytic influences on parents. He concluded by stating that a catalytic effect can occur, but it occurs with a limited number of child-parent systems, under very specific and limited conditions (which he outlined in the study). The results of the studies presented above demonstrate that when a clear distinction is made between catalytic effects on behaviors and catalytic effects on attitudes, the findings are more definite, and the observed effects on behaviors are noticeable and measurable. In contrast, if both types of influences are measured together, low achievements regarding influence on attitudes can mask high achievements regarding influence on behavior.

4.2. Differences between Influencing Children and Influencing Adults

The results of the studies suggest that the observed distinction between influence on behavior and influence on attitudes may not apply to children in the same way that it applies to adults. Schools were effective in influencing the behavior and attitudes of children. They were also successful in influencing the behavior of parents. However, schools were not as successful in influencing the attitudes of parents. These results point to an important differentiation between influencing adults and influencing children. While the results indicate that among adults there is a separation between the domains of behavior and attitudes, among children, the domains seem less compartmentalized. These findings are compatible with findings in the field of cognitive developmental psychology, which demonstrate that children’s cognition is less compartmentalized than adults’ [66,67,99]. An environmental literacy survey [86] among school students found a greater correlation between attitudes and behaviors among students in grade 6 than among those in grade 12. These findings support the findings of the present research and indicate that the separation between the above domains advances gradually as children mature.
The following questions arise from the differences that were found between influencing children and influencing adults:
  • 1. Is there a difference between children and adults in the duration of influence on attitudes and on behaviors?
  • 2. Are the influences on children deep or are they circumstantial—will they dissipate when the influencing forces are removed?
  • 3. At what stage of life do influences on behavior separate from influences on attitudes?
  • 4. At the time of their separation, is the fate of both behavior and attitudes the same? Or does one type of influence remain while the other type of influence is removed or replaced?
Further research is required to establish whether the differences that were found between children and adults are derived from psychological structural differences or from circumstantial differences, such as differences in the amount of exposure to the schools’ influential effects.

4.3. Conventional Educational Approaches Influence Behavior More Easily than They Influence Attitudes

The results of the two studies challenge the traditional environmental education model from the 1980s, which holds that environmental literacy advances in stages, from knowledge to attitudes and finally to behavior. Behavioral changes among adults seem to be easier to achieve than changes in attitudes through conventional educational strategies of influence. The results obtained in the two presented studies are not surprising when viewed in light of some well-known behavioral campaigns. For example, in the 1960s, there was a very successful campaign in Israel advocating against picking wildflowers. As a result of the campaign, wildflowers that were almost extinct because of over-picking completely recovered and continue to flourish to this day. Other examples can be drawn from campaigns worldwide that promote recycling and buying greener products. Intensive behavioral campaigns can gain demonstrable success in a relatively short time. Their success can be reinforced by law, regulations (school regulations in this case), or social pressure [100,101,102,103,104,105]. On the other hand, attitudinal changes are more complex cognitive and affective processes that are slower to develop and can emerge following behavioral change [62]. The results indicate that as regards environmental education, changes in behavior might contribute to changes in attitude to a stronger degree than vice versa.
Schools were mostly successful in influencing parents’ behavior. The theory of social constructivism can provide some explanations for these findings. According to the theory, attitudes are socially constructed, and people need to be involved in their learning processes [106,107]. The standard top-down pedagogy, which is still widely implemented by the studied schools in Israel, does not promote social construction of attitudes among parents; rather, it fosters certain behaviors through a behaviorist approach to education. Parents’ participation in the schools’ environmental education can best be described as ‘tokenism’ [108] in which participation is unidirectional from schools to parents and not reciprocal. The studies suggest that more effective influence on attitudes can be achieved through constructivist approaches that actively involve adults by relating to their closest and immediate circles.
The perception of linear advancement from attitudes to behavior was already disproved in the 1990s (in environmental education research, and earlier in psychology research). Yet, as mentioned above, the notion of the superiority of behavioral acquisition over attitudinal acquisition has not received the same level of attention in the literature and still persists. The present studies provide evidence that such assumptions are inappropriate in the field of environmental education. The present studies support the perception of attitudes as representing ‘rock-bottom commitments’ [51,52]. The evidence presented above suggests that attitude formation stems from a person’s most intimate past and present experiences, which form a part of one’s self identity. Behavior, in contrast, is more influenced by non-personal formative influences. Viewing acquisition of environmental attitudes as merely a ‘step along the way’ reflects a rationale mechanistic view of education, overlooking the role of constructivism from both personal and societal perspectives.

4.4. Reassessment of the Ultimate Goal of Environmental Education

Accumulating research regarding the influences of behavior on attitudes [58,109,110], and regarding the effectiveness of behaviorist approaches in influencing behavior [111,112,113], suggests that there is a need to reassess the status of achieving behavioral change as an ultimate goal of environmental education and to reconsider the status of attitude development as an environmental education goal.
It is customary among scholars to assume that behavior acquisition is the ultimate goal of environmental education. The basis for this assumption is the concept that political-cultural changes towards environmental management and practices depend in part on personal behavioral changes [27,104,114]. This implies that the prevailing perception regarding EE goals is that the whole is a sum of its parts. It is assumed that if behaviors change on a personal level, it follows that behaviors will change on a societal level, such as in industry and in public policy (including legislation, regulation, etc.). Reality seems to suggest otherwise. For example, Coyle’s report regarding the environmental literacy of U.S. citizens claimed that throughout ten years of continuous surveys, the results consistently showed that the American public was environmentally illiterate [36]. This statement was derived from the surveys’ results that showed low levels of public pro-environmental behavior but high levels of pro-environmental attitudes. Coyle’s conclusion regarding illiteracy reflects a belief that the main achievement of environmental literacy should be environmental behavior because only behavior can drive changes. That interpretation of the surveys’ results stands in contrast to the international revolution that the world has undergone in the past ten years. At the same time that the NEETF/Roper surveys were revealing low levels of environmental behavior and therefore low levels of environmental literacy, the environmental movement worldwide was becoming mainstream. In the U.S. as well, during the past two decades, the environment has moved politically from being almost a non-issue to being a main issue. One of the culminations of these worldwide processes is reflected by the granting of the 2007 Nobel Peace Prize to the Intergovernmental Panel on Climate Change (IPCC) and to Albert Arnold (Al) Gore Jr., on the basis that the “Earth's future climate must be treated with the utmost seriousness and with the precautionary principle uppermost in our minds.” [115]
These contradicting observations call into question the widely accepted notion regarding the importance of behavioral change and development of active citizenship as a precondition for advancing towards a more sustainable world. Evidence suggests that the whole is not a simplistic, linear sum of its parts, and that personal behavioral changes are not the driving forces behind major political changes; rather, changes in public attitudes may be the driving forces, when formed and accumulated through social constructivist processes. The present studies add another dimension to this argument by focusing attention to the different ways in which behavioral changes occur as compared to attitudinal changes.
Stemming from the above, the question then becomes, what is more important in environmental education: to influence people to ‘act green’, or to influence their attitudes towards the environment? The question calls for clarification of the goals of environmental education. If the goal is to create personal changes in norms of behavior, then behavioral influence is more important than influence on attitudes. However, if the goal is to advance the world towards sustainability, then perhaps what really matters is educating for environmental attitudes.

4.5. The Studies’ Limitations

The main objective in presenting the two studies was to question the taken-for-granted perception that promoting behavioral change is a more important goal of environmental education compared with promoting attitudinal change. The studies were limited in sample sizes, therefore, limiting generalizability. The response rate of parents in Study 1 was 24%. The question to be asked is: In what ways could the non-responding 76% of parents influence the results? For estimating, we postulated that parents who filled in the questionnaires are likely to be either more highly environmentally aware then the other parents, or/and more involved in their children’s learning, making sure that whatever arrives at home from school and requires their response, will be responded. With these assumptions in mind, the following influences on results might be expected if all parents would have filled in the questionnaires:
  • As regards Indicator A (Degree to which parents adopted responsible environmental behaviour in response to the school’s regulations/requests)—lower levels of environmental behaviour conformity are expected. In the same way that these parents did not reply to questionnaires they were asked to fill in, it can be assumed that some of them did not perform the required environmental behaviors that were requested by schools.
  • As regards Indicator B (Degree of closeness between the environmental attitudes of parents and students in comparison to the broader community)—the results indicated that schools were not the source of influence on the parents’ environmental attitudes. It is assumed that if this highly responsive group of parents was not influenced by the school, the less responsive group would be even less influenced. Therefore, we expect that in ideal conditions in which 100% of parents would have responded, our results regarding low influence on environmental attitudes would have been markedly stronger.
  • As Regards Indicator C (Children’s deliberate influence on parents through comments aimed at improving environmental behaviours of family members)—high compatibility was found between the students’ replies (100% of sample) and the parents’ replies (24% of sample). We assume that the same high level of compatibility would have been maintained if all the parents would have filled in the questionnaires.
We conclude that regardless of the low response rate of parents, our results are valid. They are supported by the results of Study 2 as well as by the above analysis based on our assumptions regarding the none-participants’ characteristics.
The results of the studies can be used as a trigger for reopening the discussion regarding the goals of environmental education and to question the relatively high importance attributed to influencing behavior. It is recommended that future studies develop and implement methodologies designed specifically for evaluating the different processes involved in influencing attitudes and influencing behaviors.

Appendix A: Characteristics of Participating Schools and Communities

1. Characteristics of Participating Schools

Table 1.1 presents the characteristics of the sample in Study 1.
Table 1.1. Characteristics of the selected schools and communities.
School no.Years of EE programYear levelsNumber of participating classes aCityPopulation size (thousands) bPopulation density (people/SK)Geographical location b Socio-economic index; cluster membershipc
145 and 66Holon168.88929.9Tel Aviv metropolitan area; inner zone, southern section7
2165 and 64Rosh Ha’ayin37.91552.5Tel Aviv metropolitan area; middle zone, eastern section 6
335 and 62Tel Aviv390.17530.7Tel Aviv core8
475 to 96Haifa264.97530.7Haifa core7
5853 Modiin67.11337.1Eastern zone8
6553 Ramat Gan129.99840.2Tel Aviv metropolitan area; inner zone, eastern section8
a: Classes sizes vary from a minimum of 20 students to a maximum of 36 students per class.
b: See reference [1].
c: 1–lowest level; 10 highest level [1].

References

1. Central Bureau of Statistics (CBS) of Israel. Available online: http://www.cbs.gov.il/ (accessed on 10 December 2009).

Acknowledgements

We wish to thank Michael Valos and Michael Polonsky, both researchers at the School of Management and Marketing, Deakin University, Victoria, Australia. We are deeply thankful for their support in the reviewing process. Their comments and discussions were of great value to this article.
We would also like to thank the reviewers for their productive comments and for sharing their views regarding major controversies in the field of EE.

References

  1. Hines, J.M.; Hungerford, H.R.; Tomera, A.N. Analysis and synthesis of research on responsible environmental behavior: A meta-analysis. J. Environ. Educ. 1987, 18, 1–8. [Google Scholar]
  2. Burgess, J.; Harrison, C.; Filius, P. Environmental communication and the cultural politics of environmental citizenship. Environ. Plan.A 1998, 30, 1445–1460. [Google Scholar]
  3. Kollmuss, A.; Agyeman, J. Mind the gap: Why do people act environmentally and what are the barriers to pro-environmental behavior? Environ. Educ. Res. 2002, 8, 239–260. [Google Scholar] [CrossRef]
  4. Hungerford, H.R.; Peyton, R.B. Teaching Environmental Education; Weston Walch: Portland, ME, USA, 1976. [Google Scholar]
  5. Hungerford, H.R.; Volk, T.L. Changing learner behavior through environmental education. J. Environ. Educ. 1990, 21, 8–21. [Google Scholar]
  6. Roth, R.E. Fundamental concepts for environmental management education (K-16). J. Environ. Educ. 1970, 1, 65–74. [Google Scholar]
  7. Sia, A.; Hungerford, H.R.; Tomera, A. Selected predictors of responsible environmental behavior. J. Environ. Educ. 1986, 17, 31–40. [Google Scholar] [CrossRef]
  8. Simmons, D.A. Are we meeting the goal of responsible environmental behavior: An examination of nature and environmental education center goals. J. Environ. Educ. 1991, 22, 16–21. [Google Scholar] [CrossRef]
  9. Simmons, D.A. The NAAEE Standards Project: Papers on the Development of Environmental Education Standards; North American Association for Environmental Education: Troy, OH, USA, 1995. [Google Scholar]
  10. Stapp, W.B. Environmental Encounters. In Outlines of Environmental Education; Schoenfeld, C., Ed.; Dembar Educational Research Services: Madison, WI, USA, 1971. [Google Scholar]
  11. Buttel, F.H. New directions in environmental sociology. Annu. Rev. Sociol. 1987, 13, 465–488. [Google Scholar] [CrossRef]
  12. Dunlap, R.E. Public opinion in the 1980s: Clear consensus, ambiguous comment. Environment 1991, 33, 10–37. [Google Scholar] [CrossRef]
  13. Gigliotti, L.M. Environmental attitudes. J. Environ. Educ. 1981, 24, 15–26. [Google Scholar] [CrossRef]
  14. Scott, D.; Willits, F.K. Environmental attitudes and behavior: A Pennsylvania survey. Environ. Behav. 1984, 26, 239–260. [Google Scholar]
  15. Tarrant, M.A.; Cordell, H.K. The effect of respondent characteristics on general environmental attitude-behavior correspondence. Environ. Behav. 1997, 29, 618–637. [Google Scholar] [CrossRef]
  16. Wallace, D.S.; Paulson, R.M.; Lord, C.G.; Bond, C.F. Which behaviors do attitudes predict? Meta-analyzing the effects of social pressure and perceived difficulty. Rev. Gen. Psychol. 2005, 9, 214–227. [Google Scholar] [CrossRef]
  17. Chawla, L. Life paths into effective environmental action. J. Environ. Educ. 1999, 31, 15–26. [Google Scholar] [CrossRef]
  18. Marcinkowski, T. Using a Logic Model to Review and Analyze an Environmental Education Program; North American Association for Environmental Education: Washington, DC, USA, 2004. [Google Scholar]
  19. Breiting, S.; Mayer, M.; Mogensen, F. Quality Criteria for ESD-Schools: Guidelines to Enhance the Quality of Education for Sustainable Development; SEED-Austrian Federal Ministry of Education, Science and Culture: Vienna, Austria, 2005. [Google Scholar]
  20. Mogensen, F.; Mayer, M. ECO-Schools­Trends and Divergences: A Comparative Study on ECO-School Development Processes in 13 Countries; Austrian Federal Ministry of Education, Science and Culture: Vienna, Austria, 2005. [Google Scholar]
  21. Sterling, S. Whole System Thinking as a Basis for Paradigm Change in Education-Explorations in the Context of Sustainability. PhD Dissertation; Center for Research in Education and the Environment,University of Bath: Bath, UK, 2003. Available online: http://www.bath.ac.uk/cree/sterling/sterlingthesis.pdf (accessed on 12 June 2010).
  22. Sterling, S. Learning for resilience, or the resilient learner? Towards a necessary reconciliation in a paradigm of sustainable education. Environ. Educ. Res. 2010, 16, 511–528. [Google Scholar] [CrossRef]
  23. Krech, D.; Crutchfield, R.S. Theory and Problems of Social Psychology; McGraw-Hill: New York, NY, USA, 1948. [Google Scholar]
  24. Fishbein, M.; Ajzen, I. Belief,Attitude,Intention,and Behavior; Addison-Wesley: Reading, MA, USA, 1975. [Google Scholar]
  25. Petty, R.E.; Wegener, D.T. Attitude Change: Multiple Roles for Persuasion Variables. In The Handbook of Social Psychology, 4th; Gilbert, D., Fiske, S., Lindzey, G., Eds.; McGraw-Hill: New York, NY, USA, 1998; pp. 323–389. [Google Scholar]
  26. Breiting, S.; Hedegaard, K.; Mogensen, F.; Nielsen, K.; Schnack, K. Action Competence, Conflicting Interests and Environmental Education (in Danish); Odense University Press: Odense, Denmark, 1999. [Google Scholar]
  27. Chawla, L. Significant life experiences revisited once again: Response to Vol. 5(4) ‘Five critical commentaries on significant life experience research in environmental education’. Environ. Educ. Res. 2001, 7, 451–461. [Google Scholar] [CrossRef]
  28. Mayer, M. What Can We do in Schools for ESD? Reflections and Proposals from the ENSI International Network. In Quality Environmental Education in Schools for a Sustainable Society: Proceeding of an International Seminar and Workshop on Environmental Education; Cheongju National University of Education: Cheongju, China, 2004; pp. 135–151. [Google Scholar]
  29. NSW Council on Environmental Education, Learning for Sustainability: NSW Environmental Education Plan 2007-10; NSW Council on Environmental Education: Sydney, Australia, 2006.
  30. Vaughan, C.; Gack, J.; Soloranzo, H.; Ray, R. The effect of environmental education on schoolstudents, their parents, and community members: A study of intergenerational and intercommunity learning. J. Environ. Educ. 2003, 34, 12–21. [Google Scholar]
  31. Bamberg, S.; Moser, G. Twenty years after Hines, Hungerford, and Tomera: A new meta-analysis of psycho-social determinants of pro-environmental behavior. J. Environ. Psychol. 2007, 27, 14–25. [Google Scholar] [CrossRef]
  32. Chawla, L. Research methods to investigate significant life experiences: review and recommendations. Environ. Educ. Res. 2006, 12, 359–374. [Google Scholar] [CrossRef]
  33. Marcinkowski, T. An Analysis of Correlates and Predictors of Responsible Environmental Behavior. PhD Dissertation, Southern Illinois University, Carbondale, IL, USA, 1988. [Google Scholar]
  34. Sivek, D. An Analysis of Selected Predictors of Environmental Behavior of Three Conservation Organizations. PhD Dissertation, Southern Illinois University, Carbondale, IL, USA, 1988. [Google Scholar]
  35. Dunlap, R.E.; Gallup, G.; Gallup, A. Global environmental concern: Results from an international public opinion survey. Environment 1993, 35, 7–15. [Google Scholar] [CrossRef]
  36. Coyle, K. Environmental Literacy in America. What Ten years of NEETF/Roper Research and Related Studies Say about Environmental Literacy in the U.S.; The National Environmental Education & Training Foundation: Washington, DC, USA, 2005. [Google Scholar]
  37. UNESCO. United Nations Decade of Education for Sustainable Development 2005-2014. Draft Implementation Scheme; UNESCO: Paris, France, October 2004. Available online: portal.unesco.org/education/en/file_download.php/03f375b07798a2a55dcdc39db7aa8211Final+IIS.pdf (accessed on 1 August 2007).
  38. LaPiere, R.T. Attitudes vs. actions. Soc. Forces 1934, 13, 230–237. [Google Scholar] [CrossRef]
  39. Wicker, A.W. Attitudes vs. action: The relation of verbal and overt behavioral responses to attitude objects. J. Soc. Issues 1969, 25, 41–78. [Google Scholar] [CrossRef]
  40. Kraus, S.J. Attitudes and the prediction of behavior: A meta-analysis of the empirical literature. Personal. Soc. Psychol. Bull. 1995, 21, 58–75. [Google Scholar] [CrossRef]
  41. Petty, R.E.; Haugtvedt, C.P.; Smith, S.M. Elaboration as a Determinant of Attitude Strength: Creating Attitudes that are Persistent, Resistant, and Predictive of Behavior. In Attitude Strength: Antecedents and Consequences; Petty, R.E., Krosnick, J.A., Eds.; Lawrence Erlbaum Associates: Mahwah, NJ, USA, 1995; pp. 93–130. [Google Scholar]
  42. Acock, A.C.; Defleur, M. A configurational approach to the contingent consistency model of the attitude behavior relationship. Am. Sociol. Rev. 1972, 37, 714–726. [Google Scholar] [CrossRef]
  43. Warner, L.G.; Defleur, M.L. Attitude as an interactional concept: Social constraint and social distance as intervening variables between attitudes and action. Am. Sociol. Rev. 1969, 34, 153–169. [Google Scholar] [CrossRef]
  44. Krosnick, J.A.; Petty, R.E. Attitude Strength: An Overview. In Attitude Strength: Antecedents and Consequences; Petty, R.E., Krosnick, J.A., Eds.; Erlbaum: Mahwah, NJ, USA, 1995; pp. 1–24. [Google Scholar]
  45. Abelson, R.P. Are Attitudes Necessary? In Attitudes,Conflicts,and Social Change; King, B.T., McGinnies, E., Eds.; Academic Press: New York, NY, USA, 1972; pp. 19–32. [Google Scholar]
  46. Fazio, R.H. Attitudes as Object Evaluation Associations: Determinants, Consequences, and Correlates of Attitude Accessibility. In Attitude Strength: Antecedents and Consequences; Petty, R.E., Krosnick, J.A., Eds.; Erlbaum: Mahwah, NJ, USA, 1995; pp. 247–282. [Google Scholar]
  47. Gross, S.R.; Holtz, R.; Miller, N. Attitude Certainty. In Attitude Strength: Antecedents and Consequences; Petty, R.E., Krosnick, J.A., Eds.; Erlbaum: Mahwah, NJ, USA, 1995; pp. 215–246. [Google Scholar]
  48. Mackie, D.M. Systematic and nonsystematic processing of majority and minority persuasive communications. J. Personal. Soc. Psychol. 1987, 53, 41–52. [Google Scholar] [CrossRef]
  49. Tesser, A. On the importance of heritability in psychological research: The case of attitudes. Psychol. Rev. 1993, 100, 129–142. [Google Scholar] [CrossRef]
  50. Chaiken, S.; Pomerantz, E.M.; Giner-Sorolla, R. Structural Consistency and Attitude Strength. In Attitude Strength: Antecedents and Consequences; Petty, R.E., Krosnick, J.A., Eds.; Erlbaum: Mahwah, NJ, USA, 1995; pp. 387–412. [Google Scholar]
  51. Disinger, J.F.; Tomsen, J.L. Environmental education research news. Environmentalist 1995, 15, 3–9. [Google Scholar] [CrossRef]
  52. Norton, B.G. Toward Unity among Environmentalists; Oxford University Press: New York, NY, USA, 1991. [Google Scholar]
  53. McKenzie, J. Fundamental flaws in the five factor model: A re-analysis of the seminal correlation matrix from which the “openness to experience” factor was extracted. Personal. Individ. Differ. 1998, 24, 475–480. [Google Scholar] [CrossRef]
  54. Petty, R.E.; Cacioppo, J.T. Communication and Persuasion: Central and Peripheral Routes to Attitude Change; Springer-Verlag: New York, NY, USA, 1986. [Google Scholar]
  55. Hovland, C.I.; Irving, K.J.; Kelley, K.H. Communication and Persuasion; Yale University Press: New Haven, CT, USA, 1953. [Google Scholar]
  56. Downing, J.W.; Judd, C.M.; Brauer, M. Effects of repeated expressions on attitude extremity. J. Personal. Soc. Psychol. 1992, 63, 17–29. [Google Scholar] [CrossRef]
  57. Zajonc, R.B.; Markus, H. Affective and cognitive factors in preferences. J. Consum. Res. 1982, 9, 123–131. [Google Scholar]
  58. Festinger, L. A Theory of Cognitive Dissonance; Stanford University Press: Stanford, CA, USA, 1957. [Google Scholar]
  59. Aronson, E. The Social Animal; W.H. Freeman: New York, NY, USA, 1972. [Google Scholar]
  60. Aronson, E. The Jigsaw Classroom; Sage Publications: Beverly Hills, CA, USA, 1978. [Google Scholar]
  61. Brehm, J.W.; Cohen, A.R. Explorations in Cognitive Dissonance; Wiley: New York, NY, USA, 1962. [Google Scholar]
  62. Festinger, L.; Carlsmith, J.M. Cognitive consequences of forced compliance. J. Abnorm. Soc. Psychol. 1959, 58, 203–211. [Google Scholar] [CrossRef]
  63. Zanna, M.; Cooper, J. Dissonance and the pill: An attribution approach to studying the arousal properties of dissonance. J. Personal. Soc. Psychol. 1974, 29, 703–709. [Google Scholar] [CrossRef]
  64. Ceci, S.J.; Bruck, M. Suggestibility of the child witness: A historical review and synthesis. Psychol. Bull. 1993, 113, 403–439. [Google Scholar] [CrossRef]
  65. Messerschmidt, R. The suggestibility of boys and girls between the ages of six and sixteen. J. Genet. Psychol. 1933, 43, 422–437. [Google Scholar]
  66. Alwin, D.F.; Cohen, R.L.; Newcomb, T.M. Political Attitudes over the Lifespan: The Bennington Women After Fifty Years; University of Wisconsin Press: Madison, WI, USA, 1991. [Google Scholar]
  67. Glenn, J. Freud’s Advice to Han’s Father: The First Supervisory Sessions. In Freud and His Patients; Kanzer, M., Glenn, J., Eds.; Jason Aronson: New York, NY, USA, 1980; pp. 121–143. [Google Scholar]
  68. Angelis, J. Bringing old and young together. Vocat. Educ. J. 1990, 65, 19–21. [Google Scholar]
  69. Ballantyne, R.; Connell, S.; Fien, J. Factors contributing to intergenerational communication regarding environmental programs: Preliminary research findings. Aust. J. Environ. Educ. 1998, 14, 1–10. [Google Scholar]
  70. Ballantyne, R.; Connell, S.; Fien, J. Students as catalysts of environmental change: A framework for researching intergenerational influence through environmental education. Environ. Educ. Res. 2006, 12, 413–427. [Google Scholar] [CrossRef]
  71. Ballantyne, R.; Fien, J.; Packer, J. Program effectiveness in facilitating intergenerational influence in environmental education: Lessons from the field. J. Environ. Educ. 2001, 32, 8–15. [Google Scholar] [CrossRef]
  72. Ballantyne, R.; Packer, J. Teaching and learning in environmental education: Developing environmental conceptions. J. Environ. Educ. 1996, 27, 25–32. [Google Scholar] [CrossRef]
  73. Eilam, E.; Trop, T. The Influence of Environmental Schools on Their Communities. Thesis Book; Lambert Academic Publishing: Saarbrücken, Germany, 2011. [Google Scholar]
  74. Foxman, E.R.; Tansuhaj, P.S.; Ekstrom, K.M. Adolescents’ influence in family purchase decisions: A socialization perspective. J. Bus. Res. 1989, 18, 159–172. [Google Scholar] [CrossRef]
  75. Uzzell, D. Children as Catalysts of Environmental Change: Final Report; European Commission Directorate General for Science Research and Development Joint Research Centre: Brussels, Belgium, 1994. [Google Scholar]
  76. Central Bureau of Statistics (CBS) of Israel. Available online: http://www.cbs.gov.il/ (accessed on 6 June 2010).
  77. Marcinkowski, T.; Rehrig, L. The Secondary School Report: A Final Report on the Development, Pilot Testing, Validation, and Field Testing of the Secondary School Environmental Literacy Assessment Instrument. In Environmental Education Literacy/Needs Assessment Project: Assessing Environmental Literacy of Students and Environmental Education Needs of Teachers: Final Report for 1993-1995; Wilke, R., Ed.; University of Wisconsin-Stevens Point: Stevens Point, WI, USA, 1995; pp. 30–76. [Google Scholar]
  78. Ajzen, I. Attitudes, Personality,and Behavior; Open University Press: Milton-Keynes, UK, 1988. [Google Scholar]
  79. Ajzen, I.; Fishbein, M. Understanding Attitudes and Predicting Social Behavior; Prentice-Hall: Englewood-Cliffs, NJ, USA, 1980. [Google Scholar]
  80. Baker, C. Attitudes and Language. Multilingual Matters 83; Multilingual Matters: Clevendon, UK, 1992. [Google Scholar]
  81. Shaw, M.E.; Wright, J.M. Scales for the Measurement of Attitudes; McGraw Hill: New York, NY, USA, 1967. [Google Scholar]
  82. Wegener, D.T.; Carlston, E.E. Cognitive Processes in Attitude Formation and Change. In The Handbook of Attitudes and Attitude Change; Albarracín, D., Johnson, B.T., Zanna, M.P., Eds.; Lawrence Erlbaum Associates: Mahwah, NJ, USA, 2005. [Google Scholar]
  83. Sudman, S.; Bradburn, N.M. Asking Questions: A Practical Guide to Questionnaire Design; Jossey-Bass Publishers: San Francisco, CA, USA, 1983. [Google Scholar]
  84. Goldman, D.; Yavetz, B.; Peer, S. Environmental literacy in teacher training in Israel: Environmental behavior of new students. J. Environ. Educ. 2006, 38, 3–20. [Google Scholar] [CrossRef]
  85. Hsu, S.J. The effects of an environmental education program on responsible environmental behavior and associated environmental literacy variables in Taiwanese college students. J. Environ. Educ. 2004, 35, 37–48. [Google Scholar] [CrossRef]
  86. Negev, M.; Sagy, G.; Garb, Y.; Salzberg, A.; Tal, A. Evaluating the environmental literacy of Israeli elementary and high school students. J. Environ. Educ. 2008, 39, 3–20. [Google Scholar]
  87. Meinhold, J.L.; Malkus, A.J. Adolescent environmental behaviors: Can knowledge, attitudes and self-efficacy make a difference? Environ. Behav. 2005, 37, 511–532. [Google Scholar] [CrossRef]
  88. OECD-Documents, Evaluating Innovation in Environmental Education; Pettigrew, M.; Somekh, B. (Eds.) OECD: Paris, France, 1994.
  89. Posch, P. The ecologisation of schools and its implications for educational policy. Camb. J. Educ. 1999, 29, 341–348. [Google Scholar] [CrossRef]
  90. Schnack, K. Action Competence as a Curriculum Perspective. In Critical Environmental and Health Education-Research Issues and Challenges; Jensen, B.B., Schnack, K., Simovska, V., Eds.; Danish University of Education: Copenhagen, Denmark, 2000; pp. 107–127. [Google Scholar]
  91. The United Nations Educational, Scientific and Cultural Organization (UNESCO), Intergovernmental Conference on Environmental Education: Tbilisi (USSR), 14-26 October 1977. Final Report; UNESCO, Paris, France, 1978.
  92. Eilam, E.; Trop, T. Factors influencing adults’ environmental attitudes and behaviors and the role of environmental schools in influencing their communities. Educ. Urban Soc. 2012, June, 1–30. [Google Scholar]
  93. Harman, H.H. Modern Factor Analysis; The University of Chicago Press: Chicago, IL, USA, 1976. [Google Scholar]
  94. McGuire, W.J. Attitudes and Attitude Change. In Handbook of Social Psychology; Lindzey, G., Aronson, E., Eds.; Random House: New York, NY, USA, 1985. [Google Scholar]
  95. Broadbent, D.E. Levels, hierarchies, and the locus of control. Q. J. Exp. Psychol. 1977, 29, 181–201. [Google Scholar] [CrossRef]
  96. Doyle, J.K. The cognitive psychology of systems thinking. Syst. Dyn. Rev. 1997, 13, 253–265. [Google Scholar] [CrossRef]
  97. Norman, D. Some Observations on Mental Models. In Mental Models; Gentner, D., Stevens, A.L., Eds.; Erlbaum: Hillsdale, NJ, USA, 1983; pp. 7–14. [Google Scholar]
  98. Uzzell, D.L. Education for environmental action in the community: New roles and relationships. Camb. J. Educ. 1999, 29, 397–413. [Google Scholar] [CrossRef]
  99. Vadeboncoeur, J.A. Child Development and the Purpose of Education: A Historical Context for Constructivism. In Constructivist Teacher Education: Building a World of New Understandings; Richardson, V., Ed.; Falmer Press: London, UK, 1997; pp. 15–37. [Google Scholar]
  100. Bryant, C.A.; Forthofer, M.; Brown, K.M.; Landis, D.; McDermott, R.J. Community-based prevention marketing-The next steps in disseminating behavior change. Am. J. Health Behav. 2000, 24, 61–68. [Google Scholar] [CrossRef]
  101. Cialdini, B.; Goldstein, N.J. Social influence: Compliance and conformity. Annu. Rev. Psychol. 2004, 55, 591–621. [Google Scholar] [CrossRef]
  102. Mackenzie-Mohr, D.; Smith, W. Fostering Sustainable Behavior; New Society Publishers: Gabriola Island, BC, Canada, 1999. [Google Scholar]
  103. Schultz, P.W.; Nolan, J.M.; Cialdini, B.; Goldstein, N.J.; Griskevicius, V. The constructive, destructive, and reconstructive power of social norms. Psychol. Sci. 2007, 18, 429–434. [Google Scholar] [CrossRef]
  104. Stern, P.C. New environmental theories: Toward a coherent theory of environmentally significant behavior. J. Soc. Issues 2000, 56, 407–424. [Google Scholar]
  105. Zelezny, L.C. Educational interventions that improve environmental behaviors: A meta-analysis. J. Environ. Educ. 1999, 31, 5–14. [Google Scholar] [CrossRef]
  106. Ausubel, D.P. Educational Psychology: A Cognitive View; Holt, Rinehart, and Winston, Inc.: New York, NY, USA, 1968. [Google Scholar]
  107. Novak, J.D. Understanding the learning processes and effectiveness of teaching methods in the classroom laboratory and field. Sci. Educ. 1976, 60, 493–512. [Google Scholar] [CrossRef]
  108. Arnstein, S. A ladder of citizen participation. J. Am. Inst.Plann. 1969, 4, 216–224. [Google Scholar]
  109. Albarracin, D.; Wyer, R.S. The cognitive impact on past behavior: Influences on beliefs, attitudes and future behavioral decisions. J. Personal. Soc. Psychol. 2000, 79, 5–22. [Google Scholar] [CrossRef]
  110. Crano, W.D.; Burgoon, M. Mass Media and Drug Prevention: Classic and Contemporary Theories and Research; Lawrence Erlbaum Associates: Mahwah, NJ, USA, 2002. [Google Scholar]
  111. Olson, J.M.; Stone, J. The Influence of Behavior on Attitudes. In The Handbook of Attitudes; Albarracin, D., Johnson, B.T., Zanna, M.P., Eds.; Lawrence Erlbaum Associates: Mahwah, NJ, USA, 2005. [Google Scholar]
  112. Martin, G.L.; Pear, J. Behavior Modification: What It Is and How to Do It, 7th ed; Prentice-Hall: New York, NY, USA, 2002. [Google Scholar]
  113. Paul, D.P.; Handlin, A.; Stanton, A.D. Primary care physicians’ attitudes toward direct-to-consumer advertising of prescription drugs: Still crazy after all these years. J. Consum. Mark. Santa Barbar. 2002, 19, 564–574. [Google Scholar] [CrossRef]
  114. Heimlich, J.E.; Ardoin, N.M. Understanding behavior to understand behavior change: A literature review. Environ. Educ. Res. 2008, 14, 215–237. [Google Scholar] [CrossRef]
  115. Nobel Prizes. Available online: http://nobelprize.org/nobel (accessed on 6 April 2012).

