Article

Municipal Added Value through Solar Power Systems in the City of Freiburg

Centre for Renewable Energies, University of Freiburg, Tennenbacher Straße 4, 79106 Freiburg, Germany
Sustainability 2012, 4(5), 819-839; https://doi.org/10.3390/su4050819
Submission received: 29 February 2012 / Revised: 5 April 2012 / Accepted: 5 April 2012 / Published: 2 May 2012

Abstract

:
The transformation of the conventional energy system towards renewable energies has entailed an increasing decentralization of energy generation in Germany, as the production units are smaller and draw on regional potentials. This can result in positive socio-economic effects in regions where the potential is exploited. The focus of this paper lies on evaluating existing methods and developing new ones, which can be used to determine local added value through renewable energy systems. The methods were required to cover direct as well as induced municipal added value effects and to include all steps of the examined value chain. A combination of methods was tested in a case study for the solar power system value chain in the city of Freiburg (ca. 220,000 inhabitants). The added value through this sector in the year 2009 was calculated at 30.8 million euros through direct effects and 6.2 million euros through induced effects. This total municipal added value of 37 million euros can be converted into roughly 1,500 jobs within the city boundaries. Based on some conservative assumptions, these numbers should be considered as minimum values.

1. Introduction

The increasing utilization of renewable energies (RE) is a vital step towards a more sustainable society. This recognition led to efforts on different political levels, like the European Union goal to supply 20 percent of the electricity needs from renewable sources by 2020. A guaranteed feed-in tariff through the Renewable Energy Act (EEG) has caused a sharp increase in the RE share for power production in Germany from 6.4 percent in the year 2000 to 16.4 percent in 2009 [1]. This expansion entailed a stronger decentralization of the German energy system, as comparably small systems were installed that draw on regional potentials. This offers the chance for more municipalities to participate and profit from the changing electricity market and the economic effects on the municipal socio-economy. The argument of local added value is used in the process of decision-making for or against new sites for RE installations and can offer valuable arguments for local actors. However, reliable data is usually missing when arguing for local added value of RE. This is the starting point for the present paper: The scientific evaluation of local economic effects in terms of local added value through the application of RE is still a young research field with only a few studies published on this topic. Furthermore, only initial methodological approaches exist. The author of this paper has been a research assistant in the preparation of one of those studies [2], which acts as a basis for the evaluation and further development of appropriate methods in this paper. The emphasis of the present paper lies on methodological improvements for calculating local added value through RE. A focus is set on the evaluation of the value chain, the inclusion of missing steps (especially Research and Development, R&D) and the measurement of induced economic effects at the local level. The methodological advances are tested in the manner of a case study for the city of Freiburg for the solar power (The term solar power is used to emphasize that all solar technologies that generate electricity are included) sector in 2009.

2. Literature Review

The evaluation of an increasing utilization of RE technologies is often discussed in context with the concept of sustainable development. Del Río and Burguillo [3] show in their literature overview that an emphasis in scientific papers about this topic is often put on ecological effects and that socio-economic effects are seldom the focus. A few examples from case studies in developing countries are mentioned, but as this paper focuses on a city in a highly developed country, they are not discussed any further.
Existing studies about the socio-economic effects of RE are usually limited to surveys on the national level and employment effects. The results of these studies (e.g., [4,5]) vary strongly depending on the system boundaries and assumptions e.g., fuel price changes in the future. Data on the national level can be helpful to understand general developments in the RE sector. To be useful for municipal actors though, these have to be broken down to the local level. For that, a generalization is difficult, as effects in municipalities can be quite unequally distributed. While some utilize their potential, others might lack political or entrepreneurial will.
Only a very few studies examine economic effects on the regional or municipal level. Del Río and Burguillo [3] developed a theoretical framework to test the sustainability and involvement of stakeholders for individual projects. An analysis of all economic effects caused by RE on the local level has hardly been done before. Hoppenbrock and Albrecht [6] describe a general RE value chain (cf.Figure 1). The authors show an exemplary calculation that only includes effects on the horizontal part of the value chain.
Figure 1. Schematic value chain of a regional energy economy [6].
Sustainability 04 00819 g001
Figure 2. The value chain in the study area (modified after [7]).
Sustainability 04 00819 g002
One of the most comprehensive studies about municipal economic effects of the utilization of RE-technologies in Germany so far was conducted in 2010 [2]. For the first time an attempt was made to calculate effects along the whole value chain of all decentrally available RE-technologies.

3. Background and Case Study Design

3.1. Municipal Added Value and Value Chains

The term “added value” is used in this paper to refer to economic effects on all steps of the life-cycle of the product or service. Thereby, only the additional value that is generated on each step is taken into account for the calculation of the added value effects (cf. Figure 2).
In the literature, the term “municipal” as well as “regional added value” can be found. As it is only a matter of spatial system boundaries and as the case study is conducted in a city, only the term “municipal added value” is used in this paper. The calculation of municipal added value is performed in many different contexts and is often connected to showcasing the benefit of an event (e.g., football world cup, cf. [8]) or project (e.g., new coal power plants in West Germany, cf. [9]). Figure 2 shows an example of the different steps on a value chain and the municipal economic effects. Added value is generated on all these steps of the value chain but only considered in the calculations once. Inputs from outside of the municipality are acknowledged but not calculated as part of the municipal added value.
This paper contends that the R&D step which is not included in Figure 2 and has not been considered in comparable studies about RE can provide a significant share of the added value on the value chain. However, the importance of R&D is recognized in the scientific evaluation of regional economic clusters [10]. On the one hand R&D institutions generate added value through income and employment effects and on the other hand it can impact on other steps of the value chain, e.g., through spin-offs or technology transfer. Additionally, small service enterprises (e.g., law firms, PR agencies) have not been considered in comparable studies and are included in this one, especially as these companies will most likely stay in developed countries like Germany even if the production might already be outsourced to countries with lower employment costs.
Contrary to purely business oriented approaches, public dues and taxes are considered as a positive contribution to the local economy. The calculation of the municipal added value generally follows the aspects mentioned by Hirschl et al. [2]: The respective municipal share of the enterprise’s profits, the net incomes, as well as the income and business taxes. Investments into machinery and buildings by the relevant companies and institutions are acknowledged but only considered within the calculations on the R&D step, as only at this step do the invested funds not stem from the profit margins. These direct effects generate additional added value through reinvestments, which are called induced effects and are also considered in this paper.

3.2. Case Study Design

The evaluated and extended methodology for calculating municipal added value is applied in the manner of a case study. The context for this case study is the selection of one technology, photovoltaic (PV) systems, within a clearly defined study area, the city of Freiburg. The year 2009 was chosen for the survey, as data for the year 2010 and was not yet available during the interview period.
The value chain for solar systems for power generation in Germany is dominated by non-concentrating PV-systems as these are market-ready and can be used under German climatic conditions. In this study, all other solar technologies for power generation (e.g., organic cells, concentrated systems) are considered on the relevant steps of the value chain as well. The value chain for these systems is based on the approaches of Hirschl et al. [2] as well as Hoppenbrock and Albrecht [6] and extended by the author of this paper.
Figure 3 shows the general value chain for solar power systems. Depending on the capacity and the assembly site, certain steps are important or do not need to be considered for the calculations, e.g., wholesale loses importance for larger installations as the owner is more likely to buy directly from the manufacturer. The aspects distribution/storage, sales/marketing and services/consumption are not considered individually as they are covered through the electricity price or the EEG reallocation charge.
Figure 3. The solar power systems value chain (own elaboration according to [2] and [6]).
Sustainability 04 00819 g003
The case study was conducted in the city of Freiburg. Freiburg is a municipality in the south-west of Germany and was chosen as the author had relatively good access to information and contact persons and because it has an outstanding position in the field of solar energies. The installed PV-capacity is above average for German cities of similar size and enterprises on the whole value chain in addition to the world’s second largest solar research institute can be found within the city boundaries.

4. Research Design and Methods

4.1. Research Design and System Borders

The research design closely followed the steps shown in Figure 4. The calculation of the municipal added value is based on two different methods. Hirschl et al. [2] developed a model that was critically evaluated, modified and then used for this study (step 1 and 2 in Figure 4). As this model is normalized on the unit euro per kilowatt peak (€/kWp), it cannot be applied for some businesses of the services sector (e.g., law firms, PR agencies) and R&D outside of enterprises, as those do not aim to generate an output in €/kWp. For these cases, another method is used that draws on employment numbers and assumptions concerning other communal effects. Both methods have an intersection at the net-incomes and can therefore be combined (step 1). To be able to include induced effects as well (step 3), both methods are further developed and a multiplier is used for these calculations. Data is collected in step four and entered into the model to calculate results for the year 2009 (step 5).
Figure 4. Research steps and activities (own elaboration).
Sustainability 04 00819 g004
For the correct calculation of municipal added value effects, it is important to distinguish if the examined effects are caused in or outside of the city boundaries, and that only the effects inside are taken into account. For example, a Freiburg based enterprise finances PV-systems outside the city, which causes an effect inside the city, but all other steps of the value chain (e.g., planning and installation) should not be considered as they are carried out beyond the city boundaries.
Upstream steps of the value chain, for example the planning and construction of manufacturing plants or research laboratories, are not part of this study either, but they are indirectly included, as they are part of the product or service prices.

4.2. Methods of Data Calculation

In the literature, different definitions for the different kinds of added value can be found [11]. In the present paper, the terms “direct” and “induced added value effects” are used. Direct effects include the communal share of profits, taxes, incomes and investments (cf. Section 4.2.1) while induced effects are the additional effects caused by the communal share of the reinvestments of the direct effects.

4.2.1. Direct Added Value Effects

The method by Hirschl et al. [2] distinguishes cost structures for small (SR; <30 kWp) and large (LR; ≥30 kWp) rooftop PV-systems as well as open space systems (OS), as the costs differ significantly and the additional equipment is not completely the same (e.g., OS systems are required to be fenced off). For 2009 Hirschl et al. calculated the costs for SR and LR systems at 2,754 €/kWp and 2,528 €/kWp, respectively, and for OS systems at 2,411 €/kWp. Interviews with local experts and enterprises showed that these numbers were too low. They mentioned that costs were 15 to 20 percent higher and enterprises had end-consumer prices between 3,000 and 3,700 euros for rooftop systems. The basic values for the calculations in this paper were therefore increased by 20 percent for all three types. Values for all steps of the value chain that are considered by Hirschl et al. are modified proportionally, only the values for the operator profits are unchanged as these were calculated separately by the authors. The added value effects in all three system categories are shown in Table 1. Additional costs for renting land were not included here, as no open space systems exist within the city boundaries. This should be considered for similar studies about other technologies or in other areas.
Table 1. Municipal added value effects of PV-systems in Germany.
Added value stepsAfter-tax earningsEmployment costs (net)Business tax (net)Income tax
€/kWp€/kWp€/kWp€/kWp
One-time effects
SR*LROSSRLROSSRLROSSRLROS
Modules139120120385331331242020231919
Wholesale modules282424675858555444
Modules443838137118118777877
Cells3631311099494655766
Wafer191717595050422444
Metallic raw materials121111141313211111
Inverters161313665555222444
Wholesale inverters655141212111111
Manufacturing inverters1088524343111422
Project planning4131325104104122266
Installation4135292631881507651287
Wholesale installation material687131917111111
Manufacturing installation material81312405649122222
SR*LROSSRLROSSRLROSSRLROS
Assembly19121115411384422654
Grid connection7//58//1//2//
Total investment and associated costs199182176740679640353130403836
Annual effects
Total operation costs677121414111111
Operation staff/ /22/ /0.10.1
Maintenance11.217660.40.20.20.40.40.4
Insurance0.20.20.20.20.20.2000000
Banks (financing through outside capital)5665660.71.2110.40.4
Gross profit of partnership90// //0//6//
Operating company/7447/66/127/32
Management/ /66/ /0.40.4
Liability remuneration/11/ / /
Gross profit of limited commercial partnership/7346/ /127/21
Business tax / / /127/
Financing through equity (limited partners)/ / / /21
* SR, LR and OS stand for small and large rooftop PV-systems and open space PV-systems. (Source: modified from [2]).
The data that was collected in the unit of kWp in interviews with the organizations that generate added value in Freiburg was multiplied with the respective numbers in Table 1. For some steps of the value chain, data about already existing as well as newly installed PV-systems from Table 2 was used instead of interviews with each enterprise (cf. Section 5.2). Data from Baden-Württemberg (BW) (Baden-Württemberg is the federal state in Germany in which the city of Freiburg is located) was used for effects that were caused by enterprises from Freiburg (FR) operating outside of the city boundaries while the values for Freiburg were used for effects inside the city.
Table 2. Existing and newly installed PV-systems in 2009.
System categoryNew systems in BW [% in kWp]New systems in FR [% in kWp]Existing systems in BW [% in kWp]Existing systems in FR [% in kWp]
SR43506152
LR41502848
OS160110
(Source: [12,13]).
The total capacity of PV-systems at the end of 2009 and the newly installed capacity within 2009 are the basis for calculations on some value chain steps (cf. Table 3).
Table 3. Photovoltaic systems in Freiburg.
YearInstalled capacity [kWp]New systems [kWp]Existing systems [kWp]
200812,117n/an/a
200915,2973,18013,707
(Source: [14]).
Another approach is necessary for steps of the value chain that cannot be calculated with the unit €/kWp. For this, the number of employees is the starting point for determining the net income effects, which can then be combined with the other results. Therefore, assumptions for average social security costs that are covered by employers and employees (15% each) and average income tax (18%) were taken from Blume & Fromm [15]. The following steps were conducted to calculate the net employment costs:
Personnel costs – employer’s share of social security (15%) = gross income of employee
Gross income – employee’s share of social security and income tax (33%) = net income
= net employment costs
Not all enterprises and institutions were willing to disclose their personnel costs. For these cases assumptions or data from the German Federal Bureau of Statistics [16,17] and the German Federal Ministry of Finance [18] regarding average incomes of employees in the respective sectors were used (cf. Table 4). These calculation steps were also applied for self-employed labor, e.g., lawyers. They are not obliged to pay for social security, but it is assumed that a similar private coverage is in place.
Table 4. Gross income per employee.
Added value stepGross income/employee [€]
Manufacturing42,392
Wholesale38,958
Financing & insurance58,473
Project planning54,662
Installation/assembly37,522
Other services
Information and communication56,985
Lawyers52,589
(Source: [16,17,18]).
It is necessary to note that only a certain share of the net employment costs and therefore also of the income taxes is effective locally, as not all employees have their residency within the city boundaries. Not all interviewees disclosed values for the employee’s residencies—taken from interview statements, an average of 75 percent of the entire work force is assumed to live in Freiburg. According to Spehl et al. [11] it is assumed that 10 percent of the net incomes of employees living outside the city boundaries are spent in their city of employment. These aspects are also used to correct the net employment and income tax effects, which are calculated according to Hirschl et al.’s [2] method. Employment numbers are covered in the unit of full time equivalents. According to Spehl et al. [11] it is assumed that one average job corresponds to 0.9 full time equivalents.
Public research facilities and universities play a special role in determining municipal added value. The described effects through employment and investments can be characterized as output or demand effects. They are rather short-term, as they would cease to exist once the institution is closed. Additionally to these effects, more long-term knowledge or supply effects are triggered that would only decrease slowly after a potential shut down (cf. Figure 5.). This includes personalized knowledge transfer, e.g., through education of personnel which is provided to the local economy, and knowledge that is independent of persons, e.g., patents or publications that can have communal effects [19]. The setup of research facilities and universities can also have a positive influence on the reputation of the location [20].
Figure 5. Municipal effects of research facilities and universities (own elaboration after [20]).
Sustainability 04 00819 g005
The knowledge or supply effects can be most easily measured in terms of spin-offs, as they are part of the local value chain. The consideration of the other effects is more difficult and is not within the scope of this paper.

4.2.2. Induced Added Value Effects

The calculation of induced effects is mostly done with an Input-Output-Analysis or the Keynesian Multiplier Analysis [21]. Detailed data about the input relations of the respective industrial sector is needed for the Input-Output-Analysis but is not available for solar power systems in Freiburg. Hence, the Keynesian Multiplier Analysis is used for this paper. Induced added value describes the additional effects that are generated from reinvesting the direct added value. Theoretically, this can happen in an indefinite amount of loops, whereas the amount decreases significantly with each loop through monetary flows leaving the city or through taxes and saving rates [21]. The multiplier is influenced by the economic integration of the municipality—the marginal propensity to consume, the local import quota, as well as the marginal saving rate and transfer payments have an influence [11].
An extensive calculation of the multiplier requires exact data for these aspects which are not or only partly available for Freiburg. Spehl et al. [11] found multiplier values between 1.05 and 1.9 in their literature review covering studies all over Germany with values between 1.2 and 1.6 occurring most often. As the import quota strongly depends on the size of the study area and the available production capacities within this area needed to satisfy municipal consumption, it has to be assumed that a rather high quota applies for the city of Freiburg, which lowers the multiplier. Therefore a conservative multiplier value of 1.2 is used in this paper.

4.3. Methods of Data Collection and Analysis

The data collection was done through both conducting interviews and using statistical values and analyzing publicly accessible information sources like enterprises’ websites.
Experts of the solar power systems value chain were interviewed to evaluate the chain and find possible gaps or mistakes. Experts with knowledge about the general situation of the solar industry in Freiburg were interviewed, who were also asked to complete a list of relevant organizations that are directly responsible for the generation of municipal added value in Freiburg. Representatives of these enterprises and institutions were questioned subsequently. According to the “snowball principle”, they were also asked about competitors on their step of the value chain in order to identify organizations that might have been missed. The seven expert interviews were conducted personally and the 16 interviews with enterprise and organization representatives, depending on availability, by phone, written or personal contact.
The seven initial interviews were analyzed in detail. Aspects concerning the value chain, market trends and statements about the solar power industry in Freiburg and the relevant organizations of that industry were of special interest. The interviews with representatives of enterprises and institutions were searched for values needed for the calculations.
Some enterprises asked for an anonymous and cumulated presentation of their data. The results are therefore aggregated at each step of the value chain and no real names are used. Instead, the first letter of the step and a number were used where necessary.

5. Results

5.1. Evaluation of the Value Chain

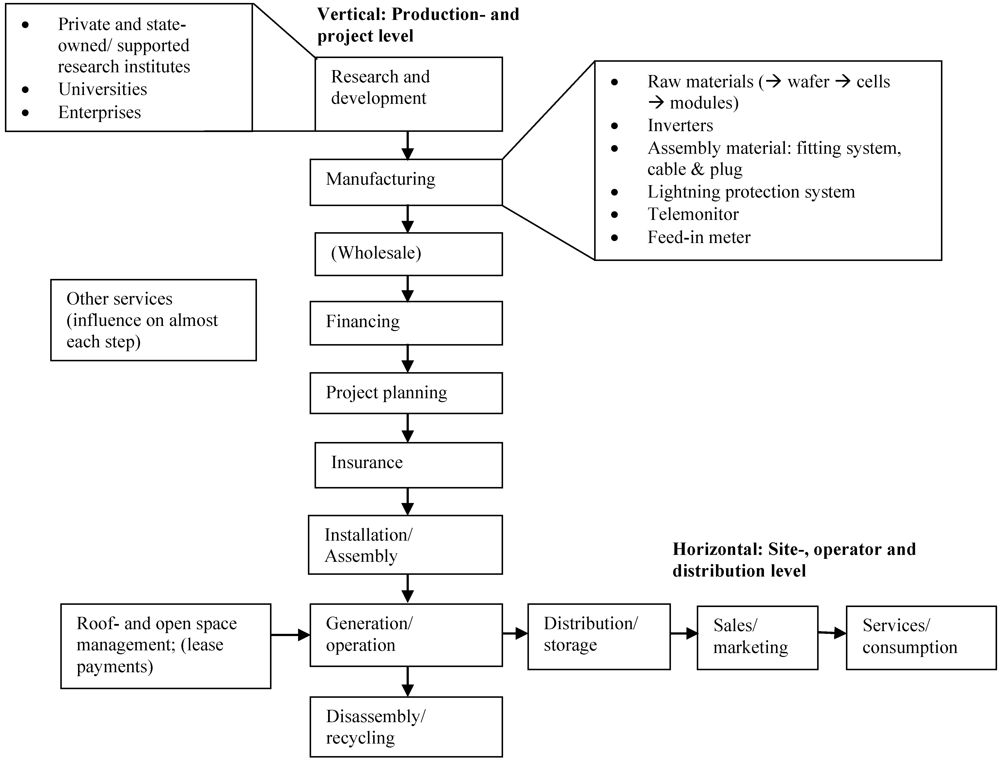
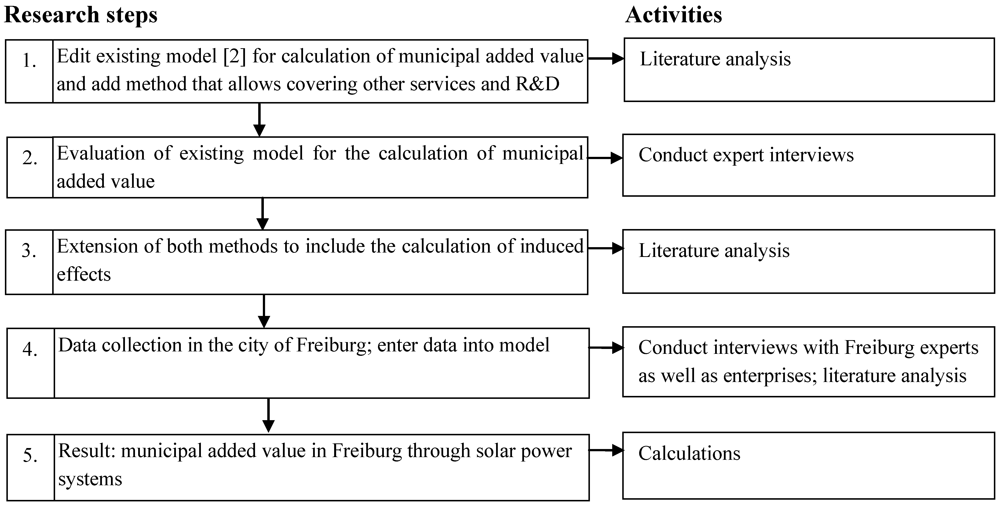
As one of the first steps, the value chain for solar power systems was identified. The existing literature was a starting point (cf. Section 2) but it showed that some aspects of the chain were not considered. Especially R&D as an initiator and driver of innovations and some parts of the services sector were not covered. Both aspects had already been added (see Figure 3) before value chain experts were interviewed. The interviewees stated that the depiction of the value chain was complete but that some features or ambiguities needed to be understood and explained: For the manufacturing it needs to be considered that the production steps for crystalline and thin-film PV are different. The distribution of PV systems occurs through different channels. Some producers deliver through wholesalers and others directly to their end-consumers. Wholesalers can also act as importers of systems but ultimately this has no influence on the generation of added value as only the distribution is considered at this step of the chain. Small and large systems at the project planning step must be differentiated. Small rooftop systems are usually planned by the installer, larger rooftop or open space systems are often planned by a project planner who also takes care of other aspects like financing, administrative authorization etc. These differences are considered by Hirschl et al. [2] and can be seen in Table 1 where project planning is one of the few steps that are more costly for larger systems. The positioning of insurances in the value chain has also been discussed. It can be argued whether an insurance contract should be closed before or after the assembly of the system. One expert mentioned that the more professional the planner, the earlier a contract is signed. This point is negligible, as added value, which is only very small on this step, is generated anyway. It was noted that the installation can be done by enterprises that are specialized in solar systems only or by conventional electricians, roofers or heating installers that offer PV panels in addition to their usual systems. This differentiation is vital for the data collection on this step of the value chain. Interviewing each single enterprise that offers solar systems would have been very time consuming and the return of answers would probably have been incomplete. Instead, the large specialized enterprises were interviewed and the others covered through the official number of PV-systems in Freiburg.
Several actors gave statements about general aspects concerning the added value chain. One expert strongly emphasized the different market segments: Private investors who build rather small systems, medium-sized investors with larger systems and professional investors that build many systems on a large scale with a strong profit-orientation. These categories can be found in Hirschl et al.’s [2] method.
Therefore it seems that Figure 3 shows the added value chain completely and appropriately, but it has to be taken into account that different market segments with different characteristics exist. It also seems advisable to re-examine the value chain at certain intervals, as new developments like an increasing own electricity consumption and the possibly entailed introduction of battery systems can change the value chain.
Two experts mentioned the export of goods and services from Freiburg. Wholesale and production can be mentioned here as two examples that generate only a small share of their revenues in Freiburg. These export effects are covered in this paper.
Some experts and enterprise representatives also mentioned that the assumed system prices (€/kWp) by Hirschl et al. [2] were considerably too low in comparison to the situation in Freiburg in 2009. These values were corrected, as they have a significant influence on the generated municipal added value (cf. Section 4.2.1).

5.2. Direct Added Value Through the Solar Power Sector

The municipal added value through direct effects of the solar power sector in Freiburg in 2009 adds up to 30.8 million euros (cf. Table 5).
Table 5. Direct added value through solar power systems in Freiburg 2009.
Value chain stepDirect added value [€*]Share [%]
R&D7,440,00024.1
Manufacturing10,325,00033.5
Wholesale3,990,00012.9
Financing235,0000.8
Project planning4,055,00013.2
Installation/assembly1,940,0006.3
Generation/operation2,400,0007.8
Services425,0001.4
Sum30,810,000100
* All values in euros in this and the following tables are rounded to the nearest 5,000. (Source: own calculations, partly based on interview statements).
R&D generates a direct added value of almost 7.5 million euros, which represents 24 percent of the total sum. With a share of ca. 34 percent, manufacturing is responsible for the largest single share. Wholesale, project planning, installation/assembly and generation/operation contribute between 6 and 14 percent each, while financing and services have relatively small shares with about 1 percent each.
The values, which are presented in Table 5, will be explained in more detail next. R&D in Freiburg is carried out by private enterprises and institutions, which are at least partly publicly funded. Only the latter are considered on this step of the value chain, as all privately initiated R&D is included in the price of the product and thereby considered in the respective step of the value chain. In Freiburg, the Fraunhofer Institute for Solar Energy Systems (Fraunhofer ISE: The world’s second largest solar research institute with about 900 employees in 2009) and the university need to be considered. The added value on this step is generated by 439 employees who have a 50 percent job on average. The rather high investments were strongly influenced by an economic stimulus package in 2009. The results for R&D in Table 6 are presented in an aggregated form for both institutions.
Table 6. Detailed information about direct added value through solar power systems in Freiburg.
Value chain stepAfter-tax earnings [€]Net income effects [€]Municipal share business tax [€]Municipal share income tax [€]Municipal share investments [€]
R&D/4,990,000/195,0002,260,000
Manufacturing2,460,0007,040,000430,000395,000/
Wholesale1,270,0002,350,000235,000135,000/
Financing115,00090,00020,00010,000/
Project planning555,0003,210,000130,000160,000/
Installation/ assembly260,0001,550,00070,00060,000/
Generation/ operation1,980,000190,000130,000100,000/
Services60,000330,00020,00015,000/
Sum6,700,00019,750,0001,035,0001,070,0002,260,000
(Source: own calculations, partly based on interviews).
Two module manufacturers are located in Freiburg. For Manufacturer 1 (M1), the added value could be calculated using the method by Hirschl et al. [2]. Manufacturer 2 (M2) is a spin-off from Fraunhofer ISE and is at the stage of introducing its products into the market which is why the added value generated by this enterprise could not be calculated in the unit €/kWp but with the employment method.
There are two wholesalers located in Freiburg. Wholesaler 1 (W1) also operates as a project planner, the added value associated with that is considered at the relevant step of the value chain. As it was not possible to conduct an interview with Wholesaler 2 (W2), data was taken from their website and the employment method was applied.
Three banks and one project financer were questioned for the quantification of the added value effects through financing. Another enterprise on this step of the chain was not willing to disclose any information. The bank representatives mentioned that no internal statistics about financing PV-systems existed. Therefore, the calculation was done according to Hirschl et al. [2] with the assumption that small rooftop systems are financed by 50 percent, and large rooftop and open space systems with 75 percent borrowed capital. These assumptions were confirmed in the interviews. Financer 1 (F1) only finances systems within the city boundaries, Financer 2 (F2) and Financer 3 (F3) also outside. As no exact data on the financed capacity is available and there are effects of systems that are financed in Freiburg but installed outside, it is assumed that all existing PV-systems are financed according to the aforementioned conditions.
Several enterprises are active on the project-planning step. There are some large companies specialized in solar systems which also offer their services outside the city boundaries, and there are also conventional enterprises that offer PV apart from their usual services and take on the planning together with the installation; usually small scale systems (cf. Section 5.1). The publicly available numbers for new PV systems in 2009 (cf. Table 3) were applied for the small companies, as it was assumed that services offered from Freiburg but carried out outside the city equaled those that were built inside the city by enterprises from outside. Only the large companies are considered separately and their planned capacity is deducted and calculated individually. This means that from a total capacity of 3,180 kWp, 702 kWp were planned by the large specialists and the rest, 2,478 kWp, by the small enterprises. This separate consideration allows reliable data to be obtained without interviewing every single small business in this field.
Insurance is important for the owner of a PV-system in order to protect themselves against possible damages. This step of the value chain is very difficult to quantify, as insurance can be taken out with any insurer in Germany and they are most likely not located in the study area. Even if all local systems were insured by companies in Freiburg, the generation of added value would be below 10,000 euros. The added value of this step is not included in the calculations as its influence is small and the uncertainty high.
For the step of installation/assembly, the same assumptions made regarding the relevant companies in the project planning step are valid. The only difference is that not all specialized companies install all their planned systems themselves. Installer 1 (I1) planned 34.7 megawatts but only 3.4 were installed by their employees.
The aspects operator or operating company as well as maintenance of existing systems is considered on the step generation and operation. Systems in the city boundaries as well as systems that are operated from Freiburg but are located outside are considered. The latter are difficult to cover completely, as it is not possible to collect data about investments of individual citizens into PV-systems outside of Freiburg. Therefore, only one large enterprise that operates PV-systems with a capacity of almost 11 megawatts outside Freiburg is included in the calculations. The maintenance is carried out by the companies that also install the systems.
The step disassembly and recycling is acknowledged in this paper but is not included in the calculations as a recycling possibility, which can be used free of charge, only started to exist in 2010. In the future, this aspect might become more important when old systems need to be disposed of more frequently.
The service sector in Freiburg consists of enterprises in the fields of legal consultation, public relations and advertising, consulting as well as lobbying which are not covered by the other steps. The added value is calculated with the employment method, as no outputs in kWp are generated.

5.3. Induced Added Value Through the Solar Power Sector

The induced municipal added value is calculated with the Keynesian Multiplier, which is set at 1.2 for this paper (cf. Section 4.2.2). An additional added value of 6.2 million euros through reinvestments was induced in 2009 (cf. Table 7).
Table 7. Induced added value through solar power systems in Freiburg 2009.
Value chain stepInduced added value[€]Share [%]
R&D1,490,00024.1
Manufacturing2,065,00033.5
Wholesale800,00012.9
Financing45,0000.8
Project planning810,00013.2
Installation/assembly390,0006.3
Generation/operation480,0007.8
Services85,0001.4
Sum6,165,000100
(Source: own calculations, partly based on interviews).
The total municipal added value of the solar power industry in Freiburg was 37 million euros in 2009, consisting of 30.8 million euros through direct (cf. Table 5) and 6.2 million euros through induced effects (cf. Table 7).

5.4. Excursus: Municipal Jobs Through the Solar Power Industry and Municipal Shares of Tax Revenues

The amount of jobs provided by the solar power industry in Freiburg can be determined as a by-product of the calculation of the municipal added value. Either employment numbers were requested in the interviews or they could be calculated according to the ratio of average incomes (cf.Table 4) and the cumulated income effects on the whole step of the value chain. The number of jobs generated through induced effects is roughly estimated by the following formula:
Sustainability 04 00819 i001
This should be seen as a conservative assumption, as jobs in the solar power industry probably generate more added value than the average job in Freiburg. Hence, it is likely that in reality the amount of jobs is higher than shown in Table 8. The enterprises and institutions of the solar power industry directly provided 1,223 jobs in Freiburg in 2009. Through induced effects, another 245 jobs were provided. Expressed as full-time equivalents this would amount to 1,035 direct and 207 indirect jobs.
The amount of jobs and the municipal share of the income tax generated by the solar power systems sector contribute 1.5 percent each to the total of Freiburg. The municipal share of the business tax is 0.9 percent (own calculations, [22]).
Table 8. Municipal jobs through the solar power industry in Freiburg 2009.
Value chain stepJobs through direct added valueJobs through induced added value
R&D43988
Manufacturing41082
Wholesale7315
Financing31
Project planning11824
Installation/assembly418
Generation/operation92
Services13026
Sum1,223245
(Source: own calculations, partly based on interviews).

6. Discussion

6.1. Discussion of Methods for Data Calculation and Collection

Two complementary methods have been applied for data calculation. The method developed by Hirschl et al. [2] is suitable to cover most steps of the value chain if the interviewees are willing to provide information about their company’s output in kWp units. This is a great advantage, as many enterprises prefer to disclose this value rather than information about their rate of return or tax payments. For the steps of project planning, installation/assembly and generation/operation it also helps to overcome the problem of having to interview a large number of enterprises. The results should be seen as average values, as special characteristics of the particular companies are not considered, e.g., it is not measured if the municipal manufacturer is generating profits or losses in the examined year. It also needs to be noted that the cost degression of solar power systems influences the values shown in Table 1, so they need to be updated for further studies in this field.
For the municipal added value effects of enterprises and institutions that could not be covered by the unit kWp, the employment method was used. In practice, this is also data that companies are more willing to share. Additionally, companies that were reluctant to give interviews could be included if they provided information about their employees elsewhere, e.g., on their website. The aspects after-tax earnings and municipal share of the business tax were calculated with the help of assumptions from the other method. For future studies this data could be asked for directly in the interviews to increase reliability.
Statistics and other openly accessible information sources as well as interviews were used for data collection. The review was used to complement data that was obtained from the interviews. Conducting the interviews was somewhat challenging as it was difficult to find value chain experts that were available and willing to be interviewed. The interviews with Freiburg experts provided some surprises: Neither the Chamber of Industry and Commerce nor the Freiburg Energy Agency could offer information about enterprises or institutions involved in the solar power systems value chain in Freiburg. Instead, local RE network organizations and actors that know the local “RE-scene” could provide the needed information. It was noticeable that the amount of enterprises and therefore also the number of employees was overestimated by the interviewed actors; some mentioned companies were not active in Freiburg or had their focus on other RE-technologies.
It can be concluded that the two step approach with experts first and company interviews second, was appropriate and ensured that almost all organizations that generate municipal added value on the local solar power systems value chain were covered. Whether interviews with value chain experts are necessary for similar studies in the field of RE in the future, strongly depends on the available literature and needs to be decided on a case-by-case basis.

6.2. Discussion of Results

6.2.1. Development of Methods

The evaluation of existing approaches for calculating the municipal added value was done by means of a literature review and expert interviews. The focus was to complete the value chain and to test and refine the calculation method. The value chain was complemented by R&D and some not yet considered services. The extension of the value chain and the implementation of another method had a great influence on the results. As shown in Section 5, R&D and the additional services are responsible for about a quarter of the municipal added value in Freiburg. R&D in particular plays a major role and additionally has strong indirect effects, as there are two Fraunhofer ISE spin-offs which also contributed to other steps of the chain. It has to be noted that these results are Freiburg-specific, as not every comparable city has such strong R&D capacities.

6.2.2. Municipal Added Value Through Solar Power Systems

The amount of direct and induced municipal added value through solar power systems in Freiburg in 2009 lies at 30.8 and 6.2 million euros, respectively. The distribution of this added value is not the focus of this paper but will be discussed briefly as well as the influence of the selection of system boundaries on the results and possible reverse economic effects.

6.3. Distribution of Municipal Added Value

The definition of the term “municipal added value” does not give any information about the distribution within the local population and organizations. The largest share, 64 percent, stays with the employees of the relevant organizations (cf. Table 6). The whereabouts of the after-tax earnings, 22 percent of the total amount, is difficult to determine, e.g., it could be distributed to the owners or shareholders of the companies. The income of the municipality is comparably small; income tax and business tax are at about 3.5 percent each of the total added value, which corresponds to about two million euros through direct effects. The investment spending is allotted to local enterprises that provide goods or services to the solar power sector. The induced effects are not included into these numbers as they contribute to all economic sectors that are present in Freiburg.

6.4. System Boundaries

The system boundaries have a significant influence on the amount of added value. It has to be noted that some aspects could not be covered in detail in this paper, e.g., it cannot be ensured that the after-tax earnings remain in Freiburg; they might be transferred to shareholders outside the city and therefore cannot contribute to the local added value. Feasible assumptions were made concerning the residency of employees. On the other hand, some employees of solar power companies from outside the city probably live in Freiburg. Their contribution towards the added value cannot be included.
The implementation of PV-installations into the energy system has potentially positive environmental effects as for instance greenhouse gas emission reduction in comparison to traditional energy sources. This fact should be acknowledged but was not included into the calculations as no direct monetary effects are measurable within Freiburg.

6.5. Reverse Effects: Renewable Energy Act-Reallocation Charge and Opportunity Costs

The generated municipal added value through the solar power industry in Freiburg is undeniably positive if reverse effects are not considered. Two of these potential aspects will be briefly mentioned. The implementation of RE-systems in Germany is supported by the EEG and all non-privileged electricity consumers are burdened with higher costs through the EEG-reallocation charge. This is not relevant for the customers of the local energy utility in Freiburg, as they only offer “green power” to their private customers and therefore the reallocation charge does not apply. If this was not the case it could be argued that the reallocation charge should be set against the added value. In this case, final and valid statements are difficult as the scientific discourse about the influence of RE on the power prices also includes discussions about effects that have decreasing influences (cf. e.g., [23]).
The capital that is used in the solar power sector could theoretically be used elsewhere to generate added value. The lost proceeds of this alternative are called opportunity costs. An exemplary calculation of an alternative utilization will not be carried out in this paper but it is hereby pointed out that there are other opportunities that could possibly generate the same amount of municipal added value.

7. Conclusions

It has been shown that the combination of two evaluated and extended methods for the calculation of municipal added value led to plausible results concerning the municipal added value through solar power systems in the city of Freiburg in 2009. Using two methods proved worthwhile, as they operated with different input data and the interviewees were able to provide at least one of them. At the same time, the results should be seen as minimum values as some aspects like knowledge and supply effects of R&D could not be included. The results are influenced by the Freiburg-specific institutional and corporate landscape and should not be directly transferred to other cities of a similar size. The transfer of the research design and methods for other RE-technologies or in other study areas though, seems to be a viable option. For this, the characteristics of the examined technology and study area should be taken into account.
Further research regarding upstream chain effects, residency of employees, inclusion of more company-specific profit data and the inclusion of knowledge and supply effects for R&D could further improve the reliability of the data. Additionally, the Keynesian Multiplier could be determined more exactly by using local economic indicators. The calculation of municipal added value effects, as shown in the example for the city of Freiburg, has a high potential to influence the reception and acceptance of RE and can therefore play a significant role in the further expansion of these technologies on the municipal level.

Acknowledgments

The author would like to acknowledge the advice of Chantal Ruppert-Winkel and Karl-Anders Weiß for conducting the research for this paper.
One part of the calculation methods used in this paper was taken and modified from a study that was funded by the German Agency for Renewable Energies (AEE). The author of this paper participated in the preparation of that study.

Conflict of Interest

The author declares no conflict of interest.

References

  1. Bundesministerium für Umwelt (BMU). Erneuerbare Energien in Zahlen-Internet-Update ausgewählter Daten. 2010. Available online: http://www.erneuerbare-energien.de/files/pdfs/allgemein/application/pdf/ee_in_deutschland_update_bf.pdf (accessed on 15 January 2011).
  2. Hirschl, B.; Aretz, A.; Prahl, A.; Böther, T.; Heinbach, K.; Pick, D.; Funcke, S. Kommunale Wertschöpfung durch Erneuerbare Energien; Schriftenreihe des IÖW 196/10: Berlin, Germany, 2010. [Google Scholar]
  3. del Río, P.; Burguillo, M. Assessing the impact of renewable energy deployment on local sustainability: Towards a theoretical framework. Renew. Sustain. Energy Rev. 2008, 12, 1325–1344. [Google Scholar]
  4. Bundesministerium für Umwelt (BMU). Erneuerbare Energien: Arbeitsplatzeffekte. Wirkungen des Ausbaus auf den deutschen Arbeitsmarkt. Kurzfassung. 2006. Available online: http://www.erneuerbare-energien.de/files/erneuerbare_energien/downloads/application/pdf/arbeitsmarkt_ee_2006.pdf (accessed on 23 December 2009).
  5. Lehr, U.; Nitsch, J.; Kratzat, M.; Lutz, C.; Edler, D. Renewable energy and employment in Germany. Energy Policy 2008, 36, 108–117. [Google Scholar]
  6. Hoppenbrock, C.; Albrecht, A.-K. Diskussionspapier zur Erfassung regionaler Wertschöpfung in 100%-EE-Regionen. Grundlagen und Anwendung am Beispiel der Fotovoltaik. In Arbeitsmaterialien 100EE Nr. 2; deENet: Kassel, Germany, 2010. [Google Scholar]
  7. Nova-Institut. Regionale Wertschöpfungspartnerschaften. Available online: http://www.regionale-wertschoepfung.info/index.php?tpl=page&id=42&lng=de (accessed on 5 February 2011).
  8. Kurscheidt, M. Erfassung und Bewertung der wirtschaftlichen Effekte der Fußball-WM 2006; Wegweiser GmbH Berlin: Bochum, Germany, 2004. [Google Scholar]
  9. Buttermann, H.-G.; Freund, F. Sektorale und Regionale Beschäftigungseffekte durch den Neubau von fünf Kraftwerken auf Basis Stein-und Braunkohle am Standort Nordrhein-Westfalen; EEFA: Münster, Berlin, Germany, 2009. [Google Scholar]
  10. Kiese, M. Stand und Perspektiven der Regionalen Clusterforschung. In Cluster und Regionalentwicklung: Theorie, Beratung und praktische Umsetzung; Dorothea Rohn: Dortmund, Germany, 2008; pp. 9–50. [Google Scholar]
  11. Spehl, H.; Sauerborn, K.; Sauer, M.; Benson, L.; Feser, H.-D.; von Malottki, C.; Schulze, P.M.; Flohr, M. Regionalwirtschaftliche Wirkungen der Hochschulen und Forschungseinrichtungen in Rheinland-Pfalz. Wertschöpfungs-, Einkommens- und Beschäftigungseffekte durch Bau und Betrieb der Einrichtungen; Universitat Trier: Trier, Germany, 2005. [Google Scholar]
  12. EnBW Transportnetze AG. EEG-Anlagendaten. 2011. Available online: http://www.enbw.com/content/de/netznutzer/strom/erneuerbare_energien/anlagendaten_tng/anlagendaten_suche/index.jsp (accessed on 15 January 2011).
  13. Reichmuth, M.; Schröder, G.; Pohl, R.; Scheuermann, A.; Schiffler, A.; Weber, A. Jahresprognose 2011 zur deutschlandweiten Stromerzeugung aus regenerativen Kraftwerken. Prognose der Stromeinspeisung und der Vergütung im Rahmen des Erneuerbare-Energien-Gesetzes für 2011; Leipziger Institut Fur Energie GmbH: Leipzig, Germany, 2010. [Google Scholar]
  14. Badenova AG & Co. KG. PV-Anlagen im badenova-Stromnetz (individual communication with Bärbel Schäfer, 13/01/2011). 2011.
  15. Blume, L.; Fromm, O. Regionalökonomische Bedeutung von Hochschulen: Eine empirische Untersuchung am Beispiel der Universität Gesamthochschule Kassel; Kassel University Press: Kassel, Germany, 2000. [Google Scholar]
  16. Statistisches Bundesamt, Verdienste und Arbeitskosten. Verdienststrukturerhebung 2006-Verdienste nach Berufen; Statistisches Bundesamt: Wiesbaden, Germany, 2009.
  17. Statistisches Bundesamt Deutschland, Statistisches Jahrbuch 2010; Statistisches Bundesamt Deutschland: Wiesbaden, Germany, 2010.
  18. Bundesministerium für Finanzen (BMF). Datensammlung zur Steuerpolitik Ausgabe 2010. Available online: http://www.bundesfinanzministerium.de/nn_53848/DE/BMF__Startseite/Service/Broschueren__Bestellservice/Steuern/20250__Datensammlung__zur__Steuerpolitik__2010,property=publicationFile.pdf (accessed on 7 February 2011).
  19. Haisch, T. Regionalwirtschaftliche Ausstrahlung von öffentlichen Forschungseinrichtungen in der Region Basel und der Nordschweiz. Eine Analyse der Einkommens-, Beschäftigungs- und Steuereffekte sowie des Wissentransfers der Universität Basel und der Fachhochschule Nordwestschweiz; Geographisches Institut der Universität Basel: Basel, Germany, 2008. [Google Scholar]
  20. DIW econ. Wirtschaftsfaktor TU Berlin. Welchen Einfluss hat die TU Berlin auf die Berliner Wirtschaft? 2008. Available online: http://www.diw-econ.de/de/downloads/20081113_Report_TU_Berlin.pdf (accessed on 25 November 2010).
  21. Leusing, B. Hochschulen als Standortfaktor. Eine empirische Analyse der regionalökonomischen Effekte der Universität Flensburg. In Discussion Paper Nr. 15; University of Flensburg: Flensburg, Germany, 2007. [Google Scholar]
  22. Stadt Freiburg, Statistisches Jahrbuch 2010; Stadt Freiburg: Freiburg, Germany, 2010.
  23. Bode, S.; Groscurth, H. Zur Wirkung des EEG auf den “Strompreis”. Hamburgisches Welt-Wirtschafts-Archiv (HWWA): Hamburg, Germany, 2006. [Google Scholar]

