1. Introduction
The process of colonizing the Brazilian Amazon started in the 1960s and was intensified in the following decades through the creation of public policies to stimulate occupation of the region with programs such as PIN (National Integration Program) and PROTERRA (Program for Land Redistribution and Stimulation of Agribusiness in the North and Northeast). PIN was created to protect the vast interior of Brazil by relocating citizens and to guarantee national sovereignty in the Amazon region, while PROTERRA supported these actions by creating better working conditions in the field and to foment agribusiness by providing the necessary infrastructure (roads, energy and its distribution, expansion of telecommunication networks
etc.) to integrate the region into the domestic economy [
1,
2]. At the same time, the government offered tax incentives and credits for developing agriculture and livestock farming [
3,
4,
5], and the lumber industry with consequent deforestation on a large scale [
6]. With the start of an economic recession at the end of the 1980s and the beginning of the 1990s, the government reduced tax incentives which resulted in a decrease of the Amazon’s deforestation annual rates from ~20,400 km
2 in the 1980s to ~13,700 km
2 between 1990 and 1994. With the introduction of a new economic plan (
Plano Real) in 1994 and the stabilization of the Brazilian economy, offers of credits with low interest rates increased and this, together with new government investments in infrastructure, led to an increase in deforestation, which reached 27,772 km
2 in 2004 [
3,
5,
7,
8,
9,
10].
Several articles have dealt with the Amazon deforestation issue, showing its direct causal relationship with the expansion of agriculture and livestock farming, especially cattle farming [
5,
11,
12,
13] and soy production [
14,
15,
16,
17,
18,
19]. In this context, Greenpeace led a campaign for the conservation and reduction of deforestation in the Amazon biome, entitled “Eating up the Amazon” [
20]. The scope of this campaign included publication of a report revealing that approximately one-quarter of the soy harvested in the Amazon was used to feed chickens that were later traded by the big fast-food chains.
Due to the repercussion of this evidence in the international scenario, several fronts, especially from the importer markets, pressured the productive soy chain sector to include in their agenda a commitment to preserve the forests. Consequently, in July 2006, Brazilian Vegetable Oil Industries Association (ABIOVE) and the National Grain Exporters Association (ANEC) announced the signing of the Soy Moratorium, an agreement that committed the member companies of ABIOVE and ANEC not to purchase soy produced in areas of the Amazon biome that were deforested after July 2006 [
21,
22].
According to Lovatelli [
22], soon after the declaration of the Soy Moratorium, in October 2006, the Soy Task Force (GTS) was formed, consisting of representatives from the soy productive chain sector (ABIOVE, ADM, ANEC, Algar Agro, Amaggi, Baldo, Bunge, Cargill, IMCOPA, Louis Dreyfus and Óleos Menu) and from the civil society (Greenpeace, International Conservation, IPAM, The Nature Conservancy and WWF-Brasil). The GTS mission was to plan and coordinate the Soy Moratorium’s activities. In addition to the Coordination Group, the Soy Moratorium also had the following three subgroups:
i)EDUCATION, INFORMATION and FOREST CODE: This subgroup disseminates the adoption of good soy production practices in the Amazon biome to ensure that the actions generated by the Soy Moratorium reach the rural producers and the other economic, social and political agents involved, mainly those with local relevance, and contributes to agribusiness, keeping the proper balance between economic and social-environmental needs, thus ensuring compliance with legislation;
ii)INSTITUTIONAL RELATIONS: This subgroup brings the GTS closer to the members of government entities, with a view to improving sustainable development policies for the Amazon biome and to stimulating legislative advancements to improve the region’s command and control mechanisms;
iii)MAPPING and MONITORING: This subgroup supports the development of a system to map and monitor the Amazon biome, defining the methods and the criteria necessary to assure compliance with the commitment not to trade soy originating from deforested areas.
Over the last few years, Brazilian institutions such as the Ministry of the Environment, Bank of Brazil and National Institute for Space Research (INPE) began to collaborate with the Soy Moratorium. Starting in 2009, INPE assumed the responsibility for developing and applying a methodology for monitoring soy plantations in deforested areas of the Amazon biome through the use of satellite images.
It also is important to mention that since the early 2000s the Brazilian government has implemented a comprehensive set of measures to fight illegal deforestation, highlighting the PPCDAM (Action Plan for the Prevention and Control of Deforestation in the Legal Amazon) implemented in 2003 [
23]. Other important public policies include the Ecologic-Economic Zoning (ZEE) established by the states, a listing of degrading working conditions kept by the Ministry of Labor, a listing of embargoed areas kept by the Ministry of the Environment, reinforcement of supervision by environmental entities and a big advance in real-time monitoring of deforestation and forest fires using satellite images. With the use and expansion of these new tools, the improvement in public governance over the last five years has been very significant.
In this panorama, the objective of this work is to present the evaluation of the fourth year of monitoring new soy plantations within the Soy Moratorium context.
3. Results and Discussion
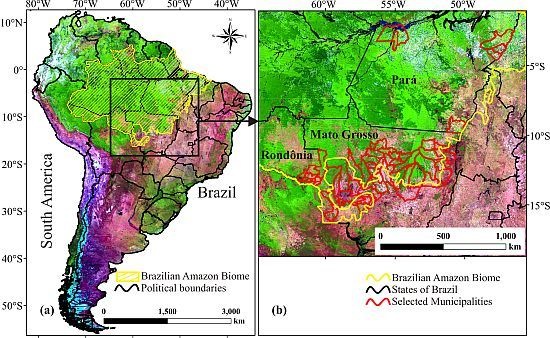
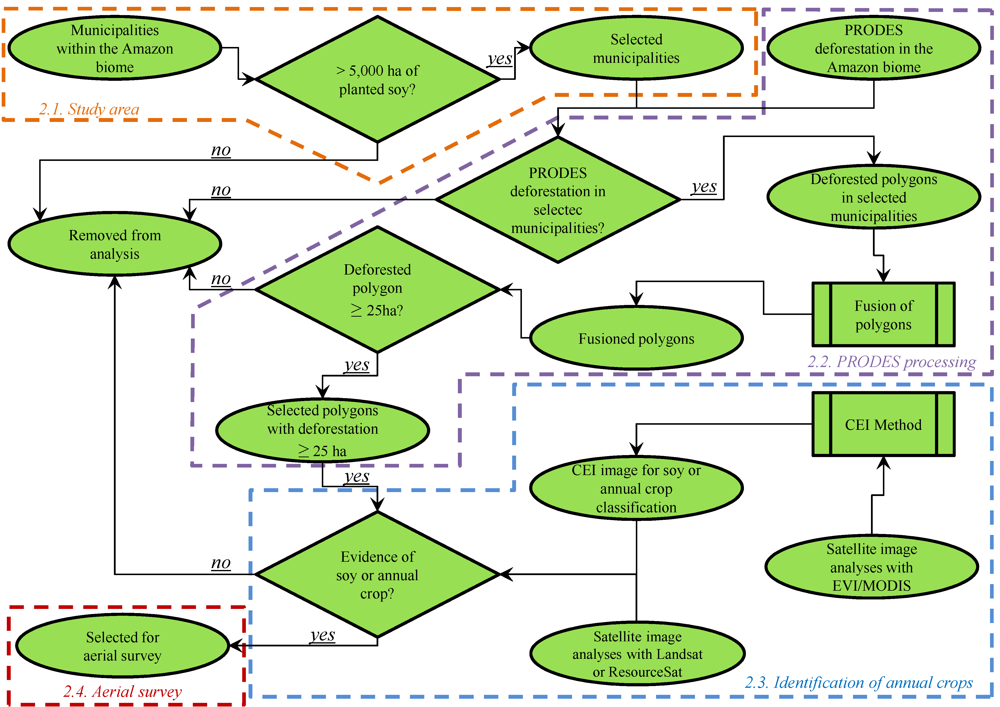
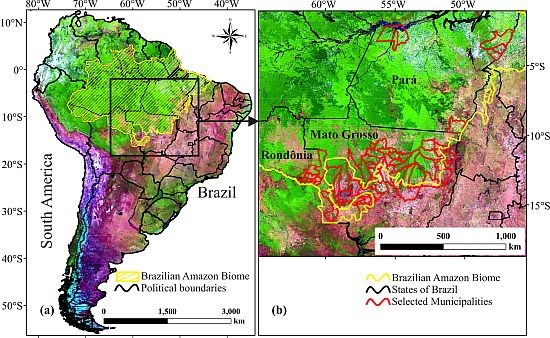
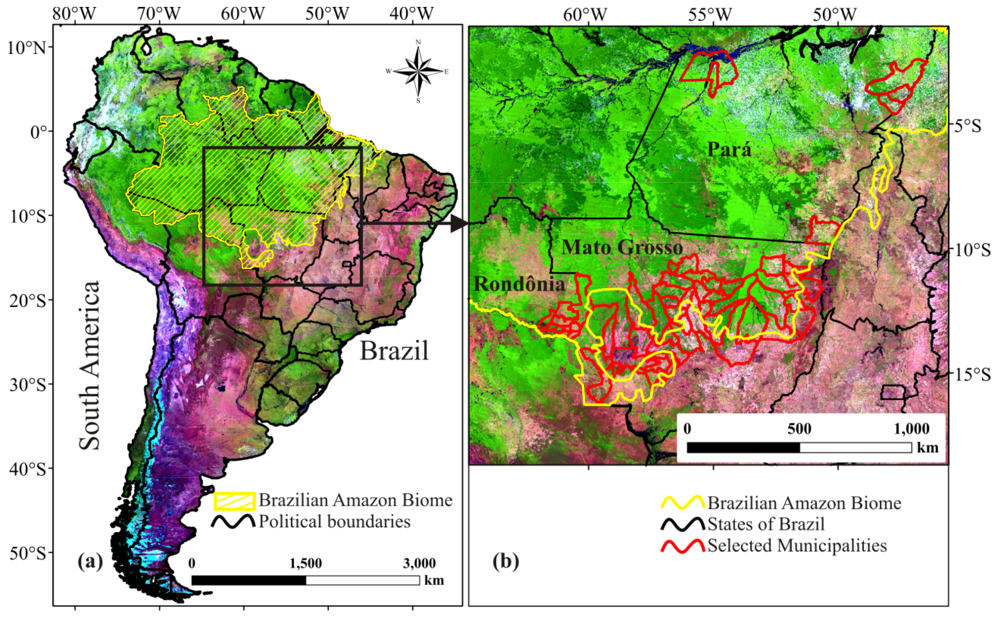
The number of deforested polygons and its area (ha) mapped by PRODES since the beginning of the Soy Moratorium, for the 53 selected municipalities with more than 5,000 ha each, before and after the aggregation of adjacent deforested polygons are shown in
Table 2. These results are presented for the deforested polygons <25 ha and ≥25 ha. After aggregation, the deforested polygons with <25 ha decreased in number and, consequently, in area (54,544 ha; −33%); while the total area of deforested polygons with ≥25 ha increased 16.9% after aggregation (
Table 2), agreeing with [
4,
32].
Table 2 further shows that the total deforested area, before and after aggregation, is practically the same, corresponding to about 486,000 ha. Of this total, 375,500 ha were effectively monitored comprising 3,571 deforested polygons of ≥25 ha. In other words, 77.3% of the deforested area was monitored, and the remaining 22.7% that was not monitored corresponds to the isolated deforested polygons of <25 ha.
Table 2.
Number of deforested polygons and corresponding area (ha) before and after aggregation by class of deforestation size (<25 ha and ≥25 ha) for the 53 municipalities with more than 5,000 ha each.
Table 2.
Number of deforested polygons and corresponding area (ha) before and after aggregation by class of deforestation size (<25 ha and ≥25 ha) for the 53 municipalities with more than 5,000 ha each.
| Class of Deforestation Size | Before Aggregation (a) | After Aggregation (b) | Variation {(b-a)/a} |
|---|
| N° | Area (ha) | N° | Area (ha) | N° | Area (ha) |
|---|
| <25 ha | 12,579 | 165,156 | 8,470 | 110,612 | −32.7% | −33.0% |
| ≥25 ha | 3,618 | 321,079 | 3,571 | 375,500 | −1.3% | 16.9% |
| Total | 16,197 | 486,235 | 12,041 | 486,112 | −25.7% | 0.0% |
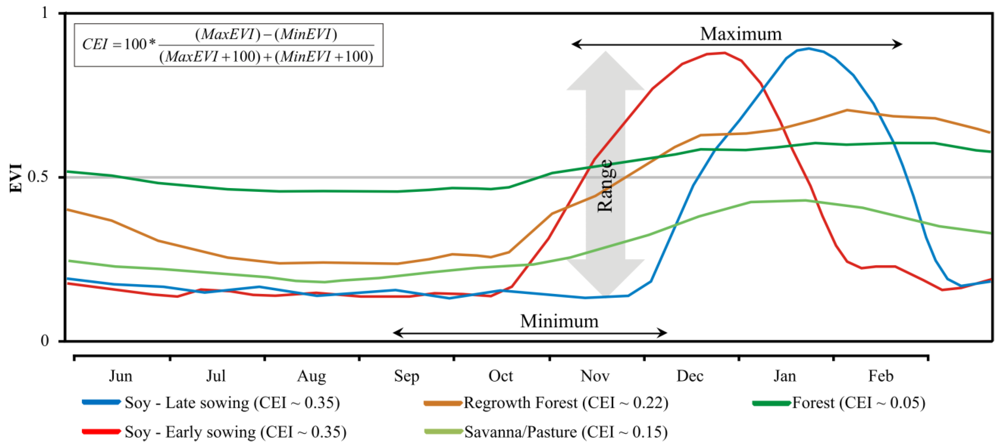
The 3,571 deforested polygons with ≥25 ha were analyzed one by one, based on MODIS images and available Landsat and/or Resourcesat-1 images. Of this total, 3,236 polygons, corresponding to 90.6% of the number of deforested polygons, did not show any signs of soy or annual crop. In the remaining 335 deforested polygons the satellite images indicated the possible presence of soy or any other annual crop (
Table 3). Forty-two of these deforested polygons were located in settlements and were therefore not monitored according to what was agreed by the GTS to not penalize agrarian reform settlers, based on the principle that economic development and social inclusion should walk hand-in-hand with environmental conservation. Eventually, 293 deforested polygons (8.2%) were selected for aerial survey. It should be pointed out that no deforested area with annual crops was found inside Indigenous Lands or Conservation Units.
Table 3.
Number of deforested polygons with and without annual crops by state.
Table 3.
Number of deforested polygons with and without annual crops by state.
| Deforested polygons | States | |
|---|
| MT | PA | RO | Total (%) |
|---|
| Without annual crops | 1,929 | 1,133 | 174 | 3,236 (90.6%) |
| With annual crops | 214 | 78 | 1 | 293 (8.2%) |
| With annual crops—within settlements * | 42 | 0 | 0 | 42 (1.2%) |
| Total | 2,185 | 1,211 | 175 | 3,571 (100%) |
From the aerial survey of the 293 deforested polygons, soy plantations were found in 146 polygons, with a total area of 11,698 ha (
Table 4). This indicates that the conversion of forest to soy in the Amazon biome during the Soy Moratorium corresponds to: 0.3% of total deforestation; 0.39% of the deforestation in the states of MT, RO and PA; 2.4% of the deforestation observed in the 53 municipalities that produce more than 5,000 ha of soy each; or 3.1% of the deforestation observed in polygons ≥25 ha in these same municipalities.
Table 4.
Number of deforested polygons and corresponding soy area (ha) by classes of deforestation size.
Table 4.
Number of deforested polygons and corresponding soy area (ha) by classes of deforestation size.
| Class of Deforestation size | MT | PA | RO | Total |
|---|
| (ha) | N° | (ha) | N° | (ha) | N° | (ha) | N° | (ha) |
| 25–50 | 40 | 1,149 | 17 | 418 | 1 | 29 | 58 | 1,567 |
| 50–100 | 23 | 1,340 | 10 | 445 | - | - | 33 | 1,785 |
| >100 | 42 | 5,896 | 13 | 2,421 | - | - | 55 | 8,346 |
| Total | 105 | 8,385 | 40 | 3,284 | 1 | 29 | 146 | 11,698 |
In MT state, 105 deforested polygons were identified as not meeting the Soy Moratorium’s requirements, representing 8,385 ha of soy (
Table 4). This corresponds to 1.2% of the total deforested area in MT state (688,460 ha;
Table 1) during the Soy Moratorium. In PA state, 40 deforested polygons were identified as having soy, representing 3,284 ha (
Table 4). This corresponds to 0.17% of the deforested area in PA state (1,918,400 ha;
Table 1) during the Soy Moratorium. Only one deforested area with soy was identified in RO state, representing 29 ha (
Table 4) of a total deforested area of 366,400 ha in RO (
Table 1). It should be emphasized that, of the 293 selected polygons for aerial survey (
Table 2), 113 were from deforested polygons with more than 100 ha, of which 55 were identified as having soy. The soy area of these polygons was 8,346 ha (
Table 4), which corresponds to 71% of the total soy planted in deforested polygons, thus indicating that the great majority of soy plantations occurred in deforested polygons with more than 100 ha. Further details on the selected polygons can be found at [
49].
Table 5 shows that from crop year 2009/10 to 2010/11, the monitored area increased by 24% (from 302,149 ha to 375,500 ha), but the soy area increased by 86% (from 6,295 ha to 11,698 ha). An important factor to be considered in this 4th year of the Soy Moratorium is the longer time that had elapsed since its beginning, due to the fact that rice crops often precede soy crops during the first two years after deforestation [
16,
50]. Under this consideration the intention of planting soy in deforestations of the first two years (2007 and 2008) should appear in the 4th year. Therefore, the increase of 5,403 ha of soy (86%;
Table 5), compared to the sum of the deforestations observed in 2007 and 2008 (1,942,265 ha;
Table 1), is minor.
Table 5.
Comparison between crop years 2009/10 and 2010/11 of deforested polygons and those with new soy in the 53 analyzed municipalities.
Table 5.
Comparison between crop years 2009/10 and 2010/11 of deforested polygons and those with new soy in the 53 analyzed municipalities.
| 2009/10 (a) | 2010/11 (b) | Variation {(b − a)/a} (%) |
|---|
| Total area of deforested polygons (ha) | 302,149 | 375,500 | 24 |
| Total no. of deforested polygons | 2,955 | 3,571 | 21 |
| No. of deforested polygons with soy | 76 | 146 | 92 |
| New soy area in deforested polygons (ha) | 6,295 | 11,698 | 86 |
The results of crop year 2010/11 show that soy was planted in 0.39% of the total deforested area observed in the three soy producing states of the Amazon biome, since the inception of the Soy Moratorium. Considering the soy area planted in the Amazon biome (1.94 million ha), the amount of soy in deforested polygons observed during the Soy Moratorium represents 0.6% (
Table 6). In view of the results, there are strong indications that the Soy Moratorium has, for the last four years, inhibited the advance of deforestation for the purpose of planting soy in the Amazon biome. It should be pointed out that, in MT state, which is responsible for 88% of the Amazon biome’s soy area, the soy planted in deforested polygons during the Soy Moratorium represent just 0.49% of the state’s soy area within the Amazon biome (
Table 6).
Table 6.
Soy area (ha) in deforested polygons and in the Amazon biome; and relative contribution of new soy in deforested polygons.
Table 6.
Soy area (ha) in deforested polygons and in the Amazon biome; and relative contribution of new soy in deforested polygons.
| State | New soy in deforested polygons (b) | Soy in Amazon biome (a)* | (a*100/b) (%) |
|---|
| MT | 8,385 | 1,704,963 | 0.49% |
| PA | 3,284 | 104,800 | 3.13% |
| RO | 29 | 132,300 | 0.02% |
| Total | 11,698 | 1,942,063 | 0.60% |
During the four years of the Soy Moratorium (2007 to 2010) 2,973 thousand ha were deforested in the states of MT, PA and RO (
Table 1), but deforestation rates are declining and in 2010 they reached the lowest level in a historic series of 22 years [
5]. Although the results show that the land conversion from deforestation to soy is minor, the soy planted area is continuously increasing [
52], particularly in MT. Recent works have shown that soy is mainly expanding on savanna and pasture land [
53,
54]. Agriculture intensification through double cropping has also been observed in MT [
42] which, coupled to the major effort of the Brazilian government to fight illegal deforestation, should reduce the pressure of expansion over native forest.
4. Conclusions
The evaluation of the fourth year of monitoring new soy plantations within deforested polygons during the Soy Moratorium revealed to be minor with an area of 11,698 ha in crop year 2010/2011 in the states of Mato Grosso, Rondônia and Pará. These states are responsible for 99% of the soy planted within the Amazon biome and, considering its total deforested area during the Soy Moratorium (2007 to 2010), the 11,698 ha of soy corresponds to 0.39%. Considering the deforestation of polygons ≥25 ha in the 53 municipalities that altogether are responsible for 98% of the biome’s soy planted area, this new soy area corresponds to 3.1%.
It might be premature to conclude that the Soy Moratorium is actually having an inhibitory effect on recent deforestation in the Amazon biome but, from the figures, it is quite evident that the soy crop was not a significant deforestation driver during the Soy Moratorium.
Monitoring soy plantations in recently deforested polygons in the Amazon biome allowed the industries and exporters that participate in the Soy Moratorium to comply with their commitment not to acquire soy from areas that were deforested after July 24, 2006. The present work also demonstrates that remote sensing technology can significantly contribute to the governance process of Brazilian natural resources.

 ,
, 

