<?xml version="1.0" encoding="UTF-8"?>
<!DOCTYPE article PUBLIC "-//NLM//DTD Journal Publishing DTD v2.3 20070202//EN" "journalpublishing.dtd">
<article xmlns:mml="http://www.w3.org/1998/Math/MathML" xmlns:xlink="http://www.w3.org/1999/xlink" xml:lang="en" article-type="research-article">
  <front>
    <journal-meta>
      <journal-id journal-id-type="publisher-id">sustainability</journal-id>
      <journal-title>Sustainability</journal-title>
      <abbrev-journal-title abbrev-type="publisher">Sustainability</abbrev-journal-title>
      <abbrev-journal-title abbrev-type="pubmed">Sustainability</abbrev-journal-title>
      <issn pub-type="epub">2071-1050</issn>
      <publisher>
        <publisher-name>MDPI</publisher-name>
      </publisher>
    </journal-meta>
    <article-meta>
      <article-id pub-id-type="doi">10.3390/su4102586</article-id>
      <article-id pub-id-type="publisher-id">sustainability-04-02586</article-id>
      <article-categories>
        <subj-group>
          <subject>Article</subject>
        </subj-group>
      </article-categories>
      <title-group>
        <article-title>Comparison of Collection Schemes of Municipal Solid Waste Metallic Fraction: The Impacts on Global Warming Potential for the Case of the Helsinki Metropolitan Area, Finland</article-title>
      </title-group>
	  <contrib-group>
        <contrib contrib-type="author">
          <name>
            <surname>Kuusiola</surname>
            <given-names>Timo</given-names>
          </name>
          <xref rid="af1-sustainability-04-02586" ref-type="aff">1</xref>
          <xref rid="c1-sustainability-04-02586" ref-type="corresp">*</xref>
        </contrib>
        <contrib contrib-type="author">
          <name>
            <surname>Wierink</surname>
            <given-names>Maaria</given-names>
          </name>
          <xref rid="af2-sustainability-04-02586" ref-type="aff">2</xref>
        </contrib>
        <contrib contrib-type="author">
          <name>
            <surname>Heiskanen</surname>
            <given-names>Kari</given-names>
          </name>
          <xref rid="af2-sustainability-04-02586" ref-type="aff">2</xref>
        </contrib>
      </contrib-group>
      
      <aff id="af1-sustainability-04-02586"><label>1 </label>Benviroc Oy, Lekkerikuja 1 B 21, 02230 Espoo, Finland</aff>
      <aff id="af2-sustainability-04-02586"><label>2 </label>Aalto University School of Chemical Technology, Department of Materials Science and Engineering, P.O. Box 16200, FI-00076 Aalto, Finland; Email: <email>maaria.wierink@aalto.fi</email> (M.W.); <email>kari.heiskanen@aalto.fi</email> (K.H.)</aff>
      <author-notes>
        <corresp id="c1-sustainability-04-02586"><label>*</label> Author to whom correspondence should be addressed; Email: <email>timo.kuusiola@benviroc.fi</email> (F.L.); Tel.: +358-400-906-931.</corresp>
      </author-notes>
      <pub-date pub-type="epub">
        <day>12</day>
        <month>10</month>
        <year>2012</year>
      </pub-date>
      <pub-date pub-type="collection">
	  <month>10</month>
        <year>2012</year>
      </pub-date>
      <volume>4</volume>
      <issue>10</issue>
      <fpage>2586</fpage>
      <lpage>2610</lpage>
      <history>
        <date date-type="received">
          <day>16</day>
          <month>07</month>
          <year>2012</year>
        </date>
        <date date-type="rev-recd">
          <day>06</day>
          <month>09</month>
          <year>2012</year>
        </date>
        <date date-type="accepted">
          <day>29</day>
          <month>09</month>
          <year>2012</year>
        </date>
      </history>
      <permissions>
        <copyright-statement>©  2012 by the authors; licensee MDPI, Basel, Switzerland.</copyright-statement>
        <copyright-year>2012</copyright-year>
        <license xmlns:xlink="http://www.w3.org/1999/xlink" license-type="open-access" xlink:href="http://creativecommons.org/licenses/by/3.0/">
          <p>This article is an open-access article distributed under the terms and conditions of the Creative Commons Attribution license (<uri>http://creativecommons.org/licenses/by/3.0/</uri>).</p>
        </license>
      </permissions>
      <abstract>
        <p>In this research article the sustainability of different practices to collect the metal fraction of household waste in the Helsinki metropolitan area, Finland is examined. The study is carried out by calculating and comparing the greenhouse gas reduction potential of optional practices for collecting the metal fraction of household waste in the Helsinki metropolitan area, Finland. In order to locate the greenhouse gas reduction potential of the separate collection of the metallic fraction of municipal solid waste (MSW) collected from residential sources, a comparative carbon footprint analysis using Life Cycle Assessment (LCA) on six different waste management scenarios is carried out. The modeled system consisted of a waste collection system, transportation, and different waste management alternatives, including on-site separation, separation at the waste management facility as well as metallurgical recovery of separated scrap. The results show that, in terms of greenhouse gas emissions, separate collection and recycling of the metallic fraction of solid MSW at residential properties is the preferable option compared to a scenario with no source sorting and incineration of everything. According to this research scenario where the metal fraction of solid household waste was not source-separated or collected separately have clearly higher greenhouse gas emissions compared to all the other scenarios with separate collection for metals. In addition, metal recycling by regional collection points has considerably lower greenhouse gas emission potential than metal recycling by collection directly from residential properties.</p>
      </abstract>
      <kwd-group>
        <kwd>Life Cycle Assessment</kwd>
        <kwd>global warming potential</kwd>
        <kwd>greenhouse gas reduction potential</kwd>
        <kwd>municipal solid waste</kwd>
        <kwd>packaging metals recycling</kwd>
        <kwd>regional waste collection</kwd>
      </kwd-group>
    </article-meta>
  </front>
  <body>
    <sec sec-type="intro">
      <title>1. Introduction</title>
      <p>Recycling of metals in solid household waste is an integral part of sustainable waste management in Europe. The EU member states are required to establish collection schemes for different recyclable waste fractions including metal by 2015, and reuse or recycle 50% of the recyclable materials from households by 2020. The EU Packaging Directive 94/62/EC [<xref ref-type="bibr" rid="B1-sustainability-04-02586">1</xref>] requires that the metal fraction of household waste must have a recycling ratio of at least 50% by the end of 2008. In addition, by the end of 2008 packaging waste was to be reduced by 5% relative to the Gross Domestic Product (GDP). </p>
      <p>In 2007, the waste management system of the Helsinki metropolitan area covered the cities of Helsinki, Espoo, Vantaa and Kauniainen, consisting of households with all together around 906,000 inhabitants [<xref ref-type="bibr" rid="B2-sustainability-04-02586">2</xref>]. In this area the collection of metal scrap is arranged according to the unit size of the metal product. Within this area, the large metal scrap fraction and the small sized metal fraction of municipal solid waste (MSW) have separate collection systems. The small size metal fraction can contain tins and beverage cans, aluminum cooking moulds and foils, metal lids and caps, metal cups for tea-light candles, empty and dry paint tins and empty aerosol bottles [<xref ref-type="bibr" rid="B3-sustainability-04-02586">3</xref>]. Large metal scrap often contains items such as bicycles and gutters, metal parts of furniture, metal tubes and cables, wood-heated sauna stoves, metallic machines and devices, clean and open barrels [<xref ref-type="bibr" rid="B3-sustainability-04-02586">3</xref>]. The cities do not have an obligation to organize collection for metal fraction of household waste from residential buildings. Consequently, the regional drop-off collection with fixed collection points, often located at public spaces such as shopping centers, has been the most common way to collect metal fraction of packaging waste. </p>
      <p>In addition to regional drop-off collection systems, the households and properties negotiate metal collection contracts with private waste collection providers independently. The metal fraction is then collected separately from other solid household waste fractions. This leads to a situation that the adjacent properties might have a contract with a different collector, which makes the collection system economically as well as environmentally ineffective.</p>
      <p>Producer responsibility also applies to metal packaging. The producers and importers of metal packages are required to arrange the disposal of the packages at their end of life. This has been defined in the Finnish Waste Act (1072/1993) [<xref ref-type="bibr" rid="B4-sustainability-04-02586">4</xref>], Chapter 3a, as a mandatory obligation. Producers can meet their obligations by joining a producer community. In Finland the relevant producer community is Mepak-Recycling Ltd. The shareholders of this organization are metal packaging manufacturers, the packing industry and retail-wholesale trade organizations in Finland, altogether twelve shareholders [<xref ref-type="bibr" rid="B5-sustainability-04-02586">5</xref>]. Mepak organizes recycling by providing collection points with containers and contracting companies to recover the metal from the packaging waste.</p>
      <p>The target material of this study was the MSW collected from residential properties, in this article referred to in short by term <italic>solid household waste</italic>. The expression <italic>metal fraction</italic> of solid household waste is used to describe the small sized metal waste fraction of this solid household waste. <italic>Mixed household waste</italic> refers to the unsorted fraction of residential MSW, which is delivered to the landfills. The term <italic>source sorting</italic> is used in order to describe the waste sorting performed by the households prior to collection. With <italic>property collection</italic> we refer to the collection of solid household waste from residential properties of different sizes. The solid household waste is collected in containers accepted or provided by the municipality. <italic>Regional collection</italic> describes the drop-off collection method, located at central locations, where the collection system is not as close to properties as in a property collection scheme and each household delivers the source-separated metals to the collection points. <italic>Recycling</italic> means processing of the used metal fraction of solid household waste as raw material for new metal production.</p>
      <p>The total amount of solid household waste in the Helsinki metropolitan area in 2007 was 339,060 t, which is 336 kg/capita [<xref ref-type="bibr" rid="B6-sustainability-04-02586">6</xref>]. Research carried out by the Helsinki Region Environmental Services Authority [
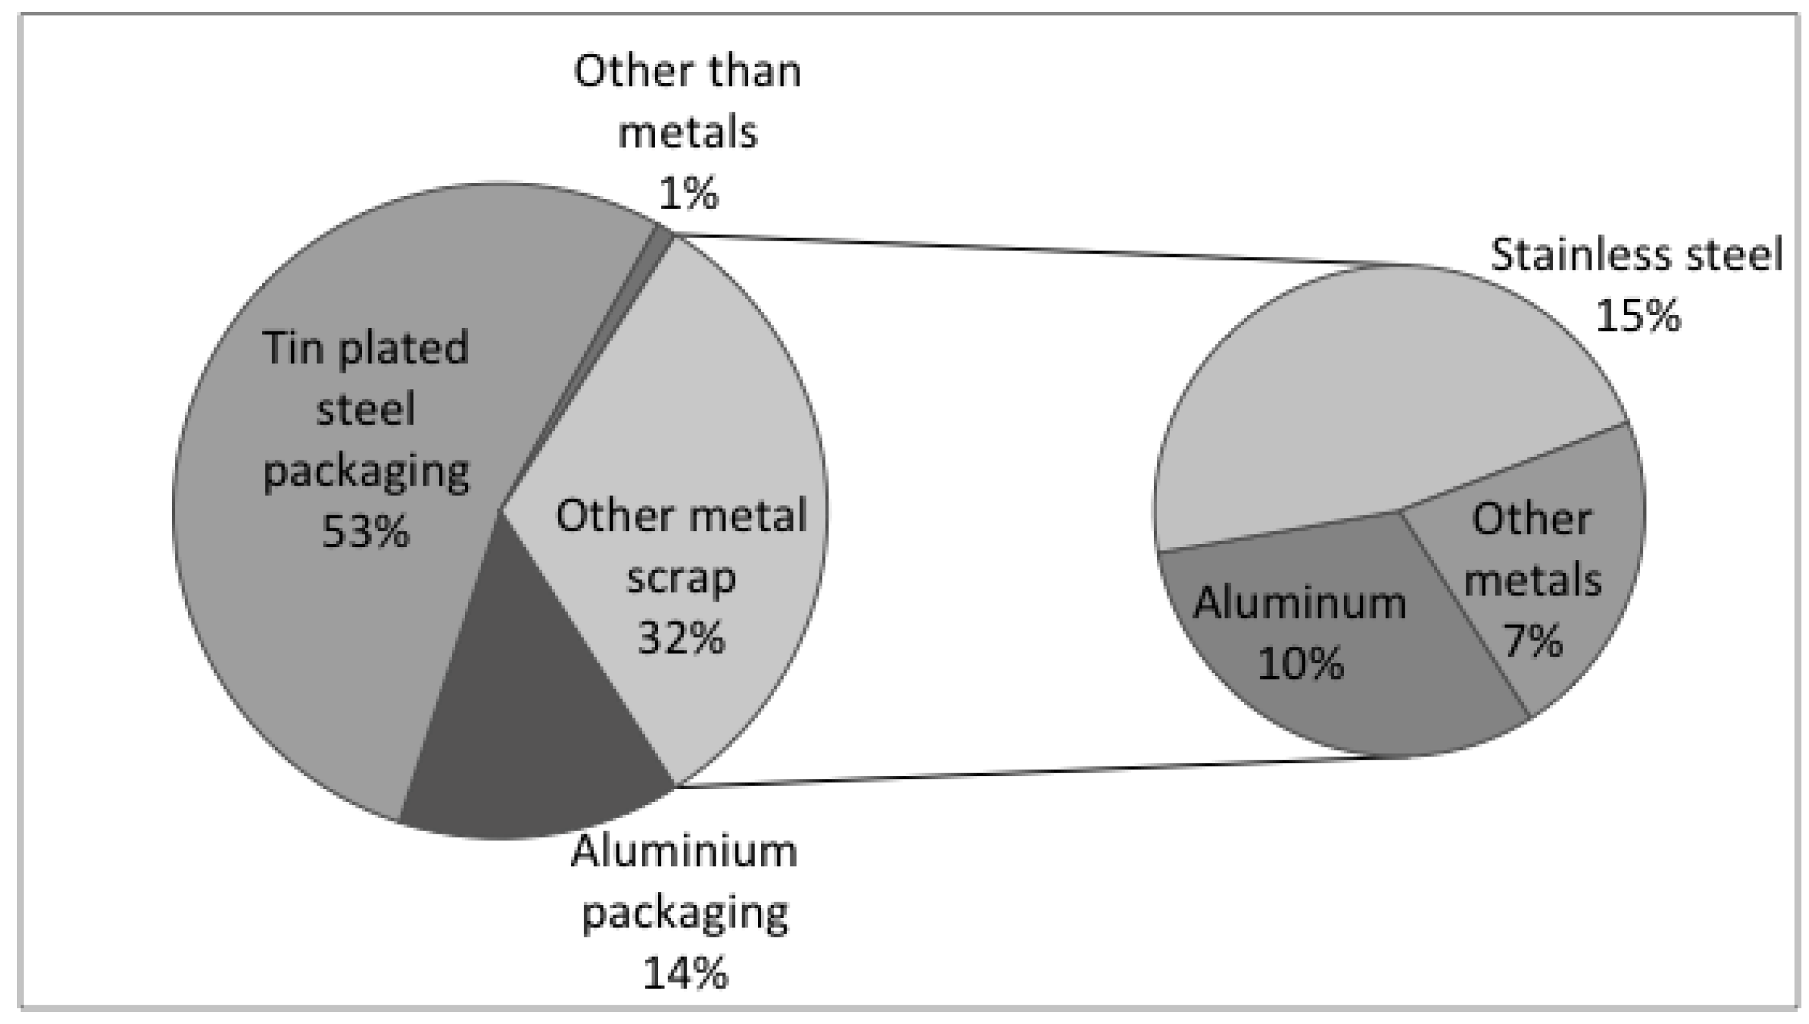
<xref ref-type="bibr" rid="B7-sustainability-04-02586">7</xref>] shows that the amount of metal fraction in unsorted mixed household waste is 5.4 kg/capita/annum, which is about 1.6 wt.-% of the total solid household waste produced. The metal fraction in unsorted mixed household waste contains around 0.78 kg/capita/annum of aluminum packaging and 2.08 kg/capita/annum of other metal packaging and 2.55 kg/capita/annum of other metals. The metals in unsorted mixed household waste mainly consist of metal packaging waste, such as steel and aluminum packing and cans, aluminum foil, paint tins, spray cans, but also electrical wires, keys, tools, screws and bolts, crown caps, closures, steel bands and straps [<xref ref-type="bibr" rid="B7-sustainability-04-02586">7</xref>]. The total amount of mixed household waste delivered to landfills was 158,556 tons in 2007 [<xref ref-type="bibr" rid="B7-sustainability-04-02586">7</xref>]. Estimation for collected metal fraction of solid household waste is 1.1 kg/capita/annum [<xref ref-type="bibr" rid="B8-sustainability-04-02586">8</xref>].</p>
      <p>Metals are often considered to be 100% recyclable. In theory this is true for pure metals, but in practice it is unrealistic for several reasons. Recyclability is strongly affected by the collection efficiency and the quality of the sorted metal fraction and the separation processes chosen and available for treatment of the metal fractions. In the Helsinki region solid household waste forms about half of the total MSW [<xref ref-type="bibr" rid="B6-sustainability-04-02586">6</xref>], and solid household waste forms in fact a significant metal sink. Considerable amounts of metal scrap could be recovered from solid household waste by more effective collection systems. The remaining metals in the mixed household waste have mostly ended up in landfills. In the future, the mixed waste will be incinerated and some of the metals can be recovered either before or after the municipal solid waste incineration (MSWI) process. The recoverability however is limited, since in the MSWI a large part of aluminum is melted and oxidized, and steel scrap quality is reduced [<xref ref-type="bibr" rid="B9-sustainability-04-02586">9</xref>]. </p>
      <p>Currently, there is a debate whether more effective collection schemes of metal fraction of solid household waste would be sustainable in terms of the emitted greenhouse gases (GHG). It is however possible that material recycling produces more GHG emissions than what can be credited by substituted material in primary material production [<xref ref-type="bibr" rid="B10-sustainability-04-02586">10</xref>].</p>
      <p>The Waste &amp; Resources Action Program report (WRAP) [<xref ref-type="bibr" rid="B11-sustainability-04-02586">11</xref>] evaluated nine Life Cycle Assessment (LCA) studies on the metal fraction of solid household waste. In most of these studies, recycling is more environmentally profitable than land filling or collecting metals from municipal waste incineration plants’ bottom ash. This result is also supported by other studies [<xref ref-type="bibr" rid="B12-sustainability-04-02586">12</xref>,<xref ref-type="bibr" rid="B13-sustainability-04-02586">13</xref>,<xref ref-type="bibr" rid="B14-sustainability-04-02586">14</xref>]. In addition, Dahlén, <italic>et al.</italic>’s (2007) [<xref ref-type="bibr" rid="B15-sustainability-04-02586">15</xref>] study demonstrated that the result of extended property collection is that more metal and other recyclables were source-separated and recycled. Yet, according to Tanskanen and Kaila [<xref ref-type="bibr" rid="B16-sustainability-04-02586">16</xref>], property collection of additional fractions of recyclables and reduction of on-site obligation is limited because of increased costs of solid household waste collection. Their study also shows that the greatest increase in costs occurs among properties with the smallest waste accumulations. According to their research, the volume of bins needed per ton of waste and the pick-up times show a non-linear pattern of increase when the amount of waste collected per pick-up is decreased [<xref ref-type="bibr" rid="B16-sustainability-04-02586">16</xref>]. For the same reason, changes in the separation strategy among small properties have the greatest effects on the costs of waste collection [<xref ref-type="bibr" rid="B16-sustainability-04-02586">16</xref>].</p>
      <p>The purpose of this research was to analyze and compare the changes in the GHG emissions reduction potential of six alternative metal fractions of solid household waste collection schemes in the Helsinki metropolitan area. </p>
      <p>The research questions were as follows:</p>
      <list list-type="simple">
        <list-item>
          <p>– How much does a separate metal collection affect the GHG emissions of the MSW management system?</p>
        </list-item>
        <list-item>
          <p>– What would be the best collection system in terms of GHG emissions?</p>
        </list-item>
        <list-item>
          <p>– What are the benefits of different collection scenarios chosen in terms of GHG emissions?</p>
        </list-item>
      </list>
      <p>Life Cycle Inventory Assessment (LCIA) was carried out in order to compare the environmental impacts of the alternative collection scenarios of the metal fraction of household packaging waste. Data from the literature and from the local waste management authority was used for the assessment. The scenarios with alternative separate collection systems for metal were assessed by means of a life cycle assessment. The article is based on the results of the research completed by the first author [<xref ref-type="bibr" rid="B17-sustainability-04-02586">17</xref>].</p>
      <p>In order to compare the collection scenarios for the metal fraction of solid household waste, it was necessary to consider the overall GHG emissions generated by metal collection systems and the effect their utilization has on the overall GHG emissions. In other words, the entire process from metal collection, separation, mixed household waste collection, metal separation from MSWI bottom ash, and substitution effect of primary metals production was studied. The emissions from MSWI were assumed to remain unchanged between the different scenarios and were not analyzed separately.</p>
    </sec>
    <sec>
      <title>2. Description of Scenarios</title>
      <p>The six scenarios of the study are described in <xref ref-type="table" rid="sustainability-04-02586-t001">Table 1</xref>. Scenarios were chosen so that differences from different collection methods could be studied and compared. In all the scenarios with source separation of metals the metals were collected as a separate fraction and not commingled with other recyclables fractions. In property collection, the glass and metal fraction of solid household waste were assumed to be collected by the same collection truck. The truck had two different compartments with pressuring mechanism to maximizing the bulk density of the collected material. The different collection methods chosen were property collection and regional collection. There is a common assumption in all the scenarios that the metals, which are not promoted to be source sorted, end up in the mixed household waste. These metals further end up to MSWI, where metals are collected from bottom ash. The source separation efficiency was based on the estimate of an earlier study by Vares and Lehtinen (2007) [<xref ref-type="bibr" rid="B18-sustainability-04-02586">18</xref>]. The regional collections source sorting efficiencies were estimated by using an earlier study by Kaila [<xref ref-type="bibr" rid="B19-sustainability-04-02586">19</xref>,<xref ref-type="bibr" rid="B20-sustainability-04-02586">20</xref>] that showed dependency of recycling rate on population of the regional collection points.</p>
      <p>In Scenario 0, all the solid household waste is incinerated, forming a benchmark for comparison of the other scenarios. In this scenario, all the metals end up in to the MSWI process. In Scenario 1, the separate metal collection is organized using only 135 regional collection points. Scenarios 2–4 were residential property collection scenarios, where the metals are separately collected from residential properties of over 20, over 10 and over five households, respectively. In Scenarios 2–4, there are also 135 regional collection points, which are targeted for properties that do not have residential property collection. Scenario 5 represents the other end of the spectrum, where the metals are source-separated for recycling with known source sorting efficiency in all the properties and there is no regional collection. In the Scenarios 1–5, the metals that are not source-separated, end up into the incineration process.</p>
	  <table-wrap id="sustainability-04-02586-t001" position="float">
        <object-id pub-id-type="pii">sustainability-04-02586-t001_Table 1</object-id>
        <label>Table 1</label>
        <caption>
          <p>Scenarios of the study.</p>
        </caption>
        <table rules="rows">
  <thead>
            <tr>
              <th align="center" valign="middle">Scenario</th>
              <th align="center" valign="middle">Source separation</th>
              <th align="center" valign="middle">Regional (drop-off) collection</th>
              <th align="center" valign="middle">Property (kerbside) collection</th>
              <th align="center" valign="middle">No. of households/ property</th>
              <th align="center" valign="middle">Incineration</th>
              <th align="center" valign="middle">Separation of metals after incineration</th>
              <th align="center" valign="middle">Transportation</th>
            </tr>
  </thead>
  <tbody>
            <tr>
              <td align="left" valign="middle">
                <bold>Scenario 0</bold>
              </td>
              <td align="center" valign="middle">No</td>
              <td align="center" valign="middle">No</td>
              <td align="center" valign="middle">No</td>
              <td align="center" valign="middle">-</td>
              <td align="center" valign="middle">For all waste</td>
              <td align="center" valign="middle">Yes</td>
              <td align="left" valign="middle">Transportation of mixed household waste</td>
            </tr>
            <tr>
              <td align="left" valign="middle">
                <bold>Scenario 1</bold>
              </td>
              <td align="center" valign="middle">Yes</td>
              <td align="center" valign="middle">135 collection points</td>
              <td align="center" valign="middle">No</td>
              <td align="center" valign="middle">-</td>
              <td align="center" valign="middle">For mixed waste</td>
              <td align="center" valign="middle">Yes</td>
              <td align="left" valign="middle">Separate transportation system for mixed household waste and metal fraction</td>
            </tr>
            <tr>
              <td align="left" valign="middle">
                <bold>Scenario 2</bold>
              </td>
              <td align="center" valign="middle">Yes</td>
              <td align="center" valign="middle">135 collection points</td>
              <td align="center" valign="middle">Yes</td>
              <td align="center" valign="middle">&gt;20</td>
              <td align="center" valign="middle">For mixed waste</td>
              <td align="center" valign="middle">Yes</td>
              <td align="left" valign="middle">Separate transportation system for mixed household waste and metal fraction</td>
            </tr>
            <tr>
              <td align="left" valign="middle">
                <bold>Scenario 3</bold>
              </td>
              <td align="center" valign="middle">Yes</td>
              <td align="center" valign="middle">135 collection points</td>
              <td align="center" valign="middle">Yes</td>
              <td align="center" valign="middle">&gt;10</td>
              <td align="center" valign="middle">For mixed waste</td>
              <td align="center" valign="middle">Yes</td>
              <td align="left" valign="middle">Separate transportation system for mixed household waste and metal fraction</td>
            </tr>
            <tr>
              <td align="left" valign="middle">
                <bold>Scenario 4</bold>
              </td>
              <td align="center" valign="middle">Yes</td>
              <td align="center" valign="middle">135 collection points</td>
              <td align="center" valign="middle">Yes</td>
              <td align="center" valign="middle">&gt;5</td>
              <td align="center" valign="middle">For mixed waste</td>
              <td align="center" valign="middle">Yes</td>
              <td align="left" valign="middle">Separate transportation system for mixed household waste and metal fraction</td>
            </tr>
            <tr>
              <td align="left" valign="middle">
                <bold>Scenario 5</bold>
              </td>
              <td align="center" valign="middle">Yes</td>
              <td align="center" valign="middle">No</td>
              <td align="center" valign="middle">Yes</td>
              <td align="center" valign="middle">&gt;1</td>
              <td align="center" valign="middle">For mixed waste</td>
              <td align="center" valign="middle">Yes</td>
              <td align="left" valign="middle">Separate transportation system for mixed household waste and metal fraction</td>
            </tr>
  </tbody>
        </table>
      </table-wrap>
      
      <p>The collection services were optimized according to the accumulation of the metal fraction of solid household waste. The collection services for suburban single-family houses and suburban apartment blocks were assumed to be similar. The source-separated metal fraction of solid household waste was collected directly from properties or collected with a regional collection scheme with centrally placed regional drop-off containers. <xref ref-type="table" rid="sustainability-04-02586-t002">Table 2</xref> shows the number of inhabitants in different collection schemes that are covered by regional collection and by the property collection scheme.</p>
      <p>The modeled scenarios were formulated in collaboration with the Helsinki Region Environmental Services Authority (HSY) and took into account the HSY requirements for future collection systems. </p>
	  <table-wrap id="sustainability-04-02586-t002" position="float">
        <object-id pub-id-type="pii">sustainability-04-02586-t002_Table 2</object-id>
        <label>Table 2</label>
        <caption>
          <p>Coverage of different collection schemes.</p>
        </caption>
        <table rules="rows">
  <thead>
            <tr>
              <th align="left" valign="middle"> </th>
              <th colspan="3" align="center" valign="middle">Coverage of regional (drop-off ) collection</th>
              <th colspan="3" align="center" valign="middle">Coverage of property collection</th>
            </tr>
            <tr>
              <th align="left" valign="middle">Scenario</th>
              <th align="center" valign="middle">Inhabitants</th>
              <th align="center" valign="middle">%</th>
              <th align="center" valign="middle">Inhabitants/ collection point</th>
              <th align="center" valign="middle">Inhabitants</th>
              <th align="center" valign="middle">%</th>
              <th align="center" valign="middle">Households/ collection point</th>
            </tr>
  </thead>
  <tbody>
            <tr>
              <td align="left" valign="middle">
                <bold>Scenario 0</bold>
              </td>
              <td align="center" valign="middle">0</td>
              <td align="center" valign="middle">0%</td>
              <td align="center" valign="middle">-</td>
              <td align="center" valign="middle">0</td>
              <td align="center" valign="middle">0%</td>
              <td align="center" valign="middle">0</td>
            </tr>
            <tr>
              <td align="left" valign="middle">
                <bold>Scenario 1</bold>
              </td>
              <td align="center" valign="middle">906,264</td>
              <td align="center" valign="middle">100%</td>
              <td align="center" valign="middle">6,713</td>
              <td align="center" valign="middle">0</td>
              <td align="center" valign="middle">0%</td>
              <td align="center" valign="middle">0</td>
            </tr>
            <tr>
              <td align="left" valign="middle">
                <bold>Scenario 2</bold>
              </td>
              <td align="center" valign="middle">255,264</td>
              <td align="center" valign="middle">28%</td>
              <td align="center" valign="middle">1,892</td>
              <td align="center" valign="middle">650,837</td>
              <td align="center" valign="middle">72%</td>
              <td align="center" valign="middle">&gt;20</td>
            </tr>
            <tr>
              <td align="left" valign="middle">
                <bold>Scenario 3</bold>
              </td>
              <td align="center" valign="middle">196,319</td>
              <td align="center" valign="middle">22%</td>
              <td align="center" valign="middle">1,454</td>
              <td align="center" valign="middle">709,945</td>
              <td align="center" valign="middle">78%</td>
              <td align="center" valign="middle">&gt;10</td>
            </tr>
            <tr>
              <td align="left" valign="middle">
                <bold>Scenario 4</bold>
              </td>
              <td align="center" valign="middle">153,996</td>
              <td align="center" valign="middle">17%</td>
              <td align="center" valign="middle">1,141</td>
              <td align="center" valign="middle">752,268</td>
              <td align="center" valign="middle">83%</td>
              <td align="center" valign="middle">&gt;5</td>
            </tr>
            <tr>
              <td align="left" valign="middle">
                <bold>Scenario 5</bold>
              </td>
              <td align="center" valign="middle">0</td>
              <td align="center" valign="middle">0%</td>
              <td align="center" valign="middle">-</td>
              <td align="center" valign="middle">906,264</td>
              <td align="center" valign="middle">100%</td>
              <td align="center" valign="middle">&gt;1</td>
            </tr>
  </tbody>
        </table>
      </table-wrap>
      
    </sec>
    <sec>
      <title>3. Analysis</title>
      <p>The metal fraction of solid household waste was considered to be used as substitute raw materials to produce new metal products. The method used in this research was a life cycle assessment in terms of emitted GHG. In this assessment, the goal was to describe the relevant parts of the technological system of recycling of solid household waste metal fraction. The assessment is described in the following section.</p>
      <p>The GHG reduction potential was calculated in terms of GWP. GWP describes total warming impact of equal masses of different greenhouse gases on atmosphere over chosen period of time. The gases that contribute to GWP are mainly CO<sub>2</sub>, CH<sub>4</sub>, and N<sub>2</sub>O. The values used in this study are from the IPCC 2007 Fourth Assessment Report [<xref ref-type="bibr" rid="B21-sustainability-04-02586">21</xref>], where CO<sub>2 </sub>= 1, N<sub>2</sub>O = 298, CH<sub>4 </sub>= 25, CF<sub>4 </sub>= 7390 and C<sub>2</sub>F<sub>6 </sub>= 12200, expressed in kg CO<sub>2</sub>-equivalent (CO<sub>2</sub>-eq)/t collected metal fraction of solid household waste.</p>
      <p>The GHG emissions were computed both from direct emissions and indirect emissions. The direct emissions taken into account were caused by motor vehicles, which were used to transport and move the materials from collection sites to recycling facilities and further to material recovery processing plants. </p>
      <p>The indirect emissions taken into account in this study were:</p>
      <list list-type="simple">
        <list-item>
          <p>– Emissions caused by production of electricity and fuel consumed at the treatment plant.</p>
        </list-item>
        <list-item>
          <p>– Collection and transport of metal fraction of solid household waste from households. Emissions caused by production of diesel fuel and the release of GHG emissions by the collection trucks.</p>
        </list-item>
        <list-item>
          <p>– Material substitution. Use of recycled metal fraction as raw material in metal production processes was accounted as credited GHG emissions, compared to metal production from primary raw materials. The production of sorted metal feeds into the metal production processes also required energy, but led to overall energy savings at the metal production plant.</p>
        </list-item>
        <list-item>
          <p>– The main energy carriers were coal, natural gas, oil and electricity, which were produced by different energy carriers. GHG emissions caused by using and production of these energy carriers.</p>
        </list-item>
      </list>
      <p>Indirect emissions based on construction of buildings, machinery and equipment for provision of the above-mentioned products and services were not included in the life-cycle inventory. </p>
      <p>For this study, the consequential life cycle assessment approach (described in Ekvall &amp; Weidema [<xref ref-type="bibr" rid="B22-sustainability-04-02586">22</xref>]) was chosen. The consequential LCI methodology aims at describing how the environmentally relevant physical flows to and from the technological system will change in response to possible changes in the life cycle [<xref ref-type="bibr" rid="B22-sustainability-04-02586">22</xref>]. </p>
      <p>The functional unit, the base unit of assessment, was defined as one ton of the mixed metal fraction of solid household waste. GWP per one ton of collected metal fraction of solid household waste was linked to this functional unit. GWP values were expressed in kg CO<sub>2</sub>-equivalent (CO<sub>2</sub>-eq)/t collected metals in different scenarios. The GHG reduction potential was calculated by comparing the GWP of different scenarios.</p>
      <sec>
        <title>3.1. Data</title>
        <sec>
          <title>3.1.1. Description of the Boundaries of the Study</title>
          <p>
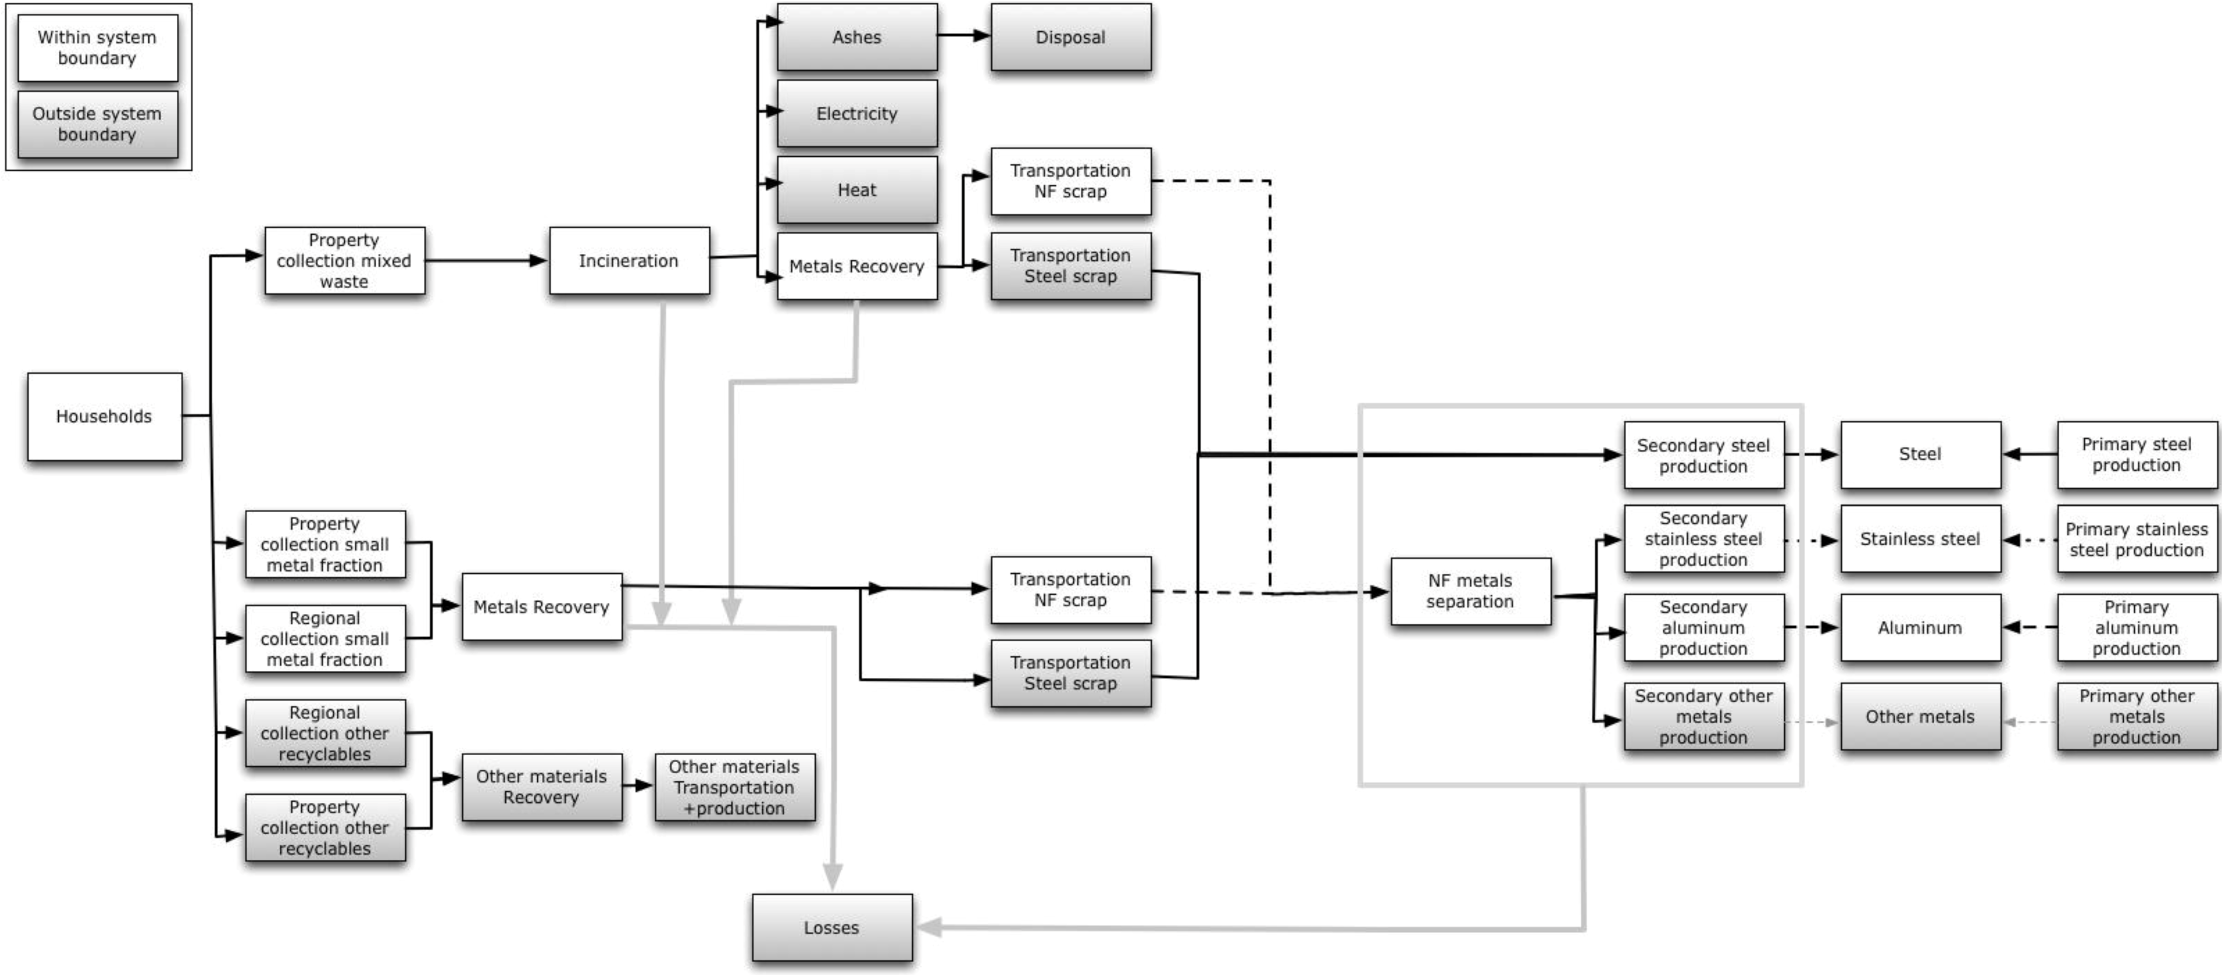
The scope and the boundary of the researched system are shown in <xref ref-type="fig" rid="sustainability-04-02586-f001">Figure 1</xref>. The system and the most important estimations, assumption and choices made regarding the system boundaries and input data are presented in this section.</p>
          <p>According to the scenarios, the metals are either source-separated into separate metal fractions, and the rest ends up in the MSWI process with the mixed waste. The researched system (<xref ref-type="fig" rid="sustainability-04-02586-f001">Figure 1</xref>) consists of two different routes: one for mixed waste and another for source-separated fractions. In both of these routes, emissions of the metal fraction collection were included. In source separation the collected metals were delivered to the Kuusakoski Vantaa separation facility, where steel is separated from non-ferrous (NF) metals with magnetic separation. Steel scrap is separated from MSWI bottom ash with magnetic separation in the incineration facility in Vantaa. Following the steel recovery process, the non-ferrous fraction is transported over 124 km to recovery plant in Heinola, Finland, where aluminum is processed into aluminum ingots. The emissions for transportation to Heinola were included in the researched system. The tin plated steel is delivered directly to the steel producers. The transportation of raw materials was included to the LCI data of used metal production databases, and the transportation has been left outside the boundary of the system as well as the transportation of aluminum ingots from the Heinola facility. From the Heinola plant, stainless steel and other NF metals are transported to other processing plants. Other source-separated fractions of solid household waste and other metals than tin-plated steel, aluminum and stainless steel were excluded from the scope of the research. Other than mechanical metal separation from the MSWI bottom ash, the treatment and disposal of MSWI ashes were excluded from the boundaries of this study. Emissions from transporting the metal scrap from MSWI ashes to the recovery plant in Heinola was calculated based alone on the weight of the aluminum and stainless steel in the MSWI ash.</p>
		  <fig id="sustainability-04-02586-f001" position="anchor">
            <label>Figure 1</label>
            <caption>
              <p>The boundary of the study. </p>
            </caption>
            <graphic xmlns:xlink="http://www.w3.org/1999/xlink" xlink:href="sustainability-04-02586-g001.tif"/>
          </fig>
          
          <p>The emissions of production of secondary metals were calculated using LCI-data from chosen databases (<xref ref-type="table" rid="sustainability-04-02586-t003">Table 3</xref>). This LCI-data also includes emissions from metal recovery as well as used energy sources, and energy mixes used in metal recovery are not analyzed separately. </p>
          <table-wrap id="sustainability-04-02586-t003" position="float">
            <object-id pub-id-type="pii">sustainability-04-02586-t003_Table 3</object-id>
            <label>Table 3</label>
            <caption>
              <p>LCI Data of metal production.</p>
            </caption>
            <table rules="rows">
<thead>
                <tr>
                  <th align="left" valign="middle"> </th>
                  <th colspan="2" align="center" valign="middle">Production method</th>
                  <th align="center" valign="middle">Semi-product</th>
                  <th align="center" valign="middle">GWP CO<sub>2</sub>-eq kg/t</th>
                  <th align="center" valign="middle">1/recovery</th>
                  <th align="center" valign="middle">Source</th>
                </tr>
              </thead>
              <tbody>
                <tr>
                  <td rowspan="3" align="left" valign="middle">
                    <bold>Tin plated steel</bold>
                  </td>
                  <td align="center" valign="middle">Primary production</td>
                  <td align="center" valign="middle">BOF-route</td>
                  <td align="center" valign="middle">Hot rolled coil</td>
                  <td align="center" valign="middle">2103</td>
                  <td align="center" valign="middle">1.48</td>
                  <td align="center" valign="middle">[<xref ref-type="bibr" rid="B23-sustainability-04-02586">23</xref>]</td>
                </tr>
                <tr>
                  <td rowspan="2" valign="middle">Secondary production</td>
                  <td align="center" valign="middle">EAF-route</td>
                  <td align="center" valign="middle">Hot rolled steel sheet</td>
                  <td align="center" valign="middle">507</td>
                  <td align="center" valign="middle">1.15</td>
                  <td align="center" valign="middle">[<xref ref-type="bibr" rid="B24-sustainability-04-02586">24</xref>]</td>
                </tr>
                <tr>
                  <td align="center" valign="middle">BOF-route</td>
                  <td align="center" valign="middle">Hot rolled coil</td>
                  <td align="center" valign="middle">929</td>
                  <td align="center" valign="middle"> </td>
                  <td align="center" valign="middle">[<xref ref-type="bibr" rid="B23-sustainability-04-02586">23</xref>]</td>
                </tr>
                <tr>
                  <td align="left" valign="middle">
                    <bold>Stainless steel</bold>
                  </td>
                  <td align="center" valign="middle"> </td>
                  <td align="center" valign="middle"> </td>
                  <td align="center" valign="middle">Cold rolled coil</td>
                  <td align="center" valign="middle">5847</td>
                  <td align="center" valign="middle">1.1</td>
                  <td align="center" valign="middle">[<xref ref-type="bibr" rid="B25-sustainability-04-02586">25</xref>]</td>
                </tr>
                <tr>
                  <td rowspan="2" align="left" valign="middle">
                    <bold>Aluminium</bold>
                  </td>
                  <td align="center" valign="middle">Primary production</td>
                  <td align="center" valign="middle"> </td>
                  <td align="center" valign="middle">Ingot</td>
                  <td align="center" valign="middle">9852</td>
                  <td align="center" valign="middle">4.27</td>
                  <td align="center" valign="middle">[<xref ref-type="bibr" rid="B26-sustainability-04-02586">26</xref>]</td>
                </tr>
                <tr>
                  <td align="center" valign="middle">Secondary production</td>
                  <td align="center" valign="middle"> </td>
                  <td align="center" valign="middle">Ingot</td>
                  <td align="center" valign="middle">506</td>
                  <td align="center" valign="middle">1.11</td>
                  <td align="center" valign="middle">[<xref ref-type="bibr" rid="B26-sustainability-04-02586">26</xref>]</td>
                </tr>
              </tbody>
            </table>
          </table-wrap>
          <p>The following aspects were taken into account and assumptions were made when formulating the scope of the study:</p>
          <list list-type="simple">
            <list-item>
              <p>– The recovery of metals from waste was taken into account as a credit in metal production systems;</p>
            </list-item>
            <list-item>
              <p>– Only the recycling and collection processes of the metal fraction of solid household waste was included in this study;</p>
            </list-item>
            <list-item>
              <p>– It was assumed that the new district collection system with 135 drop-off collection points had been introduced and the other scenarios were compared with this situation, and it was assumed that the new incineration plant was already operating;</p>
            </list-item>
            <list-item>
              <p>– The suggested collection systems included the combination of the collection of the metal fraction of solid household waste at properties and from regional containers;</p>
            </list-item>
            <list-item>
              <p>– The offered service level was assumed to be the same in all areas;</p>
            </list-item>
            <list-item>
              <p>– The WEEE scrap and metal cans with refundable deposit were left outside this study;</p>
            </list-item>
            <list-item>
              <p>– The emissions caused by the construction, production, and maintenance of the transportation system and collection infrastructure was left outside the study;</p>
            </list-item>
            <list-item>
              <p>– Aluminum was not recovered after the MSWI process. This assumption was a crude, in reality up to 25% of the aluminum could be recovered from the bottom ash [<xref ref-type="bibr" rid="B27-sustainability-04-02586">27</xref>]. The effect of this assumption was studied in a sensitivity analysis;</p>
            </list-item>
            <list-item>
              <p>– The emissions from the disposal of the non-metallic fraction of MSWI plant bottom ash was assumed to remain independent from the metal concentration in the ash;</p>
            </list-item>
            <list-item>
              <p>– The transportation of tin-plated steel scrap was not included in this study, because this fraction was transported abroad and its accurate destination was unknown. In addition, the transportation of raw materials was included the data of the used databases. Nevertheless the containerships used for transportation were large, and thus the amount of collected scrap material was diminishingly small compared to the total shipped steel scrap. Consequently, the GHG emissions caused by shipping this material would be diminishingly small per ton;</p>
            </list-item>
            <list-item>
              <p>– The definition of the time frame was from the moment the metal waste was produced to the moment it turned into a new metal product, in practice grave to cradle.</p>
            </list-item>
          </list>
          <p>The emissions caused before collection of the metal fraction of solid household waste were not included in this study.</p>
        </sec>
        <sec>
          <title>3.1.2. Composition of the Metal Fraction of Solid Household Waste</title>
          <p>The fraction chosen for the study was the metal fraction of solid household waste. In the research carried out by Lassila &amp; Tikanoja, the research composition of collected metals was analyzed in a regional collection point in Vantaa [<xref ref-type="bibr" rid="B28-sustainability-04-02586">28</xref>]. The composition is shown in <xref ref-type="fig" rid="sustainability-04-02586-f002">Figure 2</xref>. The research showed that the collected metal fraction of solid household waste consisted of 53% tin-plated steel packaging, 14% aluminum packaging, 32% other metal scrap and 1% other materials than metal [<xref ref-type="bibr" rid="B28-sustainability-04-02586">28</xref>]. Other metal scrap consisted of particles such as kettles, pans, metal tools <italic>etc.</italic> [<xref ref-type="bibr" rid="B28-sustainability-04-02586">28</xref>]. The composition of the other metal scrap was unknown. Yet this fraction was significant and it was important to include it in this study, as it may have crucial effects on the result. The composition of the other metal scrap was estimated by the average composition of items in the other metal scrap. It was estimated that the other metal scrap of 32% consisted of 10-percentage points aluminum, 15-percentage points stainless steel and seven percentage points other metals. Other metals, such as copper and zinc, composing all together 7%, of the metal fraction were not included in this study because the concentrations of these metals was unknown. In total, the composition of the metal fraction of solid household waste was 54% tin plated steel, 15% stainless steel, 24% aluminum, 8% other metals and 1% non-metals. </p>
          <fig id="sustainability-04-02586-f002" position="anchor">
            <label>Figure 2</label>
            <caption>
              <p>The composition of the metal fraction of solid household waste.</p>
            </caption>
            <graphic xmlns:xlink="http://www.w3.org/1999/xlink" xlink:href="sustainability-04-02586-g002.tif"/>
          </fig>
          <p>In this study, the main fractions were tin-plated steel, aluminum and stainless steel. According to Buró and Holappa [<xref ref-type="bibr" rid="B29-sustainability-04-02586">29</xref>] tin-plated steel contains 0.3% of tin. Tin affects steel utilization because it affects the quality of the steel product [<xref ref-type="bibr" rid="B29-sustainability-04-02586">29</xref>]. The acceptable tin grade is 0.05% in steel production [<xref ref-type="bibr" rid="B25-sustainability-04-02586">25</xref>]. This means that tin-plated steel cannot be directly utilized in Electric-Arc-Furnace (EAF)-route production because of the high tin grade. Consequently tin-plated steel is more likely used in the Basic Oxygen Furnace (BOF)-route. The effect of this assumption is studied in a sensitivity analysis. The amounts of lost resources in pre-treatment and recycling processes were estimated in order to be able to calculate the emissions caused by the production of metals equal to lost resources. In this study, the data on aluminum, tin-plated steel and stainless steel production and utilization were directly retrieved from databases (<xref ref-type="table" rid="sustainability-04-02586-t003">Table 3</xref>). Nevertheless, the different phases of treatment and recovery of metals are presented in the study, in order to identify the main sources of emissions.</p>
        </sec>
        <sec>
          <title>3.1.3. Parameters</title>
          <p>Four parameters were used to describe how much of the metal fraction of solid household waste was recycled: 1) household source sorting efficiency, 2) separation efficiency of different metal fractions from the pre-sorted mixed metal fraction of solid household waste in the recycling processes, 3) separation efficiency of different metals from MSWI bottom ash and 4) material recovery in secondary metal production. </p>
          <p>The source sorting efficiency for metals is defined as the amount of source-separated material in relation to the total amount of that material in the generated waste. The non-separated material was included in the mixed household waste. The source sorting efficiency applies to the whole system and is the product of scenario coverage, the individual persons source sorting efficiency and rate of participation. The separation efficiency of the recycling process was defined as the recycling process yield and final recovery of material. </p>
          <p>Property-specific source sorting efficiency was calculated from a study performed by Vares and Lehtinen (2007) [<xref ref-type="bibr" rid="B18-sustainability-04-02586">18</xref>]. According to their study, there was approximately 1.2 kg of metal fraction of packaging waste collected per person in 2007 [<xref ref-type="bibr" rid="B18-sustainability-04-02586">18</xref>]. HSY estimate [<xref ref-type="bibr" rid="B7-sustainability-04-02586">7</xref>] of packaging waste generation was 2.86 kg/person/annum. With these values, the total amount of the metal fraction is 4.06 kg/person/annum, and the collected amount 1.2 kg/person/annum can be calculated. With the total amount, the source sorting efficiency for the metal fraction of solid household waste in property collection can be calculated to be 30%. This was used as a base case value. As the metal fraction of packaging waste has been collected for a short period of time, the efficiency is expected to grow in the future. In this study, the possible changes in the source sorting efficiency have been taken into account. The source sorting efficiency is assumed to improve to reach 50% in the first phase. </p>
          <p>Property collection was assumed to yield higher source sorting efficiencies than regional district collection with regional drop-off containers. The regional collection scenarios did not include an increase in recycling rate in the near future, because there are no plans for building more than 135 regional drop-off points [<xref ref-type="bibr" rid="B30-sustainability-04-02586">30</xref>].</p>
          <p>The estimate for the yield of separation of metals from MSWI bottom ash was 50% in base case and 80% in the first stage. This was assumed to be the same for steel and stainless steel. Two different estimations were made, because the yield can rise in the future due to new technologies utilized. The estimation was done for the whole metal fraction of household waste, but only recovery of steel and stainless steel was taken into account and the effect of separation of aluminum was tested in a sensitivity analysis. Separation from bottom ash is analyzed more thoroughly in <xref ref-type="sec" rid="sec3dot1dot6-sustainability-04-02586">Section 3.1.6</xref>. </p>
        </sec>
        <sec>
          <title>3.1.4. Collection and Transport</title>
          <p>It was assumed that recyclables would be brought to regional drop-off containers without additional use of cars. The delivery to recycling centers and to metal separation plants was assumed to be by collection trucks. In mixed waste, collection emissions were allocated only for the metals. The used values for diesel consumption for the collection scenarios in regional collection was 0.44 L/km [<xref ref-type="bibr" rid="B31-sustainability-04-02586">31</xref>] and for property collection 0.75 L/km [<xref ref-type="bibr" rid="B18-sustainability-04-02586">18</xref>].</p>
          <p>In this study, CO<sub>2</sub>-eq emissions per ton of transported mixed waste and per ton of collected metal fraction were analyzed. </p>
          <p>The emissions for collection were calculated from accrual of driving kilometers of collection trucks in regional collection and in property collection. The calculations were made based on the filling rates of collection bins in different sized residential properties, and the frequency with which collection bins were emptied in a year was calculated. In the regional collection, emission calculations where done based on the same principle.</p>
          <p>As the number of people per collection bin was known, the filling rate of the collection bins from different size residential buildings was calculated using estimates on collected metal/person/annum and the source sorting efficiencies, 30% (base case) and 50% (first phase). The volume of the collection bin was 240 liters in property collection. The regional collection filling rate was assumed to be 80% and the source sorting efficiencies (<xref ref-type="table" rid="sustainability-04-02586-t004">Table 4</xref>) were estimated by using an earlier study by Kaila [<xref ref-type="bibr" rid="B19-sustainability-04-02586">19</xref>,<xref ref-type="bibr" rid="B20-sustainability-04-02586">20</xref>] that showed the dependency of the source sorting efficiency on the number of inhabitants per each collection point. </p>
          <table-wrap id="sustainability-04-02586-t004" position="float">
            <object-id pub-id-type="pii">sustainability-04-02586-t004_Table 4</object-id>
            <label>Table 4</label>
            <caption>
              <p>Source sorting efficiencies of regional collection.</p>
            </caption>
            <table rules="rows">
<thead>
                <tr>
                  <th align="left" valign="middle"> </th>
                  <th align="center" valign="middle">Source sorting efficiency</th>
                  <th align="center" valign="middle">Inhabitants/collection point</th>
                </tr>
              </thead>
              <tbody>
                <tr>
                  <td align="left" valign="middle">
                    <bold>Scenario 0</bold>
                  </td>
                  <td align="center" valign="middle">0</td>
                  <td align="center" valign="middle">0</td>
                </tr>
                <tr>
                  <td align="left" valign="middle">
                    <bold>Scenario 1</bold>
                  </td>
                  <td align="center" valign="middle">6.7</td>
                  <td align="center" valign="middle">6714</td>
                </tr>
                <tr>
                  <td align="left" valign="middle">
                    <bold>Scenario 2</bold>
                  </td>
                  <td align="center" valign="middle">10</td>
                  <td align="center" valign="middle">1893</td>
                </tr>
                <tr>
                  <td align="left" valign="middle">
                    <bold>Scenario 3</bold>
                  </td>
                  <td align="center" valign="middle">12</td>
                  <td align="center" valign="middle">1455</td>
                </tr>
                <tr>
                  <td align="left" valign="middle">
                    <bold>Scenario 4</bold>
                  </td>
                  <td align="center" valign="middle">17</td>
                  <td align="center" valign="middle">1141</td>
                </tr>
                <tr>
                  <td align="left" valign="middle">
                    <bold>Scenario 5</bold>
                  </td>
                  <td align="center" valign="middle">0</td>
                  <td align="center" valign="middle">0</td>
                </tr>
              </tbody>
            </table>
          </table-wrap>
          <p>The population in each collection point was estimated using mixed household waste collection data [<xref ref-type="bibr" rid="B2-sustainability-04-02586">2</xref>]. Required pick-ups were calculated by using the estimated rate of filling of 80% in property collection and 50% in regional collection. The estimation for the collection point’s distance in property collection was used based on the data from the study by Vares and Lehtinen (2007) [<xref ref-type="bibr" rid="B18-sustainability-04-02586">18</xref>], and in regional collection, the average distance for collection points was calculated using data from regional collection [<xref ref-type="bibr" rid="B31-sustainability-04-02586">31</xref>]. The average distance for collection points in property collection was 0.58 km and 13.3 km in regional collection. </p>
          <p>The collected metal fraction of solid household waste was assumed to be transported by trucks to the treatment facilities. The property collection was assumed to be transported by trucks collecting glass and metal fraction of solid household waste. The trucks have two different compartments with pressuring mechanism to maximizing the bulk density of the collected material. The transport distances taken into account were the transit of collection trucks from depot to collection bins, the distances between the collection bins, the transport to collection station and finally the transfer of collected fraction to material recycling facility. The modeled transport distances were set to 124 km from collection stations to material recycling facility. The average distance from property collection bins to collection station was calculated from the average distance of postal codes to the closest collection station. The resulted average distance was 16 km. In regional collection, the average distance to the closest collection station was assumed to be the same 13.3 as the collection point’s distance in regional collection. The distance from the depot to the collecting area was assumed to be 8 km in property collection [<xref ref-type="bibr" rid="B32-sustainability-04-02586">32</xref>]. In regional collection, driving kilometers from the depot to the collecting areas where not separately calculated, because the data of the average distance of collection points included driving kilometers to the depot. </p>
          <p>The required driving kilometers for the collection of the metal fraction was calculated from the average distance of the collection. The amount of the needed number of pick-ups was calculated with the collection frequency derived from the filling rate of collection bins in different sized properties. The transports to collection stations and transports of the collection vehicles from the depot to the collection area in property collection were calculated from the required collecting rounds during one year. Collection rounds were calculated from the capacity of the collecting vehicles and the bulk density of the collected material. The average bulk density of collected metals was 120 kg/m<sup>3</sup> [<xref ref-type="bibr" rid="B18-sustainability-04-02586">18</xref>]. This bulk density was analyzed locally by the Technical Research Centre of Finland, however the value was very high considering the quality of material. Its effect on the results was tested in the sensitivity analysis. In property collection, the volume of the collection points emptied in one round was assumed to be 100 collection points [<xref ref-type="bibr" rid="B32-sustainability-04-02586">32</xref>]. In the study of Vares and Lehtinen, the amount of emptied collection points in one round was 80 [<xref ref-type="bibr" rid="B31-sustainability-04-02586">31</xref>]. In this study that estimation was raised to 100 because in Lehtinen and Vares’s study, the collection was done in an experimental way, so in the actual situation, the collection could be done more efficiently [<xref ref-type="bibr" rid="B32-sustainability-04-02586">32</xref>]. </p>
          <p>It was assumed that the regional collection was performed by pick-up truck carrying a capacity of 2 tons of metal scrap [<xref ref-type="bibr" rid="B31-sustainability-04-02586">31</xref>]. The volume of the collection bins was 3 m<sup>3</sup> in the regional collection. Similar to the property collection, the amount of pick-ups needed in one year in regional collection was estimated by calculating the required collection frequency of the bins from the filling rate. The filling rate of the bins was calculated using the sorting efficiencies in <xref ref-type="table" rid="sustainability-04-02586-t004">Table 4</xref>. </p>
          <p>The web-based calculation system for traffic exhaust emissions and energy consumption LIPASTO [<xref ref-type="bibr" rid="B33-sustainability-04-02586">33</xref>] was used for estimating GHG emission of transportation. In the LIPASTO calculation system, the vehicles are categorized according to their gross vehicle mass and age [<xref ref-type="bibr" rid="B29-sustainability-04-02586">29</xref>]. Age defines which emission category should be used in calculations, and gross vehicle mass defines which type of vehicles emission factor should be used [<xref ref-type="bibr" rid="B34-sustainability-04-02586">34</xref>]. In this study, the used category for emissions was Euro 3-class emission factors, since most of the current waste transportation vehicles fit into this category. The emission factor of the LIPASTO calculation systems for a full trailer was then used for the vehicle transferring collected fraction to material recycling facilities. Property collection emissions are then allocated to metals by the mass ratio of metals in metal and glass collection. </p>
        </sec>
        <sec>
          <title>3.1.5. MSWI</title>
          <p>In the model, mixed waste was transported directly to the local MSWI plant. The incineration plant does not exist yet, but will be built within the next few years. The removal of large metal objects before incineration was assumed. The incineration technology used in the model was an open-hearth incinerator. The metal recovery from MSWI bottom ash was modeled based on the study of Kinnunen <italic>et al</italic> [<xref ref-type="bibr" rid="B9-sustainability-04-02586">9</xref>]. The metals separated from MSWI bottom ash were steel and stainless steel. Source-separation of recyclable materials alters the composition of the residual waste and thereby also the output from the incineration process. Ashes and air pollution control residues remained after treatment, but disposal or utilization of these was excluded from the system.</p>
        </sec>
        <sec id="sec3dot1dot6-sustainability-04-02586">
          <title>3.1.6. Metal Recycling and Recovery</title>
          <p>Different metals from metal fraction of solid household waste were mechanically separated after delivery to metal recovery facilities. The energy consumption of the processes was included in the LCI data used and was not calculated separately (<xref ref-type="table" rid="sustainability-04-02586-t003">Table 3</xref>). Mechanical processing and secondary production emissions were collected from LCI data of steel aluminum and stainless steel (<xref ref-type="table" rid="sustainability-04-02586-t003">Table 3</xref>). Also, the emissions caused by material losses in mechanical separation and metallurgical processes were included in the LCI-databases of metal production. Losses of material during production are indicated in <xref ref-type="table" rid="sustainability-04-02586-t003">Table 3</xref> with one/recovery. This indicator describes the input and output ratio for the material. For example in aluminum primary production, the need for bauxite is over four times the output of the aluminum. It was assumed that construction of new facilities would not be needed. The only environmental effect included in this study was the effect of material substitution on the GHG emissions.</p>
          <p>The yield and the grade for metals recovered from MSWI bottom ash were estimated using earlier studies [<xref ref-type="bibr" rid="B9-sustainability-04-02586">9</xref>,<xref ref-type="bibr" rid="B35-sustainability-04-02586">35</xref>]. The base case scenario calculation was made with an assumption that aluminum would not be recovered after incineration. This is a crude assumption as up to 25% of aluminum is recoverable after the incineration process [<xref ref-type="bibr" rid="B27-sustainability-04-02586">27</xref>]. One reason for low yield of aluminum after MSWI is the combination of aluminum’s high affinity to oxygen, the high temperature in the MSWI furnace and aluminum's low melting point, which causes melting of aluminum and spreading into small droplets. In addition, a large part of the aluminum is very thin foil in solid household waste making its surface to mass ratio very high. This makes aluminum very likely to oxidize and energy intensive to recover. In addition, small particle size makes it more challenging to recover aluminum from bottom ash with traditional physical separation methods [<xref ref-type="bibr" rid="B9-sustainability-04-02586">9</xref>]. However, based on L&amp;T’s (2006) [<xref ref-type="bibr" rid="B8-sustainability-04-02586">8</xref>] study, about 42% of aluminum in the metal fraction of solid household waste is thicker than foil and this way is more likely to survive the MSWI process without full oxidization.</p>
          <p>López-Delgado <italic>et al.</italic> [<xref ref-type="bibr" rid="B35-sustainability-04-02586">35</xref>] study showed that steel from MSWI plants bottom ash was strongly oxidized and the iron grade was 72%. This is used as estimation about iron grade in our study. The estimate for yield of steel and stainless steel from bottom ash was 50% in base case and 80% in first stage. Two different estimations were made, because yield of separation processes can rise in the future due to new technologies utilized. The effect on the results of the assumption that aluminum was not recovered after the MSWI process was analyzed in the sensitivity analysis. </p>
          <p>The emissions for metal recycling and recovery of the metal fraction of solid household waste was calculated by using Athena's [<xref ref-type="bibr" rid="B24-sustainability-04-02586">24</xref>] LCI-data for hot-rolled steel plate, EAA's [<xref ref-type="bibr" rid="B26-sustainability-04-02586">26</xref>] LCI-data for aluminum ingot, World Steel [<xref ref-type="bibr" rid="B23-sustainability-04-02586">23</xref>] LCI-data for hot-rolled steel strip, and Eurofer's [<xref ref-type="bibr" rid="B25-sustainability-04-02586">25</xref>] LCA-data for stainless steel scrap value (<xref ref-type="table" rid="sustainability-04-02586-t003">Table 3</xref>). The total secondary production emissions were calculated using collected metal masses, the value of GWP for secondary production and emissions of collection and transport. Credited GWP from recycling of metals were estimated by subtracting the primary production GWP from total secondary GWP value.</p>
          <p>Stainless steel production emissions were estimated using Eurofer’s [<xref ref-type="bibr" rid="B25-sustainability-04-02586">25</xref>] value of scrap data. Eurofer calculates the value of scrap by subtracting a theoretical 100% scrap-based production’s emission from a theoretical 100% scrap-based production’s emissions [<xref ref-type="bibr" rid="B36-sustainability-04-02586">36</xref>]. In Finland, Outokumpu’s production used 90% scrap in stainless steel production in 2009 [<xref ref-type="bibr" rid="B37-sustainability-04-02586">37</xref>]. Due to impurities of recycled raw materials, these materials need to be pre-treated. Emission caused by loss of material in pre-treatment is calculated with losses of different scenarios and mass to primary productions GWP. This value was added as emission to the total secondary production emissions. The estimation for losses in pre-treatment processes for stainless steel is 1% [<xref ref-type="bibr" rid="B38-sustainability-04-02586">38</xref>]. </p>
          <p>The output after recycling and pre-treatment processes for aluminum and steel and stainless steel was assumed to produce substitutes for primary raw materials for metallurgical processes. The resulted yields are presented in <xref ref-type="table" rid="sustainability-04-02586-t005">Table 5</xref>. The yield indicates how many percent of the total metal fraction solid household waste can be recovered in different collection scenarios.</p>
          <table-wrap id="sustainability-04-02586-t005" position="float">
            <object-id pub-id-type="pii">sustainability-04-02586-t005_Table 5</object-id>
            <label>Table 5</label>
            <caption>
              <p>Yields of different metal fractions of packaging waste.</p>
            </caption>
            <table rules="rows">
<thead>
                <tr>
                  <th rowspan="2" colspan="2" align="left" valign="middle"> </th>
                  <th colspan="2" align="center" valign="middle">Base case</th>
                  <th colspan="2" align="center" valign="middle">1st Stage (50%)</th>
                </tr>
                <tr>
                  <th valign="middle">(t)</th>
                  <th valign="middle">Yield</th>
                  <th valign="middle">(t)</th>
                  <th valign="middle">Yield</th>
                </tr>
              </thead>
              <tbody>
                <tr>
                  <td rowspan="6" align="left" valign="middle">
                    <bold>Tin plated steel</bold>
                  </td>
                  <td align="left" valign="middle">
                    <bold>Scenario 0</bold>
                  </td>
                  <td align="center" valign="middle">1119</td>
                  <td align="center" valign="middle">36.0%</td>
                  <td align="center" valign="middle">1791</td>
                  <td align="center" valign="middle">57.6%</td>
                </tr>
                <tr>
                  <td align="left" valign="middle">
                    <bold>Scenario 1</bold>
                  </td>
                  <td align="center" valign="middle">1239</td>
                  <td align="center" valign="middle">39.8%</td>
                  <td align="center" valign="middle">1856</td>
                  <td align="center" valign="middle">59.7%</td>
                </tr>
                <tr>
                  <td align="left" valign="middle">
                    <bold>Scenario 2</bold>
                  </td>
                  <td align="center" valign="middle">1604</td>
                  <td align="center" valign="middle">51.6%</td>
                  <td align="center" valign="middle">2301</td>
                  <td align="center" valign="middle">74.0%</td>
                </tr>
                <tr>
                  <td align="left" valign="middle">
                    <bold>Scenario 3</bold>
                  </td>
                  <td align="center" valign="middle">1639</td>
                  <td align="center" valign="middle">52.7%</td>
                  <td align="center" valign="middle">2341</td>
                  <td align="center" valign="middle">75.3%</td>
                </tr>
                <tr>
                  <td align="left" valign="middle">
                    <bold>Scenario 4</bold>
                  </td>
                  <td align="center" valign="middle">1672</td>
                  <td align="center" valign="middle">53.8%</td>
                  <td align="center" valign="middle">2376</td>
                  <td align="center" valign="middle">76.4%</td>
                </tr>
                <tr>
                  <td align="left" valign="middle">
                    <bold>Scenario 5</bold>
                  </td>
                  <td align="center" valign="middle">1716</td>
                  <td align="center" valign="middle">55.2%</td>
                  <td align="center" valign="middle">2450</td>
                  <td align="center" valign="middle">78.8%</td>
                </tr>
                <tr>
                  <td rowspan="6" align="left" valign="middle">
                    <bold>Stainless steel</bold>
                  </td>
                  <td align="left" valign="middle">
                    <bold>Scenario 0</bold>
                  </td>
                  <td align="center" valign="middle">312</td>
                  <td align="center" valign="middle">36.0%</td>
                  <td align="center" valign="middle">509</td>
                  <td align="center" valign="middle">57.6%</td>
                </tr>
                <tr>
                  <td align="left" valign="middle">
                    <bold>Scenario 1</bold>
                  </td>
                  <td align="center" valign="middle">352</td>
                  <td align="center" valign="middle">39.8%</td>
                  <td align="center" valign="middle">528</td>
                  <td align="center" valign="middle">59.7%</td>
                </tr>
                <tr>
                  <td align="left" valign="middle">
                    <bold>Scenario 2</bold>
                  </td>
                  <td align="center" valign="middle">456</td>
                  <td align="center" valign="middle">61.6%</td>
                  <td align="center" valign="middle">654</td>
                  <td align="center" valign="middle">74.0%</td>
                </tr>
                <tr>
                  <td align="left" valign="middle">
                    <bold>Scenario 3</bold>
                  </td>
                  <td align="center" valign="middle">466</td>
                  <td align="center" valign="middle">52.7%</td>
                  <td align="center" valign="middle">666</td>
                  <td align="center" valign="middle">75.2%</td>
                </tr>
                <tr>
                  <td align="left" valign="middle">
                    <bold>Scenario 4</bold>
                  </td>
                  <td align="center" valign="middle">476</td>
                  <td align="center" valign="middle">53.8%</td>
                  <td align="center" valign="middle">676</td>
                  <td align="center" valign="middle">76.4%</td>
                </tr>
                <tr>
                  <td align="left" valign="middle">
                    <bold>Scenario 5</bold>
                  </td>
                  <td align="center" valign="middle">488</td>
                  <td align="center" valign="middle">55.2%</td>
                  <td align="center" valign="middle">697</td>
                  <td align="center" valign="middle">78.8%</td>
                </tr>
                <tr>
                  <td rowspan="6" align="left" valign="middle">
                    <bold>Aluminium</bold>
                  </td>
                  <td align="left" valign="middle">
                    <bold>Scenario 0</bold>
                  </td>
                  <td align="center" valign="middle">0</td>
                  <td align="center" valign="middle">0.0%</td>
                  <td align="center" valign="middle">0</td>
                  <td align="center" valign="middle">0.0%</td>
                </tr>
                <tr>
                  <td align="left" valign="middle">
                    <bold>Scenario 1</bold>
                  </td>
                  <td align="center" valign="middle">94</td>
                  <td align="center" valign="middle">6.7%</td>
                  <td align="center" valign="middle">94</td>
                  <td align="center" valign="middle">6.7%</td>
                </tr>
                <tr>
                  <td align="left" valign="middle">
                    <bold>Scenario 2</bold>
                  </td>
                  <td align="center" valign="middle">341</td>
                  <td align="center" valign="middle">24.2%</td>
                  <td align="center" valign="middle">542</td>
                  <td align="center" valign="middle">38.7%</td>
                </tr>
                <tr>
                  <td align="left" valign="middle">
                    <bold>Scenario 3</bold>
                  </td>
                  <td align="center" valign="middle">365</td>
                  <td align="center" valign="middle">26.1%</td>
                  <td align="center" valign="middle">584</td>
                  <td align="center" valign="middle">41.8%</td>
                </tr>
                <tr>
                  <td align="left" valign="middle">
                    <bold>Scenario 4</bold>
                  </td>
                  <td align="center" valign="middle">389</td>
                  <td align="center" valign="middle">27.8%</td>
                  <td align="center" valign="middle">621</td>
                  <td align="center" valign="middle">44.4%</td>
                </tr>
                <tr>
                  <td align="left" valign="middle">
                    <bold>Scenario 5</bold>
                  </td>
                  <td align="center" valign="middle">420</td>
                  <td align="center" valign="middle">30.0%</td>
                  <td align="center" valign="middle">699</td>
                  <td align="center" valign="middle">50.0%</td>
                </tr>
              </tbody>
            </table>
          </table-wrap>
          <p>In the WRAP (2006) report the benefit for recycling was calculated in most of these earlier studies by comparing Electric-Arc-Furnace (EAF)-route production to Basic Oxygen Furnace (BOF)-route for steel production [<xref ref-type="bibr" rid="B11-sustainability-04-02586">11</xref>]. Due to a high tin content, the GHG reduction potential of steel recycling was also calculated by using the BOF-route in this research.</p>
          <p>According to Smith <italic>et al.</italic> [<xref ref-type="bibr" rid="B39-sustainability-04-02586">39</xref>], the separation of metals from bottom ash saves as much or even more energy than source-separated metals. This estimation was made with the assumption that the production technology would not be disturbed by tin in steel. However, the quality of the metals recovered from solid household waste is questionable. Tin has unlimited solubility to molten steel and it cannot be separated anymore once it is there. Tin decreases the quality of steel and dilution with primary raw materials is the only method to reach acceptable tin levels in steel [<xref ref-type="bibr" rid="B29-sustainability-04-02586">29</xref>].</p>
          <p>For tin-plated steel, the used data was the average data from the United States and from Canada. In all other cases, the European average data was used. Loss of material and quality of the materials during these processes were taken into account. </p>
          <p>GHG reduction potentials of recycling for each metal were calculated by subtracting primary production emissions from secondary production emission. Total credits were calculated with the assumption that recycling would replace primary production with the amount that was collected in every scenario. The results are presented in terms of comparison of GWP of different scenarios, in other words, as GHG reduction potential of different scenarios.</p>
          <p>Energy was also included in the LCI data applied and was not separately taken under consideration. In the LCI data, electricity supplied is assumed to reflect the average national mix. </p>
        </sec>
      </sec>
    </sec>
    <sec sec-type="results">
      <title>4. Results and Discussion</title>
      <p>The GHG reduction potential for the different collection scenarios compared to the situation, where no metals were recovered, ranges from -8000 to -9000 t CO<sub>2</sub>-eq, when source sorting efficiency was 30% and from -12,000 to -14,000 t CO<sub>2</sub>-eq with 50% source sorting efficiency. In Scenario 0 the GHG reduction potential is -3400 t CO<sub>2</sub>-eq with a 50% yield from MSWI bottom ash and -5500 t CO<sub>2</sub>-eq with a 80% yield from MSWI bottom ash. The GHG reduction potential of the regional collection Scenario 1 is -4600 t CO<sub>2</sub>-eq. Results show that separate collection from residential properties, or “property collection”, clearly produces more environmental benefits in terms of GHG emissions compared to the scenario without source sorting. One of the reasons for this is the choice made of not recovering the aluminum from MSWI bottom ash as well as the loss of metal quality due to the incineration process.</p>
      <p>The major cause for higher GWP of regional collection, compared to property collection, is that the recycling rate is rather low at regional collection points. The reason for the low recycling rate for regional collection is likely that collection is less controlled at regional collection points compared to property collection and that consumers are more likely to separate at source rather than travel to a collection point. Kaila [<xref ref-type="bibr" rid="B19-sustainability-04-02586">19</xref>,<xref ref-type="bibr" rid="B20-sustainability-04-02586">20</xref>] shows that the regional collection recycling rate is less than 20% if the population sharing the collection point is more than 900 people. That means that in the Helsinki area there should be at least 1000 regional collection points. </p>
      <p>In terms of GWP, the best scenario was the “separate collection for all”- scenario, Scenario 5. The second best practice is to collect metals from properties that include five or more apartments and from regional collection points (Scenario 4). The GWP of Scenario 4 is about 3–5 percentage units higher than that of Scenario 5. Sensitivity analysis shows that the effect of the metal yield or grade on the GWP does not affect the scenario rank order. In addition, the sensitivity analysis shows that not performing a metal yield from MSWI bottom ash results in a significantly higher GWP. This indicates that separation from MSWI bottom ash is important, but cannot replace source separation. A larger amount was saved elsewhere in the system due to recycling. Furthermore, taking into account the fossil fuels with regard to energy content instead of mass and scarcity does not change the tendency observed in the results. The results presented here have been weighted with regard to the scarcity of the resources, where the weighting criterion of the EDIP1997 method [<xref ref-type="bibr" rid="B40-sustainability-04-02586">40</xref>] is used. All scenarios show consistent savings of metal resources. Note that these savings are proportional to the sorting efficiency for metal packaging.</p>
      <p>It is clear that a sorting or separation efficiency of 100% is theoretical only, but efficiency could be increased by targeted initiatives such as better guidance and education as well as providing a better infrastructure for citizens. As an example, the deposit-return system of beverage cans and bottles reaches a sorting efficiency near 100%. Such an efficiency, however, is not realistic to expect from the recovery of the metal fraction of solid household waste. Nevertheless, a future target of 50% reuse or recycling can be set and be expected to be realizable. This will depend on the development in waste composition, amount of waste as well as recycling technology. Therefore, development in waste amounts and efficiency of collection scenarios should be carefully monitored in the future.</p>
      <p>Reduction of emissions from collection and transport could make recycling more beneficial, but reduction of emissions from waste treatment is needed as well. Merrild [<xref ref-type="bibr" rid="B41-sustainability-04-02586">41</xref>] demonstrates that in general aluminum and steel could be transported considerable distances without compromising the benefit of recycling when compared to incineration with energy recovery. This means that even export of recyclables for example from Europe to Asia could be justified from an environmental point of view. Optimization of collection routes and effective utilization of truck capacities are two other suggestions. For instance, Tanskanen and Kaila [<xref ref-type="bibr" rid="B16-sustainability-04-02586">16</xref>] demonstrate that the introduction of additional source-separated fractions in property-close collection scenarios increases the fuel consumption, but this is to some extent mitigated by more fuel-efficient methods with combined or commingled collection. </p>
      <p>
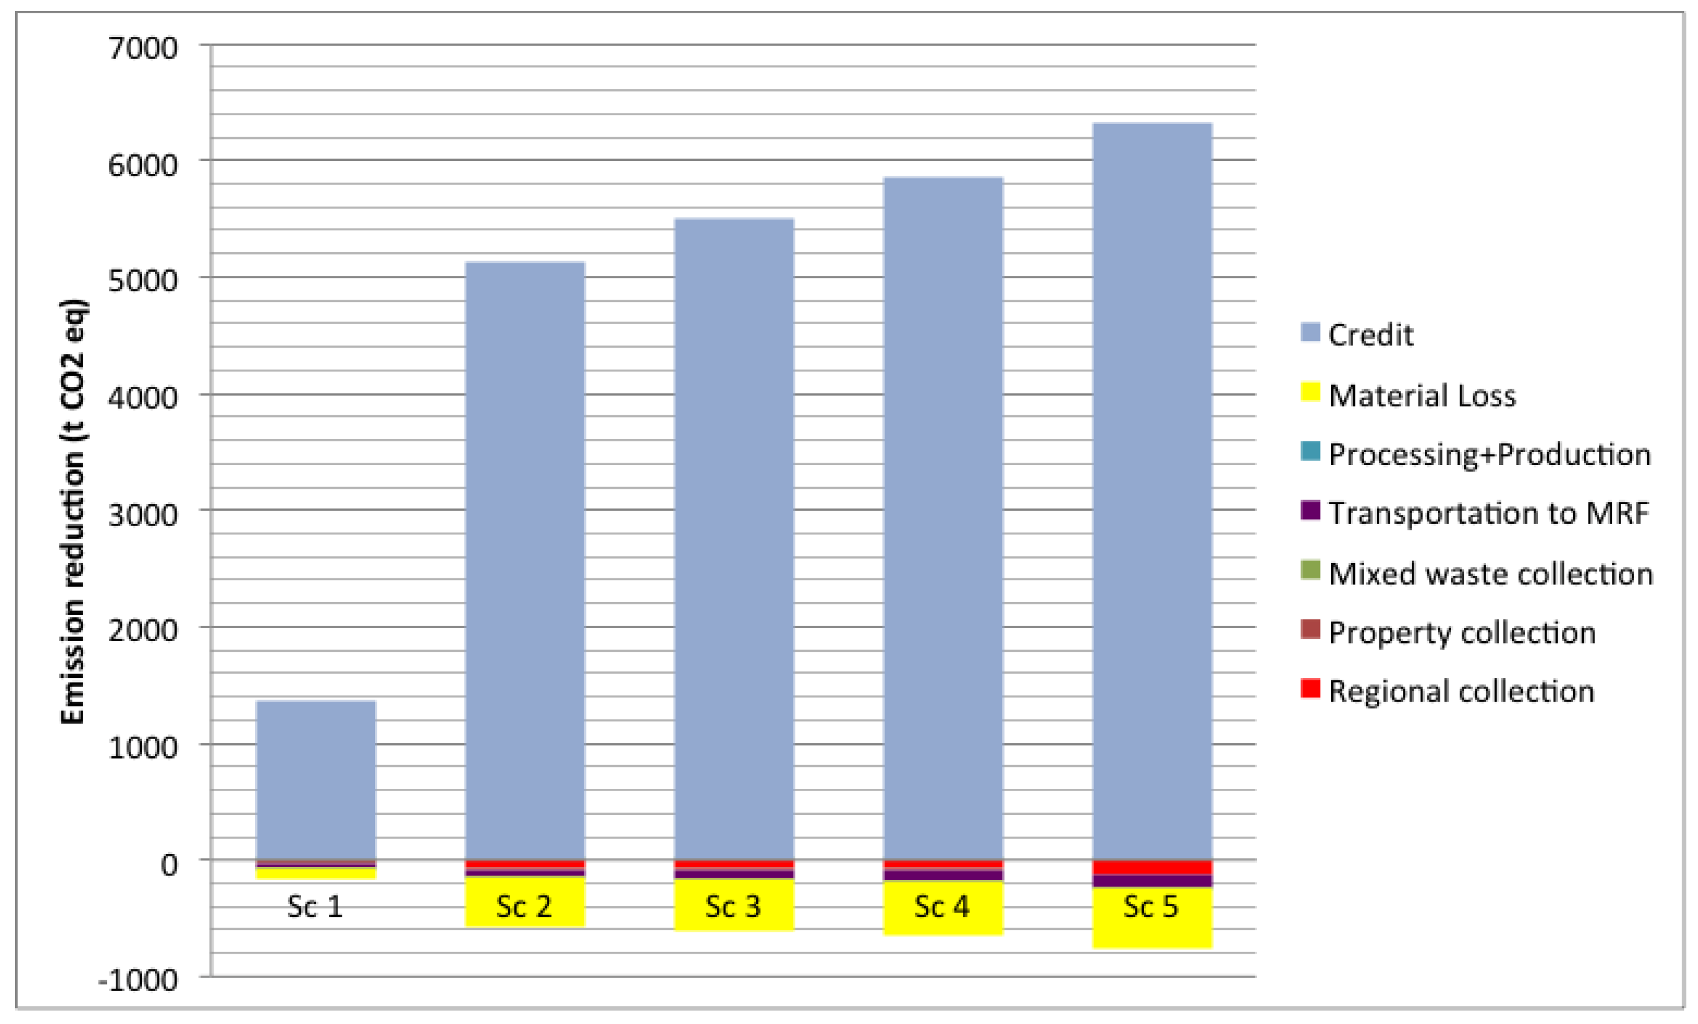
The net GHG emissions reduction potential of different collection scenarios, relative to the benchmark scenario reduction potential, is shown in <xref ref-type="fig" rid="sustainability-04-02586-f003">Figure 3</xref>. The figure shows that the cost of transportation in terms of GHG emissions is small compared to the GHG credit resulting from metal recovery from waste. Material losses in base case mean that the metals are lost in pre-treatment processes. Assumption for material loss in pre-treatment is 1% of the total input, and it is the same for all the metals [<xref ref-type="bibr" rid="B38-sustainability-04-02586">38</xref>]. In reality, the losses can be much higher. The losses in pre-treatment must be replaced with primary production. The effects of these losses are represented as negative values in <xref ref-type="fig" rid="sustainability-04-02586-f003">Figure 3</xref>.</p>
      <fig id="sustainability-04-02586-f003" position="anchor">
        <label>Figure 3</label>
        <caption>
          <p>The net greenhouse gas (GHG) emission reduction of different collection scenarios relative to the benchmark Scenario 0 (MRF=Metal Recovery Facility).</p>
        </caption>
        <graphic xmlns:xlink="http://www.w3.org/1999/xlink" xlink:href="sustainability-04-02586-g003.tif"/>
      </fig>
      <sec>
        <title>Sensitivity Analysis</title>
        <p>Poor availability of real data made several assumptions necessary in this study. The effect of the assumptions regarding transport, material density and filling rate of bins were found not to significantly affect differences in GHG emissions between scenarios.
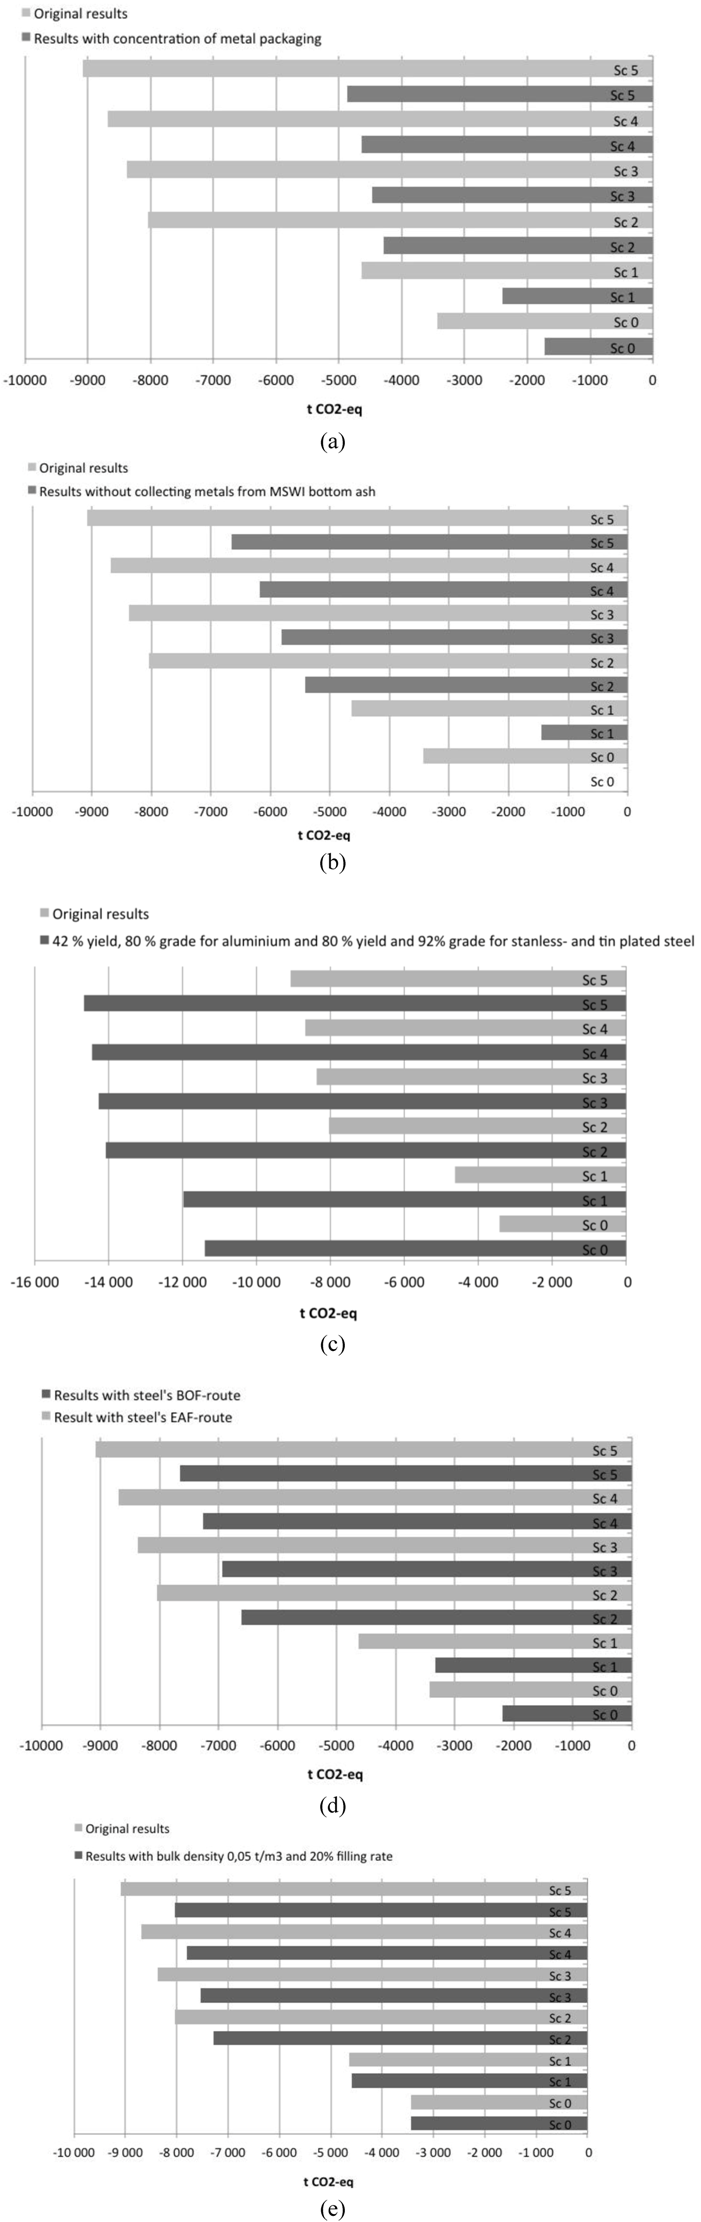
 <xref ref-type="fig" rid="sustainability-04-02586-f004">Figure 4</xref> (a)–(e) depict the GHG reduction potential of the sensitivity analyses compared to original base case analyses.</p>
        <p>The metal fraction of solid household waste in this study was found to be 67%. The sensitivity test showed that the remaining fraction did not contain any metals did not change the ranking order of the scenarios, but reduced the differences substantially (<xref ref-type="fig" rid="sustainability-04-02586-f004">Figure 4</xref>a). As the concentration of metals in the solid household waste falls, the GHG reduction potential decreases.</p>
        <p>The second sensitivity analysis shows to what extent the collection of metals from MSWI bottom ash affects the results. The assumption for this sensitivity analysis is that there is no metal collection from MSWI bottom ash. Comparison of this analysis result to the base case result is shown in <xref ref-type="fig" rid="sustainability-04-02586-f004">Figure 4</xref>b. The result shows that the GHG reduction potential is around 30% lower in property collection scenarios (Scenarios 2–5) and around 70% lower in the regional drop-off collection scenario (Scenario 1) when there is no collection of metals from MSWI bottom ash. The difference between GHG emissions and the original base case results is smaller in property collection scenarios than in the regional collection scenario, where source-separation efficiency is lower and recovery of metals from MSWI bottom ash becomes more important in terms of GHG reduction potential.</p>
        <p>The base case analysis was made with the assumption that the aluminum was not recovered after MSWI process. The significance of this assumption is that the analysis was run with an aluminum scrap grade of 42% and a yield of 80%. With these assumptions, the total recovery rate for aluminum was 34%. The tin-plated and stainless steel scrap was tested with a grade value of 92% and a yield of 80%. The sensitivity analysis result comparison to base case is shown in <xref ref-type="fig" rid="sustainability-04-02586-f004">Figure 4</xref>c. Even with a high recovery of metals from MSWI bottom ash the rank of the scenarios stays the same. The GWP of the sensitivity analysis for incineration Scenario 0 is 23–28% higher than in property collection scenarios (Scenarios 2–5). Even with a 10% margin of error Scenario 5 is more beneficial in terms of GHG reduction potential than Scenario 0. The values used in this test are theoretical and the recovery of aluminum from MSWI bottom ash is much lower than those used in this test [<xref ref-type="bibr" rid="B23-sustainability-04-02586">23</xref>]. Nevertheless, the analysis shows the need to recover metals from MSWI bottom ash.</p>
        <p>
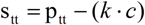
Tin-plate can be utilized by EAF-route or by BOF-route. Main analysis calculations were done with the EAF-route. This sensitivity analysis compared EAF-route (base case) results to BOF-route results (<xref ref-type="fig" rid="sustainability-04-02586-f004">Figure 4</xref>d). In BOF-production, the recycling route’s emissions depend on the recycling rate. In this study, every scenario had its own recycling rate, and consequently, every scenario also had its own emission factor. The emission rates for different scenarios were calculated with Equation 1. </p>
        <disp-formula id="sustainability-04-02586-i001">
<inline-graphic xmlns:xlink="http://www.w3.org/1999/xlink" xlink:href="sustainability-04-02586-i001.tif"/>
<label>(1)</label>
</disp-formula>

        <p>where,</p>
        <p>s<sub>tt </sub>= emission factor of tin-plated steel BOF secondary production route with recycling rate c</p>
        <p>p<sub>tt </sub>= emission factor of tin-plated steel BOF primary production route</p>
        <p>k = emission factor, when GHG reduction potential of steel recycling rate of 1% = 13.7 CO<sub>2</sub>-eq kg/t</p>
        <p>c= recycling rate of tin-plated steel</p>
        <p>The results show (<xref ref-type="fig" rid="sustainability-04-02586-f004">Figure 4</xref>d) that with the BOF-route the GHG reduction potential is 16–18% smaller in property scenarios (Scenarios 2–5) and 35% smaller in Scenario 0 compared to the EAF-route.</p>
        <p><xref ref-type="fig" rid="sustainability-04-02586-f004">Figure 4</xref>e shows the results of one sensitivity analysis made on the effect of bulk density of the metal fraction from property collection. Here, the bulk density of the metal fraction of household waste was changed to 0.05 t/m<sup>3</sup> instead of 0.12 t/m<sup>3</sup> as was found in the original base case analysis. In this analysis, the filling rate is assumed to be as low as 20%. The filling rate expresses how full the bins are when they are collected. Lowering the filling rate to 20% expresses the “worst case scenario” in collection. The results show that the combined effect of filling rate and low bulk density has a small effect on the results. The biggest effect was found on Scenario 5 where the GHG reduction potential was 12% lower than in the base case. The collection emissions were less than 10% of the total secondary production emissions and the assumption was made that the collection was found to have a minor effect on the results.</p>
		<fig id="sustainability-04-02586-f004" position="anchor">
          <label>Figure 4</label>
          <caption>
            <p>(<bold>a</bold>) Effect of metal content estimations on the results on the GHG reduction potential. (<bold>b</bold>) Environmental benefits with and without tin-plated and stainless steel separation from MSWI bottom ash. (<bold>c</bold>) Comparison of base case results to results with high metal recovery from MSWI bottom ash. (<bold>d</bold>) Comparison of BOF-route results to EAF-route results (<bold>e</bold>) Effect of bulk density on the results.</p>
          </caption>
          <graphic xmlns:xlink="http://www.w3.org/1999/xlink" xlink:href="sustainability-04-02586-g004.tif"/>
        </fig>
        
        <p>
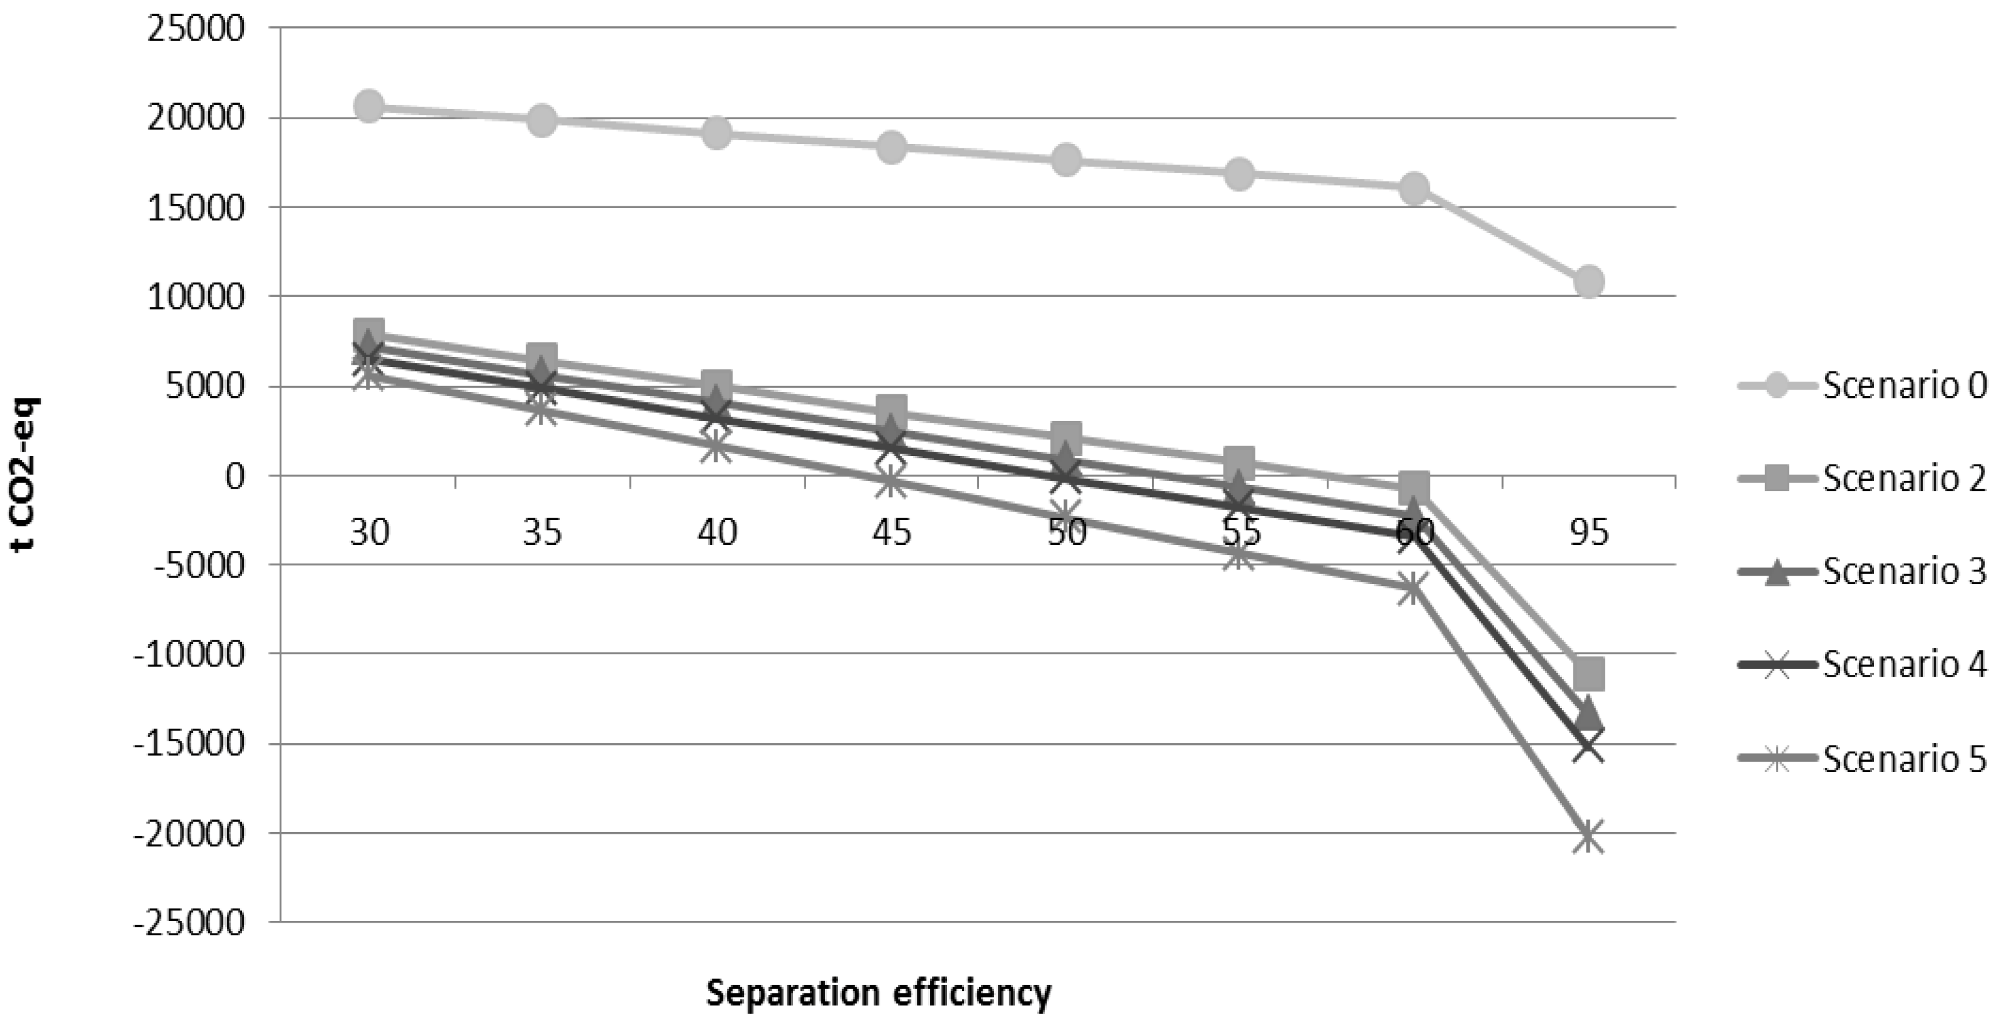
The final sensitivity analysis takes into account the total losses in recycling with different separation efficiencies. Total losses mean all the metals that are lost in waste incineration and in the metal recovery processes. In theory, all the losses in recycling must be replaced with primary production, because the need for metals is considered to be increasing over time. In this analysis, the emissions of the losses were calculated multiplying the total losses and the different primary productions GWP values of all the metals. Separation efficiency in property collection is shown in the x-axis and the incineration’s separation efficiency is assumed to be the same as the separation efficiency in property collection. For example, when the separation efficiency is 30% in property collection, it is assumed to be the same 30% in separation for incineration bottom ash. In this analysis, only steel and stainless steel were recovered.</p>
        <p>The results in <xref ref-type="fig" rid="sustainability-04-02586-f005">Figure 5</xref> show that the total emissions of Scenario 0 do not become negative even with really high separation efficiencies, because the primary production to replace the aluminum losses produces more emissions than the gain of stainless steel and tin-plate recycling. </p>
        <fig id="sustainability-04-02586-f005" position="anchor">
          <label>Figure 5</label>
          <caption>
            <p>The effect of separation efficiencies on total GHG emissions when losses in collection are taken into account.</p>
          </caption>
          <graphic xmlns:xlink="http://www.w3.org/1999/xlink" xlink:href="sustainability-04-02586-g005.tif"/>
        </fig>
        <p>The recycling of the metal fraction of solid household waste causes direct and indirect GHG emissions, mainly due to its energy use and combustion of fossil fuels. The impact of the type of energy plays an important role in terms of GHG emissions and strongly depends on the energy profile and energy use of the produced metal.</p>
      </sec>
    </sec>
    <sec sec-type="conclusions">
      <title>5. Conclusions</title>
      <p>The total GHG emissions of the waste management system in the Helsinki metropolitan area in 2009 was 87 000 t CO<sub>2</sub>-eq [<xref ref-type="bibr" rid="B42-sustainability-04-02586">42</xref>]. The results show that source-sorting and collection at property and regional levels have a substantial impact on GHG emission. Efficient sorting and collection can result in a decrease of GHG emission of nearly 10%.</p>
      <p>The collection systems for recyclables in the various scenarios were defined with respect to the organizational and technical boundaries in the waste management system at hand, and only easily recyclable fractions were considered. It is recommended that municipalities enhance the recycling rate by establishing new collection schemes for the metal fraction of solid household waste. Within the scenarios studied, Scenario 5 provides the highest recycling rate and the highest environmental benefits. Scenarios 2, 3 and 4 were also environmentally beneficial compared to Scenarios 0 and 1. The main distinctions between Scenario 5 and the other scenarios are that waste is collected from the property and not regionally from collection points. In Scenario 0, collection is also done at the property, but without source-separation and all the mixed solid household waste is incinerated. Hence, a combination of collection directly from the properties and source-separation shows the greatest benefit, measured in GHG reduction potential emission.</p>
      <p>Incineration of all waste is not recommended because the recycling rate would decrease due to quality decrease of metals in the MSWI process. This quality decrease leads to the loss of credited GHG emissions from recovered metals and thus to lower environmental benefits for the scheme. The magnitude of changes in environmental impact, resource consumption and costs may be relatively small, but these changes should be compared to the effect of other initiatives within the waste management system before judging their importance. In this study, it is assumed that all aluminum is not recovered after incineration, although a non-negligible amount of metallic aluminum may in practice be recovered from MSWI bottom ash. The purpose of the study presented in this paper is however to investigate the differential impact of various scenarios on the reduction of GHG emission through a collection scheme strategy. Sensitivity analysis shows that recovery of aluminum from MSWI bottom ash does change GHG emission for each scheme, but does not change the relative ranking of scenarios.</p>
      <p>If the decision makers conclude that the alternative collection systems are all acceptable with regard to environmental impact and costs, they would have the opportunity of putting weight on other aspects such as improvement of sorting efficiency and level of service. It is important to note that the results of this work are sensitive to our assumptions regarding the potential utilization of the recycled metals. The calculations were done for pure metal fractions, and the recycling processes were assumed to substitute for virgin production of similar materials. The actual options for recycling and utilization depend strongly on the amount of metal scrap collected and its quality, and it is recommended that these issues be thoroughly assessed in each case. Further economic assessment is also needed in order to determine the economic ranking of these different scenarios.</p>
    </sec>
  </body>
  <back>
    <ack>
      <title>Acknowledgements</title>
      <p>The authors wish to thank all the people that participated in the project and provided the essential data for the study. Financial support from the Helsinki Region Environmental Services is gratefully acknowledged. Author Kuusiola would like to thank Development Engineer Reetta Anderson at Helsinki Region Environmental Services Authority for supervision, guidance and support in this research.</p>
    </ack>
	<notes>
      <title>Conflict of Interest</title>
      <p>The authors declare no conflict of interest. </p>
    </notes>
    <ref-list>
      <title>References and Notes</title>
      <ref id="B1-sustainability-04-02586">
        <label>1.</label>
        <citation citation-type="gov">
		<collab>European Parliament</collab>
          <source>Directive 94/62/EC of the European Parliament and of the Council</source>
          <publisher-name>European Parliament</publisher-name>
          <publisher-loc>Brussels, Belgium</publisher-loc>
          <year>1994</year>
        </citation>
      </ref>
      <ref id="B2-sustainability-04-02586">
        <label>2.</label>
        <citation citation-type="commun">
          <person-group person-group-type="author">
            <name>
              <surname>Koljonen</surname>
              <given-names>S.</given-names>
            </name>
          </person-group>
          <article-title>Logica. Statistics for collection of in household waste collection in Helsinki Metropolitan Area</article-title>
          <source>Personal communication</source>
          <day>19</day>
          <month>September</month>
          <year>2008</year>
        </citation>
      </ref>
      <ref id="B3-sustainability-04-02586">
        <label>3.</label>
        <citation citation-type="web">
          <article-title>Helsinki Region Environmental Services Authority. Instruction for sorting of wastes</article-title>
          <access-date>(accessed on 25 August 2012)</access-date>
          <comment>Available online:<ext-link xmlns:xlink="http://www.w3.org/1999/xlink" xlink:href="http://www.hsy.fi/en/wastemanagement/instructionsandbrochures/sortingofwastes/metal/Pages/default.aspx" ext-link-type="uri">http://www.hsy.fi/en/wastemanagement/instructionsandbrochures/sortingofwastes/metal/Pages/default.aspx</ext-link></comment>
        </citation>
      </ref>
      <ref id="B4-sustainability-04-02586">
        <label>4.</label>
        <citation citation-type="web">
		<collab>Ministry of Justice of Finland</collab>
          <article-title>Waste Act, 1997. Finlex Data Bank</article-title>
          <access-date>(accessed on 30 May 2012)</access-date>
          <comment>Available online:<ext-link xmlns:xlink="http://www.w3.org/1999/xlink" xlink:href="http://www.finlex.fi/en/laki/kaannokset/1993/19931072" ext-link-type="uri">http://www.finlex.fi/en/laki/kaannokset/1993/19931072</ext-link></comment>
        </citation>
      </ref>
      <ref id="B5-sustainability-04-02586">
        <label>5.</label>
        <citation citation-type="web">
          <article-title>Mepak-Recycling LTD. Mepak-Recycling</article-title>
          <access-date>(accessed on 22 February 2011)</access-date>
          <comment>Available online:<ext-link xmlns:xlink="http://www.w3.org/1999/xlink" xlink:href="http://www.mepak.fi/english.htm" ext-link-type="uri">http://www.mepak.fi/english.htm</ext-link></comment>
        </citation>
      </ref>
      <ref id="B6-sustainability-04-02586">
        <label>6.</label>
        <citation citation-type="web">
		<collab>Helsinki Region Environmental Services Authority</collab>
          <article-title>Martti Material Flow accounting online databank</article-title>
          <access-date>(accessed on 10 February 2011)</access-date>
          <comment>Available online:<ext-link xmlns:xlink="http://www.w3.org/1999/xlink" xlink:href="http://81.22.167.14/martti/" ext-link-type="uri">http://81.22.167.14/martti/</ext-link></comment>
        </citation>
      </ref>
      <ref id="B7-sustainability-04-02586">
        <label>7.</label>
        <citation citation-type="web">
		<collab>Helsinki Region Environmental Services Authority</collab>
          <article-title>Pääkaupunkiseudun kotitalouksien sekajätteen määrä ja laatu vuonna 2007 (in Finnish)</article-title>
          <access-date>(accessed on 14 February 2011)</access-date>
          <comment>Available online:<ext-link xmlns:xlink="http://www.w3.org/1999/xlink" xlink:href="http://www.hsy.fi/jatehuolto/documents/Julkaisut/sekajatetutkimus_2007.pdf" ext-link-type="uri">http://www.hsy.fi/jatehuolto/documents/Julkaisut/sekajatetutkimus_2007.pdf</ext-link></comment>
        </citation>
      </ref>
      <ref id="B8-sustainability-04-02586">
        <label>8.</label>
        <citation citation-type="commun">
          <person-group person-group-type="author">
            <name>
              <surname>Talola</surname>
              <given-names>M.</given-names>
            </name>
          </person-group>
          <article-title>Lassila &amp; Tikanoja</article-title>
          <source>Personal communication</source>
          <day>21</day>
          <month>January</month>
          <year>2010</year>
        </citation>
      </ref>
      <ref id="B9-sustainability-04-02586">
        <label>9.</label>
        <citation citation-type="confproc">
          <person-group person-group-type="author">
            <name>
              <surname>Kinnunen</surname>
              <given-names>M.K.</given-names>
            </name>
            <name>
              <surname>Oja</surname>
              <given-names>M.</given-names>
            </name>
            <name>
              <surname>Heiskanen</surname>
              <given-names>K.</given-names>
            </name>
          </person-group>
          <article-title>Recovery of Scrap Metals from MSWI Bottom Ash Using Physical Separation Methods</article-title>
          <source>Proceedings of XXIV International Mineral Processing Congress</source>
          <conf-loc>Beijing, China</conf-loc>
          <conf-date>24–28 September 2008</conf-date>
          <fpage>3565</fpage>
          <lpage>3581</lpage>
        </citation>
      </ref>
      <ref id="B10-sustainability-04-02586">
        <label>10.</label>
        <citation citation-type="journal">
          <person-group person-group-type="author">
            <name>
              <surname>Salmi</surname>
              <given-names>O.</given-names>
            </name>
            <name>
              <surname>Wierink</surname>
              <given-names>M.</given-names>
            </name>
          </person-group>
          <article-title>Effects of waste recovery on carbon footprint: A case study of the Gulf of Bothnia steel and zinc industries</article-title>
          <source>J. Clean. Prod.</source>
          <year>2011</year>
          <volume>19</volume>
          <fpage>1857</fpage>
          <lpage>1864</lpage>
        </citation>
      </ref>
      <ref id="B11-sustainability-04-02586">
        <label>11.</label>
        <citation citation-type="web">
		<collab>WRAP</collab>
          <article-title>Waste &amp; Resources Action Programme, 2006. Environmental Benefits of Recycling—Full Report</article-title>
          <access-date>(accessed on February 10 2012)</access-date>
          <comment>Available online:<ext-link xmlns:xlink="http://www.w3.org/1999/xlink" xlink:href="http://www.wrap.org.uk/downloads/Recycling_LCA_Report_Sept_2006_-_Final.fa1bcd8c.2838.pdf" ext-link-type="uri">http://www.wrap.org.uk/downloads/Recycling_LCA_Report_Sept_2006_-_Final.fa1bcd8c.2838.pdf</ext-link></comment>
        </citation>
      </ref>
      <ref id="B12-sustainability-04-02586">
        <label>12.</label>
        <citation citation-type="journal">
          <person-group person-group-type="author">
            <name>
              <surname>Salhofer</surname>
              <given-names>S.</given-names>
            </name>
            <name>
              <surname>Schneider</surname>
              <given-names>F.</given-names>
            </name>
            <name>
              <surname>Obersteiner</surname>
              <given-names>G.</given-names>
            </name>
          </person-group>
          <article-title>The ecological relevance of transport in waste disposal systems in Western Europe</article-title>
          <source>Waste Manag.</source>
          <year>2007</year>
          <volume>27</volume>
          <fpage>45</fpage>
          <lpage>57</lpage>
        </citation>
      </ref>
      <ref id="B13-sustainability-04-02586">
        <label>13.</label>
        <citation citation-type="journal">
          <person-group person-group-type="author">
            <name>
              <surname>Villanueva</surname>
              <given-names>A.</given-names>
            </name>
            <name>
              <surname>Wenzel</surname>
              <given-names>H.</given-names>
            </name>
          </person-group>
          <article-title>Paper waste—Recycling, incineration or landfilling? A review of existing life cycle assessments</article-title>
          <source>Waste Manag.</source>
          <year>2007</year>
          <volume>27</volume>
          <fpage>29</fpage>
          <lpage>46</lpage>
          <pub-id pub-id-type="doi">10.1016/j.wasman.2007.02.019</pub-id>
        </citation>
      </ref>
      <ref id="B14-sustainability-04-02586">
        <label>14.</label>
        <citation citation-type="journal">
          <person-group person-group-type="author">
            <name>
              <surname>Larsen</surname>
              <given-names>A.W.</given-names>
            </name>
            <name>
              <surname>Merrild</surname>
              <given-names>H.</given-names>
            </name>
            <name>
              <surname>Møller</surname>
              <given-names>J.</given-names>
            </name>
            <name>
              <surname>Christensen</surname>
              <given-names>T.H.</given-names>
            </name>
          </person-group>
          <article-title>Waste collection systems for recyclables: An environmental and economic assessment for the municipality of Aarhus (Denmark)</article-title>
          <source>Waste Manag.</source>
          <year>2010</year>
          <volume>30</volume>
          <fpage>744</fpage>
          <lpage>754</lpage>
          <pub-id pub-id-type="doi">10.1016/j.wasman.2009.10.021</pub-id>
        </citation>
      </ref>
      <ref id="B15-sustainability-04-02586">
        <label>15.</label>
        <citation citation-type="journal">
          <person-group person-group-type="author">
            <name>
              <surname>Dahlén</surname>
              <given-names>L.</given-names>
            </name>
            <name>
              <surname>Vukicevic</surname>
              <given-names>S.</given-names>
            </name>
            <name>
              <surname>Meijer</surname>
              <given-names>J.-E.</given-names>
            </name>
            <name>
              <surname>Lagerkvist</surname>
              <given-names>A.</given-names>
            </name>
          </person-group>
          <article-title>Comparison of collection systems for sorted household waste in Sweden</article-title>
          <source>Waste Manag.</source>
          <year>2007</year>
          <volume>27</volume>
          <fpage>1298</fpage>
          <lpage>1305</lpage>
          <pub-id pub-id-type="doi">10.1016/j.wasman.2006.06.016</pub-id>
        </citation>
      </ref>
      <ref id="B16-sustainability-04-02586">
        <label>16.</label>
        <citation citation-type="journal">
          <person-group person-group-type="author">
            <name>
              <surname>Tanskanen</surname>
              <given-names>J.-H.</given-names>
            </name>
            <name>
              <surname>Kaila</surname>
              <given-names>J.</given-names>
            </name>
          </person-group>
          <article-title>Comparison of methods used in the collection of source-separated household waste</article-title>
          <source>Waste Manag. Res.</source>
          <year>2001</year>
          <volume>19</volume>
          <fpage>486</fpage>
          <lpage>497</lpage>
          <pub-id pub-id-type="doi">10.1177/0734242X0101900604</pub-id>
        </citation>
      </ref>
      <ref id="B17-sustainability-04-02586">
        <label>17.</label>
        <citation citation-type="thesis">
          <person-group person-group-type="author">
            <name>
              <surname>Kuusiola</surname>
              <given-names>T.</given-names>
            </name>
          </person-group>
          <article-title>Environmental effects of collecting and utilizing small household metals in Helsinki Metropolitan Area (in Finnish)</article-title>
          <source>Master’s Thesis</source>
          <publisher-name>Aalto University of Science and Technology</publisher-name>
          <publisher-loc>Espoo, Finland</publisher-loc>
          <year>2010</year>
        </citation>
      </ref>
      <ref id="B18-sustainability-04-02586">
        <label>18.</label>
        <citation citation-type="web">
          <person-group person-group-type="author">
            <name>
              <surname>Vares</surname>
              <given-names>S.</given-names>
            </name>
            <name>
              <surname>Lehtinen</surname>
              <given-names>J.</given-names>
            </name>
          </person-group>
          <article-title><italic>Pienmetallikeräyksen Tehostaminen</italic> (in Finnish); VTT tutkimusraportti Nro VTT-R-06362-07</article-title>
          <publisher-name>VTT</publisher-name>
          <publisher-loc>Helsinki, Finland</publisher-loc>
          <year>2007</year>
          <access-date>(accessed on 28 February 2011)</access-date>
          <comment>Available online:<ext-link xmlns:xlink="http://www.w3.org/1999/xlink" xlink:href="http://www.mepak.fi/images/VTT_R_06362_07%20_3_.pdf" ext-link-type="uri">http://www.mepak.fi/images/VTT_R_06362_07%20_3_.pdf</ext-link></comment>
        </citation>
      </ref>
      <ref id="B19-sustainability-04-02586">
        <label>19.</label>
        <citation citation-type="web">
          <person-group person-group-type="author">
            <name>
              <surname>Kaila</surname>
              <given-names>J.</given-names>
            </name>
          </person-group>
          <article-title>Yhdyskuntajätteen määrä ja laatututkimukset Suomessa (in Finnish). St. Petersburg City Twinning Programme</article-title>
          <access-date>(accessed on 30 May 2012)</access-date>
          <comment>Available online:<ext-link xmlns:xlink="http://www.w3.org/1999/xlink" xlink:href="http://www3.turku.fi/ctw/waste_reasearch_kaila.pdf" ext-link-type="uri">http://www3.turku.fi/ctw/waste_reasearch_kaila.pdf</ext-link></comment>
        </citation>
      </ref>
      <ref id="B20-sustainability-04-02586">
        <label>20.</label>
        <citation citation-type="confproc">
          <person-group person-group-type="author">
            <name>
              <surname>Kaila</surname>
              <given-names>J.</given-names>
            </name>
          </person-group>
          <article-title>Service Quality Factors in Waste Collection with Increased Source Segregation and Producer Responsibility</article-title>
          <source>Proceedings of the 7th ISWA International Congress</source>
          <conf-loc>Yokohama, Japan</conf-loc>
          <conf-date>27 October–1 November 1996</conf-date>
          <fpage>188</fpage>
          <lpage>189</lpage>
        </citation>
      </ref>
      <ref id="B21-sustainability-04-02586">
        <label>21.</label>
        <citation citation-type="web">
		<collab>IPCC</collab>
          <article-title>Intergovernmental Panel on Climate Change, 2007</article-title>
          <access-date>(accessed on 30 May 2012)</access-date>
          <comment>Available online:<ext-link xmlns:xlink="http://www.w3.org/1999/xlink" xlink:href="http://www.ipcc.ch/publications_and_data/publications_ipcc_fourth_assessment_report_synthesis_report.htm" ext-link-type="uri">http://www.ipcc.ch/publications_and_data/publications_ipcc_fourth_assessment_report_synthesis_report.htm</ext-link></comment>
        </citation>
      </ref>
      <ref id="B22-sustainability-04-02586">
        <label>22.</label>
        <citation citation-type="journal">
          <person-group person-group-type="author">
            <name>
              <surname>Ekvall</surname>
              <given-names>T.</given-names>
            </name>
            <name>
              <surname>Weidema</surname>
              <given-names>B.P.</given-names>
            </name>
          </person-group>
          <article-title>System boundaries and input data in consequential Life Cycle Inventory Analysis</article-title>
          <source>Int. J. LCA</source>
          <year>2004</year>
          <volume>9</volume>
          <fpage>161</fpage>
          <lpage>171</lpage>
          <pub-id pub-id-type="doi">10.1007/BF02994190</pub-id>
        </citation>
      </ref>
      <ref id="B23-sustainability-04-02586">
        <label>23.</label>
        <citation citation-type="commun">
		<collab>World Steel Association</collab>
          <article-title>LCI-data for hot-rolled steel strip 2009</article-title>
          <source>Personal communication</source>
          <day>8</day>
          <month>April</month>
          <year>2010</year>
        </citation>
      </ref>
      <ref id="B24-sustainability-04-02586">
        <label>24.</label>
        <citation citation-type="gov">
		<collab>Athena Sustainable Materials Institute</collab>
          <source>A Cradle-to-Gate Life Cycle Inventory: Canadian and U.S. Steel Production by Mill Type</source>
          <publisher-name>Athena Sustainable Materials Institute</publisher-name>
          <publisher-loc>Ottawa, Ontario, Canada</publisher-loc>
          <year>2002</year>
        </citation>
      </ref>
      <ref id="B25-sustainability-04-02586">
        <label>25.</label>
        <citation citation-type="commun">
          <person-group person-group-type="author">
            <name>
              <surname>Kaplin</surname>
              <given-names>C.</given-names>
            </name>
          </person-group>
          <article-title>The European Steel Association EUROFER. Outokumpu Group, LCA-data for stainless steel scrap value 2009</article-title>
          <source>Personal communication</source>
          <day>15</day>
          <month>March</month>
          <year>2010</year>
        </citation>
      </ref>
      <ref id="B26-sustainability-04-02586">
        <label>26.</label>
        <citation citation-type="gov">
		<collab>European Aluminium Association (EAA)</collab>
          <source>Environmental Profile Report for the European Aluminium Industry, Life Cycle Inventory Data for Aluminium Production and Transformation Processes in Europe</source>
          <publisher-name>European Aluminium Association</publisher-name>
          <publisher-loc>Brussels, Belgium</publisher-loc>
          <year>2008</year>
        </citation>
      </ref>
      <ref id="B27-sustainability-04-02586">
        <label>27.</label>
        <citation citation-type="journal">
          <person-group person-group-type="author">
            <name>
              <surname>Rem</surname>
              <given-names>P.C.</given-names>
            </name>
            <name>
              <surname>De Vries</surname>
              <given-names>D.</given-names>
            </name>
            <name>
              <surname>van Kooy</surname>
              <given-names>L.A.</given-names>
            </name>
            <name>
              <surname>Bevilacqua</surname>
              <given-names>P.</given-names>
            </name>
            <name>
              <surname>Reuter</surname>
              <given-names>M.A.</given-names>
            </name>
          </person-group>
          <article-title>Amsterdam pilot on bottom ash</article-title>
          <source>Miner. Eng.</source>
          <year>2004</year>
          <volume>9</volume>
          <fpage>363</fpage>
          <lpage>365</lpage>
        </citation>
      </ref>
      <ref id="B28-sustainability-04-02586">
        <label>28.</label>
        <citation citation-type="commun">
          <person-group person-group-type="author">
            <name>
              <surname>Riste</surname>
              <given-names>H.</given-names>
            </name>
          </person-group>
          <article-title>Lassila &amp; Tikanoja. 2006. Mepak-project 06/06</article-title>
          <source>Personal communication</source>
          <day>28</day>
          <month>January</month>
          <year>2010</year>
        </citation>
      </ref>
      <ref id="B29-sustainability-04-02586">
        <label>29.</label>
        <citation citation-type="book">
          <person-group person-group-type="author">
            <name>
              <surname>Buró</surname>
              <given-names>B.</given-names>
            </name>
            <name>
              <surname>Holappa</surname>
              <given-names>L.</given-names>
            </name>
          </person-group>
          <source>Effect of Metallic and Non-Metallic Impurities of Charge Materials on the Quality of Reinforcing Bar Produced in EAF</source>
          <publisher-name>Helsinki University of Technology Publications in Materials Science and Metallurgy</publisher-name>
          <publisher-loc>Espoo, Finland</publisher-loc>
          <year>2005</year>
        </citation>
      </ref>
      <ref id="B30-sustainability-04-02586">
        <label>30.</label>
        <citation citation-type="commun">
          <person-group person-group-type="author">
            <name>
              <surname>Mäntynen</surname>
              <given-names>M.</given-names>
            </name>
          </person-group>
          <article-title>Helsinki Region Environmental Services Authority. Renewal of regional collection points (in Finnish). Project plan 17 August 2007</article-title>
          <source>Personal communication</source>
        </citation>
      </ref>
      <ref id="B31-sustainability-04-02586">
        <label>31.</label>
        <citation citation-type="commun">
          <person-group person-group-type="author">
            <name>
              <surname>Virtanen</surname>
              <given-names>T.</given-names>
            </name>
          </person-group>
          <article-title>Kuusakoski Oy</article-title>
          <source>Personal communication</source>
          <day>18</day>
          <month>January</month>
          <year>2009</year>
        </citation>
      </ref>
      <ref id="B32-sustainability-04-02586">
        <label>32.</label>
        <citation citation-type="commun">
          <person-group person-group-type="author">
            <name>
              <surname>Nuutinen</surname>
              <given-names>J.</given-names>
            </name>
            <name>
              <surname>Talvio</surname>
              <given-names>J.</given-names>
            </name>
          </person-group>
          <article-title>Helsinki Region Environmental Services, HSY Waste Management</article-title>
          <source>Personal communication</source>
          <day>21</day>
          <month>December</month>
          <year>2009</year>
        </citation>
      </ref>
      <ref id="B33-sustainability-04-02586">
        <label>33.</label>
        <citation citation-type="web">
		<collab>LIPASTO</collab>
          <article-title>Web-based calculation system for traffic exhaust emissions and energy consumption, Technical Research Centre of Finland</article-title>
          <access-date>(accessed on 3 February 2009)</access-date>
          <comment>Available online:<ext-link xmlns:xlink="http://www.w3.org/1999/xlink" xlink:href="http://lipasto.vtt.fi/indexe.htm" ext-link-type="uri">http://lipasto.vtt.fi/indexe.htm</ext-link></comment>
        </citation>
      </ref>
      <ref id="B34-sustainability-04-02586">
        <label>34.</label>
        <citation citation-type="web">
		<collab>LIPASTO</collab>
          <article-title>Methodology for unit emissions of freight road traffic. Technical Research Centre of Finland</article-title>
          <access-date>(accessed on 15 August 2012)</access-date>
          <comment>Available online:<ext-link xmlns:xlink="http://www.w3.org/1999/xlink" xlink:href="http://lipasto.vtt.fi/yksikkopaastot/tavaraliikennee/tieliikennee/maaritysperusteet_tavara_tiee.htm" ext-link-type="uri">http://lipasto.vtt.fi/yksikkopaastot/tavaraliikennee/tieliikennee/maaritysperusteet_tavara_tiee.htm</ext-link></comment>
        </citation>
      </ref>
      <ref id="B35-sustainability-04-02586">
        <label>35.</label>
        <citation citation-type="journal">
          <person-group person-group-type="author">
            <name>
              <surname>López-Delgado</surname>
              <given-names>A.</given-names>
            </name>
            <name>
              <surname>Peña</surname>
              <given-names>C.</given-names>
            </name>
            <name>
              <surname>López</surname>
              <given-names>V.</given-names>
            </name>
            <name>
              <surname>López</surname>
              <given-names>F.A.</given-names>
            </name>
          </person-group>
          <article-title>Quality of ferrous scrap from MSW incinerators: A case study of Spain</article-title>
          <source>Resour. Conservat. Recycl.</source>
          <year>2003</year>
          <volume>40</volume>
          <fpage>39</fpage>
          <lpage>51</lpage>
          <pub-id pub-id-type="doi">10.1016/S0921-3449(03)00024-7</pub-id>
        </citation>
      </ref>
      <ref id="B36-sustainability-04-02586">
        <label>36.</label>
        <citation citation-type="commun">
          <person-group person-group-type="author">
            <name>
              <surname>Kaplin</surname>
              <given-names>C.</given-names>
            </name>
          </person-group>
          <article-title>ISSF Outokumpu</article-title>
          <source>Personal communication</source>
          <day>15</day>
          <month>March</month>
          <year>2010</year>
        </citation>
      </ref>
      <ref id="B37-sustainability-04-02586">
        <label>37.</label>
        <citation citation-type="commun">
          <person-group person-group-type="author">
            <name>
              <surname>Kaplin</surname>
              <given-names>C.</given-names>
            </name>
          </person-group>
          <article-title>ISSF Outokumpu</article-title>
          <source>Personal communication</source>
          <day>17</day>
          <month>March</month>
          <year>2010</year>
        </citation>
      </ref>
      <ref id="B38-sustainability-04-02586">
        <label>38.</label>
        <citation citation-type="commun">
          <person-group person-group-type="author">
            <name>
              <surname>Hiironen</surname>
              <given-names>M.</given-names>
            </name>
          </person-group>
          <article-title>Kuusakoski Oy</article-title>
          <source>Personal communication</source>
          <day>31</day>
          <month>March</month>
          <year>2010</year>
        </citation>
      </ref>
      <ref id="B39-sustainability-04-02586">
        <label>39.</label>
        <citation citation-type="web">
          <person-group person-group-type="author">
            <name>
              <surname>Smith</surname>
              <given-names>A.</given-names>
            </name>
            <name>
              <surname>Brown</surname>
              <given-names>K.</given-names>
            </name>
            <name>
              <surname>Ogilvie</surname>
              <given-names>S.</given-names>
            </name>
            <name>
              <surname>Rushton</surname>
              <given-names>K.</given-names>
            </name>
            <name>
              <surname>Bates</surname>
              <given-names>J.</given-names>
            </name>
          </person-group>
          <article-title>Waste Management Options and Climate Change, 2001</article-title>
          <access-date>(accessed on 20 June 2010)</access-date>
          <comment>Available online:<ext-link xmlns:xlink="http://www.w3.org/1999/xlink" xlink:href="http://ec.europa.eu/environment/waste/studies/pdf/climate_change.pdf" ext-link-type="uri">http://ec.europa.eu/environment/waste/studies/pdf/climate_change.pdf</ext-link></comment>
        </citation>
      </ref>
      <ref id="B40-sustainability-04-02586">
        <label>40.</label>
        <citation citation-type="journal">
          <person-group person-group-type="author">
            <name>
              <surname>Dreyer</surname>
              <given-names>L.C.</given-names>
            </name>
            <name>
              <surname>Niemann</surname>
              <given-names>A.L.</given-names>
            </name>
            <name>
              <surname>Hauschild</surname>
              <given-names>M.Z.</given-names>
            </name>
          </person-group>
          <article-title>Comparison of three different LCIA methods: EDIP97, CML2001 and Eco-Indicator 99. Does it matter which one you choose?</article-title>
          <source>Int. J. LCA</source>
          <year>2003</year>
          <volume>8</volume>
          <fpage>191</fpage>
          <lpage>200</lpage>
          <pub-id pub-id-type="doi">10.1007/BF02978471</pub-id>
        </citation>
      </ref>
      <ref id="B41-sustainability-04-02586">
        <label>41.</label>
        <citation citation-type="thesis">
          <person-group person-group-type="author">
            <name>
              <surname>Merrild</surname>
              <given-names>H.</given-names>
            </name>
          </person-group>
          <article-title>Indicators for waste management: How representative is global warming as an indicator for environmental performance of waste management?</article-title>
          <source>PhD Thesis</source>
          <publisher-name>Technical University of Denmark</publisher-name>
          <year>2009</year>
        </citation>
      </ref>
      <ref id="B42-sustainability-04-02586">
        <label>42.</label>
        <citation citation-type="web">
		<collab>Helsinki Region Environmental Services Authority</collab>
          <article-title><italic>Helsinki Metropolitan Area Climate Report 2009</italic> (in Finnish)</article-title>
          <publisher-name>Helsinki Region Environmental Services Authority</publisher-name>
          <publisher-loc>Helsinki, Finland</publisher-loc>
          <year>2010</year>
          <access-date>(accessed on 25 February 2010)</access-date>
          <comment>Available online:<ext-link xmlns:xlink="http://www.w3.org/1999/xlink" xlink:href="http://www.hsy.fi/tietoahsy/Documents/Julkaisut/4_2010_paakaupunkiseudun_ilmastoraportti_web.pdf" ext-link-type="uri">http://www.hsy.fi/tietoahsy/Documents/Julkaisut/4_2010_paakaupunkiseudun_ilmastoraportti_web.pdf</ext-link></comment>
        </citation>
      </ref>
    </ref-list>
  </back>
</article>
