An Edible Energy Return on Investment (EEROI) Analysis of Wheat and Rice in Pakistan


Abstract
:1. Introduction
1.1. Agricultural Inputs in Pakistan
1.2. Study Background and Basis
1.3. Energy Return on Investment Review
2. Methodology
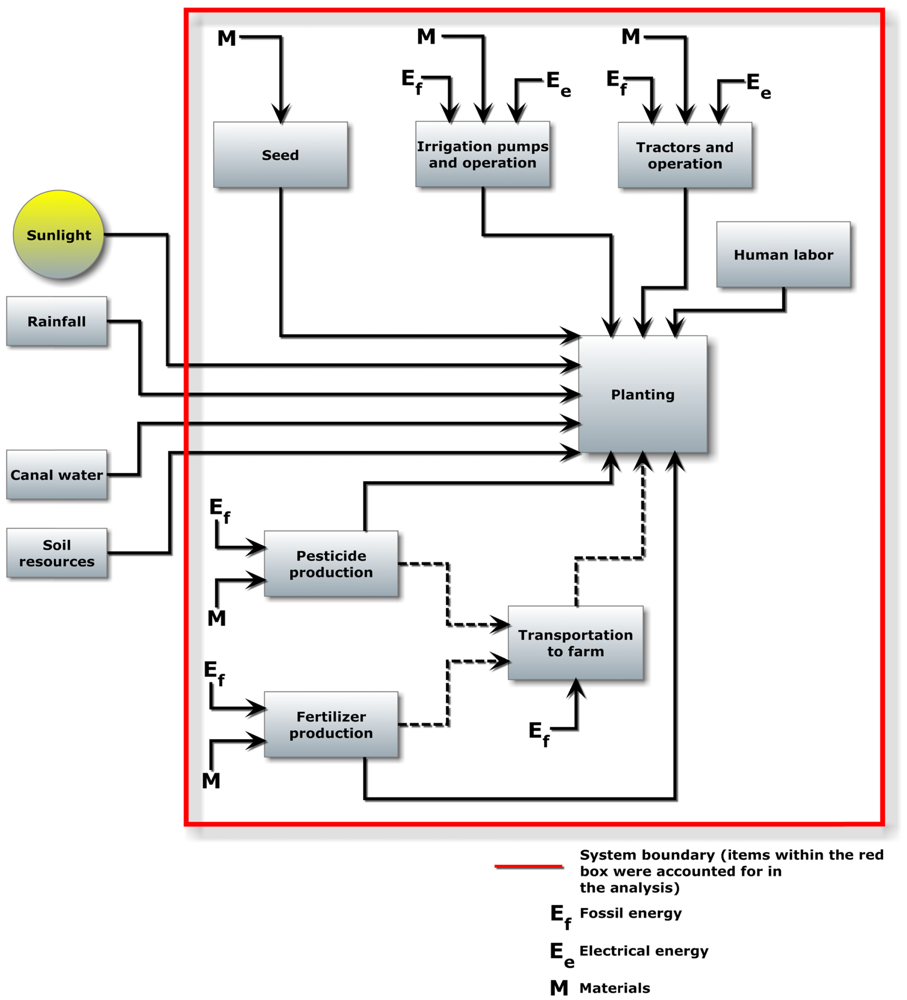
2.1. System Boundaries
2.2. Determining Energy Values
2.2.1. Seed Input
2.2.2. Fertilizer Input
2.2.3. Pesticide Input
2.2.4. Labor Input
2.2.5. Tractor Diesel Input
2.2.6. Tractors Embodied Energy Input
2.2.7. Tube Well Diesel and Electricity Input
2.2.8. Tube Well Embodied Energy Input
2.2.9. Transport
2.3. Consolidated Energy Inputs
2.4. Quantifying the Energy Output (Crop Production)
2.5. Energy Return on Investment Calculations
2.6. Regression Analysis
3. Results
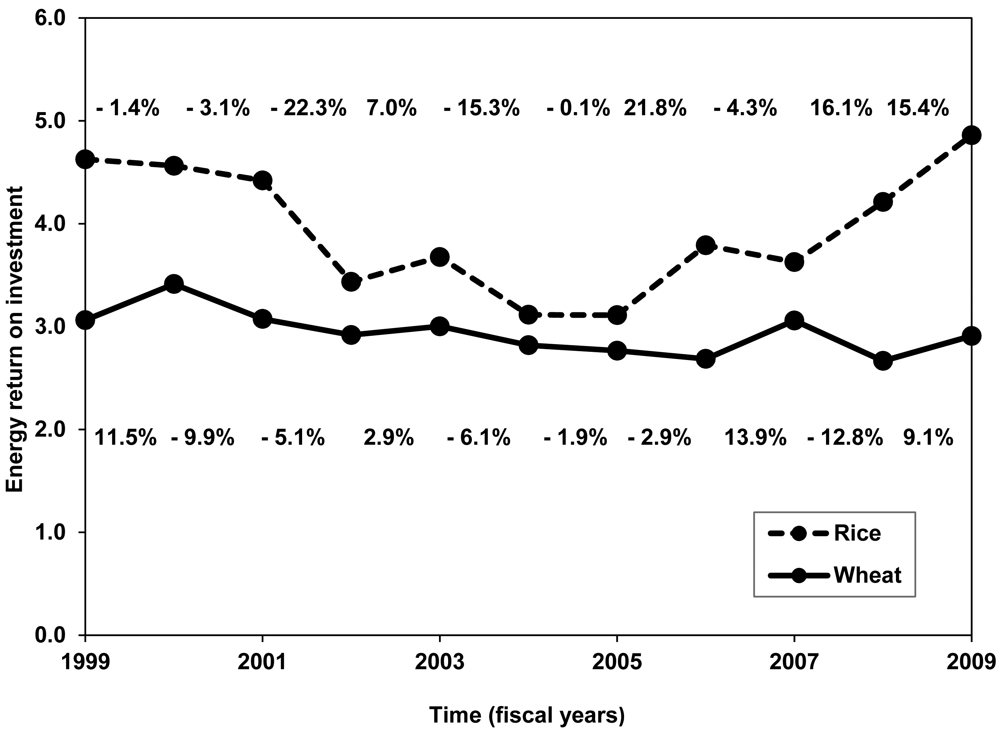
3.1. Energy Return on Investment
3.2. Crop Output
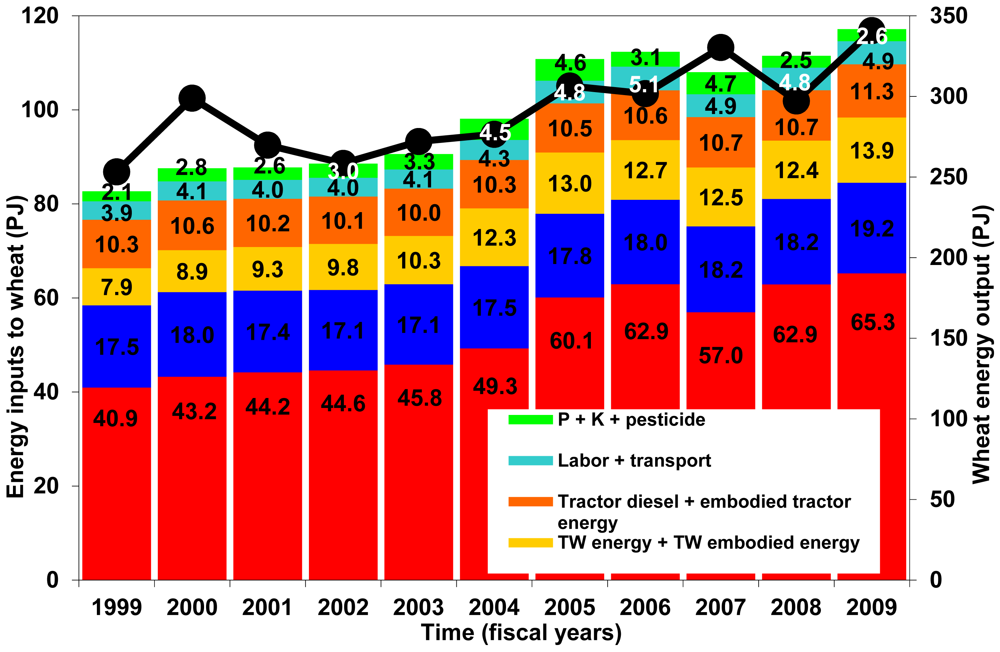
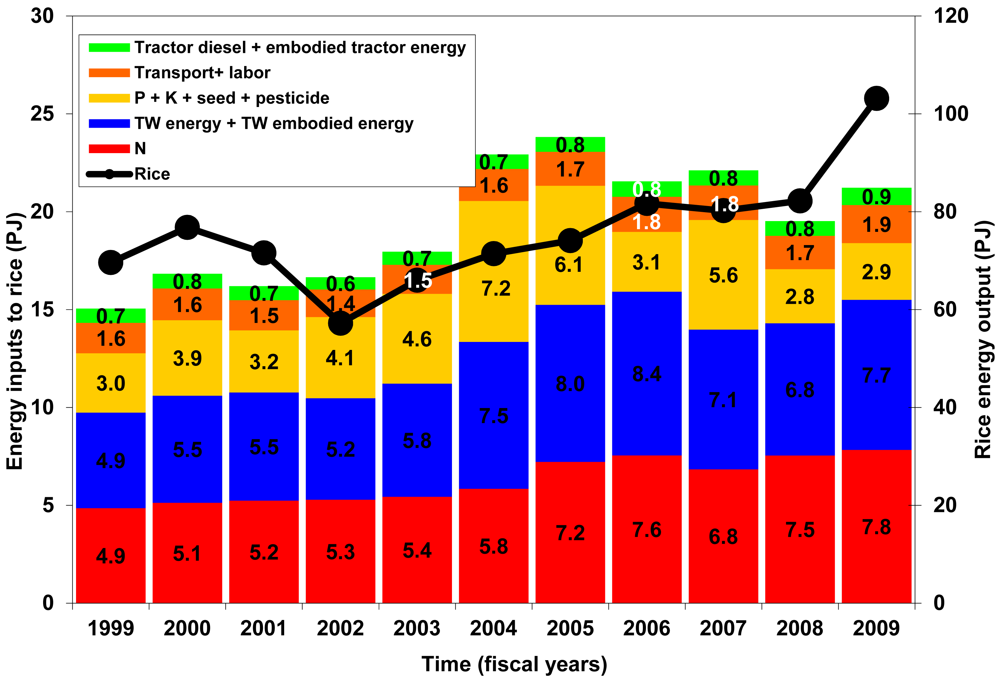
3.3. Crop Input
3.3.1. Individual Inputs
3.4. Per-Hectare Results
4. Discussion
5. Conclusion


| Year | Agricultural growth (%) | Major crops (%) * | Minor crops (%) ** |
|---|---|---|---|
| 2001 | −2.2 | −9.9 | −3.2 |
| 2002 | −0.1 | −2.5 | −3.7 |
| 2003 | 4.1 | 6.8 | 1.9 |
| 2004 | 2.4 | 1.7 | 3.9 |
| 2005 | 6.5 | 17.1 | 1.5 |
| 2006 | 6.3 | −3.9 | 0.4 |
| 2007 | 4.1 | 7.7 | −1.0 |
| 2008 | 1.0 | −6.4 | 10.9 |
| 2009 | 4.0 | 7.3 | −1.7 |
| 2010 (provisional) | 2.0 | −0.2 | −1.2 |
| FY * | Wheat area (million ha) | Rice area (million ha) | |||||
|---|---|---|---|---|---|---|---|
| HYV | Others | Total | Basmati | Irri | Others | Total | |
| 1999 | 7.7 | 0.5 | 8.2 | 1.2 | 1.0 | 0.2 | 2.4 |
| 2000 | 8.1 | 0.3 | 8.5 | 1.3 | 1.0 | 0.2 | 2.5 |
| 2001 | 7.9 | 0.3 | 8.2 | 1.2 | 0.9 | 0.3 | 2.4 |
| 2002 | 7.8 | 0.3 | 8.1 | 1.3 | 0.7 | 0.1 | 2.1 |
| 2003 | 7.8 | 0.2 | 8.0 | 1.4 | 0.7 | 0.1 | 2.2 |
| 2004 | 8.0 | 0.2 | 8.2 | 1.5 | 0.7 | 0.2 | 2.5 |
| 2005 | 8.2 | 0.2 | 8.4 | 1.6 | 0.7 | 0.3 | 2.5 |
| 2006 | 8.2 | 0.2 | 8.4 | 1.7 | 0.8 | 0.2 | 2.6 |
| 2007 | 8.3 | 0.3 | 8.6 | 1.6 | 0.8 | 0.2 | 2.6 |
| 2008 | 8.3 | 0.3 | 8.5 | 1.5 | 0.7 | 0.3 | 2.5 |
| 2009 | 8.8 | 0.3 | 9.0 | 1.7 | 0.9 | 0.4 | 3.0 |
| 1 | 2 | 3 | 4 | 5 | 6 | 7 | 8 | 9 | 10 | 11 | 12 | ||
|---|---|---|---|---|---|---|---|---|---|---|---|---|---|
| FY | Electric.pumps (000) | Diesel pumps (000) | Total pumps (000) | Total rabi GW (MAF) | GW per pump (MAF) | Wheat's total water req. (MAF) | % that is from GW sources | Wheat req. fulfilled from GW sources (MAF) | No. of pumps req. to pump this (C9) (000) | Electric pumps (000) | Diesel pumps (000) | ||
| 1999 | 117.4 | 445.8 | 563.2 | 25.6 | <0.1 | 22.4 | of which | 45.3 | 10.1 | 222.6 | of which | 46.4 | 176.2 |
| 2000 | 112.4 | 497.4 | 609.8 | 25.0 | <0.1 | 23.4 | 44.3 | 10.4 | 252.8 | 46.6 | 206.2 | ||
| 2001 | 113.7 | 545.5 | 659.3 | 25.4 | <0.1 | 22.8 | 44.6 | 10.2 | 263.7 | 45.5 | 218.2 | ||
| 2002 | 116.8 | 590.4 | 707.3 | 25.3 | <0.1 | 22.8 | 44.4 | 10.1 | 282.7 | 46.7 | 236.0 | ||
| 2003 | 120.6 | 648.4 | 769.0 | 25.3 | <0.1 | 22.7 | 44.3 | 10.1 | 306.1 | 48.0 | 258.1 | ||
| 2004 | 132.0 | 818.2 | 950.1 | 25.3 | <0.1 | 23.1 | 44.2 | 10.2 | 384.3 | 53.4 | 330.9 | ||
| 2005 | 137.0 | 847.3 | 984.3 | 25.3 | <0.1 | 23.4 | 43.9 | 10.3 | 400.9 | 55.8 | 345.1 | ||
| 2006 | 143.7 | 855.9 | 999.6 | 25.7 | <0.1 | 23.8 | 43.0 | 10.2 | 398.2 | 57.2 | 341.0 | ||
| 2007 | 116.7 | 814.6 | 931.3 | 25.7 | <0.1 | 23.8 | 46.2 | 11.0 | 398.8 | 50.0 | 348.9 | ||
| 2008 | 120.8 | 800.3 | 921.1 | 25.5 | <0.1 | 23.9 | 44.8 | 10.7 | 387.2 | 50.8 | 336.4 | ||
| 2009 | 120.8 | 800.4 | 921.2 | 24.8 | <0.1 | 25.4 | 45.9 | 11.6 | 432.7 | 56.7 | 375.9 | ||
| 1 | 2 | 3 | 4 | 5 | 6 | 7 | 8 | 9 | 10 | 11 | 12 | ||
|---|---|---|---|---|---|---|---|---|---|---|---|---|---|
| FY | Elect.pumps (000) | Diesel pumps (000) | Total pumps (000) | Total kharif GW (MAF) | GW per pump (MAF) | Rice's total water req. (MAF) | % that is from GW sources | Rice req. fulfilled from GW sources (MAF) | No. of pumps req. to pump this (C9) (000) | Electric. pumps (000) | Diesel pumps (000) | ||
| 1999 | 117.4 | 445.8 | 563.2 | 25.5 | <0.1 | 18.9 | of which | 33.0 | 6.2 | 137.6 | of which | 28.7 | 108.9 |
| 2000 | 112.4 | 497.4 | 609.8 | 24.9 | <0.1 | 19.6 | 32.4 | 6.3 | 155.2 | 28.6 | 126.6 | ||
| 2001 | 113.7 | 545.5 | 659.3 | 25.1 | <0.1 | 18.5 | 32.3 | 6.0 | 157.0 | 27.1 | 129.9 | ||
| 2002 | 116.8 | 590.4 | 707.3 | 25.0 | <0.1 | 16.5 | 32.2 | 5.3 | 150.0 | 24.8 | 125.2 | ||
| 2003 | 120.6 | 648.4 | 769.0 | 24.8 | <0.1 | 17.3 | 32.0 | 5.5 | 171.9 | 27.0 | 145.0 | ||
| 2004 | 132.0 | 818.2 | 950.1 | 24.8 | <0.1 | 19.2 | 31.9 | 6.1 | 234.4 | 32.6 | 201.8 | ||
| 2005 | 137.0 | 847.3 | 984.3 | 24.8 | <0.1 | 19.6 | 31.7 | 6.2 | 246.9 | 34.4 | 212.5 | ||
| 2006 | 143.7 | 855.9 | 999.6 | 24.7 | <0.1 | 20.4 | 31.8 | 6.5 | 262.7 | 37.8 | 224.9 | ||
| 2007 | 116.7 | 814.6 | 931.3 | 24.7 | <0.1 | 20.1 | 30.0 | 6.0 | 227.4 | 28.5 | 198.9 | ||
| 2008 | 120.8 | 800.3 | 921.1 | 24.5 | <0.1 | 19.6 | 28.6 | 5.6 | 210.7 | 27.6 | 183.1 | ||
| 2009 | 120.8 | 800.4 | 921.2 | 23.9 | <0.1 | 23.1 | 26.9 | 6.2 | 239.0 | 31.3 | 207.7 | ||
| FY | Kharif season | Rabi season | ||||
|---|---|---|---|---|---|---|
| GW (MAF) | SW + GW (MAF) | GW % of (SW + GW) (MAF) | GW (MAF) | SW + GW (MAF) | GW % of (SW + GW) (MAF) | |
| 1999 | 25.5 | 77.2 | 33.0 | 25.6 | 56.6 | 45.3 |
| 2000 | 24.9 | 76.9 | 32.4 | 25.0 | 56.4 | 44.3 |
| 2001 | 25.1 | 77.7 | 32.3 | 25.4 | 57.1 | 44.6 |
| 2002 | 25.0 | 77.6 | 32.2 | 25.3 | 57.1 | 44.4 |
| 2003 | 24.8 | 77.5 | 32.0 | 25.3 | 57.0 | 44.3 |
| 2004 | 24.8 | 77.6 | 31.9 | 25.3 | 57.2 | 44.2 |
| 2005 | 24.8 | 78.2 | 31.7 | 25.3 | 57.5 | 43.9 |
| 2006 | 24.7 | 77.6 | 31.8 | 25.7 | 59.7 | 43.0 |
| 2007 | 24.7 | 82.3 | 30.0 | 25.7 | 55.5 | 46.2 |
| 2008 | 24.5 | 85.6 | 28.6 | 25.5 | 56.9 | 44.8 |
| 2009 | 23.9 | 88.9 | 26.9 | 24.8 | 54.0 | 45.9 |
| FY | Total pumps | Electric pumps | Diesel pumps | Electric pumps % of total | Diesel pumps % of total |
|---|---|---|---|---|---|
| (millions) | |||||
| 1999 | 0.6 | 0.1 | 0.4 | 20.8 | 79.2 |
| 2000 | 0.6 | 0.1 | 0.5 | 18.4 | 81.6 |
| 2001 | 0.7 | 0.1 | 0.5 | 17.3 | 82.7 |
| 2002 | 0.7 | 0.1 | 0.6 | 16.5 | 83.5 |
| 2003 | 0.8 | 0.1 | 0.6 | 15.7 | 84.3 |
| 2004 | 1.0 | 0.1 | 0.8 | 13.9 | 86.1 |
| 2005 | 1.0 | 0.1 | 0.8 | 13.9 | 86.1 |
| 2006 | 1.0 | 0.1 | 0.9 | 14.4 | 85.6 |
| 2007 | 0.9 | 0.1 | 0.8 | 12.5 | 87.5 |
| 2008 | 0.9 | 0.1 | 0.8 | 13.1 | 86.9 |
| 2009 | 0.9 | 0.1 | 0.8 | 13.1 | 86.9 |
| FY | Pumps (millions) | Days per year | Hours per day | Total hours per pump | Total hours for all pumps (millions) | Diesel/electricity (unadjusted) on wheat (PJ) |
|---|---|---|---|---|---|---|
| 2009 (diesel) | 0.4 | 125 | 5 | 635 | 235.0 | 8.6 |
| 2009 (electric) | <0.1 | 184 | 6 | 1,104 | 62.6 | 2.3 |
| FY | No. of diesel/electric pumps watering wheat (000) | AFEC (MJ kg−1-year) | Weight (kg; one pump) | Total embodied energy of one pump (MJ) | Total embodied energy of all pumps (PJ) |
|---|---|---|---|---|---|
| 2009 (diesel) | 375.9 | 4.5 | 275 | 1,237.5 | 0.5 |
| 2009 (electric) | 56.7 | 6.8 | 275 | 1,870.0 | 0.1 |
| FY | Imported fertilizer (% of total used) | Imported pesticide (% of total used) |
|---|---|---|
| 1999 | 34.2 | 59.6 |
| 2000 | 23.4 | 32.2 |
| 2001 | 19.6 | 43.4 |
| 2002 | 21.4 | 38.8 |
| 2003 | 25.4 | 30.8 |
| 2004 | 23.7 | 31.2 |
| 2005 | 21.2 | 27.0 |
| 2006 | 33.3 | 29.2 |
| 2007 | 21.7 | 19.0 |
| 2008 | 24.5 | 23.7 |
| 2009 | 15.3 | 23.7 |
| FY | '99 | '00 | '01 | '02 | '03 | '04 | '05 | '06 | '07 | '08 | '09 | Avg. input |
|---|---|---|---|---|---|---|---|---|---|---|---|---|
| Seed | 17.5 | 18.0 | 17.4 | 17.1 | 17.1 | 17.5 | 17.8 | 18.0 | 18.2 | 18.2 | 19.2 | 17.8 |
| N | 40.9 | 43.2 | 44.2 | 44.6 | 45.8 | 49.3 | 60.1 | 62.9 | 57.0 | 62.9 | 65.3 | 52.4 |
| Fertilizer P | 1.0 | 1.3 | 1.5 | 1.3 | 1.4 | 1.5 | 2.1 | 2.0 | 2.3 | 1.5 | 1.5 | 1.6 |
| K | 0.1 | 0.1 | 0.1 | 0.1 | 0.1 | 0.1 | 0.1 | 0.1 | 0.2 | 0.1 | 0.1 | 0.1 |
| Herbicide | 0.9 | 1.2 | 0.9 | 1.3 | 1.5 | 2.5 | 2.0 | 0.8 | 1.8 | 0.8 | 0.8 | 1.3 |
| Pesticide Insecticide | 0.2 | 0.2 | 0.2 | 0.3 | 0.3 | 0.5 | 0.4 | 0.2 | 0.3 | 0.1 | 0.1 | 0.3 |
| Fungicide | 0.0 | 0.0 | 0.0 | 0.0 | 0.0 | 0.0 | 0.0 | 0.0 | 0.0 | 0.0 | 0.0 | 0.0 |
| Labor | 2.2 | 2.2 | 2.1 | 2.1 | 2.1 | 2.1 | 2.2 | 2.2 | 2.2 | 2.2 | 2.4 | 2.2 |
| Tractor diesel | 8.9 | 9.2 | 8.9 | 8.7 | 8.7 | 8.9 | 9.1 | 9.2 | 9.3 | 9.3 | 9.8 | 9.1 |
| Tractor embodied energy | 1.4 | 1.4 | 1.4 | 1.3 | 1.3 | 1.4 | 1.4 | 1.4 | 1.4 | 1.4 | 1.5 | 1.4 |
| Tube well diesel | 4.0 | 4.7 | 5.0 | 5.4 | 5.9 | 7.6 | 7.9 | 7.8 | 8.0 | 7.7 | 8.6 | 6.6 |
| Tube well electricity (adjusted) | 3.6 | 3.9 | 3.9 | 4.0 | 4.0 | 4.2 | 4.6 | 4.3 | 4.0 | 4.2 | 4.7 | 4.1 |
| Diesel tube well embodied energy | 0.2 | 0.3 | 0.3 | 0.3 | 0.3 | 0.4 | 0.4 | 0.4 | 0.4 | 0.4 | 0.5 | 0.4 |
| Electric tube well embodied energy | 0.1 | 0.1 | 0.1 | 0.1 | 0.1 | 0.1 | 0.1 | 0.1 | 0.1 | 0.1 | 0.1 | 0.1 |
| Transportation of fertilizer and pesticide | 1.8 | 1.8 | 1.9 | 1.9 | 2.0 | 2.1 | 2.6 | 2.8 | 2.6 | 2.6 | 2.6 | 2.2 |
| Total | 82.7 | 87.6 | 87.8 | 88.6 | 90.6 | 98.1 | 110.8 | 112.3 | 108.0 | 111.5 | 117.2 | 99.6 |
| FY | '99 | '00 | '01 | '02 | '03 | '04 | '05 | '06 | '07 | '08 | '09 | Average input |
|---|---|---|---|---|---|---|---|---|---|---|---|---|
| Seed | 0.6 | 0.7 | 0.6 | 0.5 | 0.6 | 0.6 | 0.6 | 0.7 | 0.6 | 0.6 | 0.8 | 0.6 |
| N | 4.9 | 5.1 | 5.2 | 5.3 | 5.4 | 5.8 | 7.2 | 7.6 | 6.8 | 7.5 | 7.8 | 6.3 |
| Fertilizer P | 0.1 | 0.2 | 0.2 | 0.2 | 0.2 | 0.2 | 0.2 | 0.2 | 0.3 | 0.2 | 0.2 | 0.2 |
| K | 0.0 | 0.0 | 0.0 | 0.0 | 0.0 | 0.0 | 0.0 | 0.0 | 0.0 | 0.0 | 0.0 | 0.0 |
| Herbicide | 0.0 | 0.0 | 0.0 | 0.1 | 0.1 | 0.1 | 0.1 | 0.0 | 0.1 | 0.0 | 0.0 | 0.1 |
| Pesticide Insecticide | 2.2 | 3.0 | 2.3 | 3.4 | 3.8 | 6.3 | 5.1 | 2.1 | 4.6 | 1.9 | 1.9 | 3.3 |
| Fungicide | 0.0 | 0.0 | 0.0 | 0.0 | 0.0 | 0.0 | 0.0 | 0.0 | 0.0 | 0.0 | 0.0 | 0.0 |
| Labor | 1.3 | 1.4 | 1.3 | 1.2 | 1.2 | 1.4 | 1.4 | 1.4 | 1.4 | 1.4 | 1.6 | 1.4 |
| Tractor diesel | 0.6 | 0.7 | 0.6 | 0.5 | 0.6 | 0.6 | 0.7 | 0.7 | 0.7 | 0.7 | 0.8 | 0.6 |
| Tractor embodied energy | 0.1 | 0.1 | 0.1 | 0.1 | 0.1 | 0.1 | 0.1 | 0.1 | 0.1 | 0.1 | 0.1 | 0.1 |
| Tube well diesel | 2.5 | 2.9 | 3.0 | 2.9 | 3.3 | 4.6 | 4.9 | 5.1 | 4.6 | 4.2 | 4.8 | 3.9 |
| Tube well electricity (adjusted) | 2.2 | 2.4 | 2.3 | 2.1 | 2.2 | 2.6 | 2.8 | 2.9 | 2.3 | 2.3 | 2.6 | 2.4 |
| Diesel tube well embodied energy | 0.1 | 0.2 | 0.2 | 0.2 | 0.2 | 0.2 | 0.3 | 0.3 | 0.2 | 0.2 | 0.3 | 0.2 |
| Electric tube well embodied energy | 0.1 | 0.1 | 0.1 | 0.0 | 0.1 | 0.1 | 0.1 | 0.1 | 0.1 | 0.1 | 0.1 | 0.1 |
| Transportation of fertilizer and pesticide | 0.2 | 0.2 | 0.2 | 0.2 | 0.3 | 0.3 | 0.3 | 0.4 | 0.3 | 0.3 | 0.3 | 0.3 |
| Total | 15.1 | 16.8 | 16.2 | 16.7 | 18.0 | 22.9 | 23.8 | 21.6 | 22.1 | 19.5 | 21.2 | 19.4 |
| Regression | r2 value | Adjusted r2 value | p-value | Residual sum of squares | Equation |
|---|---|---|---|---|---|
| Linear | 0.40 | 0.33 | 0.0367 | 0.28 | y = 85.07 − 0.04098x |
| Quadratic | 0.50 | 0.37 | 0.0639 | 0.23 | y = 29,061 − 28.96x + 0.007215x2 |
| Cubic | 0.54 | 0.34 | 0.1257 | 0.21 | y = −13,814,792 + 20,695x − 10.33x2 + 0.00172x3 |
| Quartic | 0.61 | 0.35 | 0.1702 | 0.18 | y = − 14,407,445,048 + 28,750,586x − 21,515x2 + 7.156x3 − 0.0008924x4 |
| Regression | r2 value | Adjusted r2 value | p-value | Residual sum of squares | Equation |
|---|---|---|---|---|---|
| Linear | 0.01 | - 0.10 | 0.7245 | 3.77 | y = 48.9 - 0.02243x |
| Quadratic | 0.82 | 0.77 | 0.0011 | 0.70 | y = 240,191 − 239.7x + 0.0598x2 |
| Cubic | 0.86 | 0.80 | 0.0023 | 0.54 | y = −40,899,374 + 61,347x − 30.67x2 + 0.005112x3 |
| Quartic | 0.89 | 0.81 | 0.0054 | 0.43 | y = − 25,390,309,936 + 50,659,130x − 37,903x2 + 12.6x3 − 0.001572x4 |
| FY | Wheat | Rice | ||||
|---|---|---|---|---|---|---|
| N fertilizer | Output | N fertilizer | TW diesel | Insecticide | Output | |
| 1999 | ||||||
| 2000 | 2.7 | 14.8 | 1.8 | 12.0 | 29.3 | 6.3 |
| 2001 | 5.7 | −6.6 | 8.1 | 8.6 | −17.8 | −1.3 |
| 2002 | 2.5 | −2.7 | 13.4 | 8.4 | 65.1 | −10.2 |
| 2003 | 3.1 | 5.6 | −2.3 | 10.0 | 6.2 | 9.6 |
| 2004 | 5.2 | −0.6 | −2.7 | 25.9 | 50.0 | −2.2 |
| 2005 | 19.9 | 9.0 | 20.5 | 2.8 | −20.8 | 1.3 |
| 2006 | 3.5 | −2.6 | 0.6 | 1.7 | −60.2 | 6.0 |
| 2007 | −10.8 | 7.8 | −8.1 | −10.2 | 119.7 | −0.3 |
| 2008 | 10.7 | −9.7 | 13.3 | −5.6 | −57.3 | 5.2 |
| 2009 | −1.9 | 8.4 | −11.9 | −3.7 | −15.1 | 6.5 |
| Regression | r2 value | Adjusted r2 value | p-value | Residual sum of squares | Equation |
|---|---|---|---|---|---|
| Linear | 0.53 | 0.48 | 0.0110 | 26.14 | y = 18.12 + 1.4x |
| Quadratic | 0.53 | 0.42 | 0.0476 | 26.03 | y = 3.171 + 3.966x − 0.109x2 |
| Cubic | 0.56 | 0.37 | 0.1078 | 24.61 | y = 706.6 − 178.8x + 15.64x2 − 0.4504x3 |
| Quartic | 0.70 | 0.51 | 0.0814 | 16.55 | y = −23,612 + 8,228x − 1,070x2 + 61.69x3 − 1.329x4 |
| Regression | r2 value | Adjusted r2 value | p-value | Residual sum of squares | Equation |
|---|---|---|---|---|---|
| Linear | 0.03 | −0.08 | 0.6423 | 42.20 | y = 32.84 − 0.3137x |
| Quadratic | 0.14 | −0.08 | 0.5481 | 37.24 | y = − 8.318 + 10.31x − 0.675x2 |
| Cubic | 0.25 | −0.08 | 0.5525 | 32.67 | y = −406.4 + 165.2x − 20.55x2 + 0.8407x3 |
| Quartic | 0.26 | −0.23 | 0.7162 | 31.90 | y = − 2,023 + 1,019x − 188.2x2 + 15.37x3 − 0.4688x4 |
References and Notes
- The World Factbook. South Asia: Pakistan; Central Intelligence Agency: Washington, DC, USA, 2010a. Available online: https://www.cia.gov/library/publications/the-world-factbook/geos/pk.html (accessed on 22 September 2010).
- World Bank. Population, Total. 2010. Available online: http://data.worldbank.org/indicator/SP.POP.TOTL?cid=GPD_1 (accessed on 9 August 2010).
- The World Factbook. Country Comparison: Distribution of Family Income - Gini Index; Central Intelligence Agency: Washington, DC, USA, 2010b. Available online: https://www.cia.gov/library/publications/the-world-factbook/rankorder/2172rank.html?countryName=Pakistan&countryCode=pk®ionCode=sas&rank=109#pk (accessed on 22 September 2010).
- Government of Pakistan. Pakistan Economic Survey 2009–2010; Finance Division, Economic Advisor's Wing: Islamabad, Pakistan, 2010a. [Google Scholar]
- Government of Pakistan. Pakistan Economic Survey 2008–2009; Finance Division, Economic Advisor's Wing: Islamabad, Pakistan, 2009a. [Google Scholar]
- Government of Pakistan. Pakistan Economic Survey 2006–2007; Finance Division, Economic Advisor's Wing: Islamabad, Pakistan, 2007. [Google Scholar]
- International Rice Research Institute (IRRI). Frequently Asked Questions. 2007. Available online: http://www.irri.org/about/faq1.asp (accessed on 3 October 2010).
- Indexmundi. Wheat Production by Country in 1000 MT. 2009. Available online: http://www.indexmundi.com/agriculture/?commodity=wheat&graph=production (Accessed on 25 September 2010).
- Government of Pakistan. Agricultural Statistics of Pakistan 2008–2009; Ministry of Food, Agriculture, and Livestock: Economic, Trade, and Investment Wing: Islamabad, Pakistan, 2010b. [Google Scholar]
- Dowswell, C.R. Wheat Research and Development in Pakistan; Pakistan Agricultural Research Council/CIMMYT Collaborative Program: Islamabad, Pakistan/Mexico DF, Mexico, 1989. [Google Scholar]
- MacLean, J.L.; Dawe, D.C.; Hardy, B.; Hettel, G.P. (Eds.) Rice Almanac; International Rice Research Institute (IRRI): Manila, Philippines, 2002.
- World Health Organization. El Niño and its Health Impact – Fact Sheet No. 192. 2000. Available online: http://www.who.int/mediacentre/factsheets/fs192/en/ (accessed on 7 December 2009).
- Food and Agriculture Organization. The Impact of El Niño and Other Weather Anomalies on Crop Production in Asia. 1997. Available online: http://www.fao.org/docrep/004/w6413e/w6413e00.HTM (accessed on 7 December 2009).
- Government of Pakistan. Pakistan Statistical Yearbook 2008; Federal Bureau of Statistics: Islamabad, Pakistan, 2008. [Google Scholar]
- Food and Agriculture Organization of the United Nations. Fertilizer Use by Crop in Pakistan; FAO: Rome, Italy, 2004. [Google Scholar]
- International Fertilizer Industry Association, International Fertilizer Development Center, and Food and Agriculture Organization of the United Nations. Fertilizer Use by Crop = Utilisation des Engrais par Culture = Utilización de Fertilizantes por Cultivo; Food and Agriculture Organization of the United Nations: Rome, Italy, 1992. [Google Scholar]
- Food and Agriculture Organization of the United Nations, International Fertilizer Development Center, and International Fertilizer Industry Association. Fertilizer Use by Crop = Utilisation des Engrais par Culture = Utilización de Fertilizantes por Cultivo; Food and Agriculture Organization of the United Nations: Rome, Italy, 1994. [Google Scholar]
- Food and Agriculture Organization of the United Nations, International Fertilizer Development Center, and International Fertilizer Industry Association. Fertilizer Use by Crop = Utilisation des Engrais par Culture = Utilización de Fertilizantes por Cultivo; Food and Agriculture Organization of the United Nations: Rome, Italy, 1996. [Google Scholar]
- Food and Agriculture Organization of the United Nations, International Fertilizer Development Center, and International Fertilizer Industry Association. Fertilizer Use by Crop = Utilisation des Engrais par Culture = Utilización de Fertilizantes por Cultivo; Food and Agriculture Organization of the United Nations: Rome, Italy, 1999. [Google Scholar]
- Food and Agriculture Organization of the United Nations, International Fertilizer Development Center, and International Fertilizer Industry Association. Fertilizer Use by Crop = Utilisation des Engrais par Culture = Utilización de Fertilizantes por Cultivo; Food and Agriculture Organization of the United Nations: Rome, Italy, 2002. [Google Scholar]
- Khan, M.H. Agriculture in Pakistan: Change and Progress 1947–2005; Vanguard: Lahore, Pakistan, 2006. [Google Scholar]
- National Fertilizer Development Centre (NFDC). Survey on Pesticides Use and its Impact; Survey Report, NFDC Publication No. 2/2002; Planning and Development Division, National Fertilizer Development Centre: Islamabad, Pakistan, 2002. [Google Scholar]
- Khan, D. An Investigation into the Level of Underemployment in [the] Agricultural Sector of [the] Peshawar Valley. PhD dissertation, Department of Agricultural Economics, NWFP Agricultural University, Peshawar, Pakistan, 2007. [Google Scholar]
- FAOSTAT. ResourceSTAT - Machinery. Country: Pakistan; Year 1961–2007; Item: Agricultural tractors; Element: in use. 2009. Available online: http://faostat.fao.org/site/576/DesktopDefault.aspx?PageID=576#ancor (accessed on 27 November 2010).
- Lal, R.; Hobbs, P.R.; Uphoff, N.; Hansen, D.O. Sustainable Agriculture and the International Rice-wheat System; Marcel Dekker, Inc: New York, NY, USA, 2004. [Google Scholar]
- World Bank. Pakistan - Country Water Resources Assistance Strategy: Water Economy Running Dry, Report Number 34081; World Bank: Islamabad, Pakistan, 2005. [Google Scholar]
- Shapouri, H.; Salassi, M. The Economic Feasibility of Ethanol Production from Sugar in the United States; United States Department of Agriculture: Washington, DC, USA, 2006. [Google Scholar]
- Murphy, D.; Hall, C.A.S.; Powers, B. New perspective on the energy return on (energy) investment of corn ethanol. Environ. Dev. Sustain. 2010. [Google Scholar] [CrossRef]
- Evenson, R.E. The green revolution and the gene revolution in Pakistan: Policy implications. Pak. Dev. Rev. 2005, 44, 359–386. [Google Scholar]
- Ahmad, I.; Hussain, S.A; Zahid, M.S. Why the green revolution was [a] short run phenomena in the development process of Pakistan: A lesson for [the] future. J. Rural Dev. Adm. 2004, XXXV, 89–108. [Google Scholar]
- Borlaug, N. The green revolution, peace, and humanity. In Nobel Lectures, Peace 1951–1970; Haberman, F.W., Ed.; Elsevier Publishing Company: Amsterdam, The Netherlands, 1972. [Google Scholar]
- Wheeler, C.W. Pakistan's Green Revolution. DACNews. 2007. Available online: http://www.oecd.org/document/57/0,3343,en_2649_33721_39575353_1_1_1_1,00.html (accessed on 20 May 2009).
- Crosson, P.R.; Brubaker, S. Resource and Environmental Effects of U.S. Agriculture; Resources for the Future: Washington, DC, USA, 1982. [Google Scholar]
- Stanhill, G. Energy and Agriculture; Advanced Series in Agricultural Sciences, 14; Springer: Berlin, Germany, 1984. [Google Scholar]
- Leach, G.; Jarass, L.; Obermair, G.; Hoffman, L. Energy and Growth: A Comparison of 13 Industrial and Developing Countries; Butterworths: London, UK, 1986. [Google Scholar]
- Pimentel, D.; Dazhong, W.; Giampietro, M. Technological Changes in Energy Use in U.S. Agricultural Production. In Agroecology; Gliessman, S.R., Ed.; Springer: New York, NY, USA, 1990. [Google Scholar]
- Conforti, P.; Giampietro, M. Fossil energy use in agriculture: an international comparison. Agric. Ecosyst. Environ 1997, 65, 231–243. [Google Scholar]
- Hall, C.A.S.; Cleveland, C.J.; Kaufmann, R. Energy and Resource Quality: The Ecology of the Economic Process; Wiley: New York, NY, USA, 1986. [Google Scholar]
- Ehrlich, P.R.; Ehrlich, A.H.; Daily, G.C. Food security, population, and environment. Popul. Dev. Rev. 1993, 19, 1–32. [Google Scholar]
- Giampietro, M. Socioeconomic constraints to farming with biodiversity. Agric. Ecosyst. Environ. 1997, 62, 145–67. [Google Scholar]
- Jameel, M. Energy for Agriculture in Pakistan; International Institute for Applied Systems Analysis: Laxenburg, Austria, 1982. [Google Scholar]
- Khan, M.A.; Zafar, J.; Bakhash, A. Energy requirement and economic analysis of sugarcane production in Dera Ismail Khan district of Pakistan. Gomal Univ. J. Res. 2008, 24, 72–82. [Google Scholar]
- Khan, M.A.; Singh, G. Energy inputs and crop production in Western Pakistan. Energy 1996, 21, 45–53. [Google Scholar]
- Khan, M.A.; Singh, G. Energy inputs and potential for agricultural production in Western Pakistan. Agric. Syst. 1997, 54, 341–56. [Google Scholar]
- Mandal, K.G.; Saha, K.P.; Ghosh, P.K.; Hati, K.M.; Bandyopadhyay, K.K. Bioenergy economic analysis of soybean-based crop production systems in central India. Biomass Bioenergy 2002, 23, 337–345. [Google Scholar]
- Singh, H; Singh, A.K.; Kushwaha, H.L.; Singh, A. Energy consumption pattern of wheat production in India. Energy 2007, 32, 1848–1854. [Google Scholar]
- Nassiri, S.M.; Singh, S. Study on energy use efficiency for paddy crop using data envelopment. Appl. Energy 2009, 86, 1320–1325. [Google Scholar]
- Fluck, R.C.; Baird, C.D. Agricultural Energetics; AVI Pub. Co.: Westport, CT, USA, 1980. [Google Scholar]
- Hall, C.A.S.; Balogh, S.; Murphy, D.J. What is the minimum EROI that a sustainable society must have? Energies 2009, 2, 25–47. [Google Scholar]
- Government Accountability Office. Net Energy Analysis: Little Progress and Many Problems; EMD-77-57, Report to the Energy Research and Development Administration; Government Accountability Office: Washington, DC, USA, 1977. [Google Scholar]
- McKetta, J.J. Encyclopedia of Chemical Processing and Design 19 - Energy, Costing Thermal Electric Power Plants to Ethanol; Dekker: New York, NY, USA, 1983. [Google Scholar]
- Klass, D.L. Biomass for Renewable Energy, Fuels, and Chemicals; Academic Press: San Diego, CA, USA, 1998. [Google Scholar]
- Government Accountability Office. DOE Funds New Energy Technologies Without Estimating Potential Net Energy Yields; GAO/IPE-82-1, Report to the President of the Senate and the Speaker of the House of Representatives; Government Accountability Office: Washington, DC, USA, 1982. [Google Scholar]
- Cleveland, C. Net Energy Analysis. 2008. Available online: http://www.eoearth.org/article/Net_energy_analysis (accessed on 19 March 2009).
- Leach, G. Energy and Food Production; IPC Science and Technology Press: Guildford, UK, 1976. [Google Scholar]
- Refsgaard, K.; Halberg, N.; Kristensen, E.S. Energy utilization in crop and dairy production in organic and conventional livestock production systems. Agric. Syst. 1998, 57, 599–630. [Google Scholar]
- United States Department of Agriculture. USDA National Nutrient Database for Standard Reference. 2009. Available online: http://www.nal.usda.gov/fnic/foodcomp/search/ (accessed on 25 November 2009).
- Cheema, M.S.; Ali, L.; Akhtar, M. Wheat Following the Cotton and Rice-based Cropping System in Pakistan. USDA Annual Wheat Newsletter, Items from Pakistan. 2002. Available online: http://wheat.pw.usda.gov/ggpages/awn/48/Textfiles/PAKISTAN.html (accessed on 12 November 2009).
- Akhter, M.; Ramzan, M.; Ahmad, M. News Channel: Maximizing Rice Yield. 2007. Available online: http://www.pakissan.com/english/news/newsDetail.php?newsid=14589 (accessed on 22 June 2009).
- Government of Pakistan. Pakistan Statistical Yearbook 2009; Federal Bureau of Statistics: Islamabad, Pakistan, 2009b. [Google Scholar]
- Patzek, T.W. Thermodynamics of the corn-ethanol biofuel cycle, web version: updated July 22, 2006. Critical Reviews in Plant Sciences. 2004, 23, pp. 519–567. Available online: http://petroleum.berkeley.edu/papers/patzek/CRPS416-Patzek-Web.pdf (accessed on 4 August 2008).
- Pimentel, D. Ethanol fuels: Energy balance, economics, and environmental impacts are negative. Nat. Resour. Res. 2003, 12, 127–134. [Google Scholar]
- Wang, M.; Saricks, C.; Wu, M. Fuel-cycle Fossil Energy Use and Greenhouse Gas Emissions of Fuel Ethanol Produced from U.S. Midwest Corn; Report sponsored by the Illinois Department of Commerce and Community Affairs; Argonne National Laboratory, Center for Transportation Research: Argonne, IL, USA, 1997. [Google Scholar]
- Shapouri, H.; Duffield, J.A.; Wang, M. The Energy Balance of Corn Ethanol: An Update; Agricultural Economic Report, No. 814; Department of Agriculture, Office of the Chief Economist: Washington, DC, USA, 2002. [Google Scholar]
- Tzilivakis, J.; Warner, D.J.; May, M.; Lewis, K.A.; Jaggard, K. An assessment of the energy inputs and greenhouse gas emissions in sugar beet (Beta vulgaris) production in the UK. Agric. Syst. 2005, 85, 101–119. [Google Scholar]
- Green, M. Energy in Pesticide Manufacture, Distribution, and Use. In Energy in Plant Nutrition and Pest Control; Helsel, Z.R., Ed.; Elselvier: Amsterdam, The Netherlands, 1987; Volume 7. [Google Scholar]
- Ahmad, S.; Martini, R.P. Agricultural Policy Analysis in Pakistan: Illustrations in the Use of the Policy Analysis Matrix; Lahore University of Management Sciences (LUMS), Centre for Management and Economic Research (CMER): Lahore Cantt, Pakistan, 2000; Working Paper No. 00-27. [Google Scholar]
- Ajmal, M. Personal Communication; The Network for Consumer Protection: Islamabad, Pakistan, 2009. [Google Scholar]
- Ozkan, B.; Akcaoz, H.; Fert, C. Energy input–output analysis in Turkish agriculture. Renew. Energy 2004, 29, 39–51. [Google Scholar]
- Government of Pakistan. Pakistan Agricultural Machinery Census 2004; Agricultural Census Organization, Statistics Division: Lahore, Pakistan, 2004. [Google Scholar]
- Hoye Tractor Parts. Additional Help. 2006. Available online: http://www.hoyetractor.com/whomakes.htm (accessed on 28 June 2009).
- Quick, G.R. The Compact Tractor Bible; Voyageur Press: St. Paul, MN, USA, 2006. [Google Scholar]
- Stout, B.A. Handbook of Energy for World Agriculture; Elsevier: New York, NY, USA, 1991. [Google Scholar]
- Bakht, G.K.; Ahmadi, H.; Akram, A.; Karimi, M. Determination of optimum life (economic life) for Mf285 tractor: A case study in center region of Iran. American-Eurasian J. Agric. Environ. Sci. 2008, 4, 81–85. [Google Scholar]
- Smil, V. General Energetics: Energy in the Biosphere and Civilization; Wiley: New York, NY, USA, 1991. [Google Scholar]
- Nazir, M.S. Crop Production; National Book Foundation: Islamabad, Pakistan, 1994. [Google Scholar]
- Hydrocarbon Development Institute of Pakistan. Pakistan Energy Yearbook 2009; Ministry of Petroleum and Natural Resources: Islamabad, Pakistan, 2010. [Google Scholar]
- Hydrocarbon Development Institute of Pakistan. Pakistan Energy Yearbook 2004; Ministry of Petroleum and Natural Resources: Islamabad, Pakistan, 2004. [Google Scholar]
- Hydrocarbon Development Institute of Pakistan. Pakistan Energy Yearbook 2005; Ministry of Petroleum and Natural Resources: Islamabad, Pakistan, 2005. [Google Scholar]
- Hydrocarbon Development Institute of Pakistan. Pakistan Energy Yearbook 2006; Ministry of Petroleum and Natural Resources: Islamabad, Pakistan, 2006. [Google Scholar]
- Hydrocarbon Development Institute of Pakistan. Pakistan Energy Yearbook 2008; Ministry of Petroleum and Natural Resources: Islamabad, Pakistan, 2009. [Google Scholar]
- Woodbank Communications Ltd. Hydroelectric Power. 2005. Available online: http://www.mpoweruk.com/hydro_power.htm (accessed on 3 October 2010).
- World Nuclear Association. Nuclear Power Reactors - The Power Rating of a Nuclear Power Reactor. 2011. Available online: http://www.world-nuclear.org/info/inf32.html (accessed on 6 June 2011).
- Batty, J.C.; Keller, J. Energy Requirements for Irrigation. In Handbook of Energy Utilization in Agriculture; Pimentel, D., Ed.; CRC Press: Boca Raton, FL, USA, 1980. [Google Scholar]
- Basant Products. Centrifugal Water Pumpset. 2006. Available online: http://www.vidhataindia.com/pump.htm (accessed on 31 July 2009).
- Analyze-it®, version 2.22. Analyze-it Software, Ltd.: Leeds, UK, 2010. http://www.analyse-it.com/; add-in software for statistical analysis in Microsoft Excel®.
- McConnell, D.J.; Dillon, J.L. Farm Management for Asia: A Systems Approach; FAO Farm Systems Management; Series - 13; Food and Agriculture Organization of the United Nations: Rome, Italy, 1997. Available online: http://www.fao.org/docrep/w7365e/w7365e00.htm#Contents (accessed on 9 August 2009).
- Singh, S.; Singh, G. Energy input and crop yield relationship to four major crops of northern India. Agricultural Mechanization in Asia, Africa, and Latin America (AMA) 1992, 23, 57. [Google Scholar]
- Sidhu, H.S.; Singh, S.; Singh, T.; Ahuja, S.S. Optimization of energy usage in different crop production systems. Agric. Eng. 2004, 85. paper 01. [Google Scholar]
List of Acronyms and Abbreviations
| EROI | Energy return on investment |
| FAO | Food and Agriculture Organization (United Nations) |
| FY | Fiscal year (Pakistani fiscal year is July 1 June 30) |
| GAO | Government Accountability Office (USA) |
| GDP | Gross domestic product |
| GoP | Government of Pakistan |
| HDIP | Hydrocarbon Development Institute of Pakistan |
| HYV | High-yielding variety |
| IFA | International Fertilizer Industry Association (France) |
| IRRI | International Rice Research Institute |
| K | Potassium (fertilizer input) |
| N | Nitrogen (fertilizer input) |
| NEA | Net energy analysis |
| NFDC | National Fertilizer Development Centre (Pakistan) |
| P | Phosphorus (fertilizer input) |
| USD | United States dollars |
| USDA | United States Department of Agriculture (USA) |
List of Units of Measurement
| GJ | Gigajoule |
| GWh | Gigawatt-hour |
| ha | Hectare |
| HP | Horsepower |
| J | Joule |
| kg | Kilogram |
| kW | Kilowatt |
| MAF | Million acre-feet |
| MJ | Megajoule |
| m2 | Square meter |
| Mt | Megatonne (million tonnes) |
| t | Tonne/metric ton |
| toe | Tonnes of oil equivalent |
| PJ | Petajoule |
| PTO | HP Power take-off horsepower |
© 2011 by the authors; licensee MDPI, Basel, Switzerland. This article is an open access article distributed under the terms and conditions of the Creative Commons Attribution license (http://creativecommons.org/licenses/by/3.0/).
Share and Cite
Pracha, A.S.; Volk, T.A. An Edible Energy Return on Investment (EEROI) Analysis of Wheat and Rice in Pakistan. Sustainability 2011, 3, 2358-2391. https://doi.org/10.3390/su3122358
Pracha AS, Volk TA. An Edible Energy Return on Investment (EEROI) Analysis of Wheat and Rice in Pakistan. Sustainability. 2011; 3(12):2358-2391. https://doi.org/10.3390/su3122358
Chicago/Turabian StylePracha, Ali S., and Timothy A. Volk. 2011. "An Edible Energy Return on Investment (EEROI) Analysis of Wheat and Rice in Pakistan" Sustainability 3, no. 12: 2358-2391. https://doi.org/10.3390/su3122358