

Research on Alternative Relationship between Chinese Renewable Energy and Imported Coal for China

College of Economics and Management, Shanghai University of Electric Power, Shanghai 200090, China
*
Author to whom correspondence should be addressed.
Sustainability 2024, 16(8), 3446; https://doi.org/10.3390/su16083446
Submission received: 13 March 2024
/
Revised: 11 April 2024
/
Accepted: 17 April 2024
/
Published: 19 April 2024
(This article belongs to the Topic Energy Economics and Sustainable Development)
Abstract
:The issue of energy security in the new development paradigm featuring dual circulation has been paid attention to by all sectors, but at present, there are few results from relevant quantitative analyses. With a focus on China’s actual energy trade, this research examines the core elements of energy security in international and Chinese cycles. In this context, the “gravity model” and “Allen substitution elasticity” are optimized and expanded. An integrated assessment methodology is developed as a result of this effort. This methodology consists of an international-cycle trade gravity model and a Chinese-cycle price elasticity model. Additionally, it empirically analyzes the effects of China’s renewable energy substitution from the perspective of the “dual cycles” of energy security, and illustrates the current state of China’s energy security through the analysis of energy substitution relationship data. The results show that Chinese renewable energy does have a buffer effect on imported coal in terms of trade efficiency, scale, and behavior, as well as performance, and the energy trade price has a direct guiding significance for this buffer function, but the enhancement function of economy-driven efficiency is indirect. Furthermore, as far as the absolute price elasticity and net price elasticity are concerned, although Chinese wind power generation is a substitute for imported coal, its price elasticity also confirms that Chinese wind power generation is not a “normal commodity”. Moreover, at present, Chinese photovoltaic power generation shows the attribute of a “normal commodity”, but it has a certain degree of complementarity with imported coal, although this complementarity will weaken in the near future with the trend of changing to substitution.
1. Introduction
The imperative of high-quality development in China necessitates rapid progress toward “carbon neutrality”, requiring various sectors to examine numerous underlying issues. Within the existing technological landscape, the energy sector’s attention is focused on two critical focal points: the reduction of fossil fuel consumption and the enhancement of renewable energy efficiency. Nevertheless, the energy transition towards carbon neutrality in China remains unable to evade macro-level risks.
In recent years, escalating uncertainty in the international landscape has exacerbated the imbalance in global fossil fuel supply, posing further threats to China’s energy independence. As a result of its disproportionately high consumption of fossil fuels and its insufficient capacity for self-sufficiency, this concern is exacerbated in China. By 2023, China’s external dependency on petroleum will exceed 70%, 45.3% for natural gas and 9.3% for coal [1,2]. Influenced by trade relations between China and Australia, the proportion of coal imported from Australia in 2023 accounted for 11.1% of China’s total coal imports, representing a decline of over 38% compared to 2020 (data source: General Administration of Customs of the People’s Republic of China, calculated by the Authors.). During the “Russia-Ukraine war”, international markets, including finance, energy, and commodities, were impacted, leading to a surge in international energy prices. From January to April 2022, the average prices of imported crude oil, natural gas, and coal rose by 54.3%, 72.1%, and 109.1%, respectively. Heightened uncertainty in the international arena has significantly jeopardized China’s energy security.
In contrast, the transition from the “dual control of energy consumption” to the “dual control of carbon emissions” is fraught with numerous uncertainties and therefore requires a steady process of energy security. In 2023, China’s renewable energy-generating capacity surpassed 1.4 billion kilowatts, which is the world’s largest [3]. The installed capacity of both wind and solar energy has exceeded 400 million kilowatts, bringing the world closer to the 2030 target [3]. In light of the growing proportion of renewable energy generation, the importance of clean energy substitution is becoming increasingly apparent. A tightening of regulations on thermal power can stabilize fossil energy consumption, thereby reducing external dependence on coal. As a result, renewable energy has been consistently emphasized on the supply side for a long time, with the use of fiscal subsidies and other incentives to stimulate its development. Nevertheless, if renewable energy generation remains constrained by technical and institutional challenges related to grid connections and absorption, the supply side of energy will continue to suffer. In addition to promoting the use of renewable energy on-site, China has established a diverse, integrated energy production and consumption model since the implementation of the “supply-side structural reform” in 2015. Due to this, China’s wind and solar curtailment rates have decreased by 11.6% and 8%, respectively (data source: China Renewable Energy Monitoring Platform, calculated by the Authors). Despite this, renewable energy generation only accounts for around 30% of the total electricity consumption of the entire society, compared to 50% of the installed renewable energy capacity [3]. Therefore, renewable energy generation is not yet as efficient as conventional energy generation. In September 2021, more than ten provinces, including Jiangsu, Zhejiang, Shandong, Guangdong, Guangxi, Yunnan, and the three northeastern provinces, sequentially issued notices of “power rationing and production suspension”, reintroducing the “power shortage” problem after almost thirty years. As a result of extreme high temperatures, aggravated by insufficient rainfall, the Sichuan–Chongqing region experienced a surge in electricity demand in July 2022. As a result, large-scale hydroelectric power was unable to provide reliable power supplies to its citizens. Consequently, widespread catastrophic power outages led to the implementation of “power rationing policies”. The role of renewable energy in ensuring China’s energy security remains subject to ongoing observation.
In May 2020, China introduced the concept of a “new development paradigm with Chinese circulation as the mainstay and Chinese and international circulations mutually reinforcing each other”. At the National People’s Congress in March 2022, “energy security” was elevated to a strategic level equivalent to “food security”. As a result, further transformation of the Chinese energy sector is required to address deficiencies in Chinese circulation development and an overreliance on international circulation, as well as addressing deficiencies in Chinese circulation development. In light of this, the question arises: Is it necessary to replace imported coal with renewable energy produced domestically? Considering the “dual circulation” framework from an economic standpoint (rather than a policy or technological standpoint), what forms the basis for energy substitution? Is it possible to utilize Chinese renewable energy to replace imported coal on the basis of the principle of putting Chinese needs first and relying on Chinese resources? As a way to avoid a one-sided interpretation, this research posits the issue of “energy security” in a global open economy. The research proposes to develop economic-level substitution analysis models from the perspective of energy trade (international circulation) and energy costs (Chinese circulation), to identify energy security-oriented substitution patterns and formulate policy recommendations.
2. Literature Review
Extensive research on the “possibility of energy substitution” on a global scale originated from the “oil crisis” [4], marking the emergence of energy substitution as a significant topic within energy security. Presently, empirical investigations into energy substitution typically concentrate on two categories: external energy substitution and internal energy substitution.
In the realm of external energy substitution, early research focused on exploring the potential relationships between energy and other production factors (capital, labor, and technology) [5,6,7,8]. However, the early studies concentrated on developed economies, whereas since 2000, scholars have increasingly directed their attention towards emerging economies [9,10,11,12]. Whether examining developed economies in earlier studies or focusing on developing economies in more recent ones, scholars have amassed compelling evidence supporting the substitutability of energy and capital. Stern [13] identified certain externalities of different national economic prospects impacting on the substitutive relationship between energy and capital, for example.
Regarding internal energy substitution, the research focuses primarily on the competition between coal, oil, natural gas, and electricity (with a focus on thermal power). For instance, Hall [14] examined the relationship between natural gas and coal, while Fuss [5] discussed the interplay between electricity, oil, natural gas, and coal. Taheri [15] assessed oil, coal, and electricity mutual influences. In response to the increasing understanding of energy–environment systems, an increasing number of scholars have begun to integrate renewable energy into the framework of external energy substitution analysis. A study conducted by Bello et al. [16] examined the substitutability of hydropower and non-renewable energy sources (such as coal, natural gas, and oil) in China, Malaysia, and Thailand. Based on Jones’s [17] research, biomass fuels can replace natural gas as a source of energy in the United States. Using a “sustainable development index”, Solarin and Bello [18] examined the possibility of substituting fossil fuels with biomass fuels in Brazil and identified certain inherent negative impacts of fossil fuel consumption. The focus of researchers in the field of renewable energy and non-renewable energy substitution has consequently shifted to non-developed nations.
In the context of energy security in China, most studies have concentrated on the substitution relationships among energy fuels within specific sectors. In their study, Smyth et al. [19] focused on the steel industry in China, utilizing Translog production functions to reveal a significant substitution between energy and capital. An analysis of the elasticity of substitution for energy in the Chinese industrial sector by Huang and Lin [20] revealed substantial potential for technological substitution over the long run. To examine fuel substitution in the Chinese chemical industry, Lin and Presley [21] used ridge regression, which demonstrated that oil, gas, and electricity were substitutable for coal in the Chinese chemical industry. From 1994 to 2008, Zhao and Zhou [22] examined energy substitution in Chinese industry, estimating significant variations in the actual substitution of inputs across sectors, regions, and time periods. Using factors such as energy self-sufficiency, energy substitution elasticity, energy external dependency, and carbon emissions, Guo and Li [23] assessed the replacement effects of new energy sources for fossil fuels and their external and internal driving forces. Much of the research conducted on international energy security issues is conducted within the framework of the circular economy. Based on a “short cycle”, “medium cycle”, and “large cycle” framework of the circular economy, Cisternas et al. [24] explored issues such as energy technology bottlenecks and environmental pollution from a global perspective. There is still a long way to go for the circular economy in the energy sector. From a technical aspect, Mitko et al. [25] concluded that the effective application of nanofiltration can contribute to the development of the circular economy within the Polish coal industry. Using contour analysis methods, Markevych et al. [26] investigated energy security issues in Ukraine within the context of a circular economy. According to their findings, a circular economy can contribute to economic sustainability and reduce risks and dependencies on critical energy sources, and Ukraine’s need to implement circular economy principles was highlighted.
As the construction of the “dual circulation” new development paradigm continues [27], the issue of energy security becomes increasingly prominent [28,29]. Furthermore, China’s imports of fossil fuels receive relatively little attention in the existing literature, which makes it necessary to conduct research in this area. From both the perspective of “international circulation” and the perspective of “Chinese circulation”, this research aims to combine the strategic backgrounds of energy security and discuss the potential substitution of imported coal for Chinese renewable energy (primarily wind and solar power). A set of integrated models for assessing substitution relationships is also proposed based on the “dual circulation” framework of energy security, which provides technical support and policy references for scientific decision-making.
3. Research Method
3.1. Theoretical Framework
“Placing Chinese circulation at the center of economic development” implies a shift from the outward-oriented economic development model characterized by the “international circulation” strategy. This shift involves setting up handles at both the supply and demand ends to construct a dual cycle system, developing and improving the Chinese market and enhancing the quality of economic development. Promotion of a dual cycle indicates that “opening up to the outside world” remains a long-term and steadfast development strategy. As part of this effort, it is necessary to engage deeper in global divisions of labor, expand international markets, and develop a new development pattern that promotes “mutual promotion of Chinese and international dual cycles”. The concept of “dual circulation” transcends the spatial perspective of “supply-side reform” and the Chinese viewpoint, and redefines the economic development pattern from a “medium to long-term perspective” rather than a “short-term dimension”. The dual circulation concept will simultaneously impact both sides of economic development in this context, affecting regional development patterns to a great extent. Depending on the established technological conditions, the emphasis on “energy security” in the new development pattern of “dual circulation” varies. As a result, it is necessary to establish an analytical framework for the substitution relationship between Chinese renewable energy and imported coal, as illustrated in Figure 1. Firstly, international energy cooperation is intended to enhance Chinese security of supply for fossil fuels within the strategic framework. A mutually beneficial interaction between energy supply and demand can be fostered by promoting symmetry in energy trade. There is an urgent need to implement proactive coping strategies as uncertainties surrounding coal imports continue to escalate, as well as to seek buffering and compensation through alternative energy sources. In addition, the rationalization of the energy structure serves as a midterm expectation for the transformation of the energy sector into one that is carbon neutral. It is through the substitutive and complementary relationships between energy sources that the energy structure is influenced by a “multi-energy complementary” model, which is often manifested in the price elasticity of energy governed by the economics of the market. Lastly, the core component of international circulation is energy trade, while the critical module of Chinese circulation is the energy supply-side structure. Energy prices typically serve as an effective measure of feedback between the two cycles.
3.2. Model Construction
Instead of relying on qualitative analyses or evaluative approaches, this study will optimize and refine the “gravity model” and “Allen substitution elasticity” based on advanced theoretical norms. The optimization will be conducted in accordance with practical considerations. Furthermore, the model will undergo deconstruction and expanded definitions. In order to facilitate the assessment of substitutability, it will be positioned simultaneously within a quantitative analysis framework. In this approach, the compatibility and adaptability of the integrated modeling method for “dual circulation” energy security are ensured.
3.2.1. The Trade Gravity Model within the International Circulation Framework
Within the context of international circulation, to elucidate the asymmetry in the flow of coal trading, it is proposed to refer to the research findings of Liu et al. (2021) and Freeman and Lewis (2018) to construct a gravity model for coal trading in China [30,31].
In this equation, represents China’s coal trade with trading partner in year ; denotes China’s coal import volume from trading partner in year ; signifies China’s coal export volume to trading partner in year ; represents the geographical distance or route length between China and trading partner ; and denotes the economic parameter. After taking the logarithm, the equation is linearized as follows:
In this equation, represents the constant term; denotes the error term of the baseline model; and , , and are all parameters to be estimated.
To objectively describe the reality of China’s energy trade and to expand the implications of symmetrical trade, it is necessary to extend the model. This involves deconstructing relevant decision variables, including ① China’s “Green Energy Index”, which represents the share of China’s renewable energy production in total energy consumption; ② China’s imported coal prices; ③ fixed effects related to international relations and global trends; and ④ other random disturbance factors. Thus, an optimized model is derived:
can be evaluated from four aspects—the value of imported coal trade , the volume of imported coal trade , the value of coal trade per unit GDP of the importing country , and the volume of coal trade per unit GDP of the importing country—in order to comprehensively analyze the substitution effect of renewable energy for imported coal. Among these, represents China’s green energy index in the th year; denotes the ratio of total value to the quantity of imported coal trade in China, i.e., the unit price of imported coal; stands for national fixed effects to capture unobserved factors; represents year fixed effects to capture common influencing factors across years; denotes the error term of the optimized model; and and are the parameters to be estimated.
3.2.2. The Chinese Circular Price Elasticity Model
In Chinese circulation, market-oriented energy substitution and complementarity relationships are commonly measured using price elasticity as an indicator. Based on the Translog functional form, the Allen Elasticity of Substitution (AES) model and the Morishima Elasticity of Substitution (MES) model are utilized to assess the substitutability between Chinese renewable energy and imported coal. Initially, the combination of Chinese renewable energy (wind power , photovoltaic power ) and imported coal is considered as a separable cost factor of production. Then, and are set to represent any energy source within the combination (), thereby deriving the Translog cost function.
In this context, and represent any two value measurements among the imported coal price , wind power price , and photovoltaic power price , respectively. and denote the corresponding parameters to be estimated. Moreover, the parameters of energy prices need to satisfy homogeneity constraints:
Subsequently, the partial derivatives of the Translog cost function with respect to energy prices are calculated:
According to Shepard’s lemma [32], introducing the variable , it is defined as:
Thus, the proportion of each energy cost in the total cost of the combination, represented by , can be expressed as:
Subsequently, the Allen Elasticity of Substitution is obtained:
From this, the price elasticity and the cross-price elasticity are calculated.
In which, represents the change in demand for energy due to the change in the price of energy . If denotes “absolute substitution elasticity”, then according to Hicks’ theory [33] on the definition of marginal substitution rates, the variable can be adjusted to obtain the “net substitution elasticity” of the MES model:
If can be interpreted as the “total effect”, then can represent the “income effect” and can represent the “substitution effect”. Based on this, three scenarios can be summarized:
Scenario 1—When < 0 and < 0, both AES and MES models indicate complementarity, indicating a complementary relationship between energy and energy .
Scenario 2—When < 0 and > 0, the AES model reflects complementarity, while the MES model reflects substitutability, indicating an uncertain relationship between energy and energy .
Scenario 3—When > 0 and > 0, both AES and MES models indicate substitutability, indicating a substitution relationship between energy and energy .
4. Analysis of Energy Substitution in International Circulation
4.1. Data Statistics
China joined the World Trade Organization (WTO) in 2001, which serves as the starting point for the study. Based on the principle of data availability, the coal trade information between China and major coal-trading countries from 2001 to 2021 will be used as the basis for the analysis. The data sources are as follows: data on the “Green Energy Index” are obtained from the World Bank (2022); data related to coal trade (trade value, trade volume, etc.) are obtained from the United Nations Comtrade Database (2022); the GPSspg website provides distance information between China and major coal-trading countries. Table 1 provides a descriptive analysis of the dependent and independent variables.
4.2. Results Analysis
Conduct an empirical analysis by incorporating sample data into the “trade gravity model of international circulation”.
- (1)
- The regulations governing the value of the imported coal trade in recipient countries.
Setting the value of the imported coal trade as the dependent variable, and with all models including two fixed effects (cross-sectional and time), the results of the panel data regression models are presented in Table 2. Employing the method of controlling variables, the operations executed are as follows: ① Model 1 introduces only the “green energy index” as the independent variable; ② Model 2 solely considers two categories of GDP variables as trade gravity norms; ③ Model 3 combines Model 1 and Model 2, considering three categories of variables as trade gravity norms; and ④ Model 4 conducts a comprehensive analysis by fitting all independent variables based on Model 3. The substitution relationship between Chinese renewable energy and imported coal is determined based on the fitted coefficient of the “green energy index”: ① In Model 1, assuming other factors are fixed, the increasing proportion of renewable energy production negatively impacts the value of coal trade at a significant level of 1%, suggesting that the continuous expansion of China’s renewable energy relative scale drives down the value of coal trade, manifesting a buffering effect between energy sources in terms of trade efficiency. However, Model 1 is overly idealized and fails to objectively reflect the complexity of the interactions between Chinese renewable energy and imported coal. ② In Models 3 and 4, the coefficient of the “green energy index” remains negative and statistically significant, indicating that, with the introduction of other explanatory variables such as the GDP of coal-importing and coal-exporting countries, the influence of the increasing proportion of renewable energy production on the value of coal trade remains unchanged, and within the complex system, the buffering effect of Chinese renewable energy on imported coal significantly strengthens. This also suggests that relatively open and orderly coal import and export trade, as well as energy prices’ signaling function, contribute to enhancing Chinese renewable energy buffering capacity.
- (2)
- The regulatory framework governing the trade volume of imported coal.
Setting the volume of imported coal trade, denoted as , as the dependent variable, and controlling for fixed cross-sectional and time effects, the results of the panel data regression model are presented in Table 3, with operations conducted as per Table 2. Judging the substitution relationship between Chinese renewable energy and imported coal based on the coefficient of the “green energy index”, we observe the following: ① In Model 5, the green energy index is negative and significant at the 1% level, indicating that the continuous expansion of China’s relative scale of renewable energy compels a continuous reduction in the volume of coal trade, reflecting a compensatory relationship between energy sources at the trade level. ② In Models 7 and 8, factors such as coal-exporting countries, China’s GDP, energy prices, and the proportion of renewable energy production are systematically considered and analyzed. The coefficient of the green energy index in models where the imported coal trade volume serves as the dependent variable undergoes slight changes, remaining negative at the 1% significance level. This suggests that, within a complex system, increasing the share of Chinese renewable energy reduces dependence on imported coal trade volume, and the enhanced compensatory relationship contributes to consolidating Chinese energy security. Consequently, Chinese renewable energy will serve as an effective substitute for imported coal.
Based on the results presented in Table 2 and Table 3, along with an analysis of their underlying causes, it is evident that, although Chinese renewable energy cannot be deemed a perfect substitute for imported coal at present, from an economic perspective (as opposed to a policy or technological standpoint), there exists a foundation for substitution within the framework of “international circulation”. This foundation primarily manifests itself in two aspects: Firstly, concerning the potential for renewable energy development, China’s current utilization of renewable energy accounts for less than 10% of its technically feasible capacity [34]. Furthermore, the international costs associated with renewable energy have significantly decreased, with the costs of wind and photovoltaic power in China now standing at one-tenth of their levels a decade ago, thereby providing a certain cost advantage in the global energy market [35]. Secondly, uncertainties in the international landscape and geopolitical upheavals can lead to global energy crises [36]. Additionally, intermittent export bans imposed by coal trading partner countries, and fluctuations in international coal prices, can further amplify Chinese demand for renewable energy as a substitute for imported coal [37,38].
Furthermore, upon comparison of the results presented in Table 2 and Table 3, it is evident that the coefficients between coal-exporting countries’ GDP and China’s GDP are largely non-significant. This counterintuitive scenario may stem from three reasons: Firstly, the current unique nature of the international coal market may inadequately reflect the elasticity of coal demand trade among countries, where international coal prices and coal import volumes are influenced by specific arrangements, thereby resulting in a weak correlation between coal trade and national GDP [39,40]. Secondly, China’s coal medium- to long-term trade contracts are not easily altered by changes in the economic conditions of importing and exporting countries, thereby demonstrating a certain degree of stability [41]. Lastly, systematic errors in econometrics could be another possible reason for this outcome.
- (3)
- The norms governing coal trade per unit of GDP in importing countries.
The coal trade value per unit of GDP, denoted as , of the importing country is used as a dependent variable. Table 4 and Table 5 display the regression results with China (the importing country), with the unit of GDP for coal trade value and coal trade volume, respectively, as the dependent variables; and the independent variables are operated as in Table 2. Overall, the coefficients presented in the results exhibit similar directional effects to those shown in Table 2, with the significance levels of the coefficients for the GDP of the importing and exporting countries being largely consistent. The indicators of renewable energy proportion have a negative impact effect on the coal trade value and volume per unit of GDP (at the 1–5% significance level), and both are statistically significant, indicating that the continuous expansion of China’s renewable energy relative scale can also demonstrate buffering and compensatory effects among energy sources in terms of trade behavior and trade performance.
Based on the improved gravity trade model as a foundation and employing four normative-fit regression paradigms, the analysis yields several key findings: ① The sustained development of Chinese renewable energy in China contributes to the stabilization and improvement of energy security strategies within the framework of international circulation. ② From the perspective of trade efficiency, trade volume, trade behavior, and trade performance, Chinese renewable energy exhibits significant buffering effects on imported coal. ③ The ability to substitute renewable energy for conventional energy can be enhanced by a relatively open economy, coupled with energy prices that have signaling capabilities. Currently, there is a contradiction between “energy security” and “economy and sustainability”. A high-quality energy sector can only be developed by prioritizing energy security as a strategic imperative.
5. Analysis of Chinese Circulation Energy Substitution
5.1. Data Processing
The “Tenth Five-Year Plan” period (2001–2005) marked the initial stage of development of renewable energy in China. Taking into full consideration the institutional performance of the “supply-side structural reform” and ensuring the broad statistical significance of the data, the year 2000 was designated as the base year (i.e., the reference baseline for changes). Accordingly, relevant energy statistical data from 2001 to 2021 were selected for empirical research.
- (1)
- The data on energy shares () are obtained from the China coal import volume provided by the United Nations Commodity Trade Statistics Database (2022). The data on wind power generation and photovoltaic power generation are sourced from the “China Electric Power Yearbook (2022)”, the China Electricity Council, and publicly available information from the National Bureau of Statistics. These three sets of data are converted into tons of coal equivalent (tce) for measurement purposes and then aggregated. Each energy source’s proportion is calculated as follows: , , and .
- (2)
- Energy prices () play a pivotal role in this context. By referencing BP Energy Statistical Data (2021) and incorporating historical exchange rate adjustments, the price of imported coal can be determined. Subsequently, leveraging data from the annual China Electricity Yearbook over the years and information released by the National Bureau of Statistics website and the China Electricity Council (2022), the nationwide average on-grid prices of renewable energy can be compiled and calculated. Specifically, the prices for wind power generation () and solar power generation () are obtained, and conversions are made according to “tce/CNY 10,000”.
- (3)
- Energy costs () are computed based on data pertaining to energy prices and energy production, with the results standardized to the unit of “ten thousand CNY”.
Based on statistical data and the objective requirements of the “price elasticity model of Chinese circulation”, the logarithmic price indices and cost proportions of the three types of energy are calculated, as presented in Table 6. At this point, the sum of , , and equals 1.
Utilizing EViews 10.0 software, an econometric analysis was conducted based on the data presented in Table 6. To mitigate the potential for data spuriousness, unit root tests were performed on the dataset, as indicated in Table 7. The results of the stationarity tests demonstrate the statistical significance of the data for further analysis.
Using the Johansen cointegration test, we examined the potential for spurious regression in the causal relationships described by the regression equation, with the results outlined in Table 8. The cointegration test results indicate a stable relationship between the logarithm of the price index and the cost ratio.
The Translog cost function deviates from traditional econometric models in its analytical approach. Consequently, ordinary least squares (OLS) can be directly employed for parameter estimation, as depicted in Table 9.
5.2. Analysis of Results
According to the AES model and the MES model, the self-price elasticity, absolute price elasticity, and net price elasticity of three energy sources, including imported coal, Chinese wind power generation, and Chinese photovoltaic power generation in China from 2001 to 2021, are calculated, as shown in Table 10 and Table 11.
- (1)
- The Price Elasticity of Energy Supply
From 2000 to 2021 (inclusive of the base year), the trends in the price elasticity of imported coal, Chinese wind power generation, and Chinese photovoltaic (PV) power generation in China are illustrated in Figure 2: ① The fluctuation of price elasticity for imported coal remains relatively stable, while the price elasticity of Chinese wind power generation exhibits significant variability, and that of Chinese photovoltaic power generation shows even more pronounced fluctuations. ② The fluctuation range of price elasticity for imported coal lies between −0.1359 and 0.10073, with an amplitude of 0.23663; the fluctuation range of price elasticity for Chinese wind power generation ranges from 1.1368 to 7.3977, with an amplitude of 6.2609; and the fluctuation range of price elasticity for Chinese photovoltaic power generation ranges from −132.17 to −2.482, with an amplitude of 134.652. Furthermore, during the period from 2000 to 2015, photovoltaic power generation was notably influenced by price factors, exhibiting significant fluctuations, whereas after 2015, Chinese photovoltaic power generation’s price elasticity stabilized. ③ With a few exceptions in individual years, both the price elasticity of imported coal and Chinese photovoltaic power generation are negative, indicating them as “normal goods”. However, there are disparities between the two: the price elasticity of imported coal exhibits a relatively stable fluctuation trend, while that of Chinese photovoltaic power generation displays an extremely sensitive fluctuation trend. The effect of energy prices on Chinese photovoltaic power generation is stronger than on imported coal; thus, the impact of price changes on Chinese photovoltaic power generation demand is more significant. ④ The long-term price elasticity of Chinese wind power generation is positive, indicating that it does not fall under the category of “normal goods” in the current Chinese factor market. This might be attributed to the evident policy dependency of the Chinese wind power generation industry, leading to phenomena that do not align with market norms [42]. However, post-2010, a significant downward trend in Chinese wind power generation price elasticity can be observed.
- (2)
- Absolute Price Elasticity of Energy
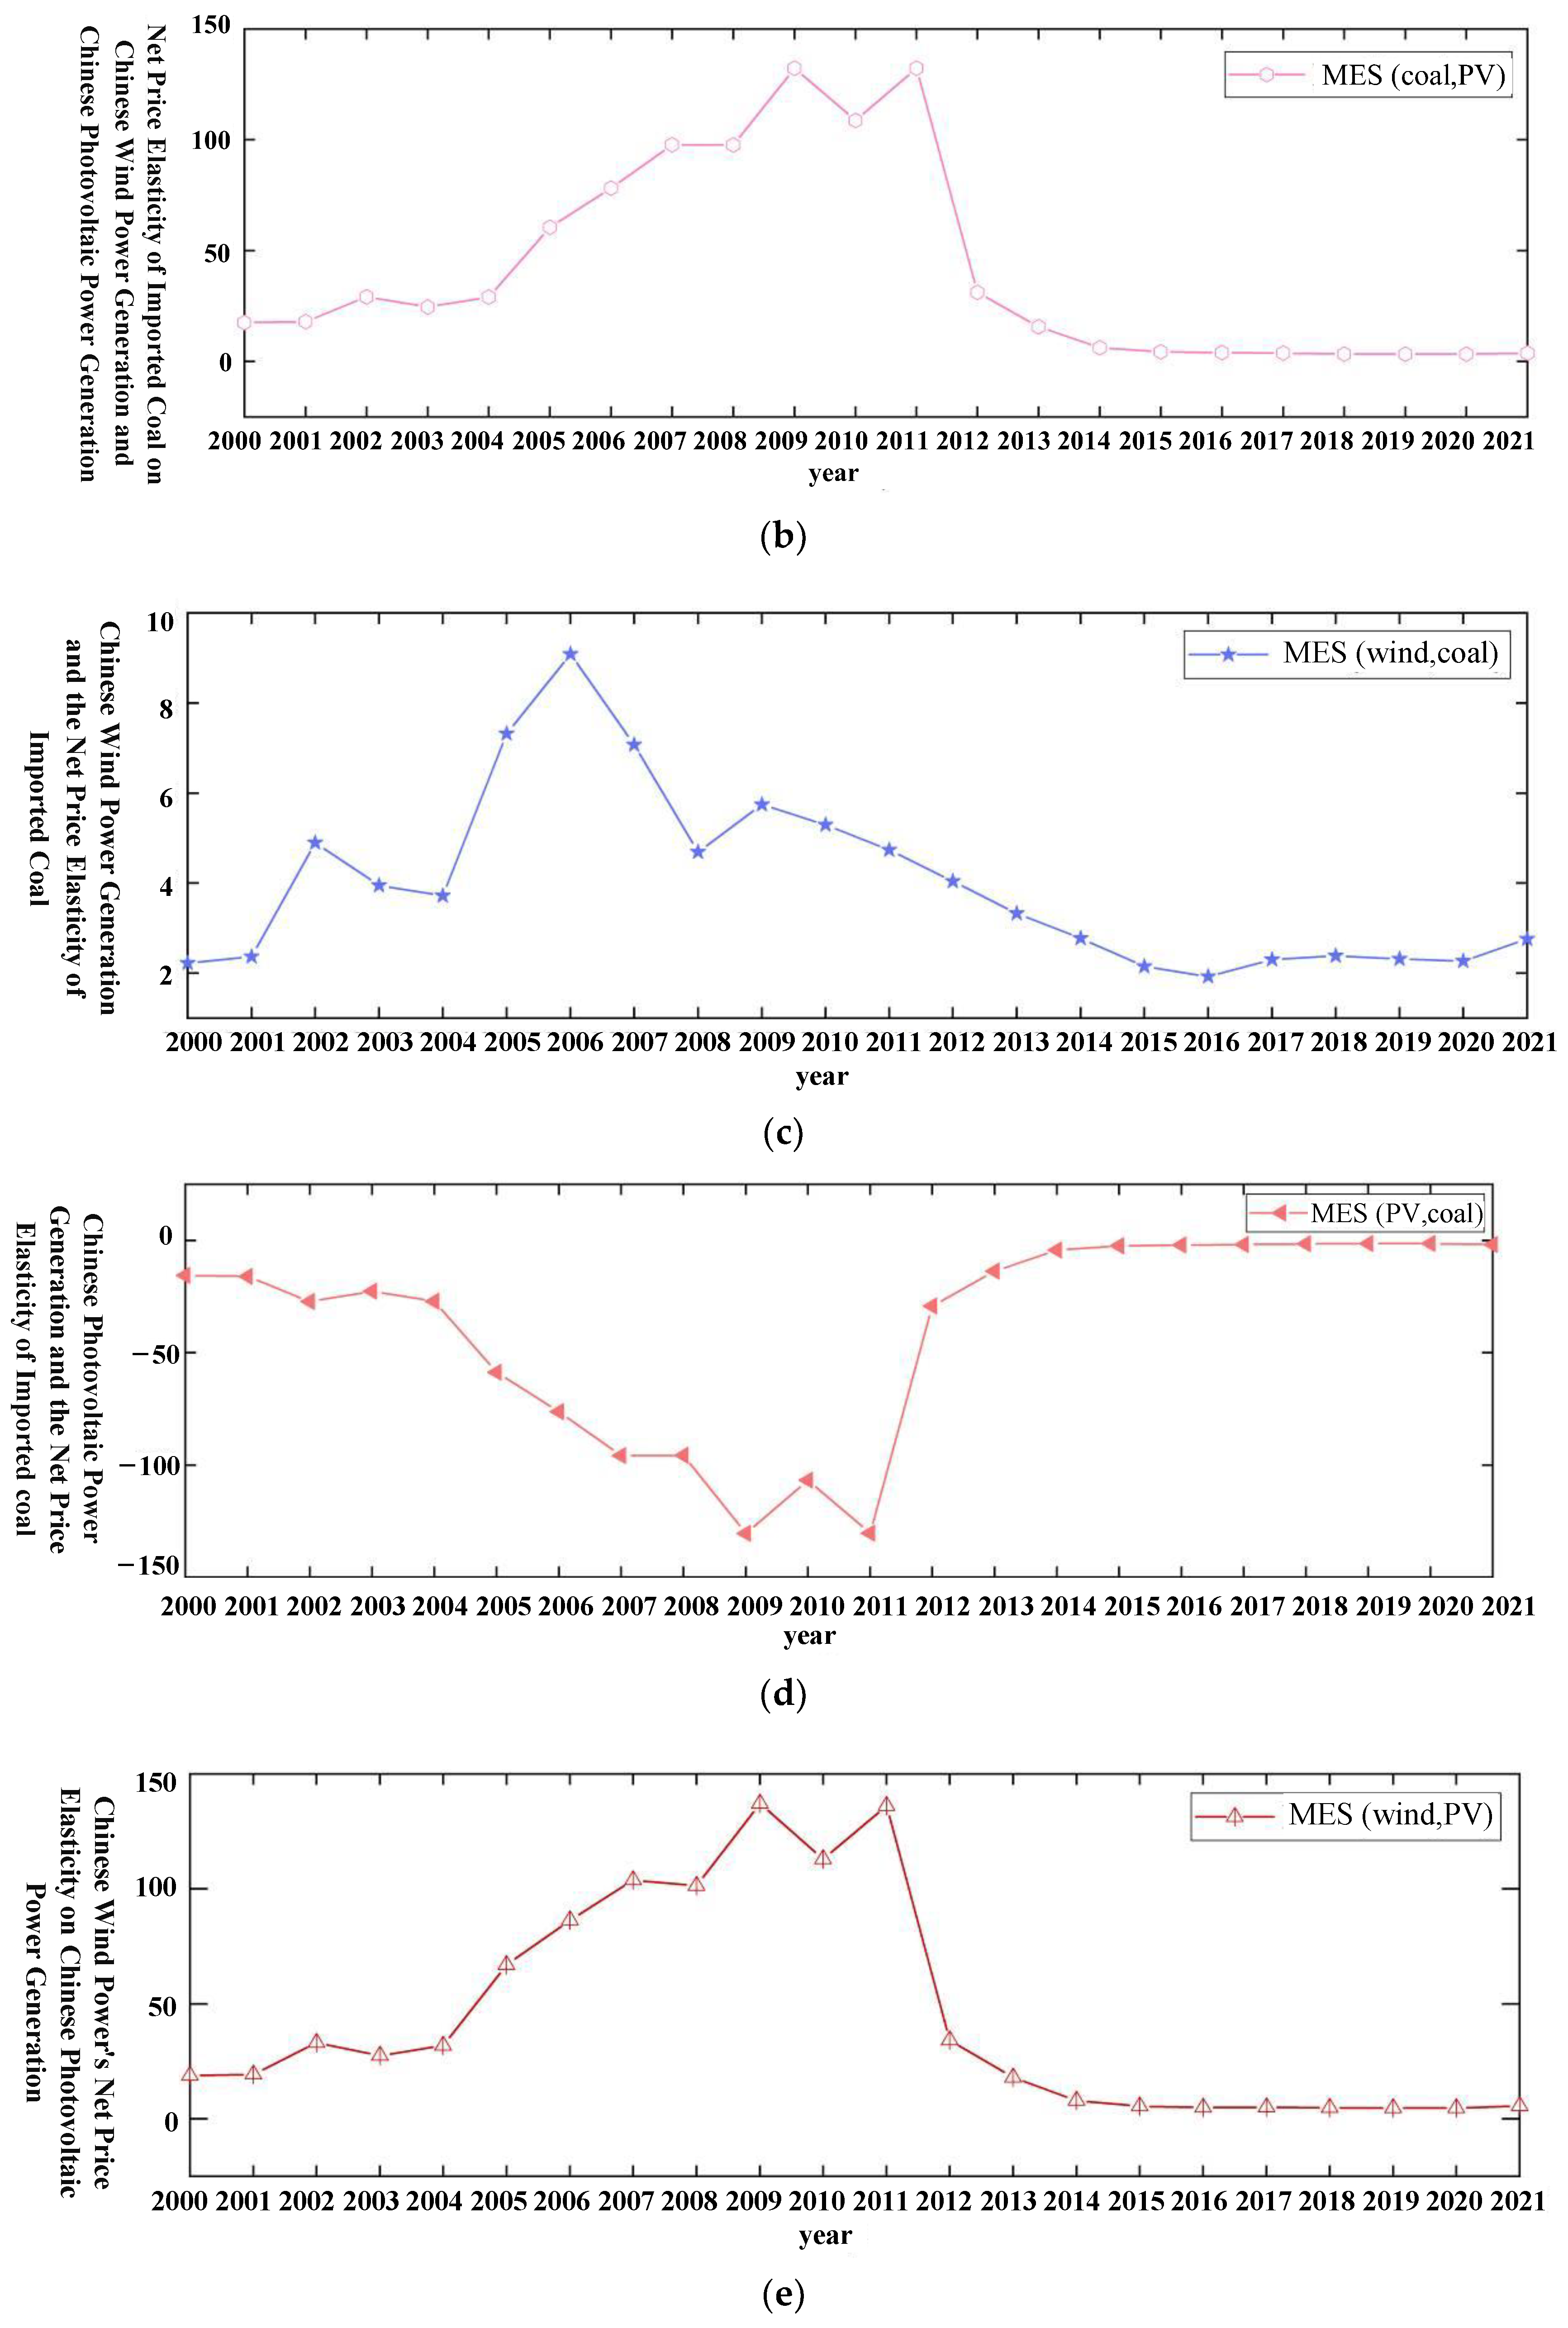
From 2000 to 2021 (including the base year), the absolute price elasticity trends of imported coal, Chinese wind power generation, and Chinese photovoltaic power generation in China are illustrated in Figure 3: ① When the price of imported coal changes, the quantity of imported coal changes inversely, while the quantity of Chinese wind power generation changes in the same direction. At this point, the positive absolute price elasticity reflects the substitutability of imported coal for Chinese wind power generation. When the price of Chinese wind power generation changes, the quantity of Chinese wind power generation changes in the same direction, and the quantity of imported coal also changes in the same direction. Here, the positive absolute price elasticity indicates Chinese wind power generation’s substitutability for imported coal. The impact of changes in the price of Chinese wind power generation on the absolute quantity of imported coal (ranging from 0.31 to 1.21) is significantly greater than the impact of changes in the price of Chinese photovoltaic power generation on the absolute quantity of imported coal (ranging from 0.19 to 0.84). ② When the price of imported coal changes, the quantity changes inversely. In contrast, the quantity of Chinese photovoltaic power generation changes in the same direction. At this point, the positive absolute price elasticity reflects the substitutability of imported coal for Chinese photovoltaic power generation. When the price of Chinese photovoltaic power generation changes, the quantity of imported coal changes inversely. Here, the negative absolute price elasticity reflects the complementary nature of Chinese photovoltaic power generation to imported coal. However, since 2016, Chinese photovoltaic power generation has shown a trend of substitutability for imported coal. ③ When the price of Chinese photovoltaic power generation changes, the quantity of Chinese photovoltaic power generation changes inversely, while the quantity of Chinese wind power generation changes in the same direction. Here, the positive absolute price elasticity reflects the substitutability of Chinese photovoltaic power generation for Chinese wind power generation. When the price of Chinese wind power generation changes, the quantity of Chinese wind power generation changes in the same direction, while the quantity of Chinese photovoltaic power generation changes inversely. Here, the negative absolute price elasticity reflects the complementary nature of Chinese wind power generation to Chinese photovoltaic power generation. Chinese wind power generation consistently substitutes for Chinese photovoltaic power generation. However, this substitution effect significantly weakened in 2009 and continued thus until 2021. Chinese photovoltaic power generation exhibits a complementary effect on Chinese wind power generation, but since 2011, this complementarity has sharply decreased, with a subsequent tendency to plateau.
- (3)
- Net Substitution Elasticity of Energy Resources
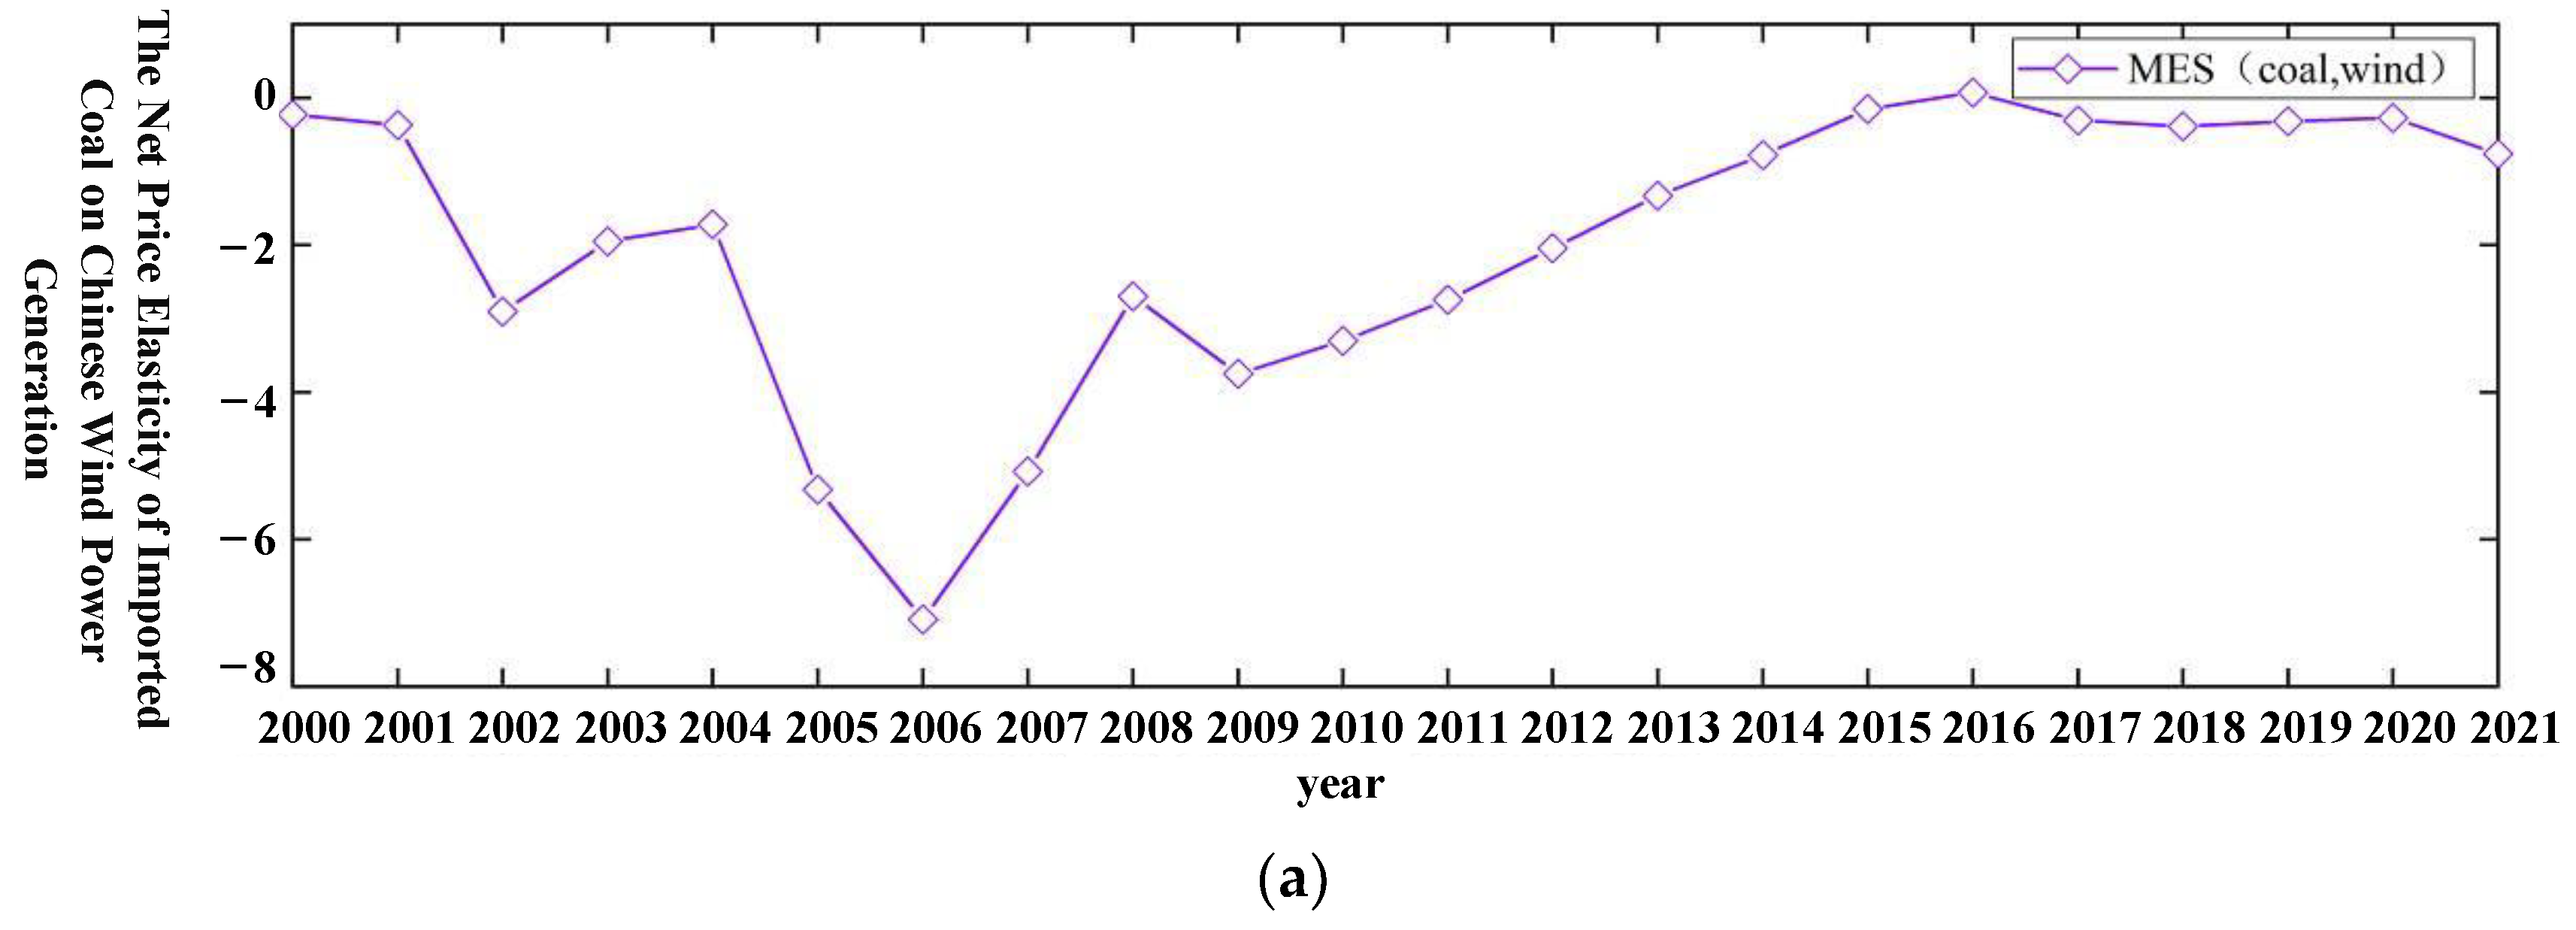
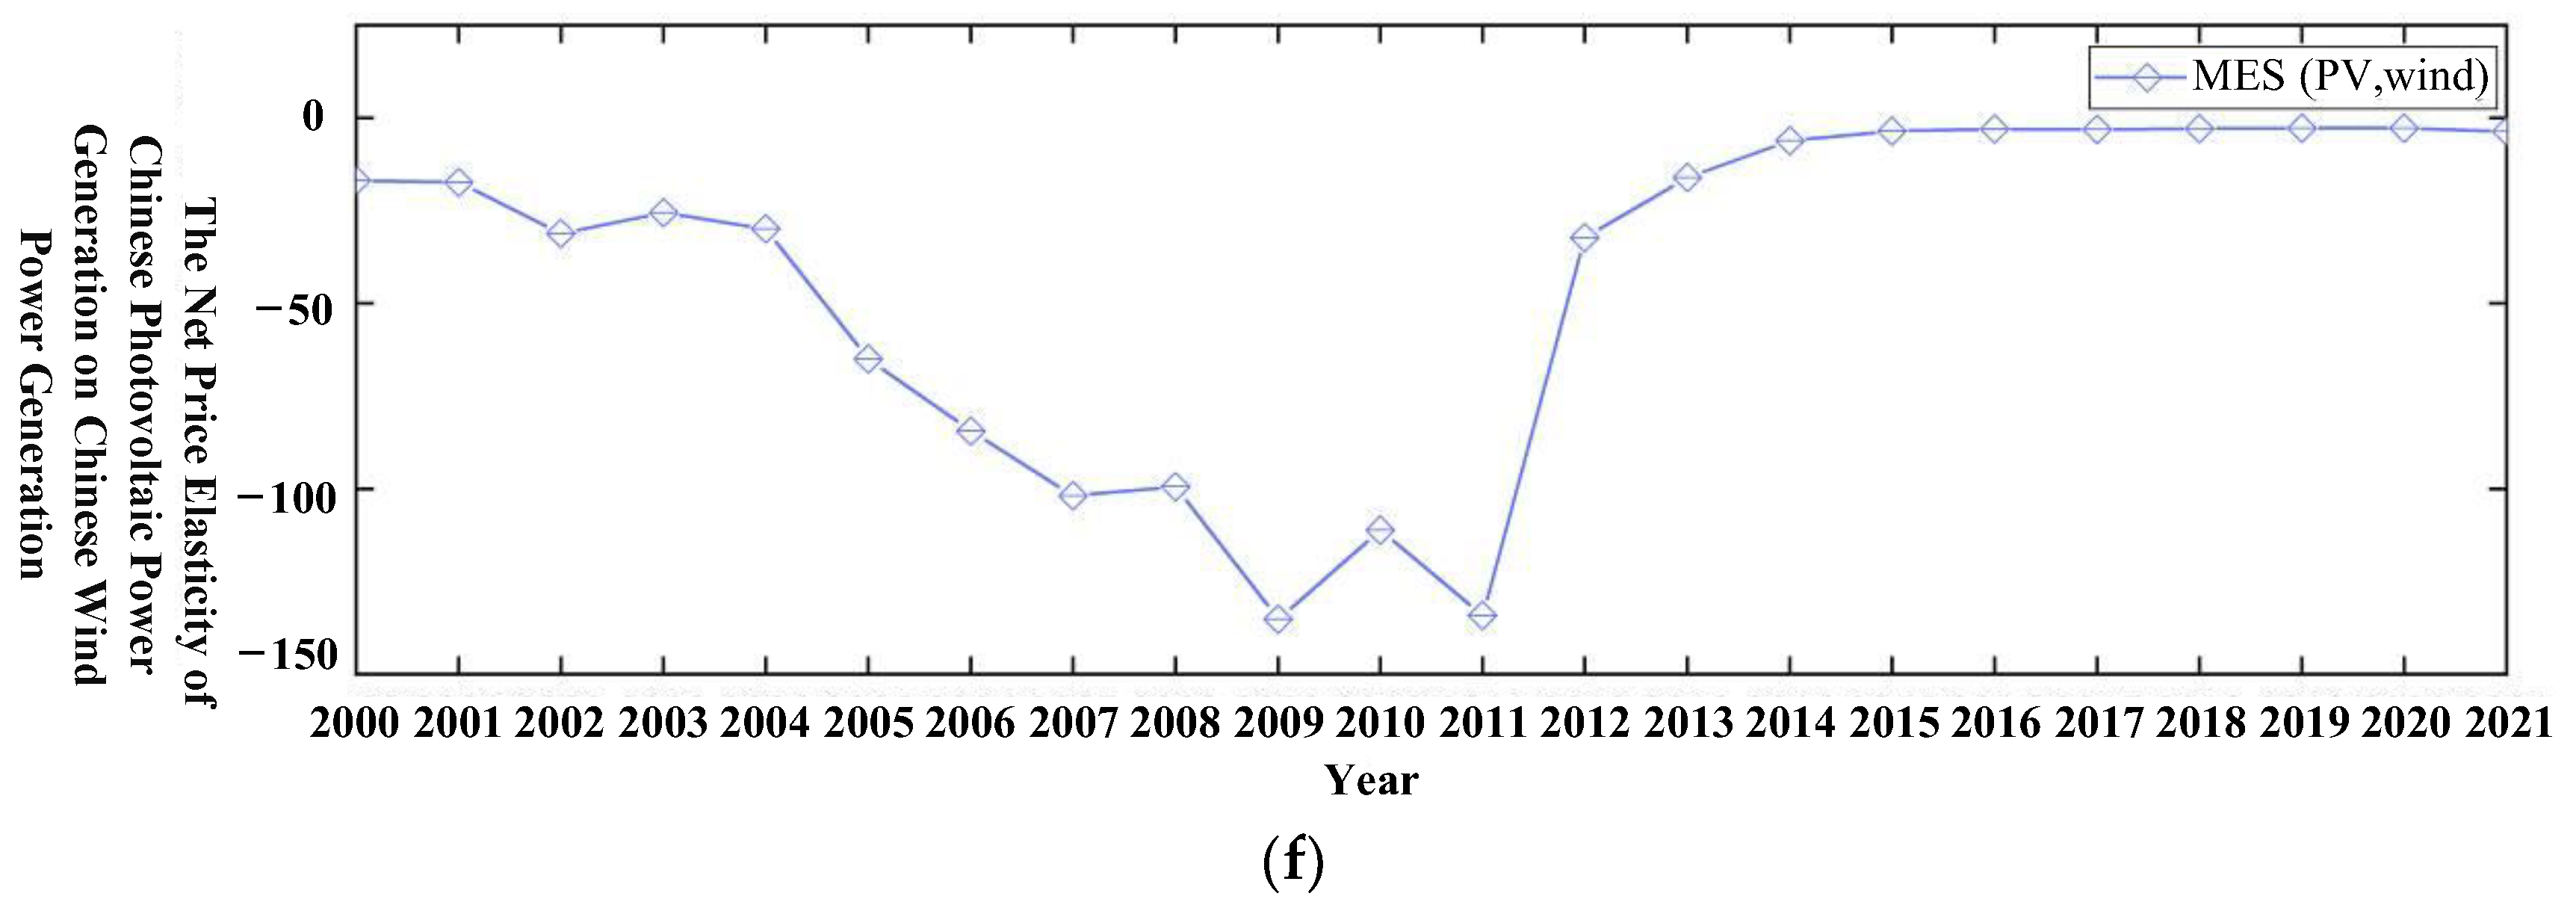
The net price elasticity trends of imported coal, Chinese wind power generation, and Chinese photovoltaic power generation in China from 2000 to 2021 (including the base year) are illustrated in Figure 4. A comparative analysis between Figure 3b,c and Figure 4c,d reveals that the changes in net price elasticity of Chinese wind power generation and Chinese photovoltaic power generation induced by fluctuations in imported coal prices are similar to the effects of absolute price elasticity changes. This suggests that, in the face of external shocks caused by fluctuations in imported coal prices, the net and absolute substitution effects of Chinese wind power generation with respect to imported coal tend to align, as do the net and absolute complementary effects of Chinese photovoltaic power generation. The long-term analysis from Table 11 indicates that Chinese wind power generation exhibits a relatively significant substitution effect towards imported coal, whereas the complementary effect of Chinese photovoltaic power generation with respect to imported coal is more pronounced. However, as indicated by Figure 4d, the relationship between Chinese photovoltaic power generation and imported coal is shifting towards substitutability, suggesting that Chinese-produced photovoltaic power is increasingly likely to become a strong substitute for imported coal.
6. Conclusions and Policy Implications
In response to energy security issues within the “dual circulation” strategy, the focus has been on the substitution relationship between Chinese renewable energy and imported coal. This has led to the development of an integrated assessment methodology, comprising an international circular trade gravity model and a Chinese circular price elasticity model. Through empirical research, China’s current energy substitution security status has been interpreted. The main conclusions are summarized as follows:
Firstly, Chinese renewable energy does indeed exert a buffering effect on imported coal across dimensions such as trade efficiency, scale, behavior, and performance. Among these, energy trade prices play a directly instructive role in this buffering function, whereas the economy’s efficiency-enhancing effect operates indirectly. Within the international cycle, China’s continuous expansion of renewable energy effectively reduces trade dependency on imported coal. Moreover, when the economic system is relatively open and orderly, and energy trade prices serve as signaling mechanisms, Chinese renewable energy’s ability to substitute for imported coal is enhanced. However, this improved capability primarily manifests itself as a buffering effect. Chinese renewable energy can substitute for Chinese fossil energy, and this process should be promoted in an orderly and steady fashion. Simultaneously, this also provides evidence supporting the necessity for and feasibility of China’s utilization of renewable energy for achieving “carbon neutrality” and energy transition.
Secondly, from the perspective of absolute price elasticity and net price elasticity, although Chinese wind power is considered a substitute for imported coal, its own price elasticity confirms that Chinese wind power does not belong to the category of “normal commodities”. Under the premise of other conditions being fixed, Chinese wind power and imported coal are substitutes for each other, and energy prices can serve as effective levers for signaling purposes at this time. In the long term, Chinese wind power substitutes for imported coal in a significant way, and Chinese wind power exhibits increased sensitivity. This indicates that, within the Chinese circulation framework, China’s renewable energy (especially wind power) has enormous development potential. However, it is worth noting that there are certain distortions in both the quantity and price of Chinese wind power, and its industrial scale has not yet reflected market-oriented development expectations, which may even lead to inefficiencies in future energy industry structural adjustments.
Additionally, Chinese photovoltaic power generation exhibits the characteristics of a “normal commodity”, but this complementary relationship has weakened in recent years, showing a tendency toward substitution. Long-term, Chinese photovoltaic power generation has a more pronounced complementary effect on imported coal. Based on absolute price elasticity and net price elasticity, imported coal has the attributes of a substitute for Chinese photovoltaic power generation, whereas Chinese photovoltaic power generation exhibits the attributes of a complement. Two issues are also simultaneously supported by this result: on the one hand, the Chinese photovoltaic power generation industry is currently able to achieve large-scale operations that are market-oriented; on the other hand, even though photovoltaic (PV) systems do not directly utilize fossil energy during the process of electricity generation, the entire lifecycle of PV electricity generation is considered. In addition to the production of physical materials, transportation, construction, and end-of-life disposal and recycling, the PV industry involves various phases. As a result of these stages, carbon emissions may be emitted directly or indirectly. Therefore, at a macro level, the development of the PV industry may encounter the energy “green paradox” or carbon emissions “rebound effect”. In light of this, it is evident that the expansion of renewable energy technologies within broader sustainability frameworks may have unintended consequences and complexities.
Based on these findings, the following policy recommendations are suggested: Regarding energy security in the international community, imported fossil fuels (coal) should be given adequate attention, but excessive anxiety is unnecessary. Continually enhancing economic openness and securing a voice in international energy pricing are equally important for the overall development of a high-quality Chinese energy system. Wind and photovoltaic energy have begun to take shape in the Chinese renewable energy industry, and the implementation of the “carbon neutral” energy transformation strategy and the “dual circulation” strategy has further enhanced their significance. While correct policy guidance is essential, the timely utilization of energy market mechanisms should also be considered; over-protection of the industry is not a sustainable solution. Moreover, attention should be paid to the coordinated development of upstream, midstream, and downstream industries in the Chinese renewable energy sector, assisting in establishing internal energy circulation and ultimately reshaping the Chinese energy supply structure to meet the requirements of high-quality economic and social development at the present stage.
During the research process, several obstacles and unresolved issues have persisted. Firstly, the lack of a unified statistical framework for wind power, photovoltaics, and imported coal data from various countries is a key constraint on the research. Despite efforts to collect, organize, and cross-validate data from multiple sources, quantitative analysis results sacrifice some precision. Additionally, due to data gaps related to events such as the “Russia-Ukraine war” and the “US-China trade war”, this study did not address discussions of the trend towards deglobalization. Secondly, “technological progress” is a significant factor affecting substitution capability, and feasibility at the technological level may be more critical than economic or institutional feasibility. Moreover, due to the “rebound effect”, substitution effects between energy sources may be weakened. However, these aspects were not fully reflected in the research process, partly due to research objectives and model selection. Future research endeavors will endeavor to address these shortcomings and further enhance discussions on energy security issues within the framework of the “dual circulation” strategy.
Author Contributions
P.L. and K.G. designed the experiment, collected data, prepared the manuscript, and conducted data analysis; P.L. corrected the language of the manuscript and provided the final approval; J.W. provided technical support and valuable suggestions in experiment design. All authors have read and agreed to the published version of the manuscript.
Funding
This paper was supported by the National Natural Science Foundation of China (No.72103128). Funder: Pingkuo Liu, Funding number: No. 72103128.
Institutional Review Board Statement
Not applicable.
Informed Consent Statement
Not applicable.
Data Availability Statement
The initial data of the dissertation mainly came from the Project Research (No.72103128). Some data have confidentiality agreements. Except for the data mentioned in the dissertation that can be disclosed, other data cannot be disclosed due to confidentiality issues.
Conflicts of Interest
The authors declare no conflicts of interest.
References
- Shi, X.L.; Wei, X.X.; Yang, C.H.; Mah, L.; Liy, P. Problems and countermeasures for construction of China’s salt cavern type strategic oil storage. Bull. Chin. Acad. Sci. 2023, 38, 99–111. (In Chinese) [Google Scholar]
- Gao, Y.; Wang, B.; Hu, Y.D.; Gao, Y.J.; Hu, A.L. Development of China’s natural gas: Review 2023 and outlook 2024. Nat. Gas Ind. 2024, 44, 166–177. (In Chinese) [Google Scholar]
- National Energy Administration. The Total Installed Capacity of Renewable Energy Generation in China Has Exceeded 1.4 Billion Kilowatts, Accounting for Nearly 50%[EB/OL]. Available online: https://www.nea.gov.cn/2023-11/30/c_1310753052.htm (accessed on 30 November 2023).
- Berndt, E.R.; Wood, D.O. Technology, Prices, and the Derived Demand for Energy. Rev. Econ. Stat. 1975, 57, 259–268. [Google Scholar] [CrossRef]
- Fuss, M.A. The demand for energy in Canadian manufacturing: An example of the estimation of production structures with many inputs. J. Econom. 1977, 5, 89–116. [Google Scholar] [CrossRef]
- Pindyck, R.S. Interfuel substitution and the industrial demand for energy: An international comparison. Rev. Econ. Stat. 1979, 61, 169–179. [Google Scholar] [CrossRef]
- Magnus, J.R. Substitution between energy and non-energy inputs in The Netherlands 1950–1976. Int. Econ. Rev. 1979, 20, 465–484. [Google Scholar] [CrossRef]
- Uri, N.D. Energy demand and interfuel substitution in India. Eur. Econ. Rev. 1979, 12, 181–190. [Google Scholar] [CrossRef]
- Ma, H.; Oxley, L.; Gibson, J.; Kim, B. China’s energy economy: Technical change, factor demand and interfactor/interfuel substitution. Energy Econ. 2008, 30, 2167–2183. [Google Scholar] [CrossRef]
- Smyth, R.; Narayan, P.K.; Shi, H. Inter-fuel substitution in the Chinese iron and steel sector. Int. J. Prod. Econ. 2012, 139, 525–532. [Google Scholar] [CrossRef]
- Zha, D.; Ding, N. Elasticities of substitution between energy and non-energy inputs in China power sector. Econ. Model. 2014, 38, 564–571. [Google Scholar] [CrossRef]
- Xie, C.; Hawkes, A.D. Estimation of inter-fuel substitution possibilities in China’s transport industry using ridge regression. Energy 2015, 88, 260–267. [Google Scholar] [CrossRef]
- Stern, D.I. Interfuel substitution a meta-analysis. J. Econ. Surv. 2012, 26, 307–331. [Google Scholar] [CrossRef]
- Hal, V.B. Major OECD. country industrial sector interfuel substitution estimates: 1960–79. Energy Econ. 1986, 8, 74–89. [Google Scholar] [CrossRef]
- Taheri, A.A. Oil shocks and the dynamics of substitution adjustments of industrial fuels in the US. Appl. Econ. 1994, 26, 751–756. [Google Scholar] [CrossRef]
- Bello, M.O.; Solarin, S.A.; Yen, Y.Y. Hydropower and potential for interfuel substitution: The case of electricity sector in Malaysia. Energy 2018, 151, 966–983. [Google Scholar] [CrossRef]
- Jones, C.T. The role of biomass in US industrial interfuel substitution. Energy Policy 2014, 69, 122–126. [Google Scholar] [CrossRef]
- Solarin, S.A.; Bello, M.O. Interfuel substitution, biomass consumption, economic growth, and sustainable development: Evidence from Brazil. J. Clean. Prod. 2019, 211, 1357–1366. [Google Scholar] [CrossRef]
- Smyth, R.; Narayan, P.K.; Shi, H.L. Substitution between energy and classical factor inputs in the Chinese steel sector. Appl. Energy 2011, 88, 361–367. [Google Scholar] [CrossRef]
- Huang, X.G.; Lin, B.Q. Research on Substitution of Capital Energy in Chinese Industrial Sectors: A Meta-Analytic Perspective. Financ. Res. 2011, 6, 86–96. (In Chinese) [Google Scholar]
- Lin, B.Q.; Wesseh, P.K., Jr. Estimates of inter-fuel substitution possibilities in Chinese chemical industry. Energy Econ. 2013, 40, 560–568. [Google Scholar] [CrossRef]
- Zha, D.L.; Zhou, D.Q. The elasticity of substitution and the way of nesting CES production function with emphasis on energy input. Appl. Energy 2014, 130, 793–798. [Google Scholar] [CrossRef]
- Guo, Y.; Li, J.Y. Research on the Substitution Effect of New Energy for Fossil Energy in China. Renew. Energy 2018, 36, 762–770. (In Chinese) [Google Scholar]
- Cisternas, L.A.; Ordóñez, J.I.; Jeldres, R.I.; Serna-Guerrero, R. Toward the Implementation of Circular Economy Strategies: An Overview of the Current Situation in Mineral Processing. Miner. Process. Extr. Metall. Rev. 2022, 43, 775–797. [Google Scholar] [CrossRef]
- Mitko, K.; Turek, M.; Jaroszek, H.; Bernacka, E.; Sambor, M.; Skóra, P.; Dydo, P. Pilot studies on circular economy solution for the coal mining sector. Water Resour. Ind. 2021, 26, 100161. [Google Scholar] [CrossRef]
- Markevych, K.; Maistro, S.; Koval, V.; Paliukh, V. Mining sustainability and circular economy in the context of economic security in Ukraine. Min. Miner. Depos. 2022, 16, 101–113. [Google Scholar] [CrossRef]
- Feng, F. Analysis of Driving Factors of Energy Consumption in China and Insights into Promoting the Development of ‘Dual Circulation’. Chin. Energy 2021, 43, 21–27+43. (In Chinese) [Google Scholar]
- An, H.Y. Research on the Current Status and Issues of China’s Renewable Energy Substituting Fossil Fuels. North. Econ. 2019, 4, 52–54. (In Chinese) [Google Scholar]
- Zhang, H.M. Energy Security and Coal Industry Development Under the New Pattern of ‘Dual Circulation’. Coal Econ. Res. 2020, 40, 1. (In Chinese) [Google Scholar]
- Freeman, R.; Lewis, J. Gravity model estimates of the spatial determinants of trade, migration, and trade-and-migration policies. Econ. Lett. 2021, 204, 109873. [Google Scholar] [CrossRef]
- Liu, P.K.; Wang, M.B.; Chen, B. Orderliness of China’s Power Generation Industry Development: An Empirical Study Based on Inter-provincial Layout and Industrial Organization. Syst. Eng. Theory Pract. 2018, 38, 1445–1464. (In Chinese) [Google Scholar]
- Fuchs, S.S. A further remark on Shephard’s Lemma. Econ. Lett. 1997, 56, 359–365. [Google Scholar] [CrossRef]
- Mukoyama, T. In defense of the Kaldor-Hicks criterion. Econ. Lett. 2023, 224, 111031. [Google Scholar] [CrossRef]
- Cai, H.X.; Cheng, X.L. Evaluation of Regional Energy Efficiency in China from the Perspective of Renewable Energy: Based on the Indivisible Mixed DEA Model. Soft Sci. 2022, 36, 7. (In Chinese) [Google Scholar]
- Liu, P.K.; Chu, P.H. Renewables finance & investment: How to improve industry with private capital in China. J. Mod. Power Syst. Clean Energy 2019, 7, 1385–1398. [Google Scholar]
- Han, L.Q. The New Situation of International Energy Security Under the Changes of the Century. Contemporary International Relations 2022, 9, 1–9+33. (In Chinese) [Google Scholar]
- Valck, J.D.; Williams, G.; Kuik, S. Does coal mining benefit local communities in the long run? A sustainability perspective on regional Queensland, Australia. Resour. Policy 2021, 71, 102009. [Google Scholar] [CrossRef]
- Guo, Y.Z. Research on the Impact of Sanction Policies on Australian Coal Prices. Price Mon. 2022, 3, 1–8. (In Chinese) [Google Scholar] [CrossRef]
- Lei, Q. Research on the Relationship between International Coal Prices and China’s Coal Imports and Exports. Price Mon. 2013, 11, 31–36. (In Chinese) [Google Scholar]
- Ma, Z.; Zhang, T.G. Research on the Impact of International Coal Price Fluctuations on the Domestic Coal Market. Chin. Foreign Energy 2022, 27, 10–16. (In Chinese) [Google Scholar]
- Zhang, Z.F.; Yang, Q.L.; Wang, Y.J.; Liu, P. The Position and Strategy of China in Establishing Pricing Power in the International Coal Market: Based on the Analysis of the ‘Core-Periphery’ Structure of the Trade Network. Learn. Pract. 2015, 7, 39–46. (In Chinese) [Google Scholar] [CrossRef]
- Wu, Y.; Bian, Y.M. Research on China’s Wind Power Grid-Connected Electricity Price Subsidy Policy from the Perspective of the World Trade Organization (WTO). Macroecon. Res. 2013, 10, 40–46. (In Chinese) [Google Scholar] [CrossRef]
Figure 1.
The analytical framework for an energy substitution relationship within the context of “dual circulation” energy security.
Figure 1.
The analytical framework for an energy substitution relationship within the context of “dual circulation” energy security.
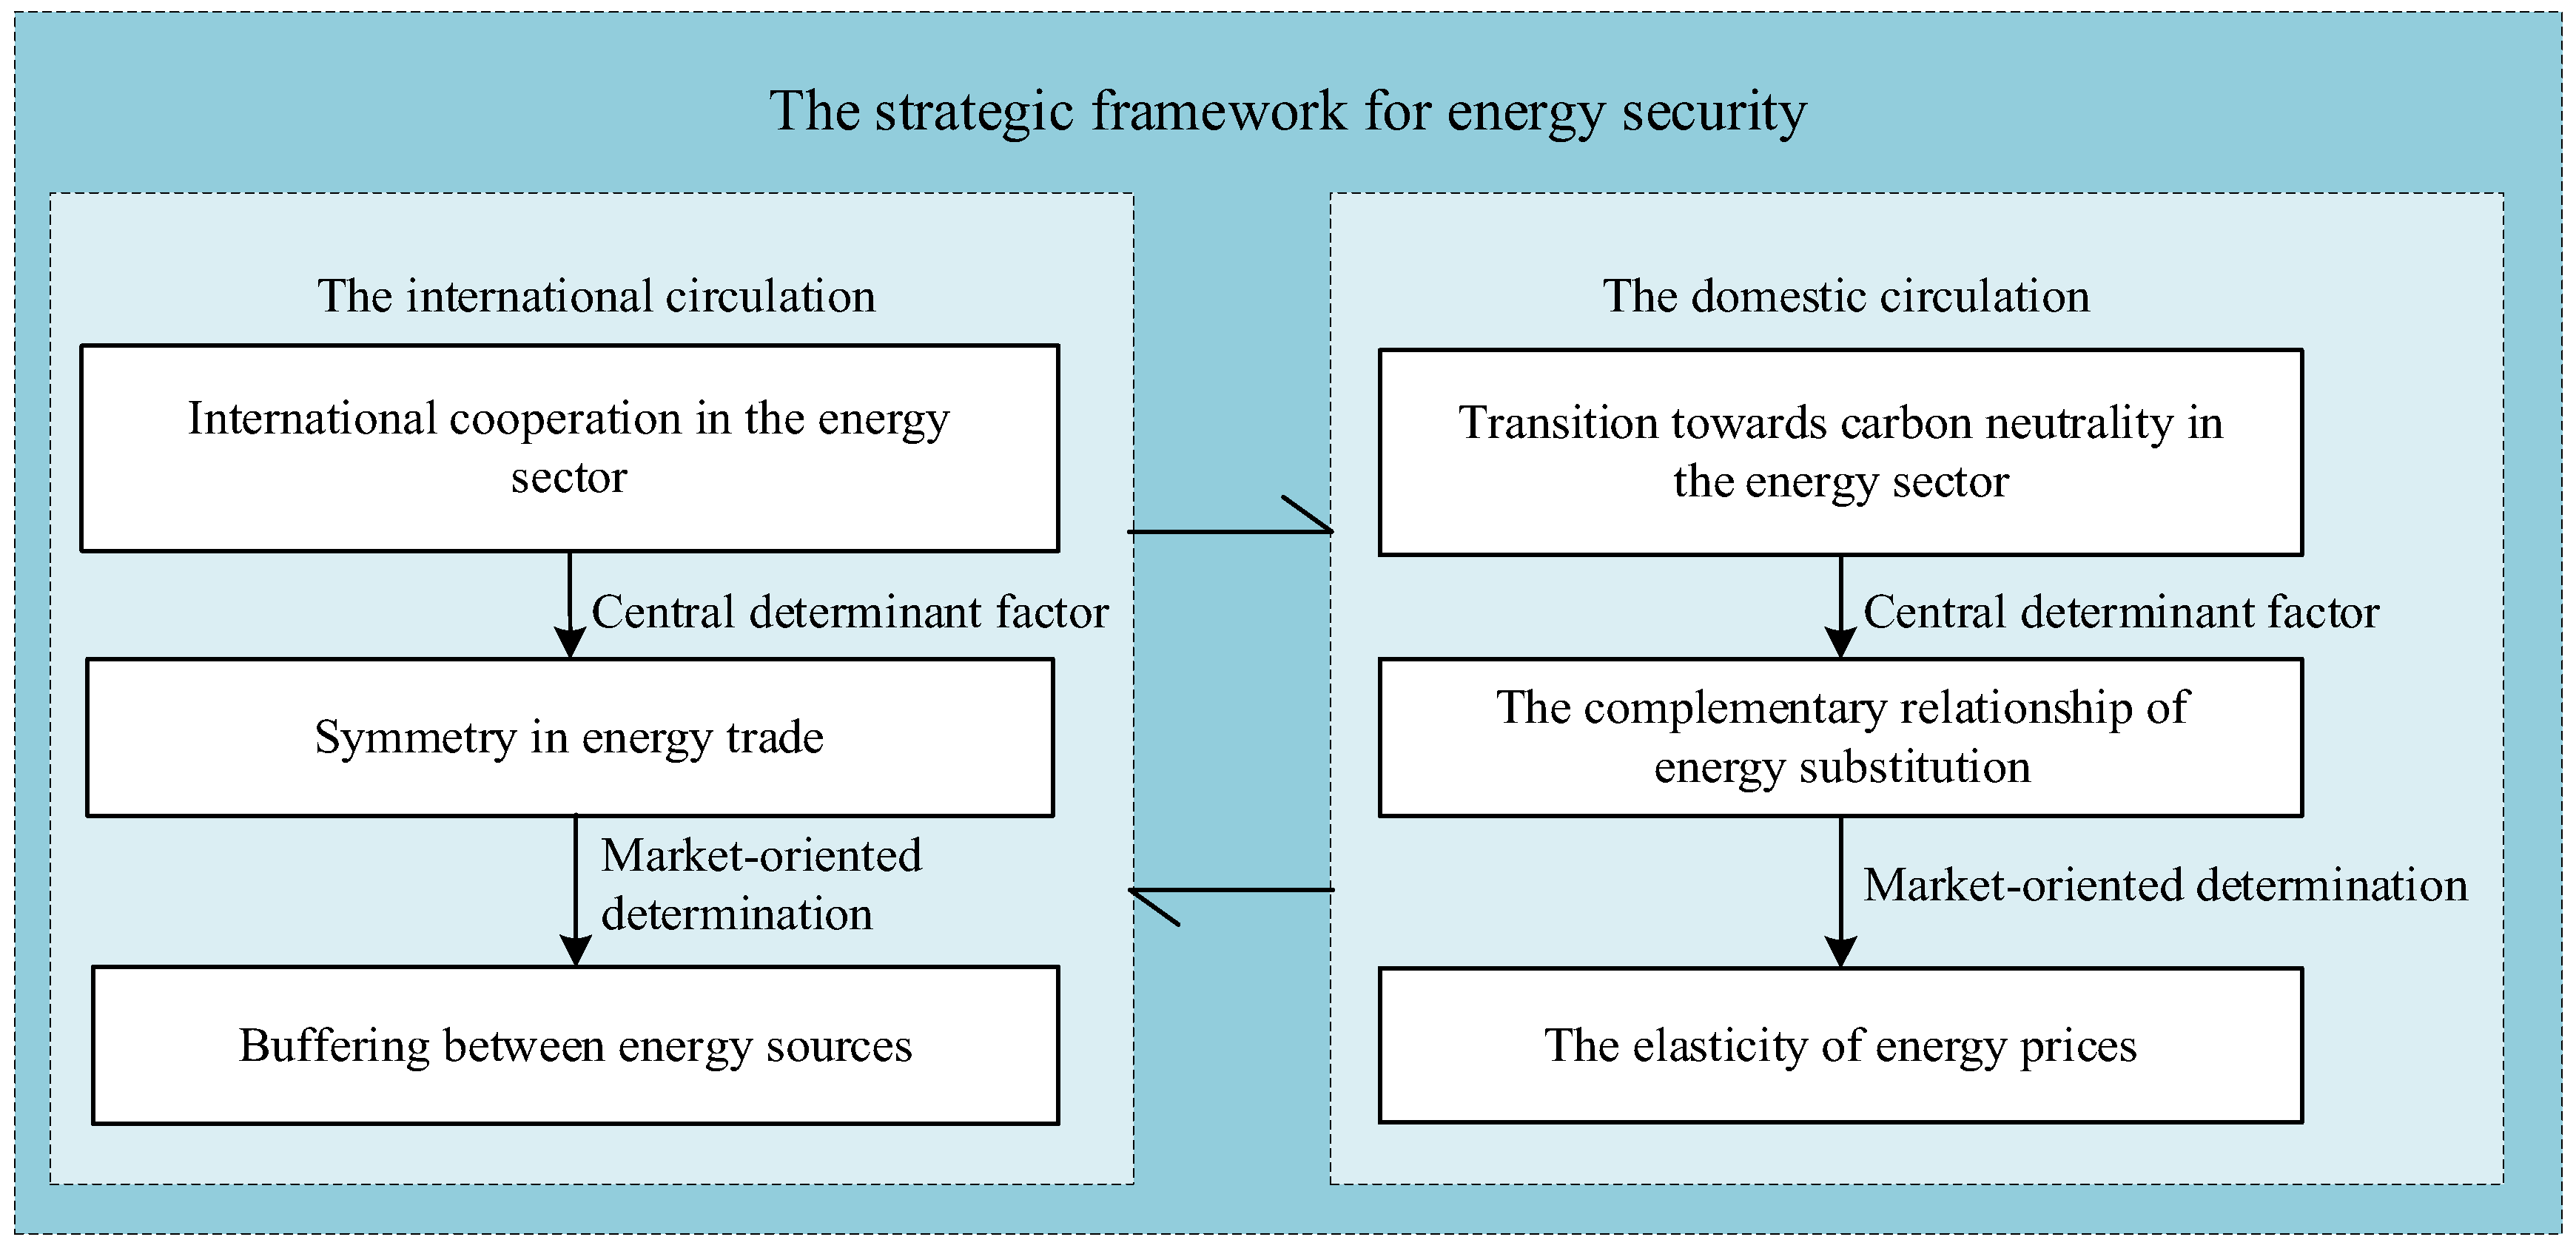
Figure 2.
Selfprice elasticity of imported coal, Chinese wind power generation, and Chinese photovoltaic power generation in China from 2000 to 2021. (a) The price elasticity of imported coal. (b) The Chinese price elasticity of wind power in China. (c) The Chinese price elasticity of photovoltaic electricity generation.
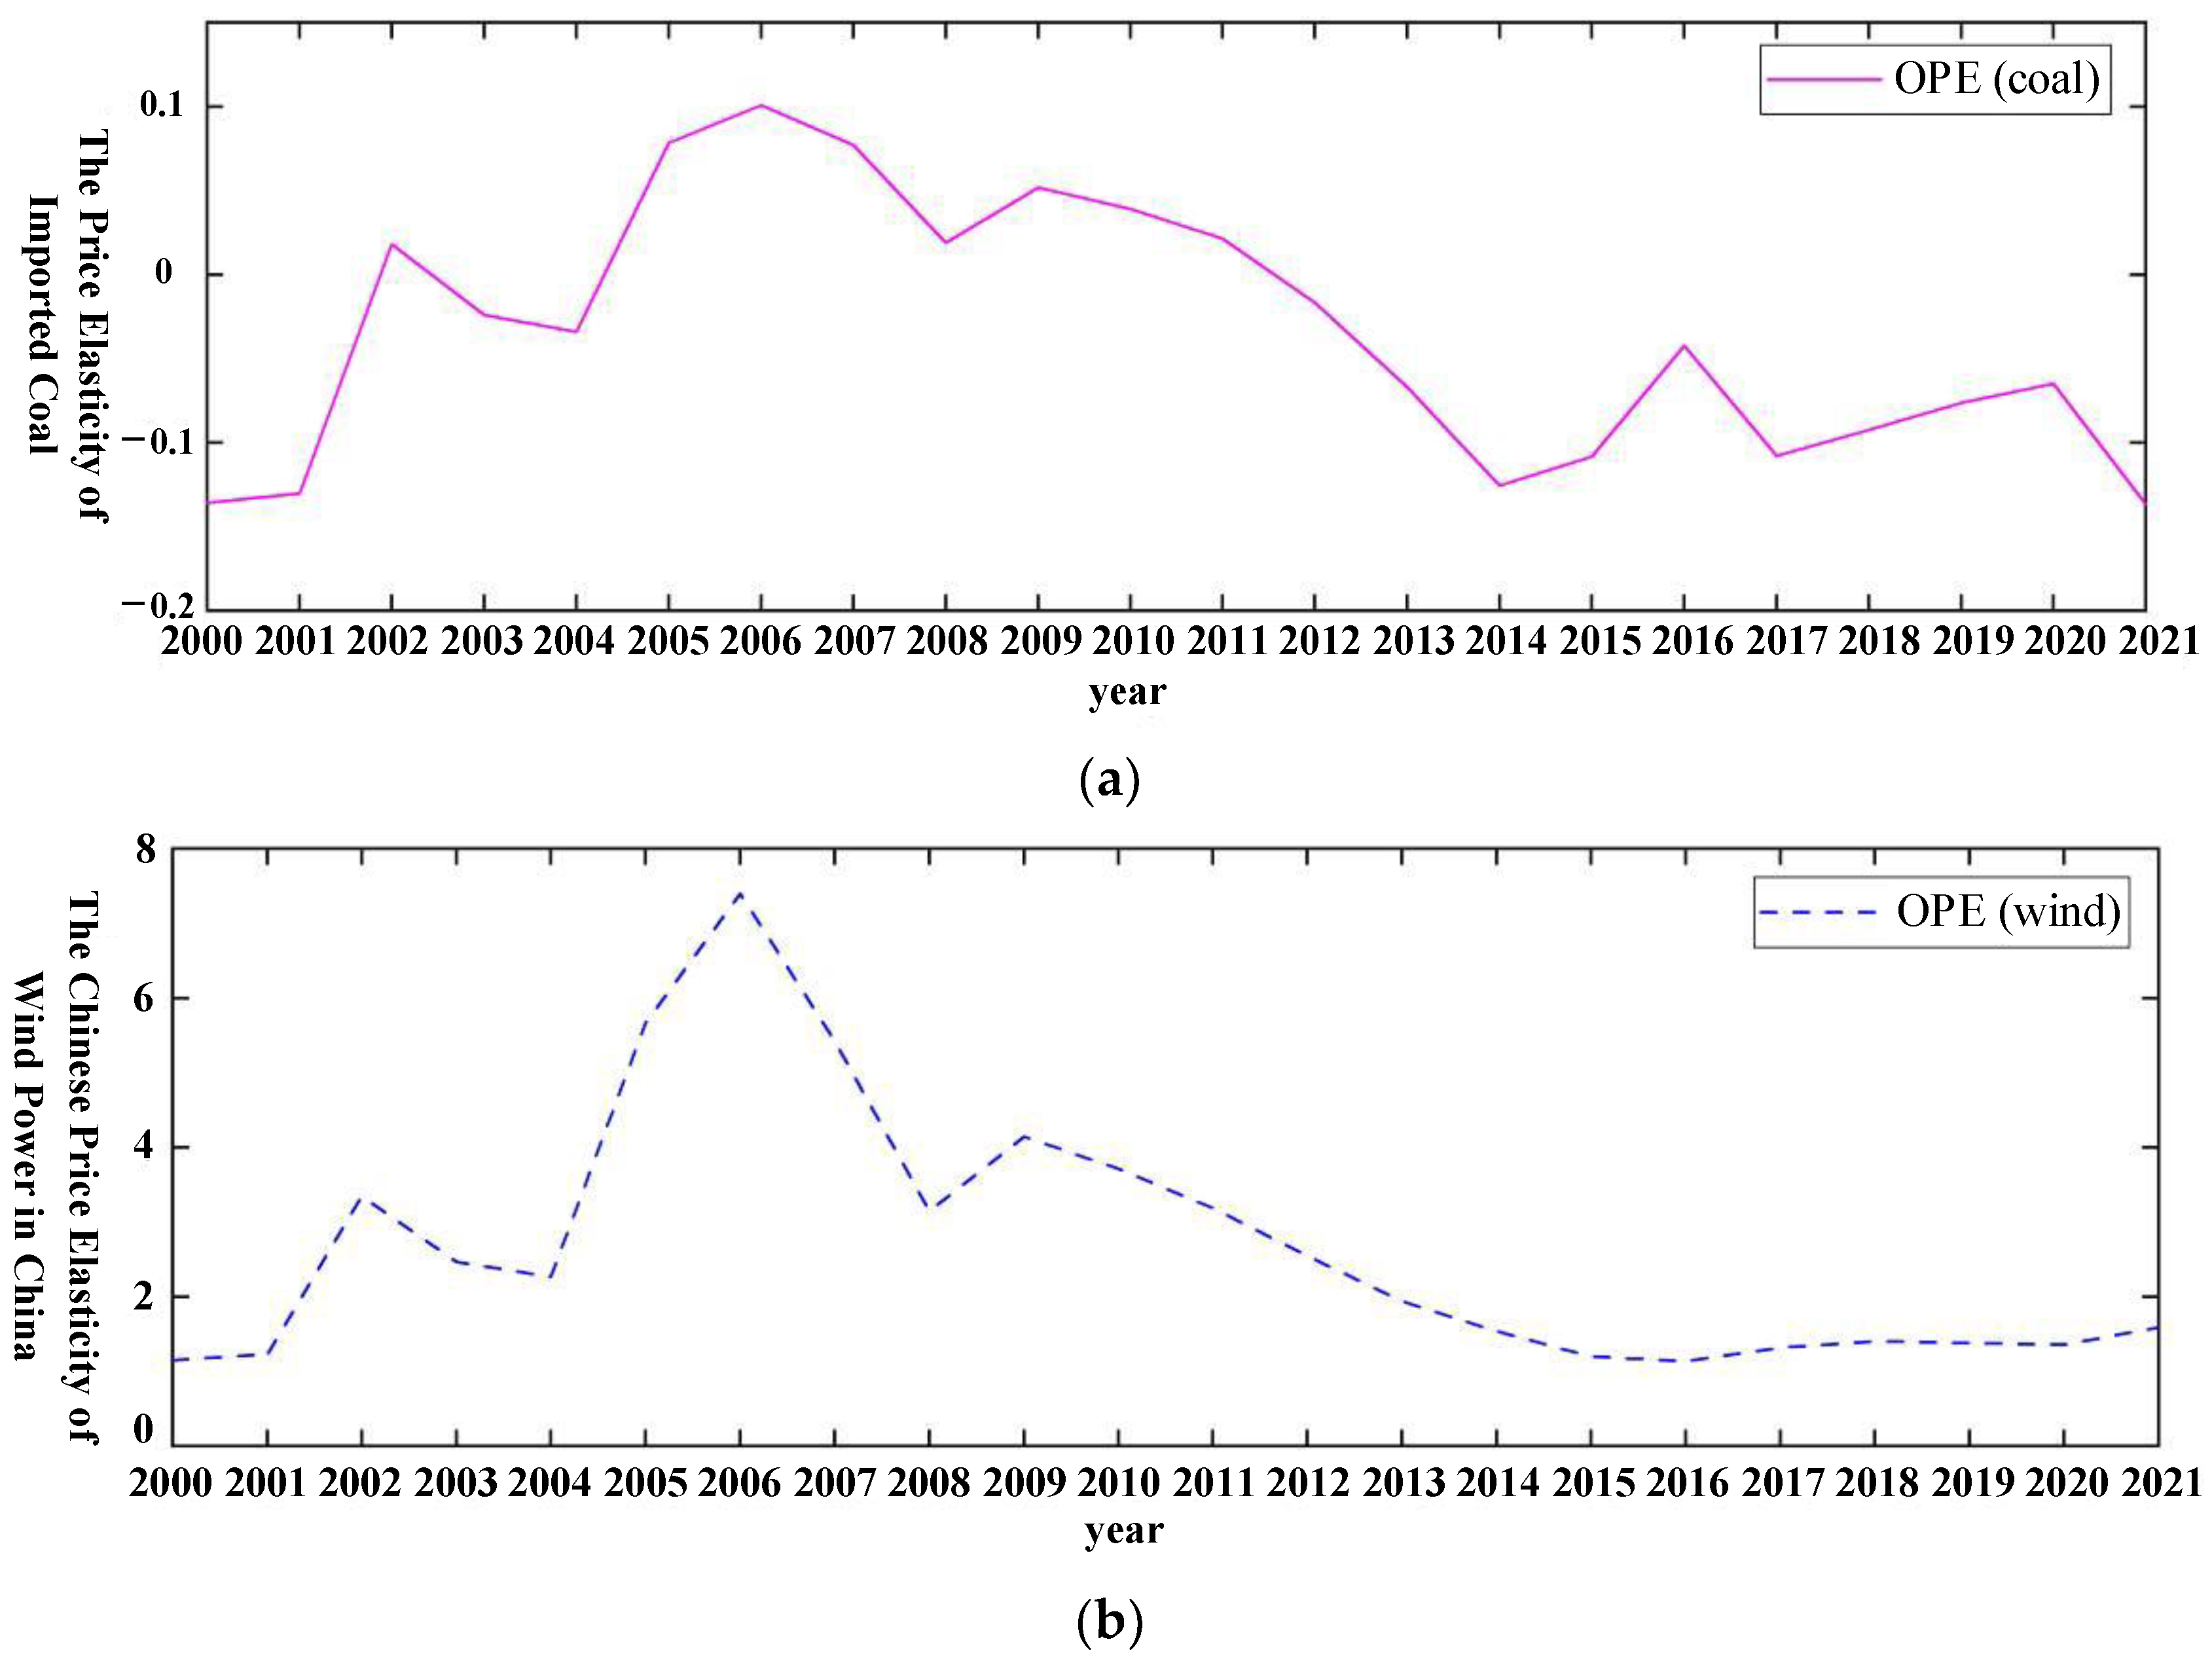
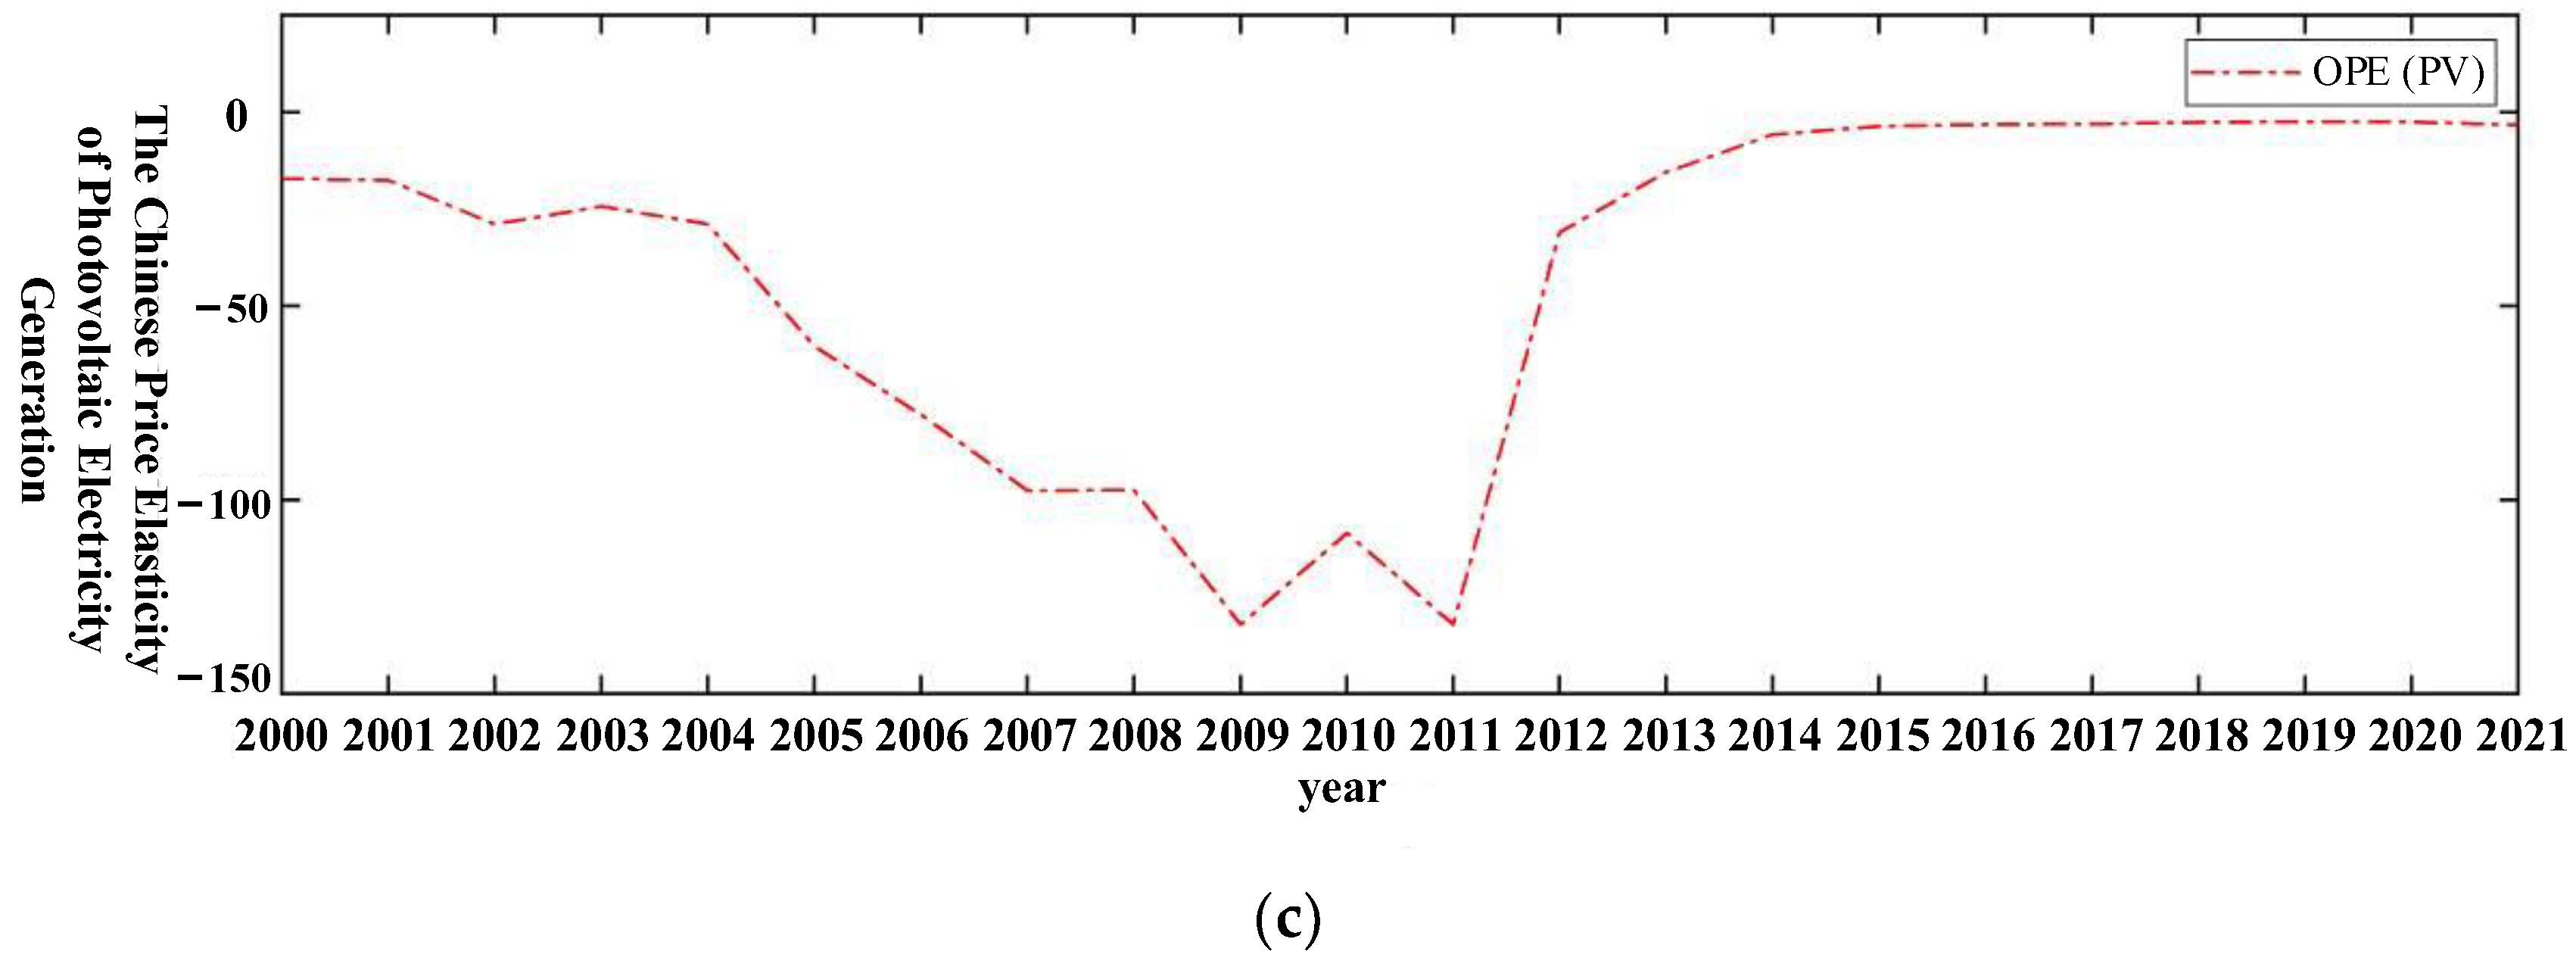
Figure 3.
Absolute price elasticity of imported coal, Chinese wind power generation, and Chinese photovoltaic power generation in China from 2000 to 2021. (a) Absolute price elasticity of imported coal on Chinese wind power and Chinese photovoltaic power generation. (b) Absolute price elasticity of imported coal in response to Chinese photovoltaic power generation. (c) Absolute price elasticity of imported coal in response to Chinese wind power generation. (d) Chinese wind power generation’s absolute price elasticity in relation to Chinese photovoltaic power generation. (e) Absolute price elasticity of Chinese photovoltaic power generation in relation to Chinese wind power generation.

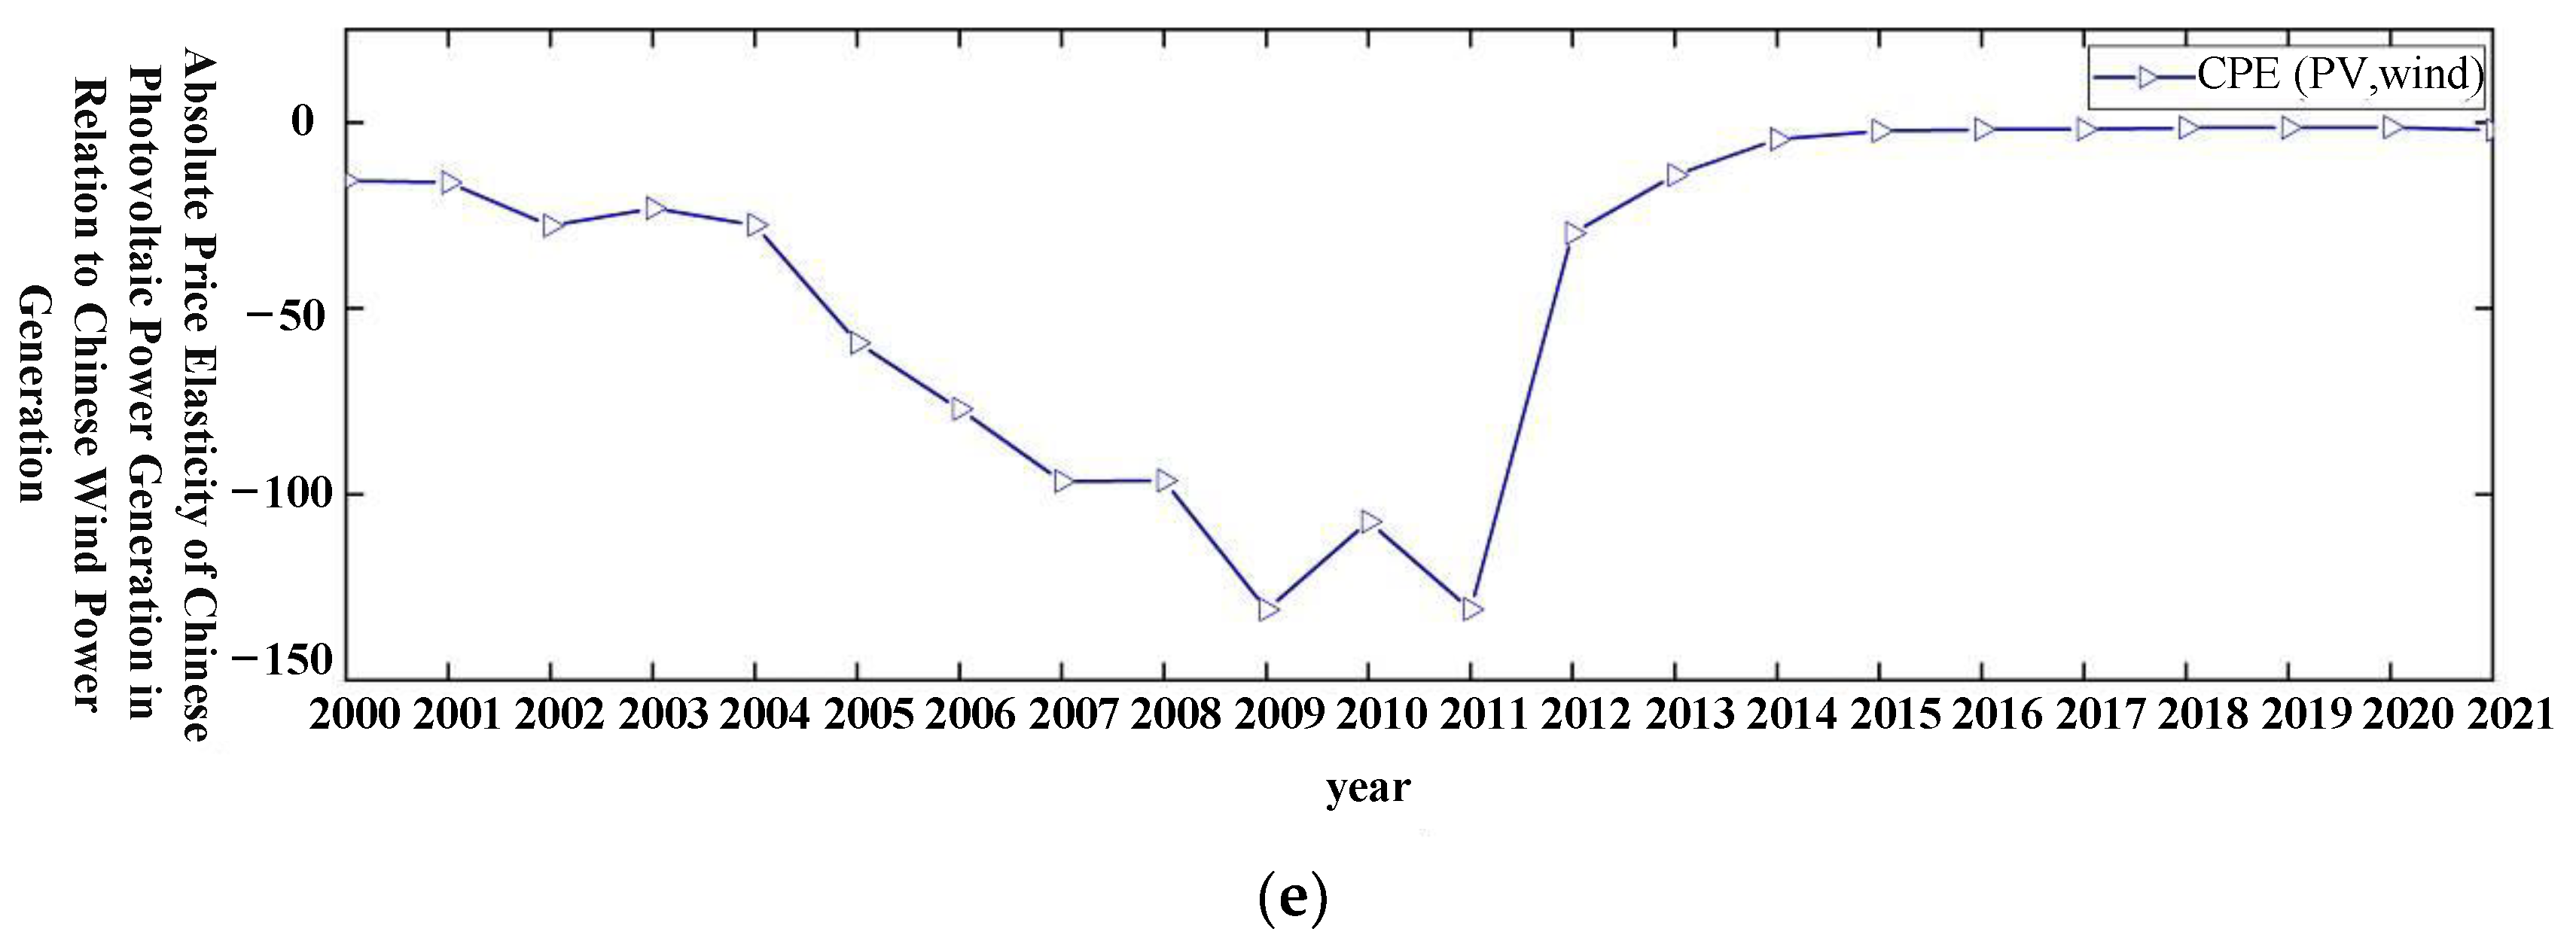
Figure 4.
The net price elasticity of imported coal on Chinese wind power and Chinese photovoltaic power generation. (a) The net price elasticity of imported coal on Chinese wind power generation. (b) The net price elasticity of imported coal on Chinese wind power generation and Chinese photovoltaic power generation. (c) Chinese wind power generation and the net price elasticity of imported coal. (d) Chinese photovoltaic power generation and the net price elasticity of imported coal. (e) Chinese wind power’s net price elasticity on Chinese photovoltaic power generation. (f) The net price elasticity of Chinese photovoltaic power generation on Chinese wind power generation.


Table 1.
Descriptive statistical analysis of coal trade-related data within international circulation.
Table 1.
Descriptive statistical analysis of coal trade-related data within international circulation.
| Data Analysis | Unit | Mean | Max | Min | Std. Dev. | Obs. |
|---|---|---|---|---|---|---|
| USD | 1,460,000,000 | 10,500,000,000 | 790 | 2,300,000,000 | 162 | |
| kg | 15,800,000,000 | 94,400,000,000 | 736 | 22,100,000,000 | 162 | |
| 1 | 0.000159 | 0.001057 | 0.000000000352 | 0.000222 | 162 | |
| kg/USD | 0.001871 | 0.009215 | 0.00000000016 | 0.002241 | 162 | |
| USD | 2,800,000,000,000 | 23,300,000,000,000 | 1,300,000,000 | 5,260,000,000,000 | 168 | |
| USD | 7,780,000,000,000 | 17,800,000,000,000 | 1,340,000,000,000 | 5,120,000,000,000 | 168 | |
| km | 7042.052 | 11,237 | 1166.22 | 3745.48 | 168 | |
| USD/kg | 0.201272 | 7.705163 | 0.005995 | 0.734188 | 162 | |
| 1 | 15.34433 | 28.33 | 11.34 | 5.041868 | 168 |
Table 2.
The impact of the green energy index on the value of imported coal trade.
| Model 1 | Model 2 | Model 3 | Model 4 | |
|---|---|---|---|---|
| −6.754562 *** (0.758609) | −7.065504 *** (1.703664) | −8.120987 *** (1.601464) | ||
| 0.154062 (0.630821) | −0.653341 (0.630485) | 0.090594 (0.606572) | ||
| 1.882937 *** (0.436563) | 0.291369 (0.565250) | 0.109630 (0.527821) | ||
| -- | -- | -- | -- | |
| −1.285320 *** (0.262183) | ||||
| 162 | 162 | 162 | 162 | |
| 0.549309 | 0.507452 | 0.569188 | 0.614358 |
In parenthesis: t statistics. *** indicates p < 0.01.
Table 3.
The impact of the green energy index on imported coal trade volume.
| Model 5 | Model 6 | Model 7 | Model 8 | |
|---|---|---|---|---|
| −5.342596 *** (0.869670) | −6.244320 *** (1.941334) | −8.120987 *** (1.601464) | ||
| −0.518571 (0.704027) | −1.232135 * (0.796029) | 0.090594 (0.606572) | ||
| 1.839354 *** (0.487225) | 0.432765 (0.644105) | 0.109630 (0.527821) | ||
| -- | -- | -- | -- | |
| −2.285320 *** (0.262183) | ||||
| 162 | 162 | 162 | 162 | |
| 0.471904 | 0.446524 | 0.482014 | 0.656169 |
In parenthesis: t statistics. * indicates p < 0.1, *** indicates p < 0.01.
Table 4.
The impact of the green energy index on the coal trade value per unit of GDP.
| Model 9 | Model 10 | Model 11 | Model 12 | |
|---|---|---|---|---|
| −4.053227 *** (0.765923) | −7.065504 *** (1.703664) | −8.120987 *** (1.601464) | ||
| 0.154062 (0.630821) | −0.653341 (0.630485) | 0.090594 (0.606572) | ||
| 0.882937 *** (0.436563) | −0.708631 (0.565250) | −0.890370 * (0.527821) | ||
| -- | -- | -- | -- | |
| −1.285320 *** (0.262183) | ||||
| 162 | 162 | 162 | 162 | |
| 0.462899 | 0.417339 | 0.476921 | 0.549156 |
In parenthesis: t statistics. * indicates p < 0.1, *** indicates p < 0.01.
Table 5.
The impact of the green energy index on the coal trade volume per unit of GDP.
| Model 13 | Model 14 | Model 15 | Model 16 | |
|---|---|---|---|---|
| −2.641261 *** (0.876672) | −6.244320 *** (1.941334) | −8.120987 *** (1.601464) | ||
| −0.518571 (0.704027) | −1.232135 * (0.718441) | 0.090594 (0.606572) | ||
| 0.839354 * (0.487225) | −0.567235 (0.644105) | −0.890370 * (0.527821) | ||
| -- | -- | -- | -- | |
| −2.285320 *** (0.262183) | ||||
| 162 | 162 | 162 | 162 | |
| 0.407830 | 0.389245 | 0.428408 | 0.620586 |
In parenthesis: t statistics. * indicates p < 0.1, *** indicates p < 0.01.
Table 6.
The logarithmic price indices and cost ratios of the three types of energy sources.
| Year | ||||||
|---|---|---|---|---|---|---|
| 2000 (the reference year) | 45.41% | 51.62% | 2.97% | 8.689429 | 9.409605 | 5.428563 |
| 2001 | 48.90% | 48.22% | 2.88% | 8.661649 | 9.361814 | 5.572318 |
| 2002 | 77.90% | 20.38% | 1.71% | 8.647465 | 9.333443 | 5.615729 |
| 2003 | 71.61% | 26.34% | 2.05% | 8.633076 | 9.304244 | 5.571058 |
| 2004 | 70.00% | 28.28% | 1.72% | 8.603662 | 9.274167 | 5.869204 |
| 2005 | 86.27% | 12.92% | 0.81% | 8.573357 | 9.243156 | 6.030458 |
| 2006 | 89.20% | 10.18% | 0.62% | 8.557852 | 9.235251 | 6.035519 |
| 2007 | 86.08% | 13.42% | 0.50% | 8.542104 | 9.211154 | 6.114359 |
| 2008 | 78.04% | 21.46% | 0.50% | 8.509843 | 9.178093 | 6.577923 |
| 2009 | 82.66% | 16.98% | 0.36% | 8.424321 | 9.143901 | 6.394137 |
| 2010 | 80.90% | 18.66% | 0.45% | 8.424321 | 9.099450 | 6.591605 |
| 2011 | 78.40% | 21.23% | 0.36% | 8.424321 | 9.052930 | 6.734894 |
| 2012 | 72.77% | 25.63% | 1.60% | 8.424321 | 9.004140 | 6.550098 |
| 2013 | 64.41% | 32.28% | 3.32% | 8.424321 | 8.952846 | 6.361647 |
| 2014 | 50.78% | 39.38% | 9.83% | 8.424321 | 8.952846 | 6.232303 |
| 2015 | 33.38% | 49.44% | 17.18% | 8.397170 | 8.887606 | 6.082834 |
| 2016 | 27.11% | 52.34% | 20.55% | 8.364533 | 8.716457 | 6.200567 |
| 2017 | 33.31% | 45.26% | 21.43% | 8.364533 | 8.573357 | 6.439509 |
| 2018 | 31.33% | 42.71% | 25.96% | 8.264948 | 8.493314 | 6.532625 |
| 2019 | 29.73% | 43.42% | 26.85% | 8.136639 | 8.249117 | 6.381686 |
| 2020 | 28.75% | 43.98% | 27.27% | 8.009887 | 8.112541 | 6.311650 |
| 2021 | 41.99% | 38.30% | 19.72% | 7.982488 | 8.009887 | 6.898339 |
Table 7.
Stability testing.
| Variables | Differential Order | ADF Value | 5% Critical Value | Conclusion |
|---|---|---|---|---|
| 1 | −3.322 | 0.027 | passed the test at the 5% significance level after conducting a differencing operation. | |
| 1 | −3.912 | 0.008 | passed the test at the 5% significance level after conducting a differencing operation. | |
| 2 | −3.343 | 0.027 | passed the test at the 5% significance level after conducting a second-order difference. | |
| 1 | −3.739 | 0.011 | passed the test at the 5% significance level after conducting a differencing operation. | |
| 1 | −2.475 | 0.135 | passed the test at the 5% significance level after conducting a differencing operation. | |
| 2 | −6.145 | 0.000 | passed the test at the 5% significance level after conducting a second-order difference. |
Table 8.
Cointegration test of regression equation.
| Variables | Conclusion | ||||
|---|---|---|---|---|---|
| Trace Statistic | 0.05 | Max-Eigen Statistic | 0.05 | ||
| Critical Value | Critical Value | ||||
| 113.1628 | 47.85613 | 68.80224 | 27.58434 | Existence of cointegration relationship | |
| 116.4289 | 47.85613 | 59.51362 | 27.58434 | Existence of cointegration relationship | |
| 94.3868 | 47.85613 | 56.47869 | 27.58434 | Existence of cointegration relationship | |
Table 9.
Estimation of relevant parameters.
| Statistical Analysis | |||||||||
|---|---|---|---|---|---|---|---|---|---|
| OLS Coefficient | 0.192 | −1.343 | 1.107 | −0.141 | 0.867 | −0.637 | −0.052 | 0.476 | −0.469 |
| (0.098) | (0.093) | (0.003) | (0.145) | (0.189) | (0.027) | (0.108) | (0.036) | (0.000) | |
| R-squared | 0.738245 | 0.524194 | 0.905023 | ||||||
| Adjusted | 0.694619 | 0.444893 | 0.889193 | ||||||
Table 10.
Price Elasticity of Demand and absolute price elasticity of three types of energy from 2001 to 2021.
Table 10.
Price Elasticity of Demand and absolute price elasticity of three types of energy from 2001 to 2021.
| Energy | Imported Coal | Chinese Wind Power Generation | Chinese Photovoltaic Power Generation |
|---|---|---|---|
| Imported Coal | −0.034400 | 0.689958 | 0.456417 |
| Chinese Wind Power Generation | 3.937886 | 2.662200 | 3.428661 |
| Chinese Photovoltaic Power Generation | −39.173589 | −39.483631 | −40.717000 |
Table 11.
Net price elasticity of three energy sources between 2001 and 2021.
| Energy | Imported Coal | Chinese Wind Power Generation | Chinese Photovoltaic Power Generation |
|---|---|---|---|
| Imported Coal | -- | −1.972244 | 41.173589 |
| Chinese Wind Power Generation | 3.972244 | -- | 44.145833 |
| Chinese Photovoltaic Power Generation | −39.173589 | −42.145833 | -- |
Disclaimer/Publisher’s Note: The statements, opinions and data contained in all publications are solely those of the individual author(s) and contributor(s) and not of MDPI and/or the editor(s). MDPI and/or the editor(s) disclaim responsibility for any injury to people or property resulting from any ideas, methods, instructions or products referred to in the content. |
© 2024 by the authors. Licensee MDPI, Basel, Switzerland. This article is an open access article distributed under the terms and conditions of the Creative Commons Attribution (CC BY) license (https://creativecommons.org/licenses/by/4.0/).
Share and Cite
MDPI and ACS Style
Liu, P.; Guo, K.; Wu, J. Research on Alternative Relationship between Chinese Renewable Energy and Imported Coal for China. Sustainability 2024, 16, 3446. https://doi.org/10.3390/su16083446
AMA Style
Liu P, Guo K, Wu J. Research on Alternative Relationship between Chinese Renewable Energy and Imported Coal for China. Sustainability. 2024; 16(8):3446. https://doi.org/10.3390/su16083446
Chicago/Turabian StyleLiu, Pingkuo, Kailing Guo, and Jiahao Wu. 2024. "Research on Alternative Relationship between Chinese Renewable Energy and Imported Coal for China" Sustainability 16, no. 8: 3446. https://doi.org/10.3390/su16083446
Note that from the first issue of 2016, this journal uses article numbers instead of page numbers. See further details here.