
A Model for Streamlining Benchmarking in Sustainable Development of Industries


Institute of Earth Resources, Faculty of Mining, Ecology, Process Control and Geotechnologies, Technical University of Košice, Letná 9, 042 00 Košice, Slovakia
*
Author to whom correspondence should be addressed.
Sustainability 2024, 16(6), 2587; https://doi.org/10.3390/su16062587
Submission received: 8 January 2024
/
Revised: 4 March 2024
/
Accepted: 14 March 2024
/
Published: 21 March 2024
(This article belongs to the Section Economic and Business Aspects of Sustainability)
Abstract
:Benchmarking is a process of improving organizational performance by recognizing, comprehending, adjusting, and incorporating the most effective practices and procedures observed either within or outside an organization. Benchmarking creates, primarily in industrial sectors, clearly identified opportunities for the use of processes and resources, and detecting the continuous improvement of their performance. From the point of view of a systemic approach to the management of the efficiency of the performance of industrial organizations based on benchmarking, it is possible to increase competitiveness in interaction with economic improvements. The objective of this study is to assess the potential of benchmarking in a business, with a particular focus on the economic aspect, by a systematic approach, and to propose a model for selecting the research segment, based on an international company operating across multiple countries worldwide. The study concentrates on the technical equipment of quarries in EU countries, where the company operates, employing benchmarking, a benchmark index, and statistical methods. The proposed model was designed in an open way that can be expanded and generalized for other manufacturing and non-manufacturing enterprises. The model is flexible and adaptable to the specifics of other sectors as regards the need to improve management with an emphasis on making management more efficient, and thereby supporting sustainable development.
1. Introduction
Traditionally, the approaches, models, methods, and ways of working in companies become extremely rigidified. They are not able to react flexibly to new, dynamically changing conditions. Therefore, other solutions are gradually emerging for companies that are pursuing prosperity in the new conditions of a globalized society. Solutions must accept changes in the market, but at the same time trigger the introduction of new approaches to work and the associated reorganization of companies. The main factors that cause changes in the market are the growing use of modern information technology [1,2], the explosion of new knowledge, unions, and information resources [3,4], the globalization and internationalization of development, production, trade, and business [5,6,7], the rapid changes in product ranges, the diversification of production, changes in company portfolios, mergers and bankruptcies [8,9], and discoveries, inventions, technologies, and business opportunities in new market segments [10,11].
Benchmarking is a process of improving continuous organizational behavior through identifying, understanding, adapting, and implementing the best practices and processes that can be found inside or outside of the organization [12,13,14,15,16]. Although the term “benchmarking” was methodically specified in 1972 by American scientists, its interpretation is constantly evolving. The purpose of benchmarking is to determine, based on research, the need for change and the probability of success because of these changes. Benchmarking is done as part of competitive analysis, and is not new to most businesses, although it is a more detailed and effective function than the competitive analysis method or approach [17]. According to Watson [18], there are three significant advantages to conducting comparative studies. First, benchmarking provides an independent assessment of how well a process is working, evaluating the performance of similar processes in different organizations or units within a single organization. By measuring the performances of other organizations or other organizational units, an objective basis for realistic quantitative performance targets can be established. Second, benchmarking provides an incentive to make groundbreaking change initiatives a reality by increasing the creativity and innovation of teams working to improve processes. Third, benchmarking expands the experience base of the organization or units. Looking at the experiences of other organizations externally or other units internally, benchmarking provides examples of behaviors, systems, and methods that enable better performance—as well as insights into things that do not work as well.
Benchmarking also became a part of the industrial policy of the Ministry of Economy of the Slovak Republic (MESR) in 1999. It included the establishment of the Slovak Benchmarking Information Center (SBIC) at the MESR. Although it was intended to be a new service of the ministry, especially for small- and medium-sized enterprises, suitable conditions for its implementation were not created [19]. The SBIC started its activity with practically no money, and later proceeded with the considerably limited financial support of the ministry. The SBIC was able to carry out its first, primarily educational activities, only thanks to the financing of the Coordination Center for Economic Advice at the German Embassy [20]. The main purpose of the SBIC was not only benchmarking awareness, but in particular, the practical application of benchmarking methods at the corporate level. The positive move that was made was the decision to purchase a license to access the UK’s extensive Benchmark Index database. All EU countries using this method had to do the same, but with the difference that the European Commission licensed EU countries (in 1999), so they could use this method as a free service. In the Slovak Republic, however, there were significant differences in the adoption of this method. Due to the need for a return on the investment in the license, the original British No-Business principle has been replaced by the Small Business principle, which has been demotivating, especially for small businesses. The interest in this method did not meet expectations. Therefore, there were not many companies that could be presented as successful in the context of identifying companies for business benchmarking projects. The consequence of this situation was the declining interest in benchmarking projects during 2004, at which time positive effects were already expected from the successful companies from the previous year. A paradoxical situation arose: the Ministry of Economy failed to provide funding for the purchase of a business benchmarking license using the Benchmark Index method at the right time, thus contributing to making the widespread use of this method impossible in Slovakia. Now, however, by providing a financial contribution to industry studies for its use, it is causing an undesirable effect—it is practically stopping the use of the license purchased in the interest of companies, which was the main goal of the establishment of the SBIC at the Ministry of Economy of the Slovak Republic [20].
This study aims to determine the potential use of benchmarking in the business environment based on a benchmark analysis and assess the benefits for businesses, taking into account the economic aspect and sustainability. The aspects of the processing and subsequent modeling of the problem of selecting the research segment are outlined based on an international company that operates in several countries all over the world. The study offers a case study of what is required of a company to set the parameters for the internal operation of its branches. Based on the inputs from the company, a benchmark was constructed for the energy and environmental sustainability of the company. The acquired knowledge was generalized and applied in the creation of a model with sustainable processes, which are applicable not only in the studied company, but also in other manufacturing and non-manufacturing industries and companies.
The particular objective of this study was the reduction of the negative impact of the industrial production of a large transnational company on the environment. In order to achieve this, objective benchmarking was introduced to improve the efficiency of the operational and service activities of the company’s branches as regards their sustainability in the countries under study, and thus affecting the whole region.
2. Materials and Methods
2.1. The Company
Within the investigated company, the research was concentrated on the field of mining in quarries and the technical equipment used. The company has branches in several countries, thus the technical equipment used in its subsidiaries was compared; therefore, internal benchmarking was performed for the given surface quarries. Information regarding the company’s parameters is presented without the name of the concerned company. All information regarding machines and equipment is taken directly from the investigated company. The company has a total of 1255 machines, but for the analysis, only a significant group has been specified, as mentioned, which are located in quarries. These quarries are located in the territories of the Czech Republic, Hungary, Slovakia, Croatia, Poland, Slovenia, and Romania. As part of the ensuing selection, it was necessary to examine the partial equipment of the individual countries. The final sample used for the benchmarking was selected as follows. The eliminated machinery was located outside the quarries and was mainly used for handling within the construction industry. At the same time, in the countries that entered the process, it was necessary to select the equipment used for handling aggregate in quarries, and not for its processing. In total, a sample of 105 dumpers, loaders, and excavators was selected. The sample was selected based on consultation with the company regarding their demands without any exact explanation for them. This fact has no impact on the analysis, the results of the study, or the proposed model. From the total number of 1255, all wheel loaders with an output of less than 110 kW, belt excavators with an output of less than 35 T, and, last but not least, rigid dumper payloads with an output of less than 40 T were excluded from the selection.
2.2. The Benchmarking
In benchmarking, which is characterized by the interaction between socioeconomic and managerial areas, several methods for the evaluation and interpretation of results are used. The benchmarking procedure is based on a systematic comparison of organizational processes and performances. There is no benchmarking methodology that can be simply adopted. However, there are common features of benchmarking that allow speaking about the benchmarking method and necessary steps to be taken within the benchmarking. The method generally used to describe a process is based on an input/output approach and on a formalization of the sequence of activities that make up the process [21,22]. To describe the processes, a systemic approach, including a description of the activities in the process with a description of its structure and history, was chosen [23,24,25].
The benchmark was constructed based on data from the company described in Section 2.1. The parameters were set according to the requirements of the company for the payload, average fuel consumption, and the frequency of service regarding operating time.
2.3. The Benchmark Index
The Benchmark Index is the most suitable indicator for small and medium-sized enterprises [26,27]. Due to the more general nature of the research, this indicator does not provide answers to certain specific questions related to, for example, research and development methodology, innovation in the company, human resources management and corporate culture, and different approaches to outsourcing, which can affect the success of the company. The classic method of benchmarking can be used by any company that has the conditions it is intended to address, that is, the company must have a policy on benchmarking, human and financial resources or full management support, etc. A very important and at the same time troublesome step in benchmarking is obtaining a benchmarking partner [28]. This is not only a matter of persuading the company management, but also of persuading the management of another company, which is often a direct competitor, to join the “game with open cards”. It is appropriate if the company can identify an ideal partner from the existing group of companies with which it has already cooperated in the past. There is therefore a certain synergy, a demand for further cooperation, basic mutual knowledge of business methods, and, above all, the possibility to learn something useful from one another. In short, it is not difficult to compare certain areas of a company, which have been economically and promptly selected, with those of a partner in the same industry. This can include, for example, human resource management, products, cost of production, etc.
The score of benchmarking is a sum, quantifying the weights of particular benchmarking approaches based on benchmarking keywords (KPI, reduction, maintenance, number of vehicles, utilization, fuel consumption) and their corresponding partial weights, set by the company. The score is given by the sum of the partial weights (wi) determined by the individual compared parameters in terms of percentage, which also exactly identifies their position in the benchmarking area.
n is the number of benchmark keywords.
Further information on the benchmark index can be found at https://www.financestrategists.com/wealth-management/investments/benchmark-index/ (accessed on 20 December 2023).
2.4. Statistical Methods
Descriptive statistics is a part of statistics that deals with the description and summary of data properties [29,30]. The goal of descriptive statistics is to provide a comprehensive view of a dataset and enable a better understanding of its characteristics. There are two basic types of descriptive statistics: numerical and graphical. Numerical descriptive statistics uses mathematical calculations to obtain the quantitative characteristics of data, such as means, medians, standard deviations, and percentiles. Graphical descriptive statistics uses visual graphical representations such as histograms, boxplots, scatter plots, and more to show relationships between and distributions of data. Descriptive statistics are also used to solve the problem of the assessment of possibilities, because the data collected from relevant sources were not modified in any way; nevertheless, the data were only sorted into statistical files according to clearly identified indicators, and according to the time horizon. The sorted data have been displayed according to the time factor in this way using histograms, line graphs and their combinations, or pie charts.
The average value is one of the most basic characteristics of a set of values that is used in descriptive statistics [31,32]. It is the arithmetic mean of all values in the set. The basic formulae that have been applied for the descriptive statistics follow.
Average value () is the sum of all values (xi) with the number of values (n),
This calculation is used to determine the average value for any set of values. The average value provides a basic view of the central tendency of the dataset, and allows a comparison of values in the set. However, it is important to note that if there is a set of values with significant outliers, the average value can be affected by these values and may not be representative of the majority of the data. In such cases, other characteristics should be used, such as the median, quartiles, or percentiles, to get a better view of the overall distribution of values in the set.
Median is the middle value that divides the ordered set of values in half [33]. If the number of values is even, the median is the average of the two middle values. If the number of values is odd, the median is the middle value. In the more common case, when the mean value of the distribution is not known, it is estimated by the arithmetic mean.
Standard deviation (s) or its equivalents is
where N is the number of measurements, xi is the measured value and is their arithmetic mean. The concept of the standard deviation is also often used in the analysis of sample estimates.
2.5. Finding a Partner for Benchmarking
Finding a suitable partner for benchmarking can be challenging, but several steps can be taken to increase the chances of success [34]. Based on the selected methods, it is possible to find the correct partner for a successful match [35]. As internal benchmarking is done, it should be much easier to find the match because the outside impact can be eliminated. Identify the needs: First, it is necessary to identify the areas of the business for benchmarking. This will help determine the type of partner you need. Look for potential partners: Look for companies that are similar in size, industry, and scope of operations. Potential partners can be found through industry associations, trade shows, conferences, and online directories. Reach out to potential partners: Once the potential partners are identified, it is necessary to reach out to them and explain their interest in benchmarking. Be clear about what you are looking for and what you hope to achieve through the benchmarking process. Evaluate compatibility: Evaluate the compatibility of the potential partners by looking at their company culture, values, and goals. It is essential to have a partner who shares similar values and is committed to the benchmarking process. Sign an agreement: Once a suitable partner is found, sign a formal agreement that outlines the terms and conditions of the benchmarking process. This agreement should cover topics such as data sharing, confidentiality, and intellectual property rights. Conduct the benchmarking process: Finally, conduct the benchmarking process by collecting and analyzing data, identifying best practices, and developing an action plan to improve the business processes [36].
2.6. Strategic Profile
The strategic profile method is mostly used to compare with the profile of the strongest competitor in a specific market segment, or with general market requirements [37,38,39]. It very clearly depicts the strengths and weaknesses of the company. It can be said that an ideal profile is one whose parameters are at least at the level of general requirements. It also states that all parameter values do not have to be at level five (the maximum value), but the general requirements should be at least partially copied in the profile [40]. According to Porter [41], one of the basic goals of strategic diagnostics is to reveal the company’s decisive strengths as a source of possible competitive advantage, which forms the central idea of its competitive strategy [42]. The strategic profile represents a complex of evaluations or levels of selected parameters of the company’s competitiveness. Its main features include [43]:
- It shows the company’s strengths and weaknesses, which it compares with the profile of another company or with the general requirements of the market;
- The ideal profile is when all parameters are at the level of general requirements;
- The result is displayed using a graphic form, which enables quick inference regarding the quality of the company’s internal environment;
- It is necessary to cover all functional and cross-sectional areas in the company;
- After the graphic representation, the manager can quickly check the company’s strengths and weaknesses.
A scale from 1 to 5 is used for the point evaluation of the criteria, where 1 will represent an unfavorable evaluation and 5 a favorable evaluation of the criteria.
3. Results
3.1. The Company Activity
The company has a wide portfolio of activities. The entire concern is divided into four main areas, which are construction, residential development, commercial development, and infrastructure. From the point of view of the global group, it operates in the Czech and Slovak Republics in all the aforementioned areas; however, the company is only active in construction and residential development. Other spheres of activity fall under other branches of the holding. The core business mainly concerns construction activities, especially in the fields of transport, civil, housing, engineering, and industrial construction, as well as the development activities and facility management. The company undertakes its business mainly through its activity, but also through subsidiaries with different focuses in the Czech Republic and Slovakia.
It is advisable to further specify the individual subjects of the activity. In the field of housing construction, the company also focuses on the construction of housing units and complexes in terraced or individual houses. In civil buildings, the company is a supplier of business premises in shopping centers, administrative buildings, sports centers, hotels, airport terminals, and educational facilities. At the same time, it also focuses on the reconstruction of historical buildings. The company is a supplier of various industrial buildings, mainly production halls with a load-bearing structure made of reinforced concrete or steel, including engineering and telecommunication networks. It also focuses on the construction of logistics and warehouse centers.
Activities in engineering and ecological constructions are most often associated with water supply and sewerage, pipe systems, wastewater treatment plants, low-energy buildings, and landscape and orchard improvements.
In the area of road construction, the company mainly implements expressways and motorways. Together with this, it is a supplier of linear constructions, urban roads, cycle paths, and airport areas. From a technological point of view, it deals with concrete and asphalt roads and airport areas, as well as the production of asphalt mixtures and concrete mixtures. The company is also an important contractor of railway construction. In this area, the company is most active in the modernization, optimization, and reconstruction of railway corridors and regional lines, as well as the construction and reconstruction of railway stations and sidings. The company also deals with urban rail transport and owns a network of concrete plants, manufactures steel and reinforced concrete structures for other construction entities, engages in specialized construction activities (for example, ecological disposal of asbestos or geodetic surveys), and, for external customers the company offers the rental of construction mechanization, as well as services and facility management.
3.2. Analysis of Heavy Machinery in Selected Quarries
Within the company, as mentioned above, a benchmark concerning the best parameters within the machines located in the quarries will be discussed. The company needs to find out which of the subsidiaries could serve as a model example for the improvement of the parameters and even the convergence of others. A very interesting part is the environmental component, which is also monitored in the company in order to reduce the burden on the environment introduced by emissions, and the company wants to know which of its branches has the idlest engine hours (a situation where machines are waiting to work with the engine on). The following groups of machines were selected from the overall list, taking into account their work directly in the quarry. The data obtained from the company for selection and processing for the year 2022, a period determined due to the pandemic, were not relevant enough. If we were to use the pandemic period, it would not be possible to objectify the information, as the years 2019–2021 were not within the standard because the company was partly closed due to the situation with COVID-19, and from this point of view, the data are not sufficiently relevant for processing. The year 2022 was the first in which it was possible to realistically evaluate consumption and motor hours, as the operations worked without restrictions during the entire monitored period.
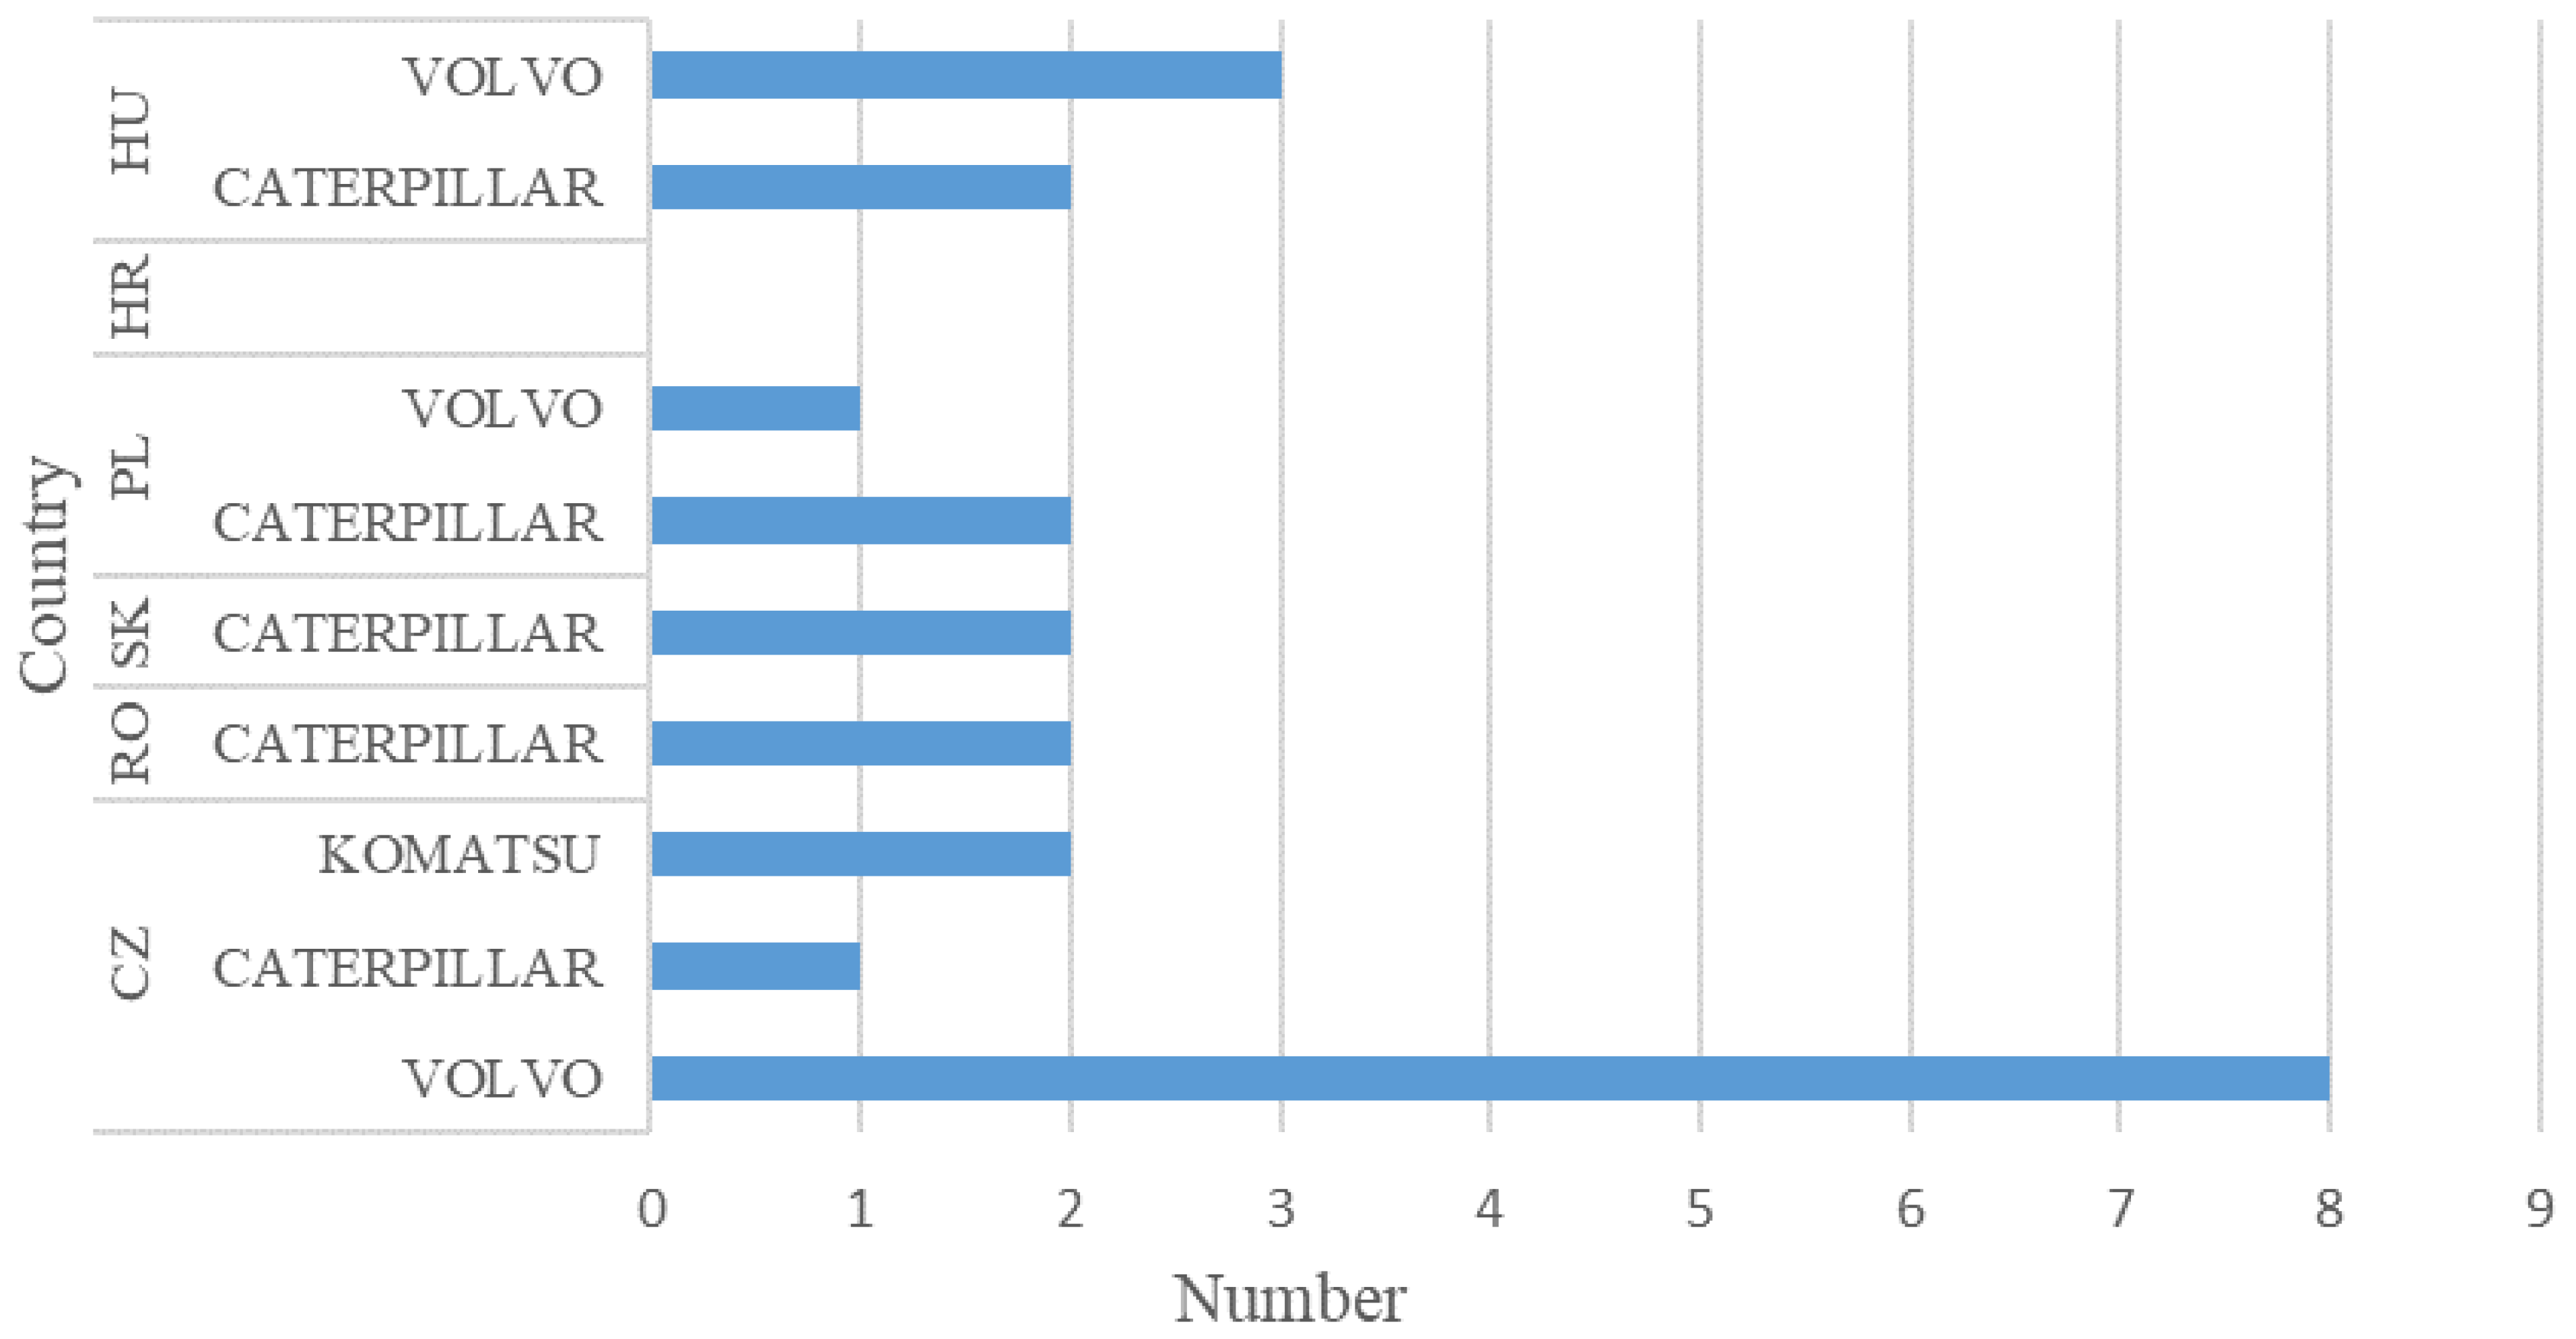
The first examined group comprised tracked excavator machinery. In selected countries, a group of excavators over 35 T was selected. A tracked excavator differs from a typical excavator, due to the added tracking system instead of wheels on most excavators. The steel tracks provide the excavator with further resistance and grip on the surface they are operating on. Tracked excavators, also known as crawler excavators, are heavy equipment machines commonly used in construction, mining, and other industries for digging and excavation tasks. They are designed with a set of tracks or crawlers that provide stability and mobility on rough terrain, allowing them to operate in a variety of conditions.
Tracked excavators are typically equipped with a long, articulated arm or boom that is attached to a bucket at the end. The arm is operated by hydraulic cylinders, allowing the operator to move the bucket in a wide range of motions and to dig deep into the ground. The bucket can also be swapped out with other attachments, such as a breaker or grapple, to perform other tasks.
Often referred to as cranes or hoes, a track excavator is a common piece of equipment that is used when digging large holes. There are many uses for a track excavator. Digging ditches and basements, demolition, and breaking up structures are just a few. Table S1 (Supplementary Materials) describes the devices located in the studied countries as well as their average consumption in terms of engine hours (L/wh). Figure 1 presents a comprehensive summary of devices by manufacturer and country, with the cumulative number of single machines.
For tracked excavators, the priority areas were set for benchmarking evaluation. Among the investigated companies, three that are important in terms of data complexity were selected, which vehicle fleets were interesting due to their wide range (Figure 2). For tracked excavators, items such as the average consumption of the given stationary equipment in the global context of all participating countries were used, as this totalized value reflects more accurate values that give a better perspective on the reality of the consumption of individual machines. Another important component was the age of the self-heating equipment, as this has a significant effect on consumption as well as the necessity of shutdowns due to unrefined repairs that cost a lot of money. Subsequently, the actual service routines that are performed every 250 motor hours were considered. One of the monitored areas was the utilization of the given devices, mainly related to the correct setting of the number of devices. More comments on Figure 2 can be found in Section 3.3.
The second compared group comprised wheel loaders. These are pieces of heavy equipment usually found in construction projects and building sites. Wheel loaders are heavy equipment machines used in construction, mining, agriculture, and other industries for loading materials such as dirt, gravel, sand, rocks, and other loose materials. They are typically equipped with a large bucket at the front, which can be raised and lowered using hydraulic cylinders, and can also be tilted to dump the load into a truck or other receptacle. Wheel loaders can load and transport a variety of materials, such as earth, sand, gravel, and rocks. Since they use wheels, their mobility on roads is better, and they do not damage asphalt or concrete. Wheel loaders come in a range of sizes and configurations to suit different applications. They are typically powered by diesel engines and are equipped with large, heavy-duty tires for traction on rough terrain. They can be operated by a driver seated in a cab or by remote control. In this study, large loaders with a power of more than 135 kW, which are suitable for work in quarries, were selected. As for the tracked excavators and wheel loaders, the number of devices from specific manufacturers was considered to measure the preferences of the investigated company. Table S2 (Supplementary Materials) describes the devices located in the studied countries as well as their average consumption in terms of engine hours (L/wh). Figure 3 presents the number of individual devices by country and manufacturer.
For wheel loaders, the priority areas were set for benchmarking evaluation. Among the investigated companies, three were important in terms of the complexity of the data, and the vehicle fleets were also interesting for their wide range (Figure 4). Subsequently, the service processes, as already mentioned above, were considered. These were carried out in regular cycles according to the manufacturer’s recommendations. One of the monitored areas was the utilization of the given devices, mainly via the correct setting of the number of devices as well as the optimization of costs. It is important to mention that the COVID-19 period affected the age of the given equipment, as there was an interruption of supplies from the supplier. As with passenger cars, chips, and other technological devices needed in the supply chain, they also failed. In this case, the delivery time was extended from 6 months to 18 months. In another case, equipment that, under other circumstances, would no longer be in the company’s fleet had to be used. More comments on Figure 4 can be found in Section 3.3.
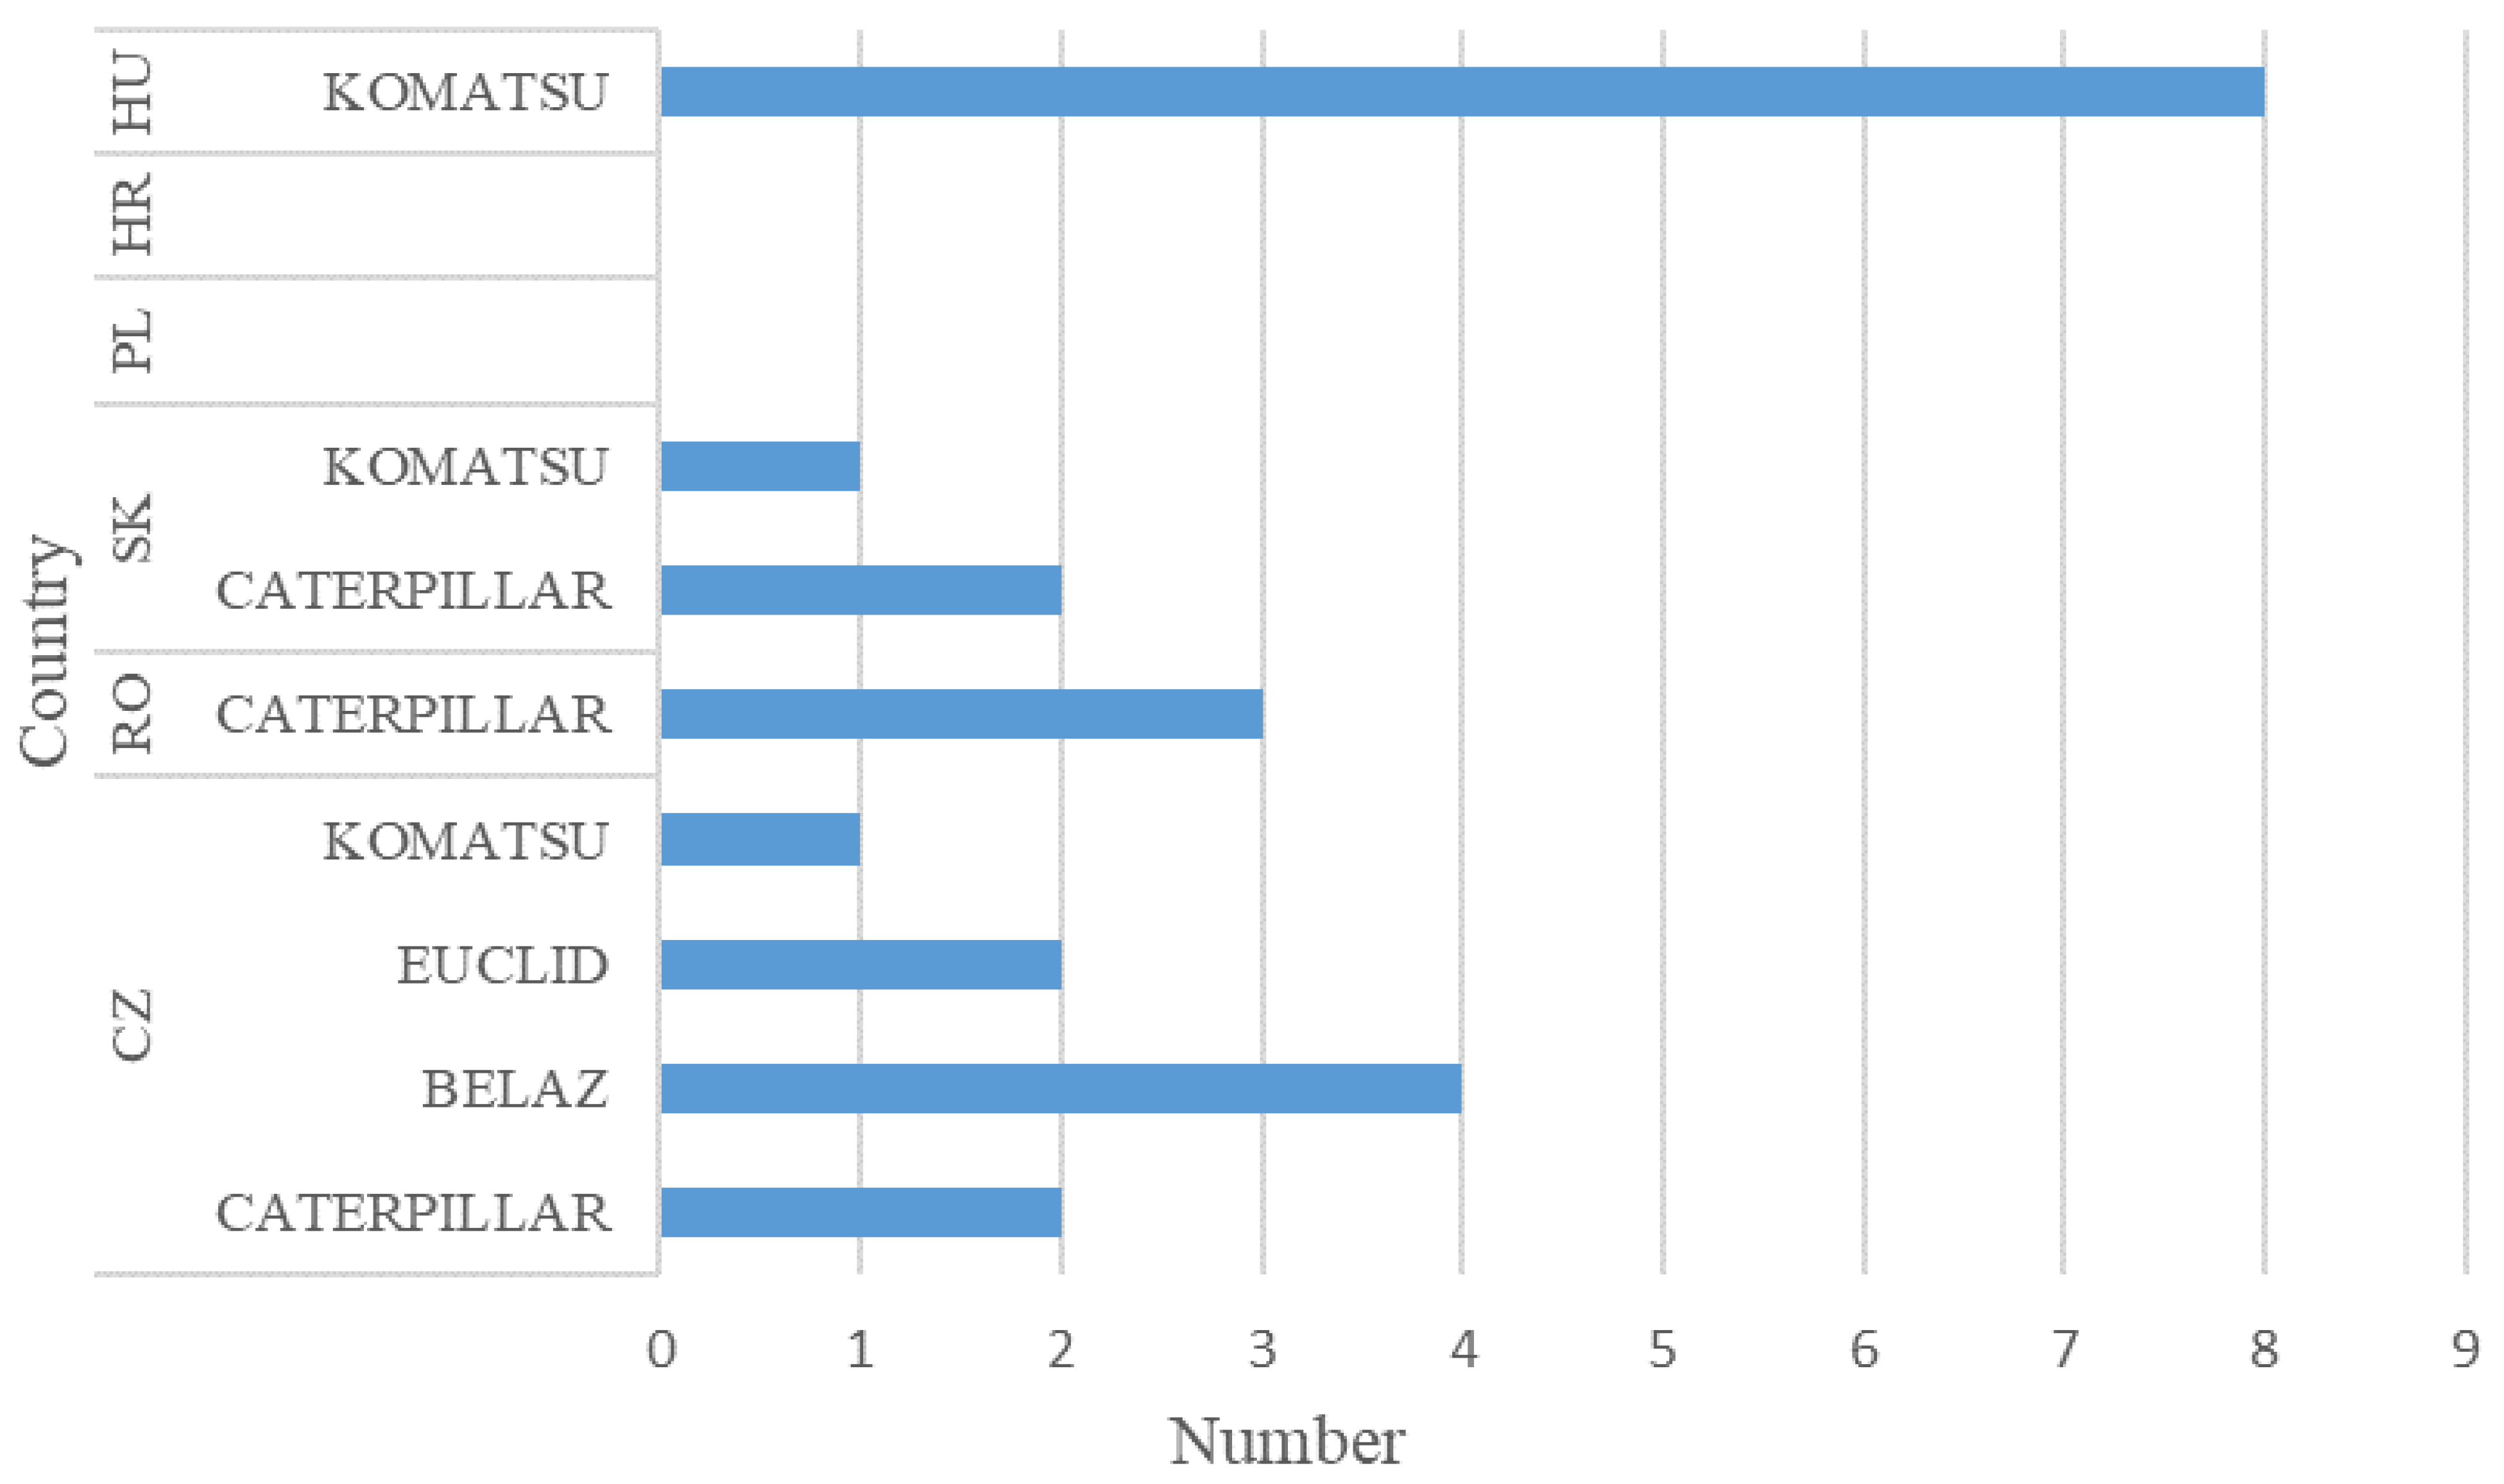
The last comparison group is composed of rigid dumper payloads. As part of the investigation, the number of countries in which the given equipment is used in mining works and quarries was assessed. Rigid dumpers, also known as rigid dump trucks, are heavy equipment machines commonly used in mining, construction, and other industries for hauling materials. They are designed with a rigid frame and a dump body that is mounted on top of the frame. The dump body is hydraulically operated and can be raised and lowered to dump the load. The payload capacity of a rigid dumper depends on the size and configuration. Smaller rigid dumpers used in quarries and construction sites typically have a payload capacity of 20–30 tons. Larger rigid dumpers used in mining applications can have a payload capacity of up to 400 tons or more. The payload capacity of a rigid dumper is determined by several factors, including the size of the dump body, the strength of the frame, and the power of the engine. Other factors that can affect the payload capacity include the weight of the machine itself, the terrain, and the distance that the materials need to be transported. Table S3 (Supplementary Materials) describes the devices located in the studied countries, as well as their average consumption in terms of engine hours (L/wh). The heavy machinery used in selected companies is overviewed in Figure 5.
For rigid dumper payloads <40 T, the priority areas were set for benchmarking evaluation. Among the investigated companies, three were important in terms of the complexity of the data, and the vehicle fleets were also interesting for their wide range (Figure 6). It is also important to mention that the COVID-19 period affected the age of the given equipment, as there was an interruption of supplies from the supplier. In this study, equipment that under other circumstances would no longer be in the company’s fleet also had to be used. More comments on Figure 4 can be found in Section 3.3.
Based on the findings, countries that did not have all the necessary data were eliminated from the group of subsidiaries of interest, as benchmarking would not be suitable for them. In this case, when all relevant information is not fully represented, it is necessary to completely exclude countries like Croatia, Poland, and Slovakia from the benchmarking.
3.3. Benchmark Identification and Prioritization
In order to establish a benchmark, the overall state of all sub-variables was evaluated (Figure 7). As not only the company branches but also the provided services were considered, the KPIs for the identification of benchmarking for the partners were related not only to the studied machines, but also to other equipment. This fact resulted in different KPIs. While Figure 7 includes all the considered countries, Figure 2, Figure 4 and Figure 6 present an exact comparison of the real state of the benchmarked company, and only include the selected countries as discussed in Section 2.1 and Section 2.2. The values of the score (Equation (1)) were obtained as a sum of weights based on keywords. The given levels of the indicators (Target/Benchmark/Std) were quantified directly by the analyzed company. The red dash lines represent the values of particular parameters that were set based on the internal requirements of the company, not representing an average value but the highest limit value, determined by the type of vehicle. After the detailed analysis, the individual quarries in the countries and their equipment were sufficiently mapped, and thus the overall summary was much more effective. Using the processed data, after the basic evaluation, the countries that did not meet all the variables entering the process were eliminated. It was necessary to exclude these countries, as they would distort the overall process and course of benchmarking. These items included reducing the time when devices are idle. This activity can be monitored by telematics, which is a system for collecting operational data. Telematics collects information and data for GPS monitoring, consumption, engine speed, error messages, and others. Based on this information, it is possible to predict the overall condition of the machine, as well as its optimal use. Another item investigated was the length of maintenance for operational machines, which is carried out after every 250 motor hours. As part of the given maintenance, the time per machine is approximately one work shift, but of course, its utilization and the space itself wherein the equipment is located have a high influence on the length. If the machine is operated in difficult conditions, usually the maintenance time reaches the upper limit of the required time. If hidden defects are discovered during routine maintenance, it is even longer, depending on the difficulty of the repair, the availability of spare parts, etc. The number of vehicles and their age were also investigated, as the state of the vehicle fleet has a direct impact on cost optimization and repair requirements. Fuel consumption and its monitoring are important for determining average values for calculating total costs. In this case, telematics is also used, which monitors deviations from the set values given by the manufacturer as well as within the internal monitoring of operations. Then, the monitoring of devices and performing of additional analyses that should help optimize consumption can be started.
To derive a better set of priorities, a prioritization matrix was applied as the basis for the evaluation of which part should occupy a leading place for the company in order to ensure effective management. Figure 8 shows the calculation, as well as the inputs that were identified as problematic and the subsidiaries, and evaluated them as the most problematic areas. As mentioned in the comments below the figure, the weights were obtained based on the prioritization of the company, and the assessment criteria were also identified based on the company’s internal requirements. The values were set as 1—cannot perform, 2—perform with help, 3—perform, 4—perform effectively, and 5—perform superior (benchmark leader).
The company should show increased vigilance over unauthorized start-ups of motors, as some workers do not switch off the equipment, and this leads to an increase in fuel consumption, while, at the same time, technical service becomes more expensive, as it is established based on an internal directive and manufacturers’ recommendations every 250 motor hours. After evaluating the performed analyses, the problem areas in the investigated companies are mainly fuel consumption, machine downtime, the age of the mechanisms, as well as the frequency of service in relation to their operating time. Based on the results for the strategic profile, obtained via the analysis performed, we found where companies are lagging, or where they have a competitive advantage. After the analysis, we have inferred that the management’s efforts should be aimed at eliminating weaknesses and strengthening the company’s competitive advantages. The main benchmark among internal companies is the company based in company CZ, which received the highest number of points from our calculations. The strategic profile thus addresses the question of how to create and strengthen a long-term competitive market position and subsequently fulfill the individual goals of a company that is progressing in the given area [42].
Benchmarking in quarry mechanization enables the company to constantly monitor and assess its performance as regards its operating techniques against other company branches [44]. The services connected to quality control and improvements in team spirit and morale result are connected to the behaviors of the parties involved—employees working with the equipment (machines) and the employees of the service—who have significant influence over sustainability. Simply put, if the machine is idle and the employees do not turn the engine off when not in use, the machine must be serviced more often, which means increased costs. The process is important for the continuous improvement of an industry’s maintenance and expense levels, as some of the benefits derived from benchmarking in mechanization industries include and identify information that will enhance throughput and lower expense [45]:
- Improvement in information flow between all departments;
- Improvements in services and quality control;
- Reduced overall expenses;
- Improvements in team spirit and morale.
3.4. Model for Improvement in Benchmarking for Industries
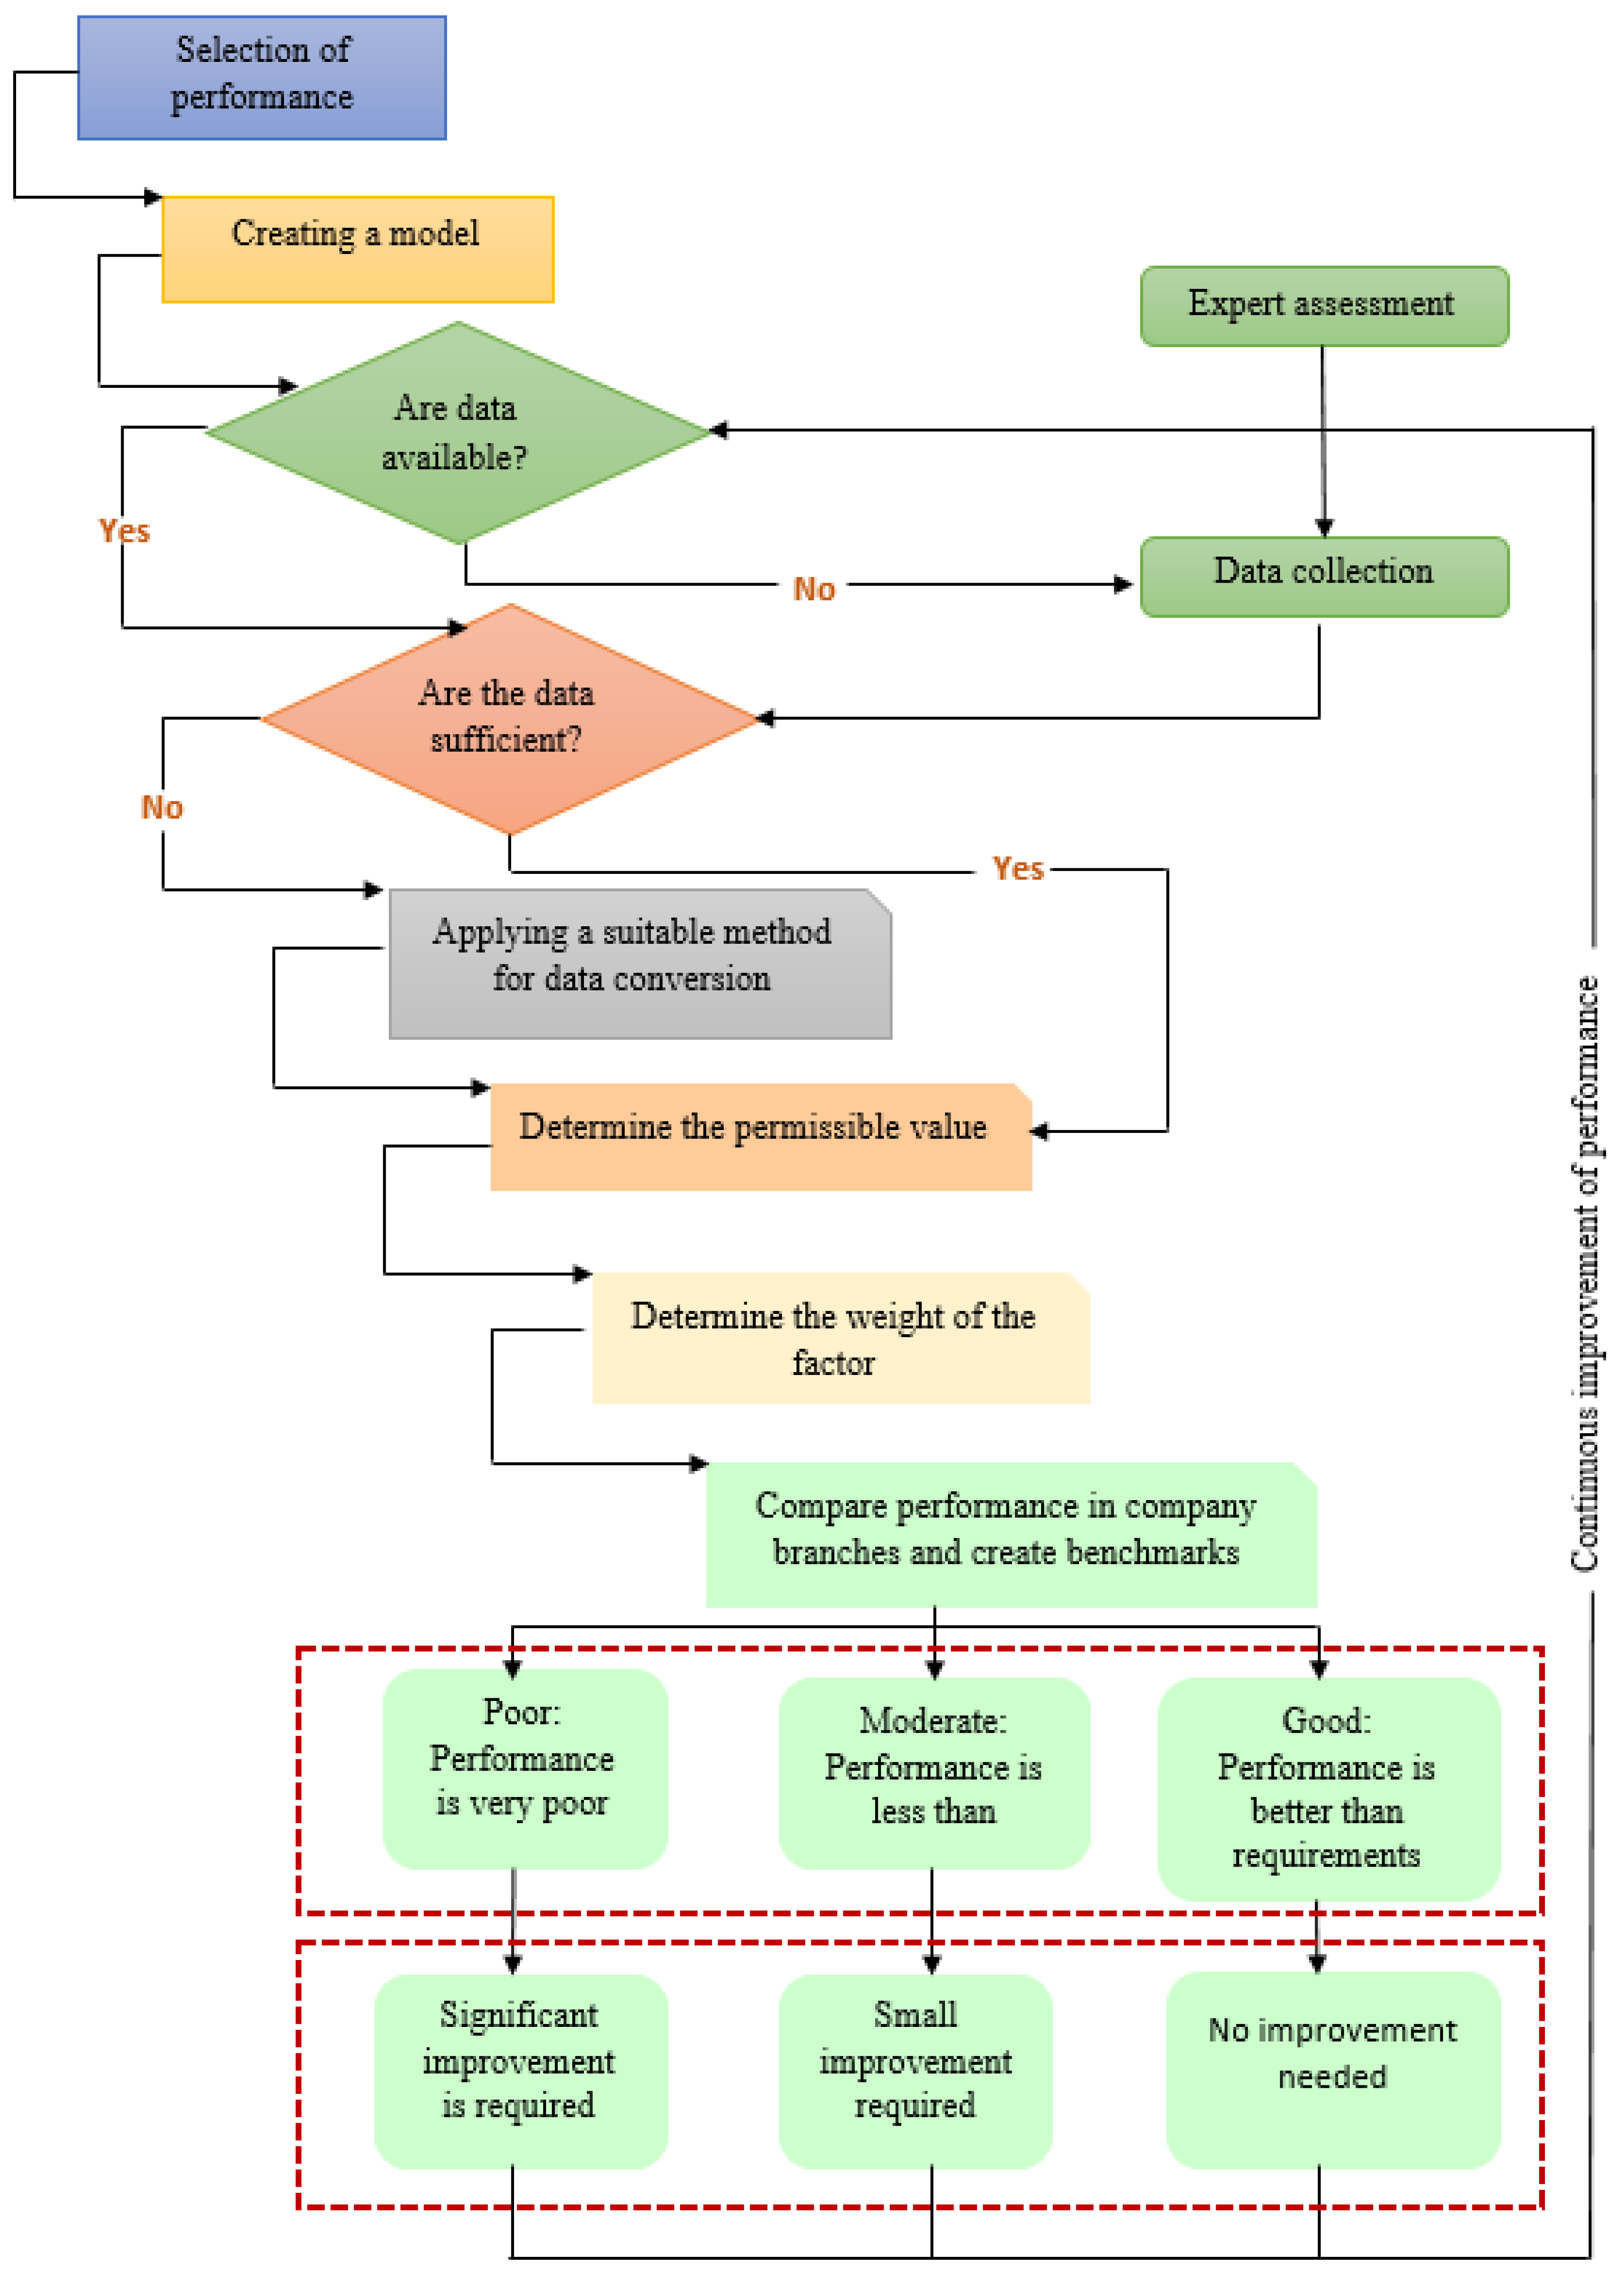
A methodology was proposed for the development of an internal benchmarking model for the company under survey. The model was created using algorithmization based on the results of the benchmarking. In the created model, the potential of improving the activity and its efficiency by undertaking simple steps was raised. The goal of the model in Figure 9 is, for any company, for it to be applied across the board in all its branches, which would unify the structure and content and thus facilitate internal benchmarking. Within the internal processes, the variables must be unified, as this speeds up the benchmarking process, making it more efficient from the points of view of both human resources and costs.
Given the needs of the benchmarking model proposed for streamlining internal processes, it is necessary to exactly define the platform for comparing the performance parameters obtained from detailed analyses of the internal environment of industrial enterprises. If the input parameters necessary to create a comparative platform are not available, it is essential to obtain an expert evaluation of the internal processes of data collection with the aim of its construction. In the absence of input parameters containing the necessary qualitative or quantitative benchmarking data, it is necessary to choose an effective method allowing the clear conversion of benchmarking factors. The thus-obtained benchmarking factors will be quantified by weight levels determining their importance in the benchmark, with an emphasis on the exact quantification of the permissible value of the partial input parameters of the comparative benchmarking platform. After the exact quantification of the performance parameters, in a logical sequence, the company proceeds to their mutual comparison and the creation of benchmarks, the summarization of which determines the performance category: poor, moderate, or good. If benchmarking reveals the poor performance of the company, significant streamlining is necessary to ensure continuous performance improvement. If benchmarking shows the moderate performance of the company (the performance is lower than the requirements), a small amount of streamlining is necessary, determining the continuous improvement of performance. If benchmarking shows the good performance of the enterprise (performance is better than requirements), there is no need to seek any continuous improvement in performance.
4. Discussion
The benefits that benchmarking offer to society manifest in several areas. As part of the internal benchmarking, the biggest weaknesses of the investigated companies were revealed. A problem area that significantly affects the costs and potential return is related to downtime reduction. The analyses reveal that reducing the time during which the equipment is not performing work could reduce costs in several areas. The causes are different, but the primary source is the human factor. In principle, for various reasons, machinists do not turn off the equipment, and even when they are not working, the equipment is on. Remedial measures should therefore be taken based mainly on interviews with persons interested in the activity itself, as well as their superiors. In each investigated company, a data collection system is applied, and its use should help in identifying the facilities and the responsible persons. The consequences of this activity are as follows:
- Increased maintenance costs, as the system is set for maintenance after 250 motor hours, and in this case, real equipment reaches this time point earlier than it would under a reasonable workload;
- The selling price is reduced by considering the condition of the vehicle and its lifespan, and costs associated with consumed fuel are thus reduced;
- The burden on the environment caused by exhalates would be reduced;
- The service cycle and associated costs would be optimized.
If the company accepts the proposed solution, there will be significant cost savings. After the implementation of benchmarking, the management of the organization should approach the evaluation of the real benefits of benchmarking (even in comparison with the efforts and costs) and decide on the continuation and further use of the benchmarking method in the improvement of the organization and its managed area. Sharing the results and experience derived via the application of benchmarking not only directly with management and benchmarking partners, but also in the form of a workshop, via the intranet, or so, can help to convince the employees about the positive influence and impact on the organization of this approach.
As with any repetitive process, there should be gradual improvement and learning from mistakes [46,47]. The organization should correctly recognize the essence of the good practice it is interested in adopting. It should also understand all the contexts that need to be respected when adopting good practice (a change in the process may also require the modification of management and evidence documentation, the modification of the organizational structure, or the acquisition and introduction of new technologies or competencies). In the standard conditions of the agreement of benchmarking partners, each of the partners should carry out the collection of data related to all agreed benchmarking indicators. Therefore, it is important that the final set of indicators truly represent the interests and commitments of each member of the benchmarking partnership. A potential factor limiting the number of approved indicators is the difficulty of finding data or performing measurements to determine the resulting value of the indicator. The largest share of resources used in the implementation of the benchmarking methodology often consists of collected data [48,49].
The key contribution here is the design of an effective internal benchmarking model, established via a systemic and complex approach to the solution of the described issue. This system integrates two interactive levels, namely, the level of the regular monitoring and evaluation of management based on clearly defined indicators [50,51], and the evaluation of viability, determining the production power and competitiveness, and thus creating benefits [52]. A model of effective benchmarking was proposed in the form of an open model that can be constantly expanded, and, after generalization and the addition of specific determinants of the course of activities, it can also be applied in solving this problem in other enterprises of a manufacturing and non-manufacturing nature in other national economic sectors. The openness of the proposed model indicates its flexibility and adaptability to the specifics of other national economic sectors, which require other new evaluation methods to determine the production capacity and viability of manufacturing and non-manufacturing enterprises. In this way, it would be possible to modify the proposed model and adapt it to the needs of improving management, with an emphasis on making management more efficient during service, solving the issue of minimizing downtime, and reducing the carbon footprint and thereby supporting sustainable development.
5. Conclusions
This study was focused on the use of the benchmarking method in business. The main goal was the harmonization of individual processes and their subsequent implementation and generalization for the creation of a model that can also be used in other industrial branches. Benchmarking represents a medium for comparative analyses that will directly determine the continuous improvement of the performance of industrial enterprises, with the aim of improving their sustainability on the market and supporting their sustainable development, as this contributes to meeting the needs of all market participants. The results of benchmarking also clearly support the sustainable development of the environment through the continuous improvement of the internal processes of companies in such a way as to mitigate the impacts on environmental quality, including environmental health. These facts are also highlighted by the results of the presented benchmarking study, which emphasize the increased efficiency and quality of individual internal processes of the compared companies, while also respecting the variables related to the sustainability of companies on the industrial market, so as to better satisfy the needs of not only current but also future customers, and thus constantly improve the customer base–supplier relations. Effective performance, as well as the high-quality, responsible, and transparent management of the internal processes of companies in the industrial sphere, are key when determining their competitiveness and sustainability on the industrial market, with the necessity of continuous improvements based specifically on benchmarking. Two main conditions enabling the implementation of benchmarking were addressed, namely: the at least acceptable readiness of enterprises, and the existence of a functional strategy for the work procedure. The fulfillment of these conditions is important because:
- Without them, the documents and preparation necessary for creating benchmarking will not be prepared correctly;
- Without them, certain facts will not be given the importance necessary;
- The meaning and benchmarking may change, which may affect the chosen strategy;
- The implementation of the benchmarking process may be suspended, or some parts of the process may be omitted;
- The company can create benchmarking that will not meet basic conditions, such as credibility, relevance of information, objectivity, and others.
For this reason, some of the critical points, which are essential to the creation of benchmarking, such as unclear intent setting, inappropriate time frame, project team, etc., were further addressed. A summary of practical benefits that can be inferred from practical cases has been given. It is important to address the suitability of benchmarking for types of businesses. Furthermore, it is necessary to construct a method for creating benchmarking in the case of a larger number of divisions of one company. Subsequently, other areas for the possible theoretical and practical development of benchmarking have been outlined. In management science, it is important that benchmarking be developed in its theoretical aspect as well, so that some procedures can then be transferred into practice. There are deficiencies in measuring enterprise performance post-implementation. These shortcomings are related to the measurement procedures applied during the process. Furthermore, it would be interesting to develop benchmarking due to its connection with other scientific disciplines. It is also important to examine various areas of knowledge related to the creation of a benchmarking team, which is very important in the whole process. From this point of view, the results of other management disciplines are beginning to be applied and recognized. Another potential specific area of benchmarking development focuses on those process properties, which are the driving force supporting open and proactive thinking in people. The main benefit of the study is that, based on the processed data, it can make operations more efficient and achieve economic and environmental sustainability. The limitations of the study include the limitations of the studied company that made the prioritization. These limitations are bypassed in the proposed model, which addresses all the aspects of internal benchmarking for industries in a sustainable way.
Supplementary Materials
The following supporting information can be downloaded at: https://www.mdpi.com/article/10.3390/su16062587/s1, Table S1: Tracked excavators over 35 T; Table S2: Wheel loaders over 135 kW; Table S3: Rigid dumpers payload under 40 T.
Author Contributions
Conceptualization, L.B., T.B., H.P., R.R. and Z.Š.; methodology, L.B., T.B., H.P., R.R. and Z.Š.; validation, L.B., T.B., H.P., R.R. and Z.Š.; formal analysis, L.B., T.B., H.P., R.R. and Z.Š.; investigation, L.B., T.B., H.P., R.R. and Z.Š.; resources, L.B., T.B., H.P., R.R. and Z.Š.; data curation, L.B., T.B., H.P., R.R. and Z.Š.; writing—original draft preparation, L.B. and T.B.; writing—review and editing, T.B. and H.P.; visualization, L.B., T.B., H.P., R.R. and Z.Š. All authors have read and agreed to the published version of the manuscript.
Funding
This research received no external funding.
Institutional Review Board Statement
Not applicable.
Informed Consent Statement
Not applicable.
Data Availability Statement
The original contributions presented in the study are included in the article/Supplementary Materials, further inquiries can be directed to the corresponding author.
Conflicts of Interest
The authors declare no conflicts of interest.
References
- Litvinenko, V.S. Digital Economy as a Factor in the Technological Development of the Mineral Sector. Nat. Resour. Res. 2020, 29, 1521–1541. [Google Scholar] [CrossRef]
- Surya, B.; Menne, F.; Sabhan, H.; Suriani, S.; Abubakar, H.; Idris, M. Economic Growth, Increasing Productivity of SMEs, and Open Innovation. J. Open Innov. Technol. Mark. Complex. 2021, 7, 20. [Google Scholar] [CrossRef]
- Dana, L.-P.; Salamzadeh, A.; Mortazavi, S.; Hadizadeh, M. Investigating the Impact of International Markets and New Digital Technologies on Business Innovation in Emerging Markets. Sustainability 2022, 14, 983. [Google Scholar] [CrossRef]
- Aldianto, L.; Anggadwita, G.; Permatasari, A.; Mirzanti, I.R.; Williamson, I.O. Toward a Business Resilience Framework for Startups. Sustainability 2021, 13, 3132. [Google Scholar] [CrossRef]
- Gómez-Bolaños, E.; Hurtado-Torres, N.E.; Delgado-Márquez, B.L. Disentangling the influence of internationalization on sustainability development: Evidence from the energy sector. Bus. Strat. Env. 2020, 29, 229–239. [Google Scholar] [CrossRef]
- Hervé, A.; Schmitt, C.; Baldegger, R. Internationalization and Digitalization: Applying digital technologies to the internationalization process of small and medium-sized enterprises. Technol. Innov. Manag. Rev. 2020, 10, 28–40. [Google Scholar] [CrossRef]
- Rybár, R.; Kudelas, D.; Perunko, S.; Taus, P. Renewable energy sources role in the energy sources diversification process in Slovak republic focused on east Slovakia region. Acta Montan. Slovaca 2008, 13, 338–342. [Google Scholar]
- Toborek-Mazur, J.; Partacz, K.; Surówka, M. Energy Security as a Premise for Mergers and Acquisitions on the Example of the Multi-Energy Concern PKN Orlen in the Face of the Challenges of the 2020s. Energies 2022, 15, 5112. [Google Scholar] [CrossRef]
- Schmalz, M.C. Recent Studies on Common Ownership, Firm Behavior, and Market Outcomes. Antitrust Bull. 2021, 66, 12–38. [Google Scholar] [CrossRef]
- Krasyuk, I.; Kirillova, T.; Amakhina, S. Marketing concepts development in the digital economic environment. In Proceedings of the SPBPU IDE ‘19: 2019 International SPBPU Scientific Conference on Innovations in Digital Economy, St. Petersburg, Russia, 24–25 October 2019; pp. 1–6. [Google Scholar] [CrossRef]
- Şimşek, T.; Öner, M.A.; Kunday, Ö.; Olcay, G.A. A journey towards a digital platform business model: A case study in a global tech-company. Technol. Forecast. Soc. Chang. 2022, 175, 121372. [Google Scholar] [CrossRef]
- Drezner, J.A.; Schmid, J.; Grana, J.; McKernan, M.; Ashby, M. Benchmarking Data Use and Analytics in Large, Complex Private-Sector Organizations: Implications for Department of Defense Acquisition; RAND Corporation: Santa Monica, CA, USA, 2020; Available online: https://www.rand.org/pubs/research_reports/RRA225-1.html (accessed on 10 November 2023).
- Singh, R.; Ramdeo, S. Leading Organizational Development and Change: Principles and Contextual Perspectives; Springer Nature: Amsterdam, The Netherlands, 2020. [Google Scholar]
- Zhao, E. Optimal Distinctiveness: A New Agenda for the Study of Competitive Positioning of Organizations and Markets (Elements in Organization Theory); Cambridge University Press: Cambridge, UK, 2022. [Google Scholar] [CrossRef]
- Maleyeff, J. Quality Service Management: A Guide to Improving Business Processes; Routledge: New York, NY, USA, 2022. [Google Scholar]
- Yılmaz, F.; Matthes, F. Application of Interorganizational Business Capability Maps in Different Forms of Horizontal Enterprise Architecture Collaboration. In Proceedings of the IEEE 23rd Conference on Business Informatics (CBI), Bolzano, Italy, 1–3 September 2021. [Google Scholar] [CrossRef]
- Kingdom, B.; Jagannathan, V. Utility Benchmarking: Public Reporting of Service Performance; Public Policy for the Private Sector, Note Number 229; World Bank: Washington, DC, USA, 2001. [Google Scholar]
- Watson, G.A. Perspective on Benchmarking. Benchmarking Qual. Manag. Technol. 1994, 1, 5–10. [Google Scholar]
- Čikovský, K. Ministerstvo Odporúča Firmám Porovnávať Sa s Najlepšími. Available online: https://www.trend.sk/financie/ministerstvo-odporuca-firmam-porovnavat-najlepsimi (accessed on 1 September 2023).
- Daniš, V. Porovnávanie Najlepších s Najlepšímy. Available online: https://euractiv.sk/section/podnikanie-a-praca/opinion/porovnavanie-najlepsich-s-najlepsimi/ (accessed on 1 September 2023).
- Cattan, M.; Idrissi, N.; Knockaert, P. Maîtriser les Processus de L’entreprise; Editions d’Organisation: Paris, France, 2006. [Google Scholar]
- Bhattacharya, S.; Momaya, K.S.; Iyer, K.C. Benchmarking enablers to achieve growth performance: A conceptual framework. Benchmarking Int. J. 2020, 27, 1475–1501. [Google Scholar] [CrossRef]
- Pillet, M. Appliquer Six Sigma; Editions d’Organisation: Paris, France, 2004. [Google Scholar]
- Crépin, D.; Robin, R. Résolution de Problèmes; Editions d’Organisation: Paris, France, 2001. [Google Scholar]
- Kepner, C.H.; Tregoe, B.B. The New Rational Manager; Princeton Research Press: Princeton, NJ, USA, 1981. [Google Scholar]
- Seven, Ü.; Yılmaz, F. World equity markets and COVID-19: Immediate response and recovery prospects. Res. Int. Bus. Financ. 2021, 56, 101349. [Google Scholar] [CrossRef]
- Hidayat, S.E.; Rafiki, A. Comparative analysis of customers’ awareness toward CSR practices of Islamic banks: Bahrain vs. Saudi Arabia. Soc. Responsib. J. 2022, 18, 1142–1171. [Google Scholar] [CrossRef]
- Adebanjo, D.; Mann, R. Benchmarking. BPIR Manag. Brief 2021, 4, 1–12. Available online: https://coer.org.nz/wp-content/uploads/2011/10/D10_Benchmarking_MB_Final.pdf (accessed on 19 November 2023).
- Mikuła, A.; Raczkowska, M.; Utzig, M. Pro-Environmental Behaviour in the European Union Countries. Energies 2021, 14, 5689. [Google Scholar] [CrossRef]
- Kopa, M.; Sutiene, K.; Kabasinskas, A.; Lakstutiene, A.; Malakauskas, A. Dominance Tracking Index for Measuring Pension Fund Performance with Respect to the Benchmark. Sustainability 2022, 14, 9532. [Google Scholar] [CrossRef]
- Zimon, G.; Nakonieczny, J.; Chudy-Laskowska, K.; Wójcik-Jurkiewicz, M.; Kochański, K. An Analysis of the Financial Liquidity Management Strategy in Construction Companies Operating in the Podkarpackie Province. Risks 2022, 10, 5. [Google Scholar] [CrossRef]
- Franc-Dabrowska, J.; Madra-Sawicka, M.; Milewska, A. Energy Sector Risk and Cost of Capital Assessment—Companies and Investors Perspective. Energies 2021, 14, 1613. [Google Scholar] [CrossRef]
- Shan, M.; Li, Y.-S.; Hwang, B.-G.; Chua, J.-E. Productivity Metrics and Its Implementations in Construction Projects: A Case Study of Singapore. Sustainability 2021, 13, 12132. [Google Scholar] [CrossRef]
- Schrimpf, M.; Kubilius, J.; Lee, M.J.; Murty, N.A.R.; Ajemian, R.; DiCarlo, J.J. Integrative Benchmarking to Advance Neurally Mechanistic Models of Human Intelligence. Neuron 2020, 108, 413–423. [Google Scholar] [CrossRef]
- Ackloo, S.; Al-Awar, R.; Amaro, R.E.; Arrowsmith, C.H.; Azevedo, H.; Batey, R.A.; Bengio, Y.; Betz, U.A.K.; Bologa, C.G.; Chodera, J.D.; et al. CACHE (Critical Assessment of Computational Hit-finding Experiments): A public–private partnership benchmarking initiative to enable the development of computational methods for hit-finding. Nat. Rev. Chem. 2022, 6, 287–295. [Google Scholar] [CrossRef] [PubMed]
- Quantum Technology and Application Consortium—QUTAC; Bayerstadler, A.; Becquin, G.; Binder, J.; Botter, T.; Ehm, H.; Ehmer, T.; Erdmann, M.; Gaus, N.; Harbach, P.; et al. Industry quantum computing applications. EPJ Quantum Technol. 2021, 8, 25. [Google Scholar] [CrossRef]
- Pavolová, H.; Culková, K.; Simková, Z.; Senová, A.; Kudelas, D. Contribution of Mining Industry in Chosen EU Countries to the Sustainability Issues. Sustainability 2022, 17, 4177. [Google Scholar] [CrossRef]
- Fatras, N.; Ma, Z.; Duan, H.; Jørgensen, B.N. A systematic review of electricity market liberalisation and its alignment with industrial consumer participation: A comparison between the Nordics and China. Renew. Sustain. Energy Rev. 2022, 167, 112793. [Google Scholar] [CrossRef]
- Taus, P.; Kosco, J.; Rybár, R.; Kudelas, D. Technical and economical analysis of electric energy production from biomass. In Proceedings of the 11th International Multidisciplinary Scientific GeoConference-SGEM, Albena, Bulgaria, 20–25 June 2011. [Google Scholar]
- Chibanda, C.; Agethen, K.; Deblitz, K.; Zimmer, Y.; Almadani, M.I.; Garming, H.; Rohlmann, C.; Schütte, J.; Thobe, P.; Verhaagh, M.; et al. The Typical Farm Approach and Its Application by the Agri Benchmark Network. Agriculture 2020, 10, 646. [Google Scholar] [CrossRef]
- Jakubíková, D. Strategický Marketing—Strategie a Trendy; Grada Publishing: Praha, Czech Republic, 2008. [Google Scholar]
- Porter, M.E. The Competitive Advantage: Creating and Sustaining Superior Performance; Free Press: New York, NY, USA, 1985; Republished with a new introduction, 1998. [Google Scholar]
- Bednárová, L.; Šimková, Z.; Pavolová, H. Internal Benchmarking in Slovak SME: A Case Study. Pol. J. Manag. Stud. 2020, 21, 104–118. [Google Scholar] [CrossRef]
- Vološin, M. Strategický Manažment Podniku; Ekonóm: Bratislava, Slovakia, 2003. [Google Scholar]
- Singh, B.; Grover, S.; Singh, V.; Attri, R. An analytical hierarchy process for benchmarking of automobile car service industry in Indian context. Manag. Sci. Lett. 2015, 5, 543–554. [Google Scholar] [CrossRef]
- Azizzadeh, F.; Shirvani, A.; Bahrami, H.; Nafar, M. Contingency model of learning from mistakes in public sector of Iran. IJABER 2015, 13, 2469–2500. [Google Scholar]
- Stehn, L.; Engström, S.; Uusitalo, P.; Lavikka, R. Understanding industrialised house building as a company’s dynamic capabilities. Constr. Innov. 2021, 21, 5–21. [Google Scholar] [CrossRef]
- Robling, H.; Hatab, A.A.; Säll, S.; Hansson, H. Measuring sustainability at farm level—A critical view on data and indicators. Environ. Sustain. Indic. 2023, 18, 100258. [Google Scholar] [CrossRef]
- Poulopoulou, I.; Zanon, T.; Alrhmoun, M.; Katzenberger, K.; Holighaus, L.; Gauly, M. Development of a benchmarking tool to assess the welfare of dairy cattle on small-scale farms. J. Dairy Sci. 2023, 106, 6464–6475. [Google Scholar] [CrossRef] [PubMed]
- Osman, T.; Kenawy, E.; Abdrabo, K.I.; Shaw, D.; Alshamndy, A.; Elsharif, M.; Salem, M.; Alwetaishi, M.; Aly, R.M.; Elboshy, B. Voluntary Local Review Framework to Monitor and Evaluate the Progress towards Achieving Sustainable Development Goals at a City Level: Buraidah City, KSA and SDG11 as A Case Study. Sustainability 2021, 13, 9555. [Google Scholar] [CrossRef]
- Cai, W.; Wang, L.; Li, L.; Xie, J.; Jia, S.; Zhang, X.; Jiang, Z.; Lai, K. A review on methods of energy performance improvement towards sustainable manufacturing from perspectives of energy monitoring, evaluation, optimization and benchmarking. Renew. Sustain. Energy Rev. 2022, 159, 112227. [Google Scholar] [CrossRef]
- Zavarkó, M.; Imre, A.R.; Pörzse, G.; Csedő, Z. Past, Present and Near Future: An Overview of Closed, Running and Planned Biomethanation Facilities in Europe. Energies 2021, 14, 5591. [Google Scholar] [CrossRef]
Figure 1.
Number of tracked excavators by manufacturer per country.

Figure 2.
Benchmark analyses of tracked excavators for selected countries.
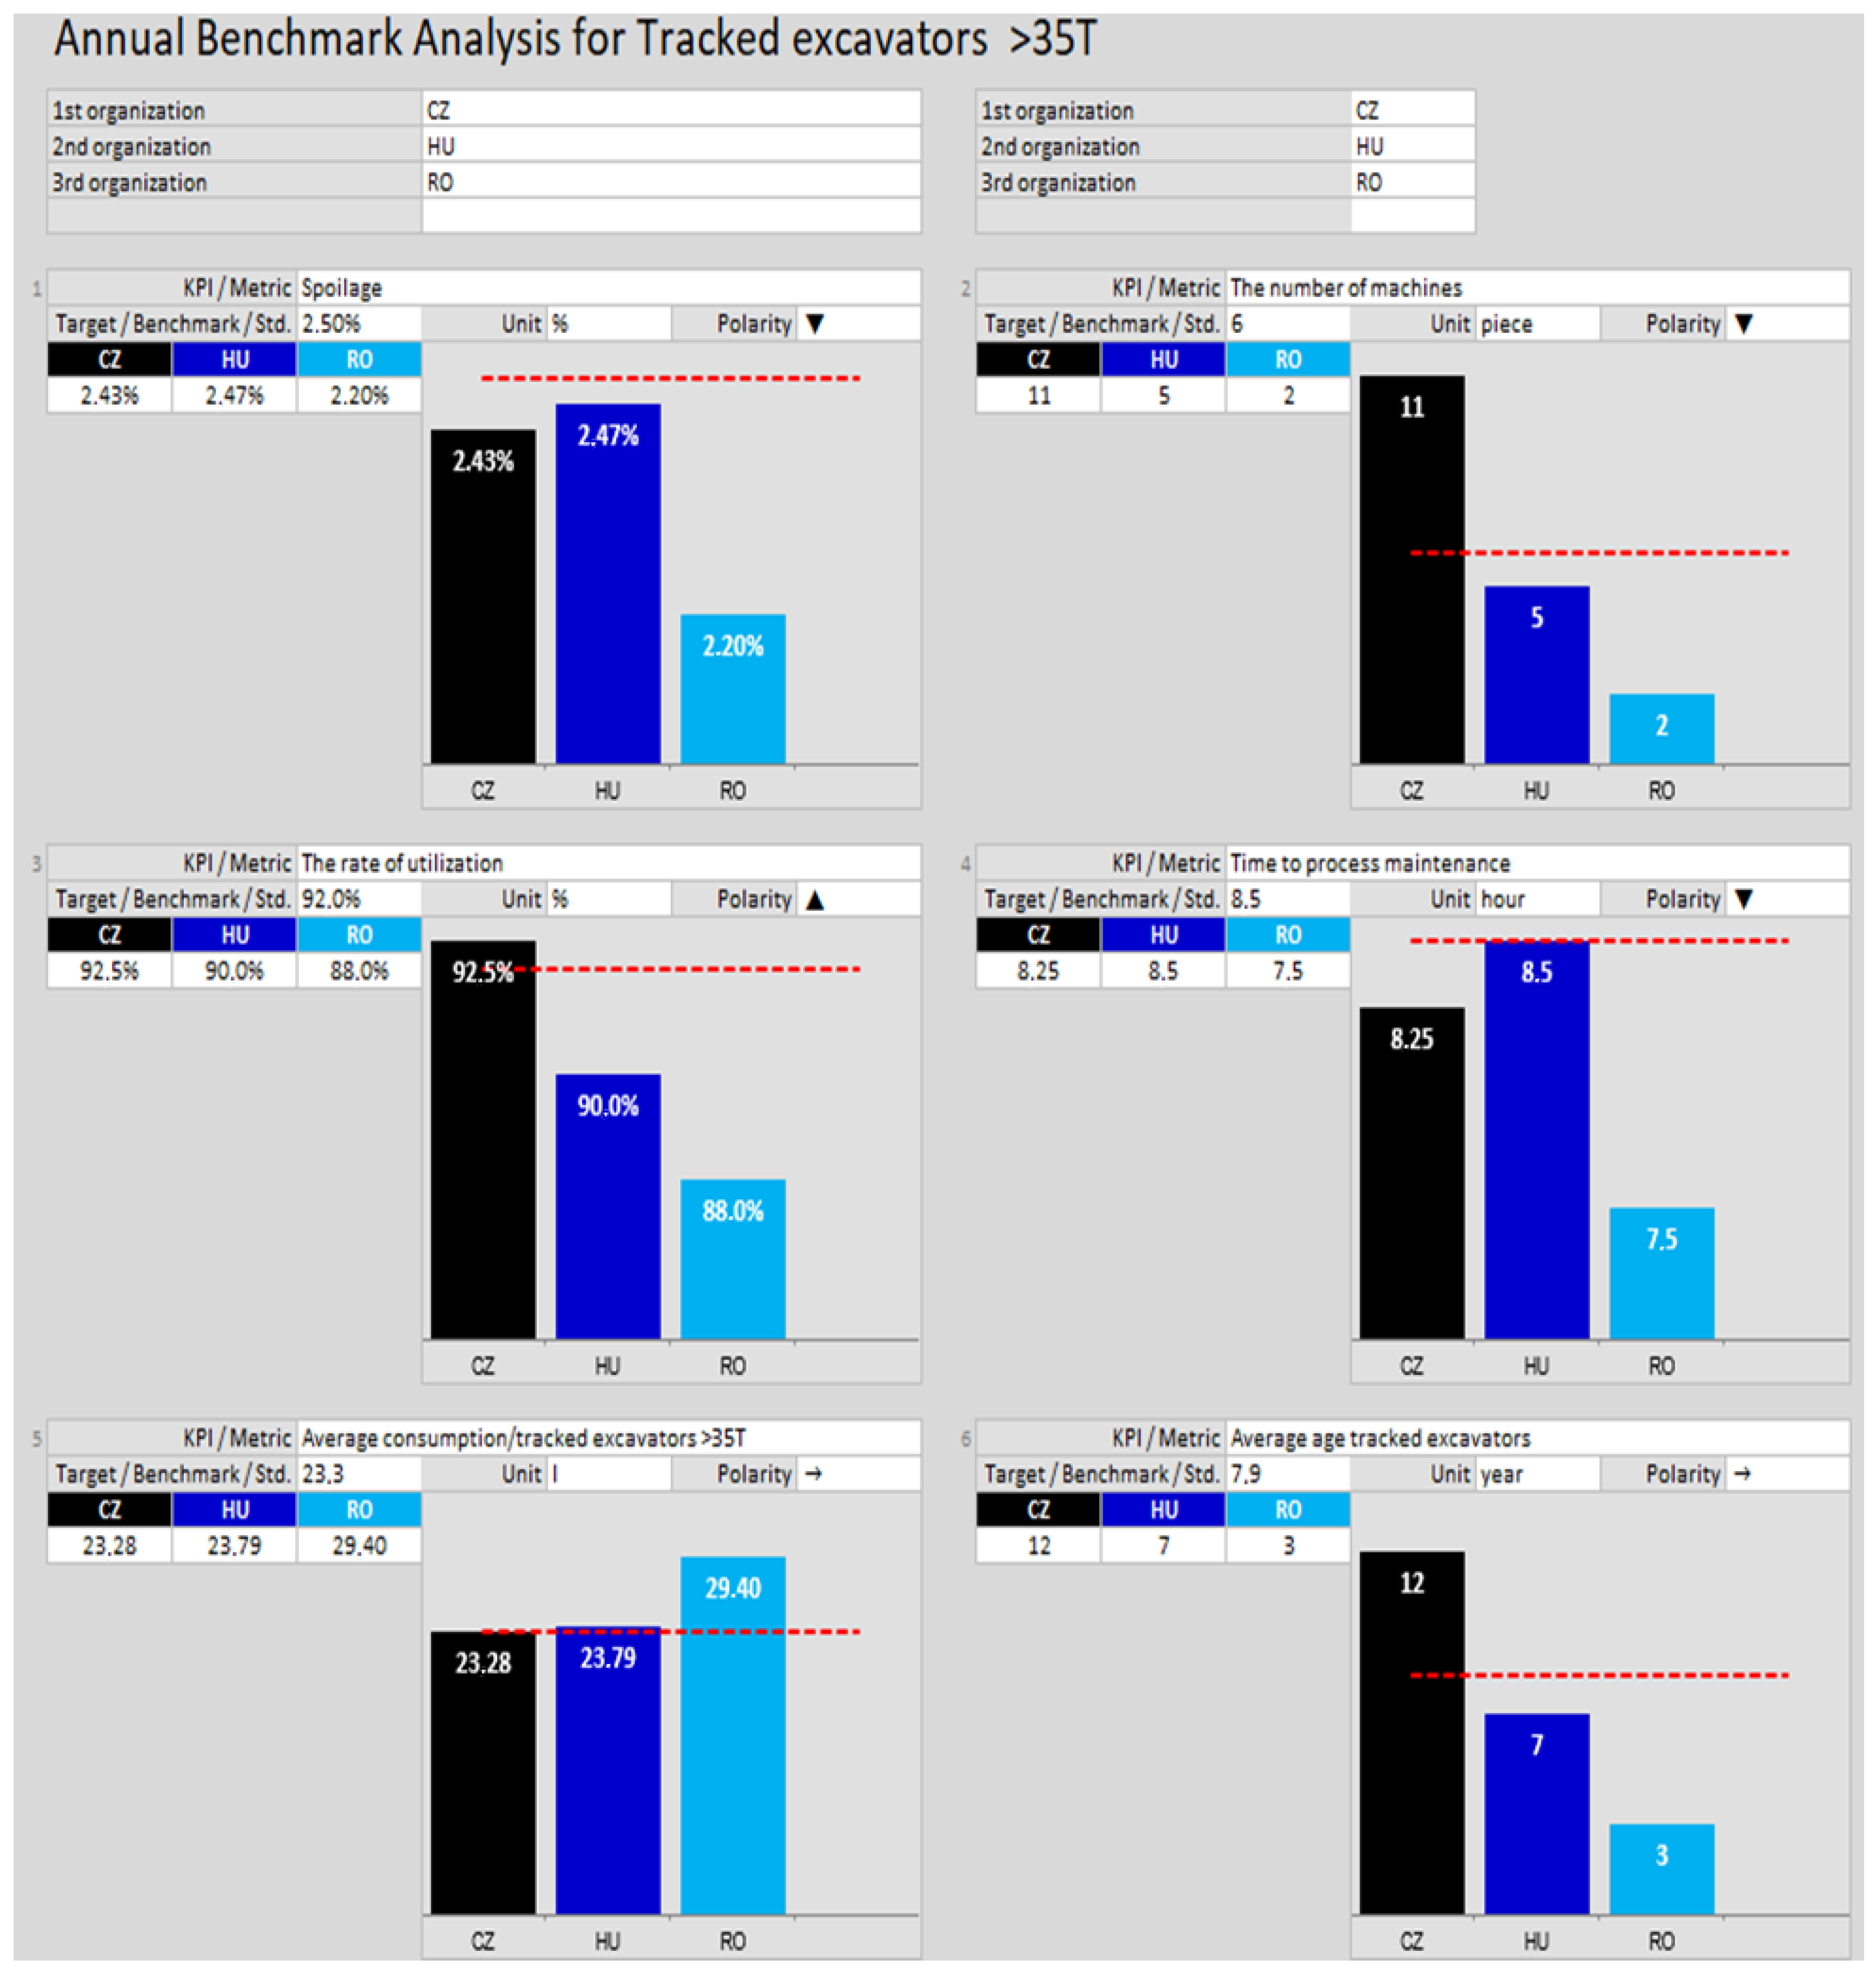
Figure 3.
Number of wheel loaders by manufacturer and country.
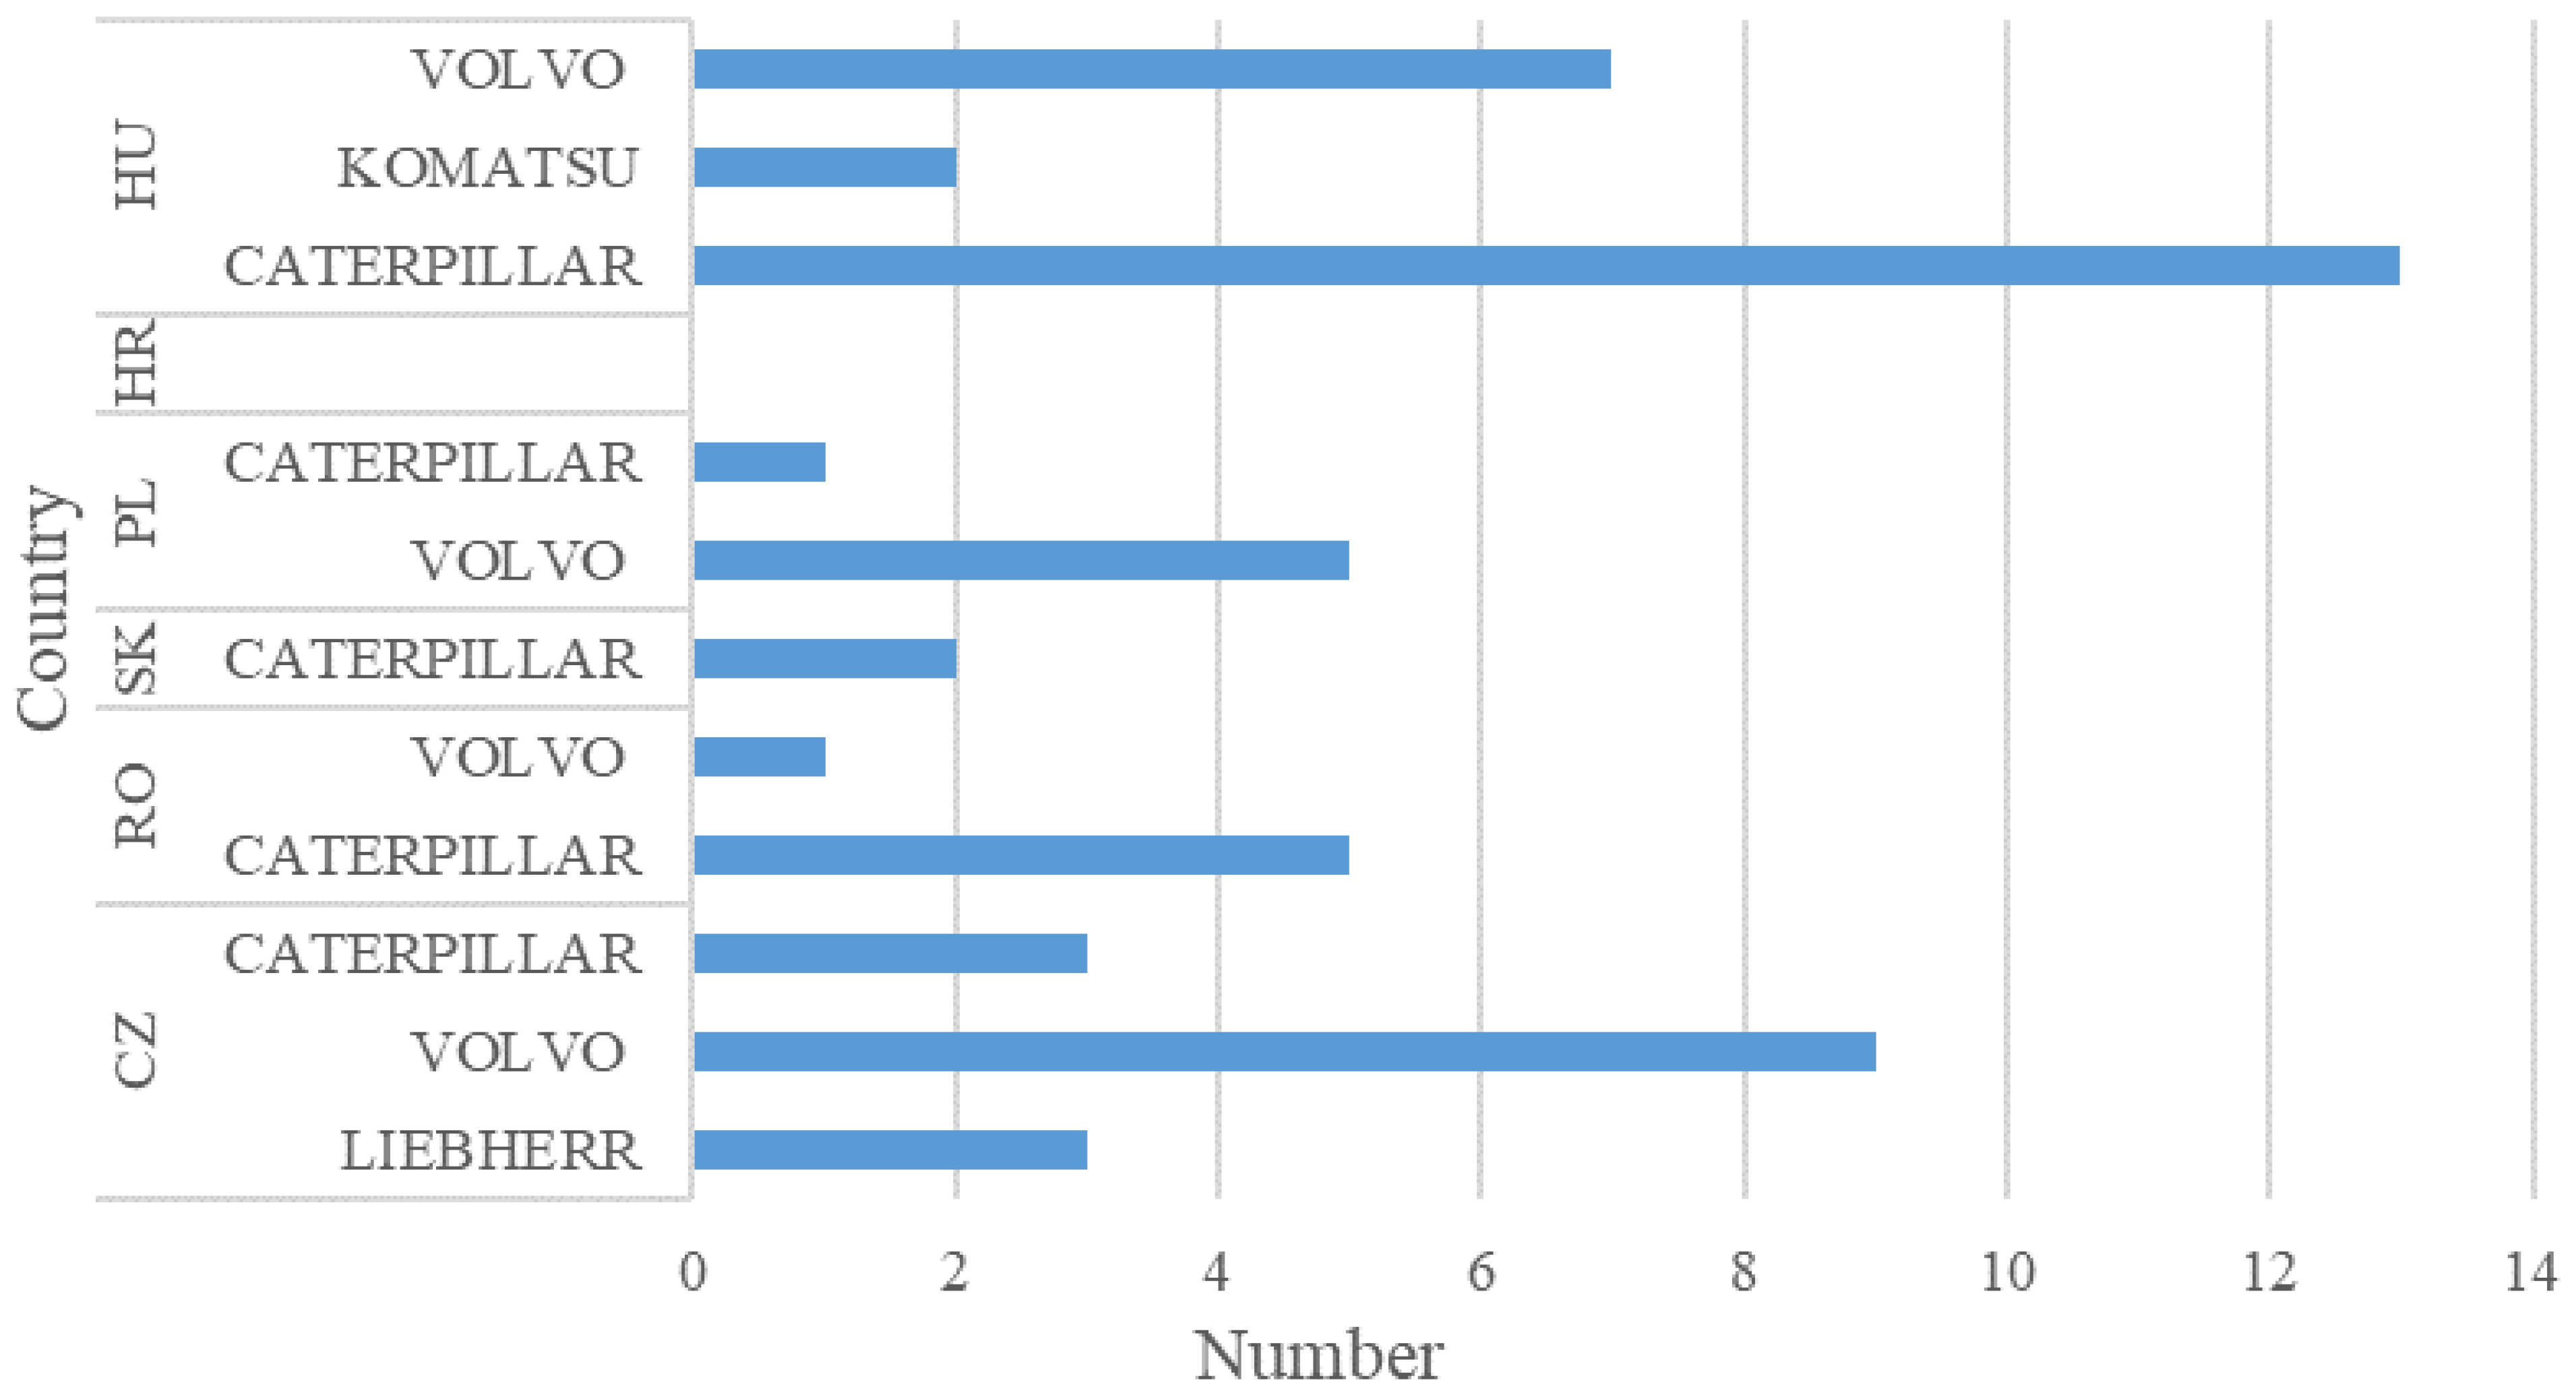
Figure 4.
Benchmark analyses of wheel loaders in selected countries.
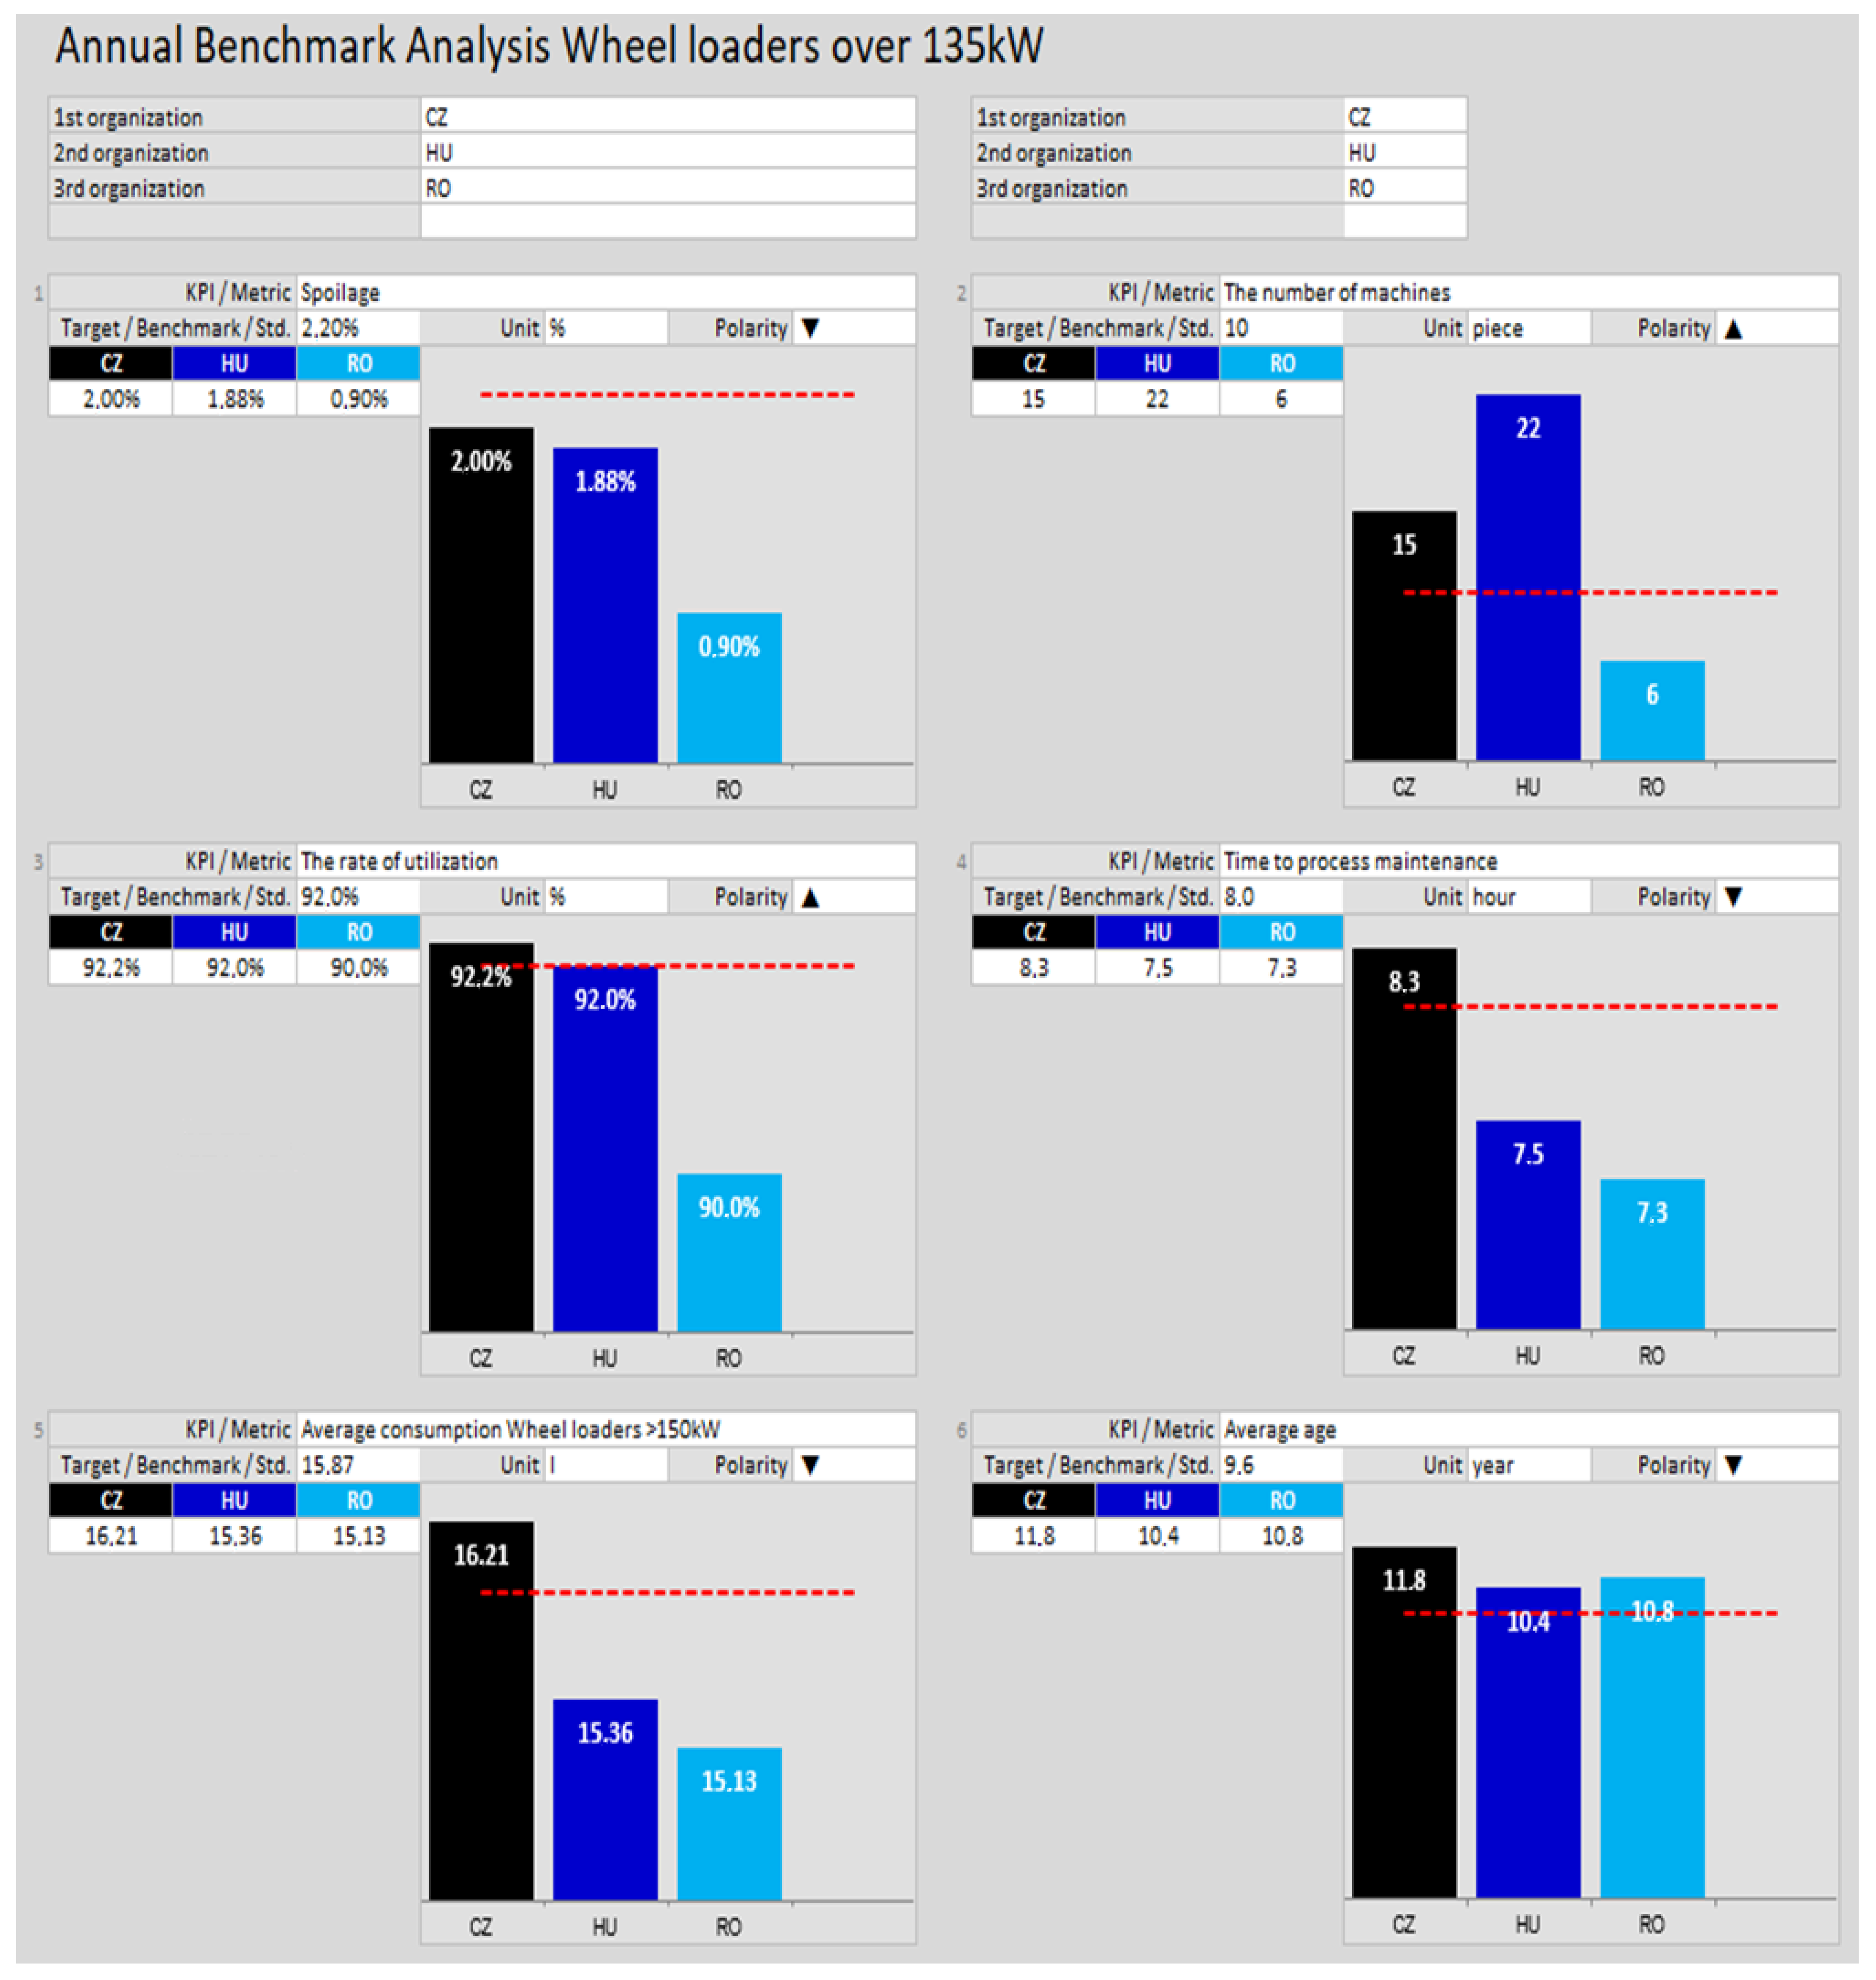
Figure 5.
Number of rigid dumper payloads by manufacturer per country.

Figure 6.
Benchmark analyses of rigid dumpers for selected countries.
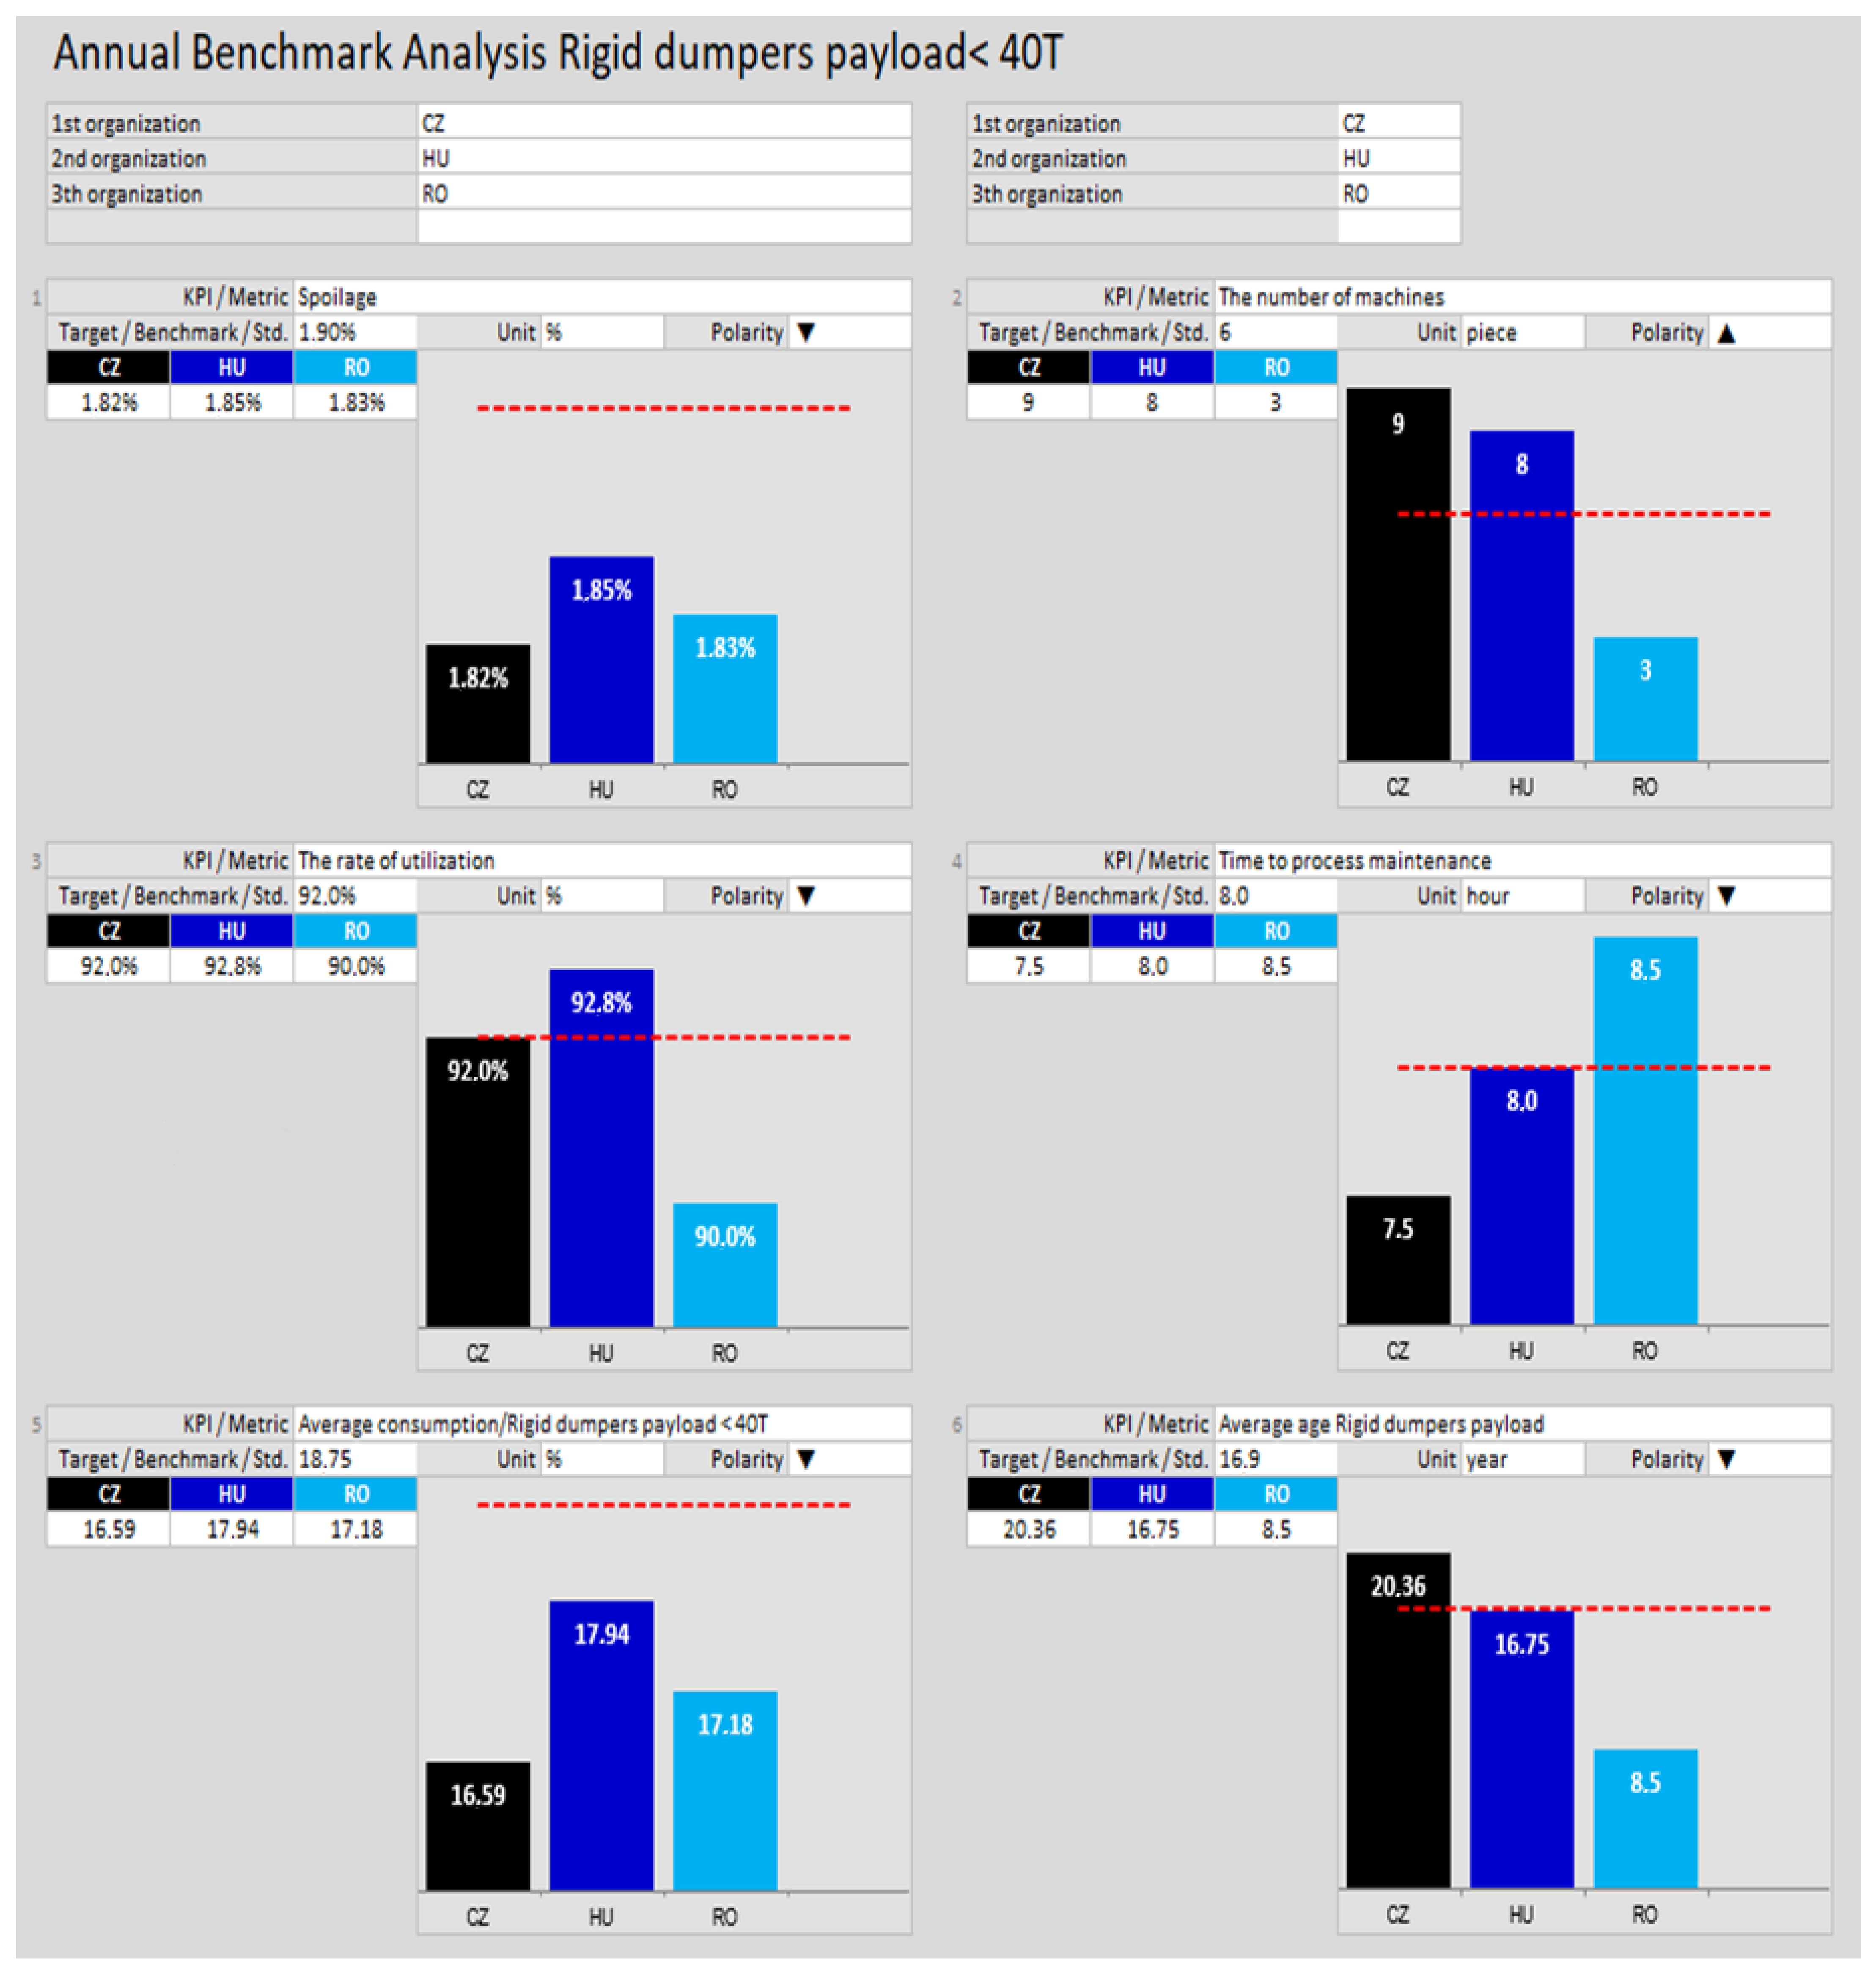
Figure 7.
Partner identification for benchmarking.
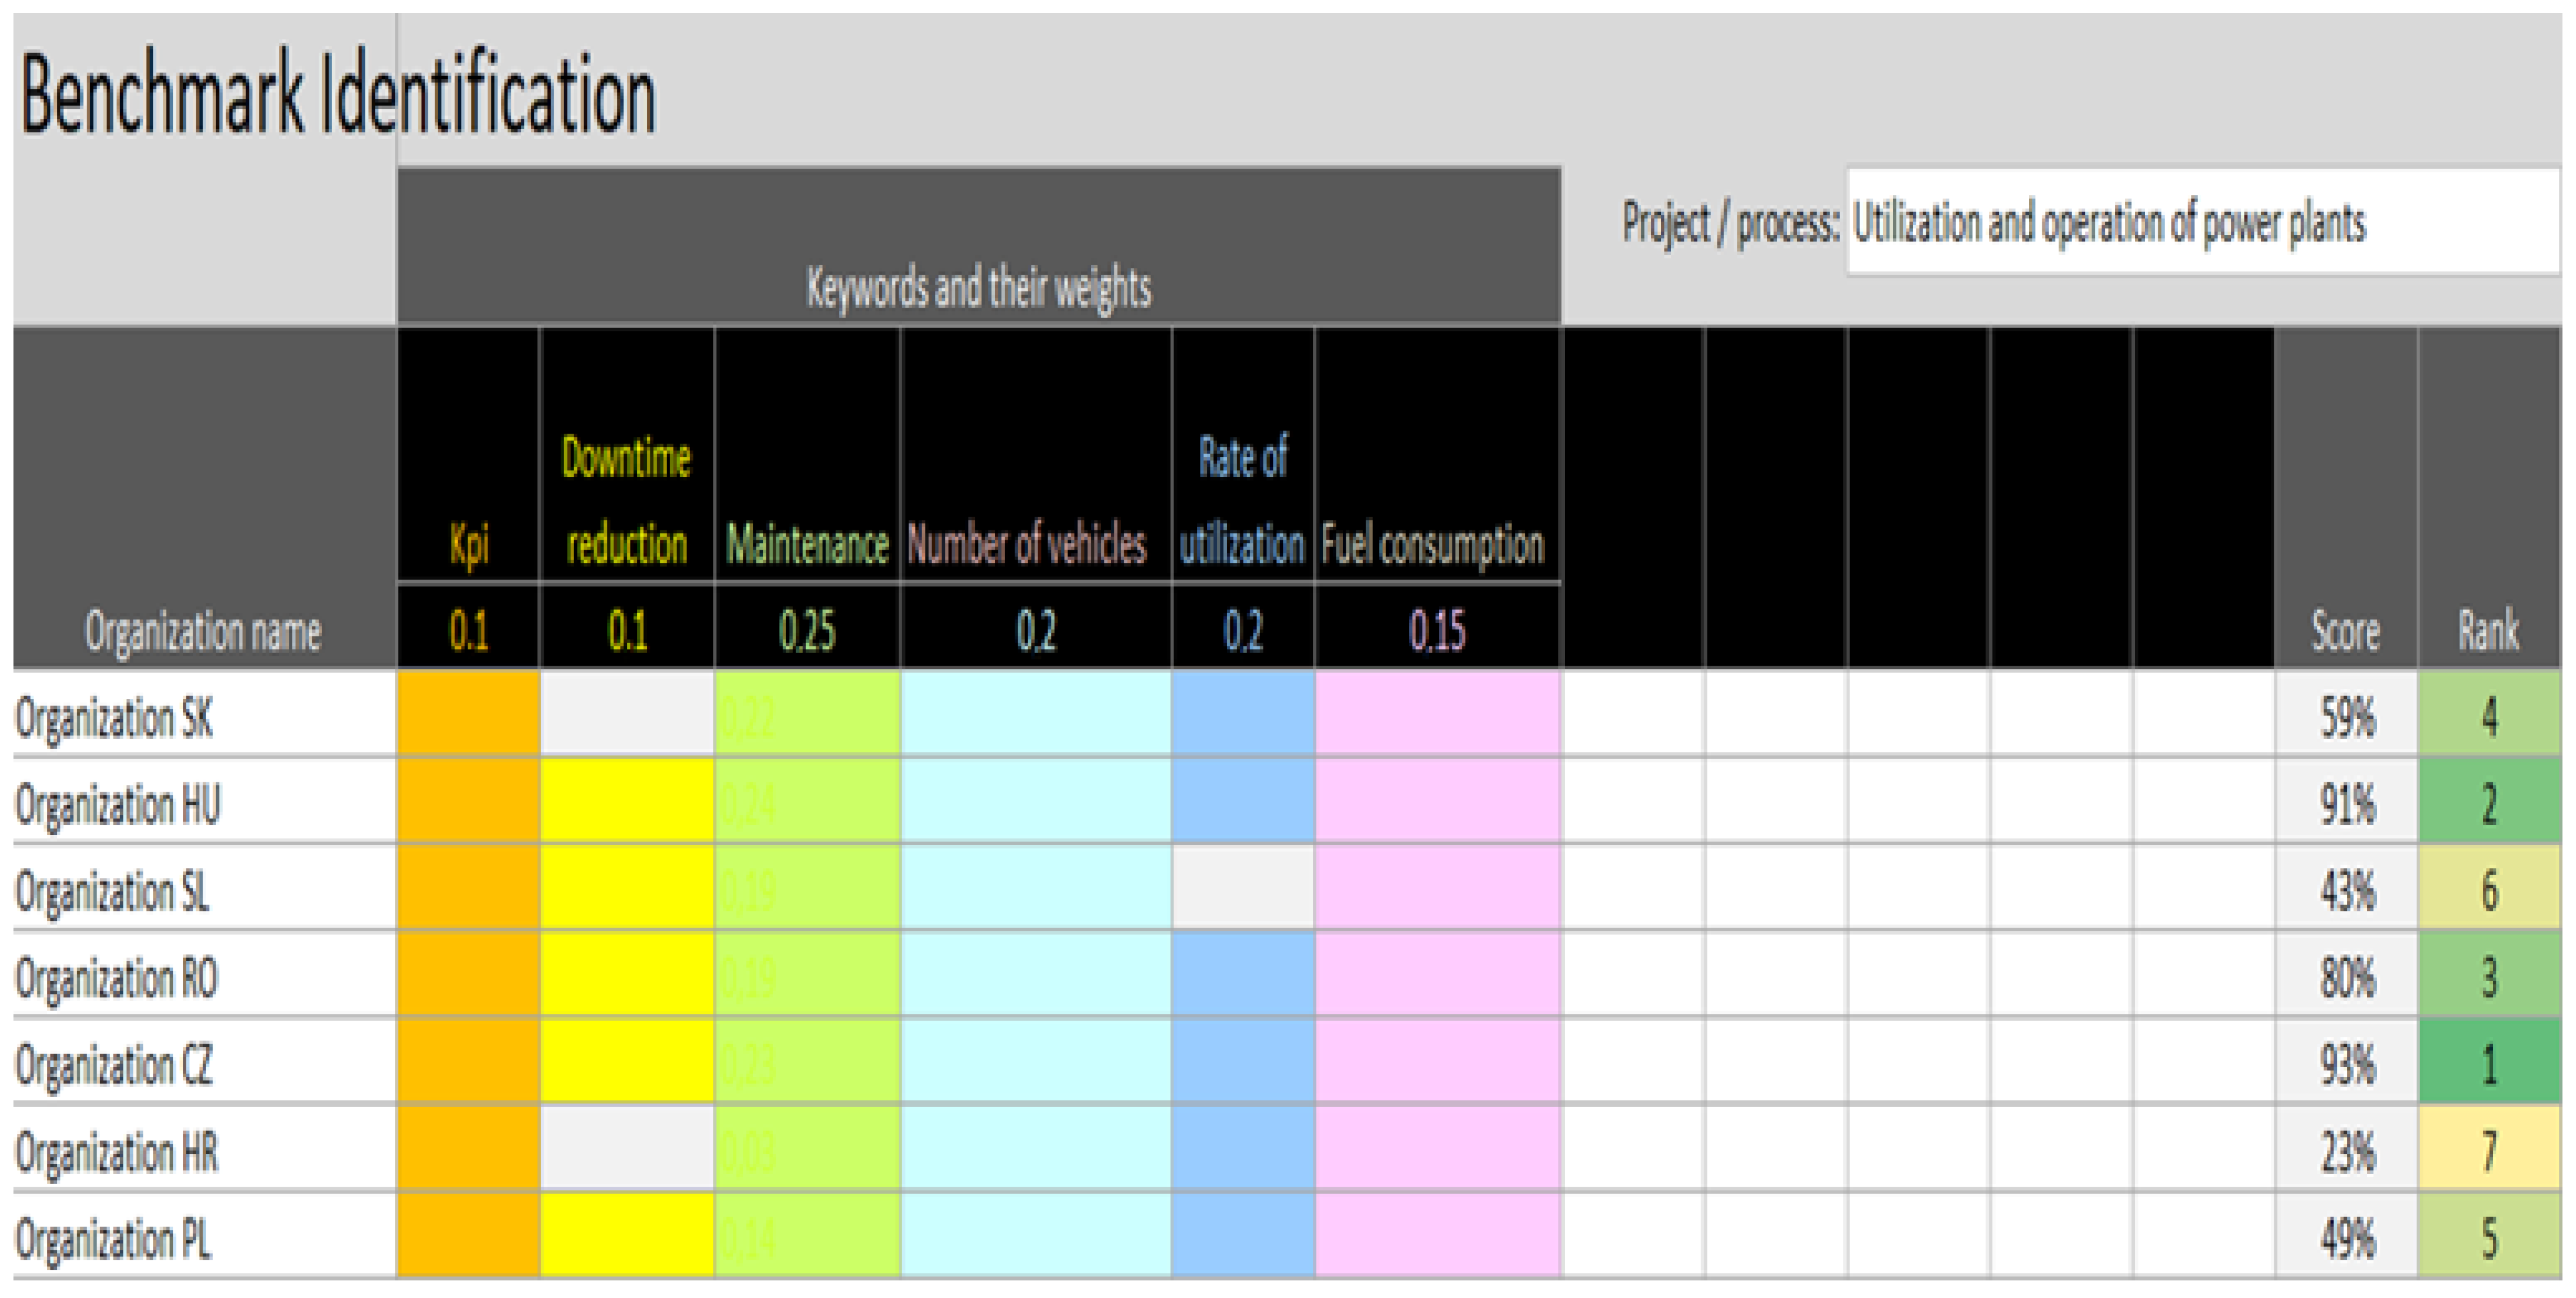
Figure 8.
Prioritization matrix for benchmarking.
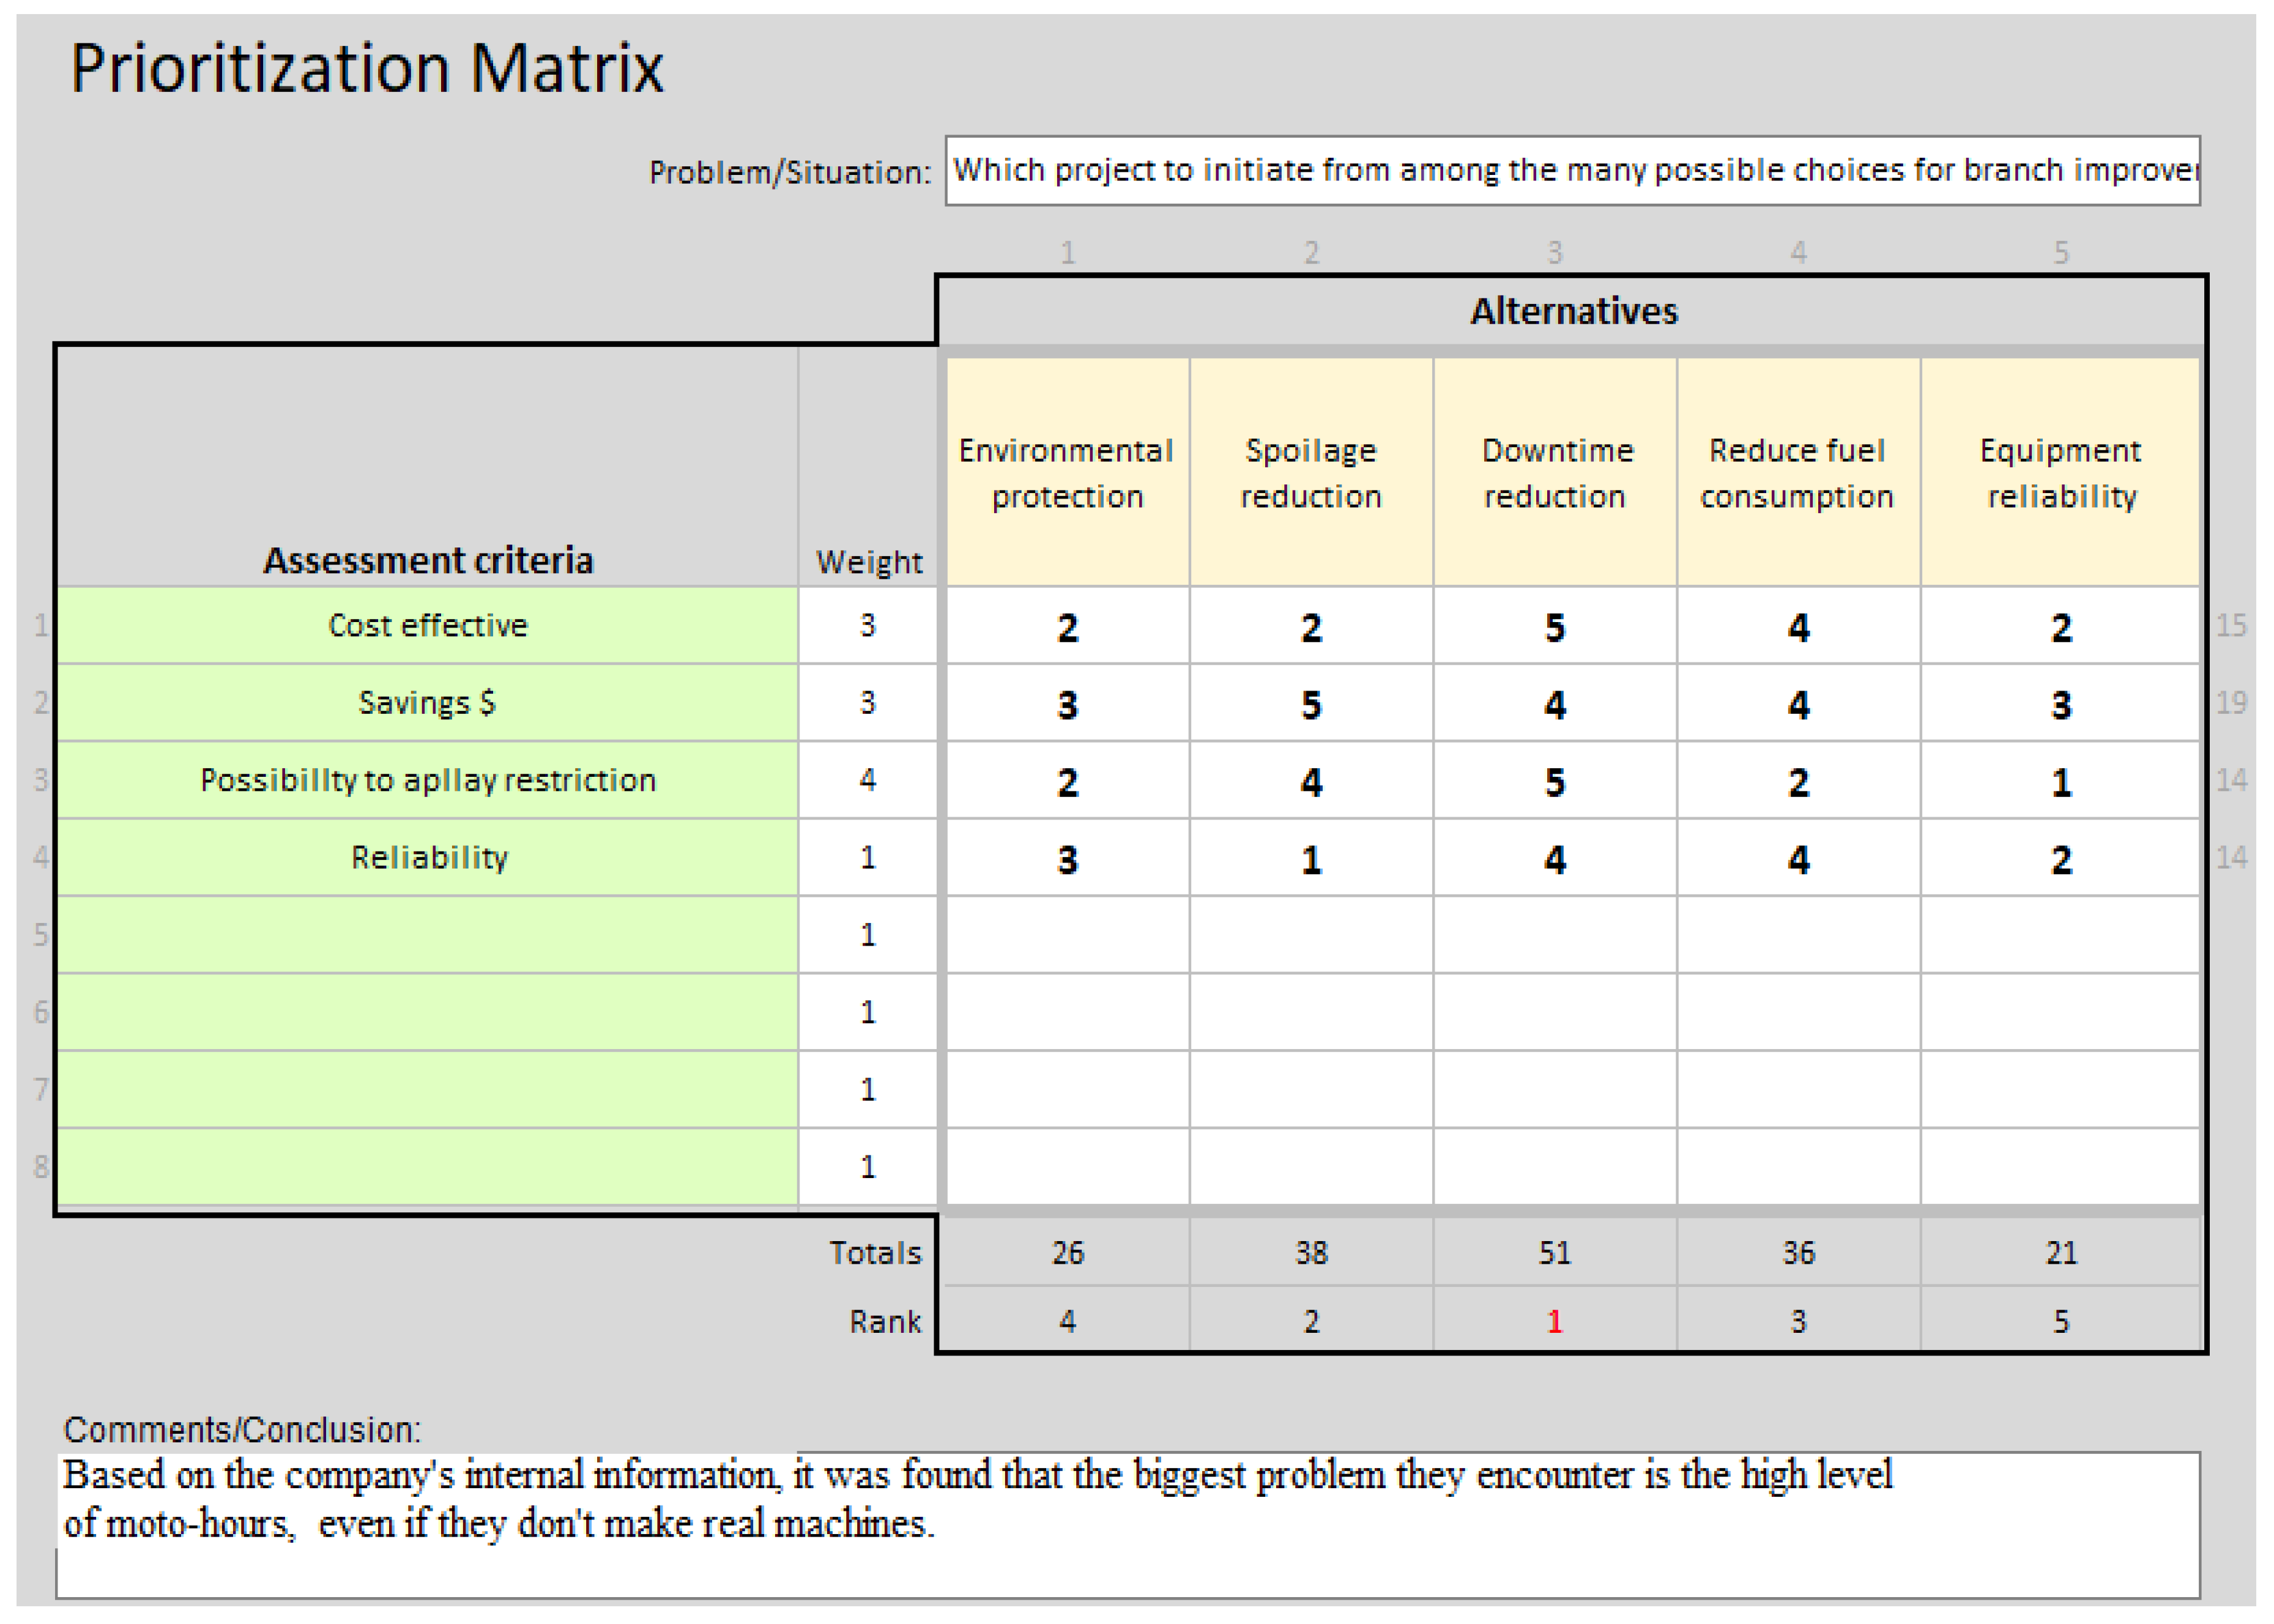
Figure 9.
Model of improved internal benchmarking for industries.
Disclaimer/Publisher’s Note: The statements, opinions and data contained in all publications are solely those of the individual author(s) and contributor(s) and not of MDPI and/or the editor(s). MDPI and/or the editor(s) disclaim responsibility for any injury to people or property resulting from any ideas, methods, instructions or products referred to in the content. |
© 2024 by the authors. Licensee MDPI, Basel, Switzerland. This article is an open access article distributed under the terms and conditions of the Creative Commons Attribution (CC BY) license (https://creativecommons.org/licenses/by/4.0/).
Share and Cite
MDPI and ACS Style
Bednárová, L.; Bakalár, T.; Pavolová, H.; Rybár, R.; Šimková, Z. A Model for Streamlining Benchmarking in Sustainable Development of Industries. Sustainability 2024, 16, 2587. https://doi.org/10.3390/su16062587
AMA Style
Bednárová L, Bakalár T, Pavolová H, Rybár R, Šimková Z. A Model for Streamlining Benchmarking in Sustainable Development of Industries. Sustainability. 2024; 16(6):2587. https://doi.org/10.3390/su16062587
Chicago/Turabian StyleBednárová, Lucia, Tomáš Bakalár, Henrieta Pavolová, Radim Rybár, and Zuzana Šimková. 2024. "A Model for Streamlining Benchmarking in Sustainable Development of Industries" Sustainability 16, no. 6: 2587. https://doi.org/10.3390/su16062587
Note that from the first issue of 2016, this journal uses article numbers instead of page numbers. See further details here.