1. Introduction
According to the International Energy Agency (2023) [
1], global carbon dioxide (CO
2) emissions grew by 0.9% in 2022. This was considerably lower than 2021’s rebound of more than 6% despite fluctuations in energy costs, surging inflation rates, and interruptions in conventional fuel supply routes. The total emissions from global transportation in 2022 accounted for a 2.1% increase due to expansion in advanced economies. Given the global rise in demand for transportation, there exists an urgency to reduce CO
2 emissions by embracing non-carbon alternatives.
The increased utilization of clean energy technologies like renewables, electric vehicles (EVs), and heat pumps played a crucial role in curtailing CO
2 emissions in 2022. For example, emissions would have been greater if not for the increasing adoption of EVs, which exceeded 10 million units (a tenfold increase compared to five years earlier), constituting more than 14% of the global market. If all the newly registered EVs were conventional diesel or petroleum vehicles, global emissions would have surged by an additional 13 gigatons (International Energy Agency, 2023) [
1]. This demonstrates that adopting EVs has the potential to reduce CO
2 emissions; however, the actual reduction depends on various factors including the source of electricity, the energy efficiency of vehicles, and broader efforts to decarbonize the energy grid.
According to Glasgow Research and Consulting (2023) [
2], in 2022, there were approximately 3 million passenger car vehicles in the United Arab Emirates (UAE), approximately 4000 or 1.3% of which were EVs (Statista, 2023) [
3]. Economic factors such as the cost of EVs and geographic factors such as the distribution of charging stations in the entire country act as barriers for adopting EVs. The UAE’s Minister of Energy and Infrastructure stated, ‘Some of the challenges we have seen are … the prices of the cars, as well as the infrastructure required for the EVs to be available and grow fast’ (Benny, 2023) [
4]. While the UAE has witnessed a declining trend in the cost of EVs and an expansion in charging infrastructure and related amenities, this has not yet attained a level of economic viability and competitive parity in comparison to conventional diesel or petroleum vehicles.
The aim of the study is to examine consumers’ opinions in the UAE toward adopting EVs for light-duty transport (cars, sport utility vehicles, and small trucks) from the economic and geographic perspectives. The primary research question is as follows: to what extent do economic and geographic factors affect consumers’ opinions toward adopting EVs in the UAE? The objectives of the study are to determine if a relationship exists between economic factors, such as saving money on petroleum, the cost of car maintenance, the cost of purchase, and income level, and geographic factors, including 14 cities across the seven Emirates that affect consumers’ opinions toward adopting EVs.
4. Results
4.1. Distribution of Cost-Related Preferences
We started by analyzing the three key columns of interest regarding consumer preferences related to the following: saving money on petroleum, saving money on car maintenance, and the initial cost of purchase. The data are sourced from an Excel sheet that includes respondents’ location (‘Where do you live?’) and monthly income (‘What is your monthly income?’). The key columns of interest were stored in the ‘y’ DataFrame. We then extracted the necessary columns into ‘x’ and ‘y’ DataFrames for analysis. For ‘y’, we performed two steps. (1) Value counts: we calculated the frequency of each response category (‘Very unappealing’, ‘Unappealing’, ‘Neutral’, ‘Somewhat appealing’, and ‘Very appealing’). The results were stored in ‘y counts’ for insights into respondents’ preferences. (2) Descriptive statistics: as ‘y’ contains categorical data, we provided basic statistics using ‘describe’, although some metrics may not have been as relevant. The results are displayed in
Table 2.
The analysis of the results indicated that the appeal of saving money on petroleum, saving money on car maintenance, and the initial cost of purchase were diverse and varied. Among the five response categories, ‘somewhat appealing’ emerged as the most frequent choice, suggesting that a considerable portion of the respondents found the prospect of saving money on these expenses somewhat attractive. The ‘unappealing’ category followed as the second most frequent choice, implying that a significant number of respondents expressed reservations about saving money on petroleum, saving money on car maintenance, and the initial cost of purchase. The ‘very unappealing’ and ‘neutral’ categories exhibited a moderate frequency, signifying that some respondents were not concerned about saving money on petroleum, saving money on car maintenance, and the initial cost of purchase. The ‘very appealing’ category garnered the least frequency among the response options. This suggested that a relatively smaller proportion of respondents found saving money on petroleum, saving money on car maintenance, and the initial cost of purchase to be highly attractive.
4.2. Distribution of Place of Residence
We performed statistical analysis on the ‘x’ DataFrame to obtain descriptive statistics for the ‘where do you live?’ column. Since ‘where do you live?’ is categorical, some of the statistics may have limited interpretive value. In addition, we created a bar chart for better visualization of the data. It depicts the distribution of respondents’ place of residence and plots the frequency of respondents in each emirate using ‘plt.bar’. The
x-axis represents the different Emirates, while the
y-axis shows the corresponding frequency of respondents residing in each Emirate. Abu Dhabi stood out as the most prominent with the highest frequency of respondents, followed by Dubai, Sharjah, Ajman, Al Fujairah, Ras Al Khaimah, and Umm Al Quwain. This is roughly in line with the population distribution of the UAE, where the most populous Emirates are Dubai, Abu Dhabi, and Sharjah and the least populous Emirates are Ras al-Khaimah, Fujairah, and Umm al Qaywayn (World Population Review, 2023) [
27].
4.3. Distribution of Monthly Income
Similar to the place of residence, we employed descriptive statistics to calculate the ‘what is your monthly income?’ column. This showed the distribution of respondents’ monthly income; however, as a categorical variable, some statistics may not carry significant meaning in this context. In addition, we created bar charts that display the distribution of respondents’ monthly income into different income categories, represented on the x-axis, and their respective frequencies on the y-axis. The data showed that respondents with a monthly income of AED 5000 and below (53% of respondents) are the most prevalent group, followed by respondents with a monthly income of AED 5001–AED 10,000 (16% of respondents). This demonstrated that 69% of the respondents had a monthly income of ≤AED 10,000. In contrast, respondents with high monthly incomes from AED 30,001 to above AED 50,000 constituted 9%.
4.4. Impact of Monthly Income on Cost-Saving Measures
We conducted a data visualization analysis to explore the impact of respondents’ monthly income on saving money on petroleum, saving money on car maintenance, and the initial cost of purchase. The data were loaded from an Excel file into a pandas. DataFrame. The ‘x’ DataFrame contains respondents’ monthly income and the count of respondents for each preference level: ‘very unappealing’, ‘unappealing’, ‘neutral’, ‘somewhat appealing’, and ‘very appealing’. The ‘y’ DataFrame contains the preferences for saving money on petroleum, car maintenance, and the initial cost of purchase. For the data visualization, we utilized the Seaborn library to create three countplots, each visualizing the relationship between respondents’ monthly income and their preferences for the three cost-saving aspects.
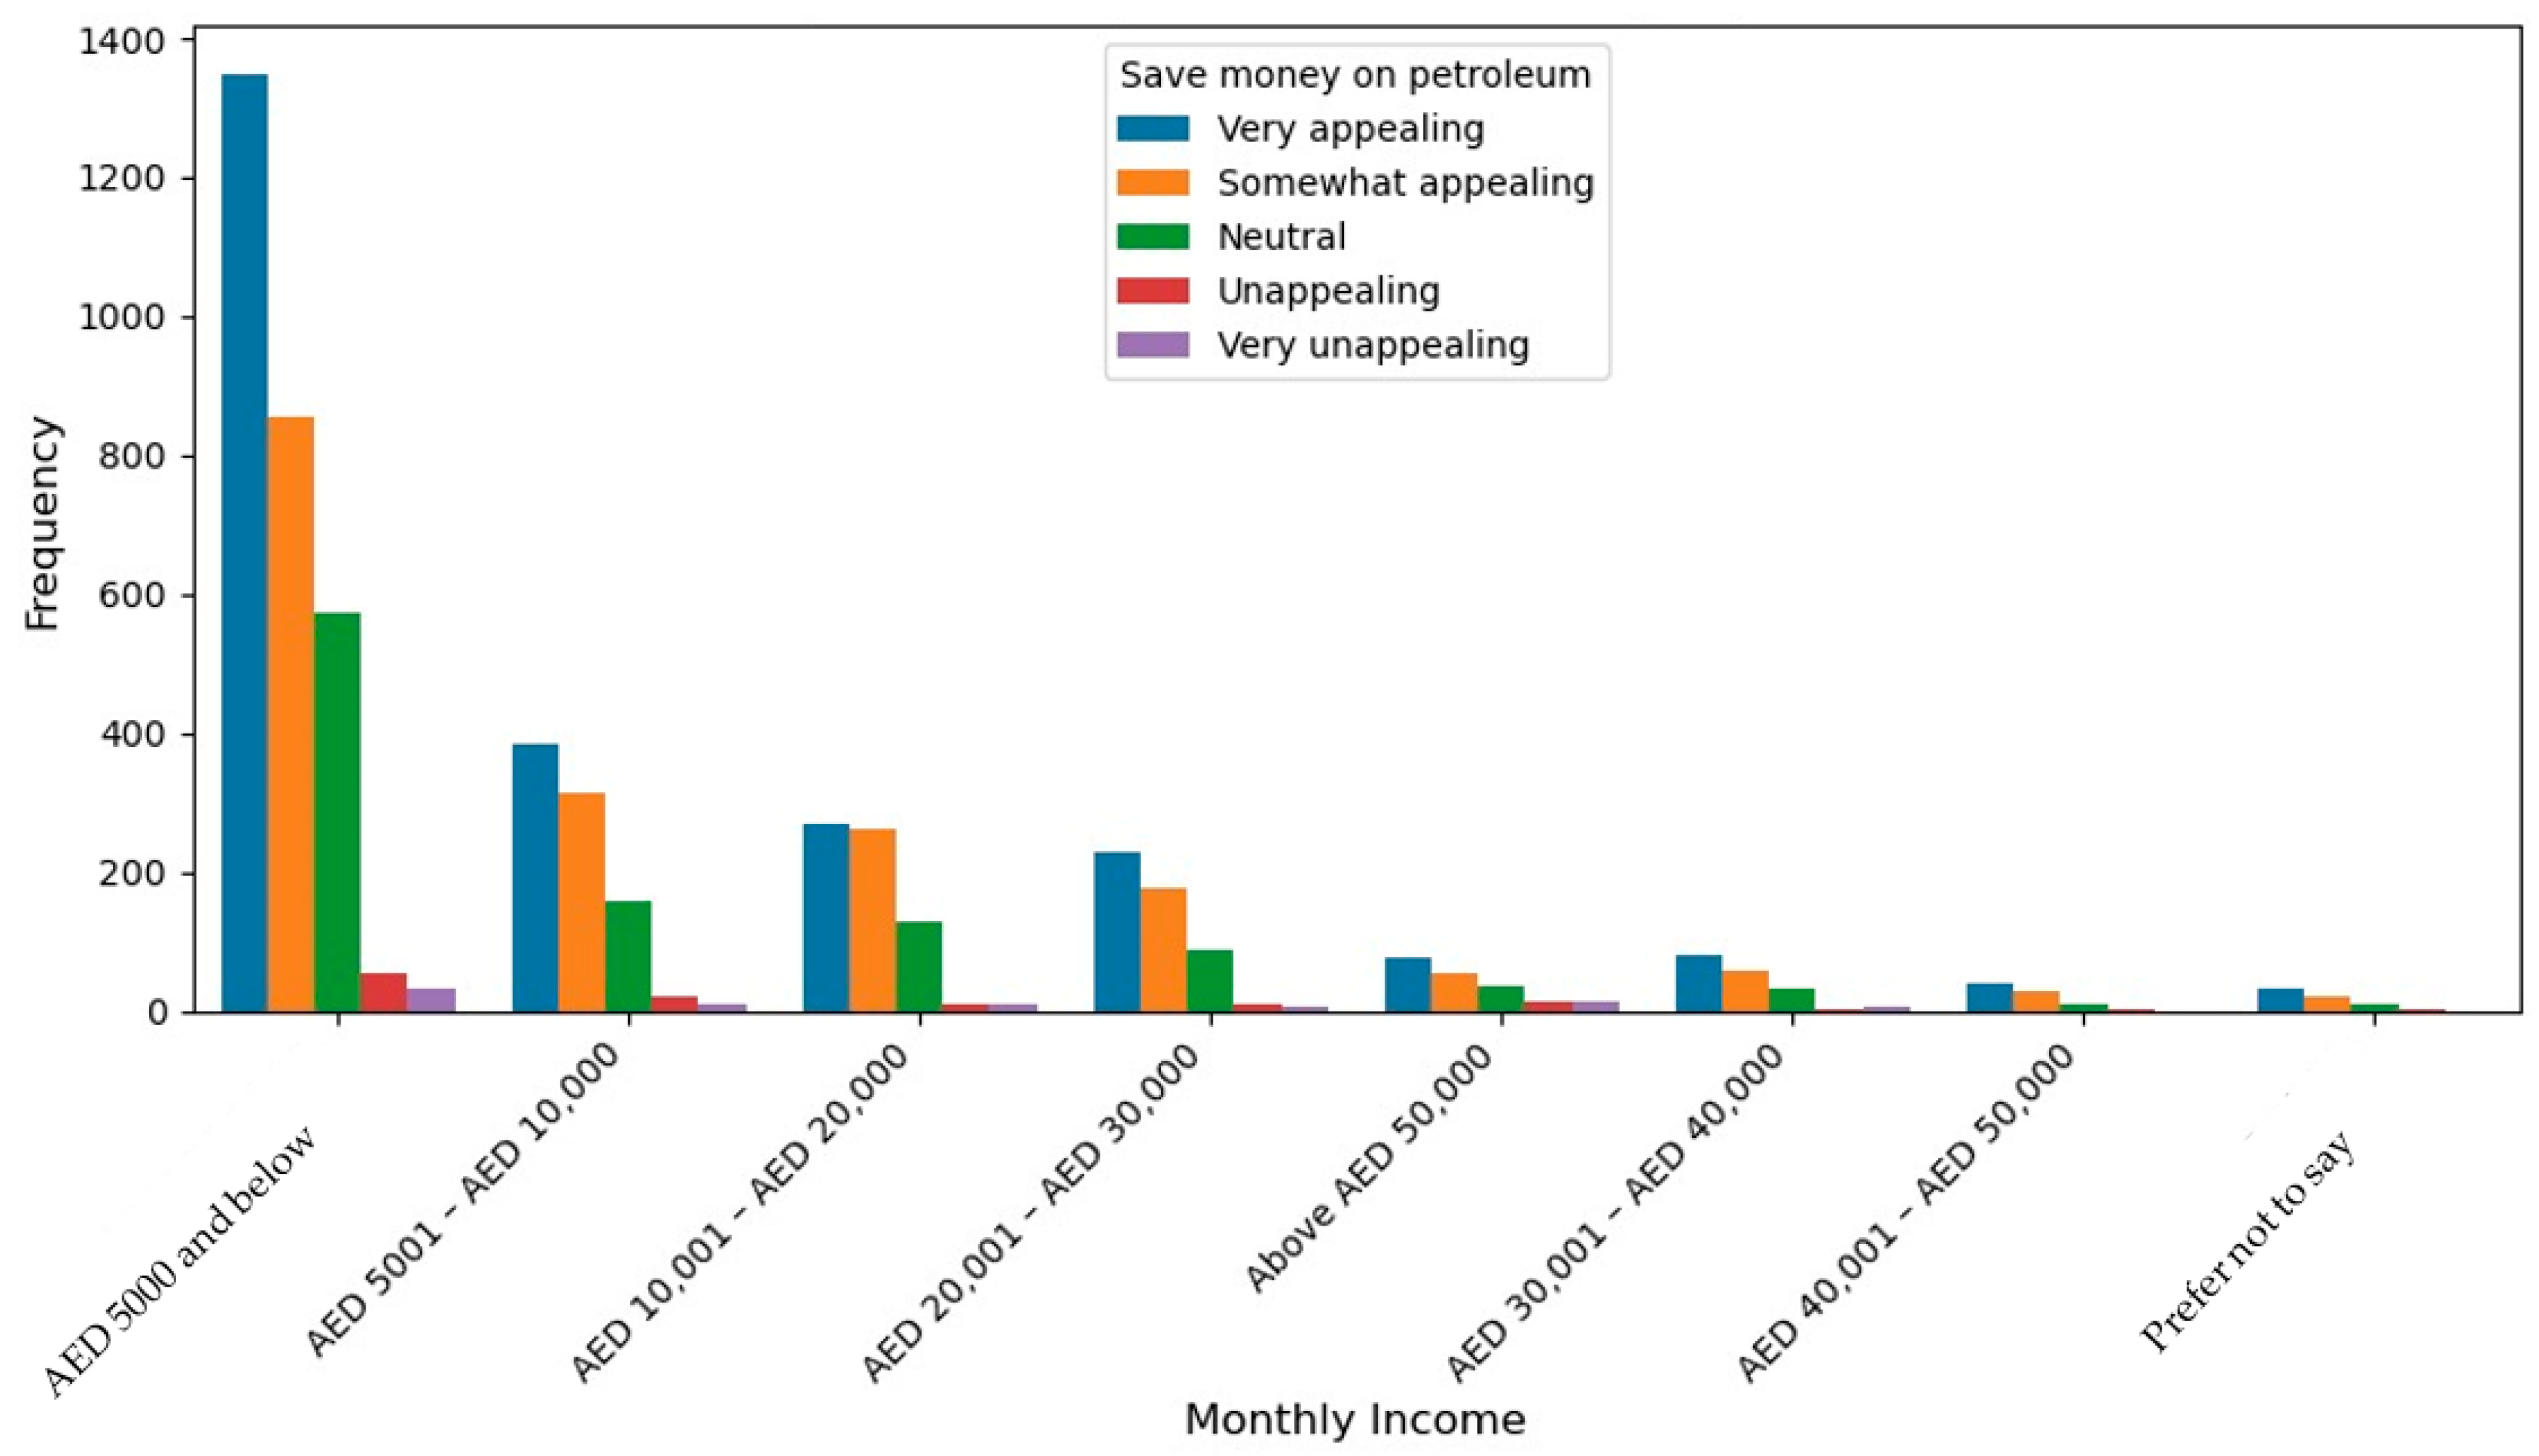
Figure 1 provides a countplot visualization of the relationship between respondents’ monthly income and saving money on petroleum. Although there are slight variations in the frequency of responses among different income levels, the most frequent response among respondents in all price ranges is ‘very appealing’, indicating that saving money on petroleum is well received across different income levels.
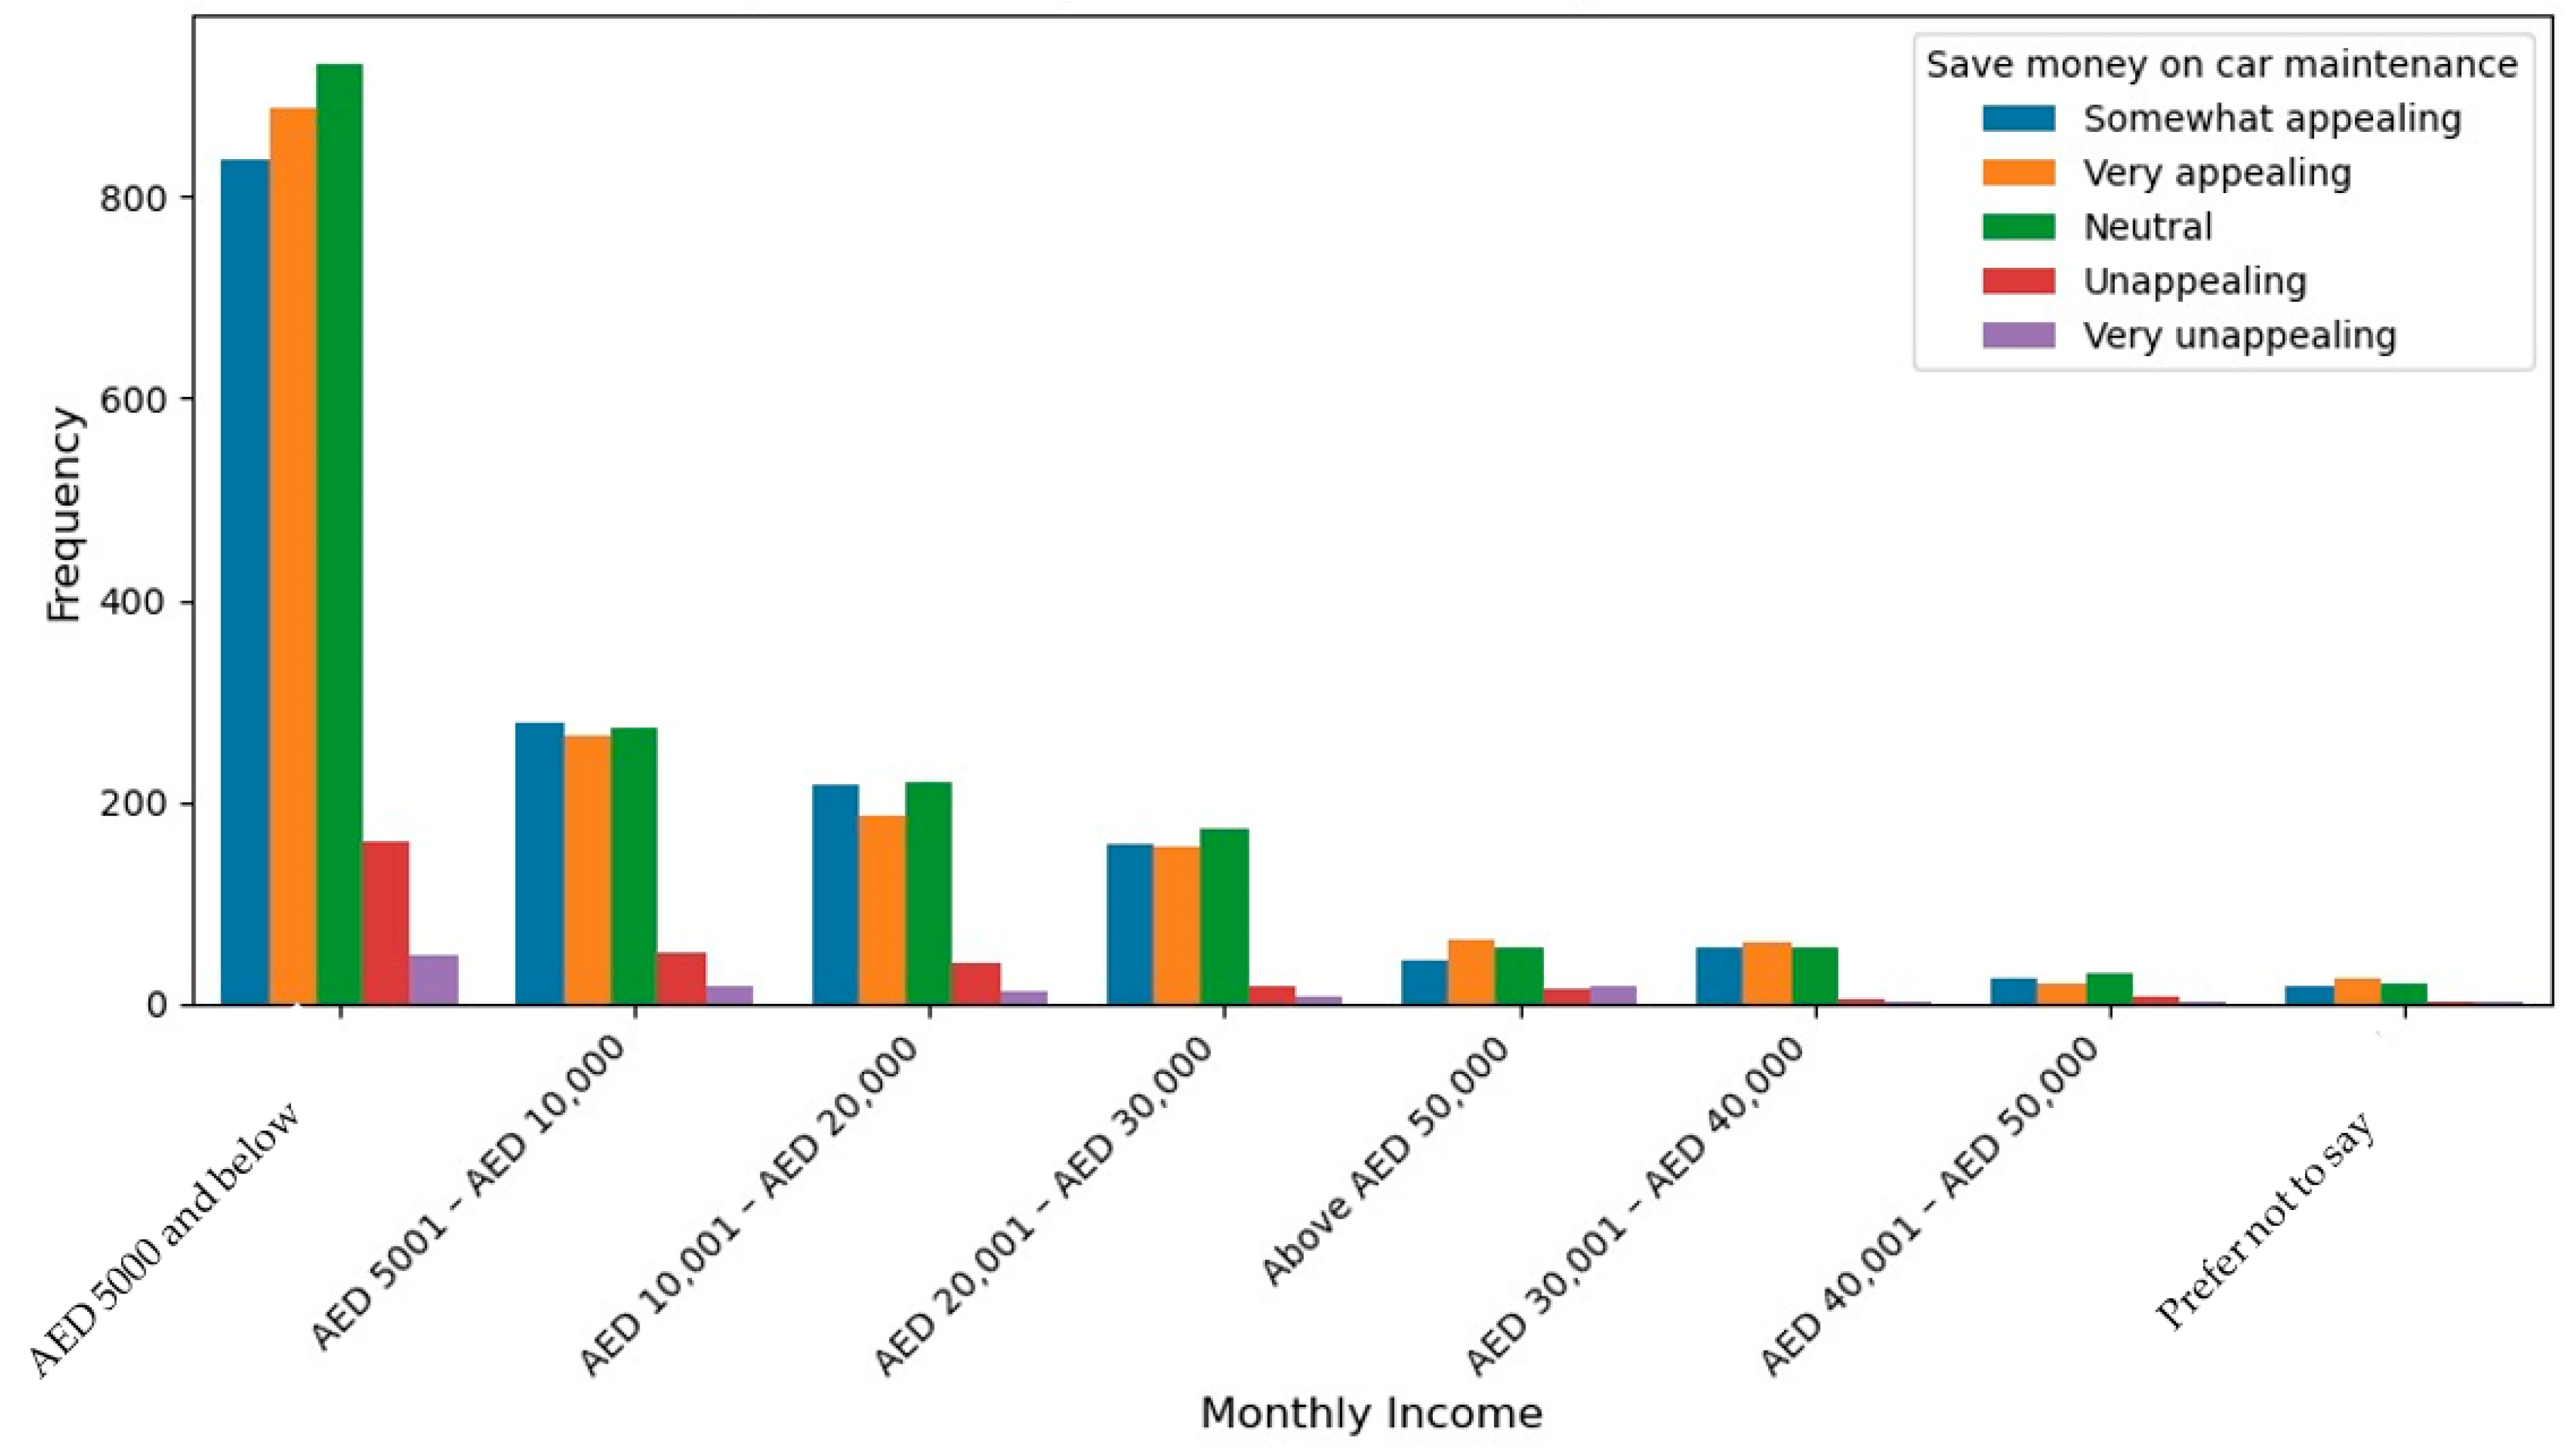
Figure 2 provides a countplot visualization of the relationship between respondents’ monthly income and saving money on car maintenance. The most frequent response among respondents in all income levels is ‘neutral’, except in the highest income level (above AED 50,000), where ‘very appealing’ is the most frequent response. This indicates that respondents are relatively indifferent about the idea of saving money on car maintenance in the lower income levels, but as the income level increases, more respondents find the idea appealing.
Figure 3 provides a countplot visualization of the relationship between respondents’ monthly income and saving money on the initial cost of purchase. The most frequent response among respondents in all income levels is ‘very appealing’, suggesting that respondents generally agree that the initial cost of purchase is a significant factor. Furthermore, similar to the case of ‘save money on car maintenance’ variable, there is an increase in the frequency of ‘very appealing’ responses as the income level increases.
We conducted ANOVA tests to check for significant differences in the appeal of each of the cost-saving measures across income categories. The ANOVA results provided the F-statistic and p-value. If the p-value is ˂0.05, it indicates that there are significant differences in opinions among income categories. The ANOVA tests help us identify whether or not income level plays a significant role in shaping the appeal of each of the cost-saving measures across income categories.
Table 3 shows that respondents found saving money on petroleum appealing, with an average rating of 3.2 on a scale of 1 to 4. The ‘prefer not to say’ category had the highest rating of 3.328, indicating a relatively higher appeal for saving money on petroleum compared to the other categories, and the ‘above AED 50,000’ had the lowest rating of 2.853, indicating a relatively lower appeal for saving money on petroleum compared to the other categories. Moreover, the income category ‘prefer not to say’ showed the least variability in the responses, with a standard deviation of 0.778, indicating a higher level of agreement among respondents regarding the appeal of saving money on petroleum compared to other categories. Conversely, the income category ‘above AED 50,000’ showed the most variability in the responses, with a standard deviation of 1.204, indicating a wider range of opinions among respondents regarding the appeal of saving money on petroleum compared to other categories. Lastly, the ANOVA (
p-value 6.972 × 10
−5 ˂ 0.05) suggested that income level does have a significant influence on how appealing people find the idea of saving money on petroleum.
Table 4 demonstrates that respondents found saving money on car maintenance moderately appealing, with a mean rating of 2.8 out of 4. The ‘AED 30,001–AED 40,000′ category had the highest rating of 2.96, indicating a relatively higher appeal for saving money on car maintenance compared to the other categories, and the ‘above AED 50,000′ had the lowest rating of 2.605, indicating a relatively lower appeal for saving money on car maintenance compared to the other categories. Furthermore, the income category ‘AED 30,001–AED 40,000’ showed the least variability in the responses, with a standard deviation of 0.907, indicating a higher level of agreement among respondents regarding the appeal of saving money on car maintenance compared to other categories. Conversely, the income category ‘above AED 50,000’ showed the most variability in the responses, with a standard deviation of 1.259, indicating a wider range of opinions among respondents regarding the appeal of saving money on petroleum compared to other categories. Finally, the ANOVA (
p-value 0.022 < 0.05) suggested that income level does have a significant influence on how appealing people find saving money on car maintenance.
Table 5 indicates respondents found saving money on the initial cost of purchase appealing, with a mean rating of 3 out of 4. The ‘prefer not to say’ category had the highest rating of 3.219, indicating a relatively higher appeal for saving money on the initial cost of purchase compared to the other categories, and the ‘above AED 50,000’ had the lowest rating of 2.789, indicating a relatively lower appeal for saving money on the initial cost of purchase compared to the other categories. In addition, the income category ‘prefer not to say’ showed the least variability in the responses, with a standard deviation of 0.9, indicating a higher level of agreement among respondents regarding the appeal of saving money on the initial cost of purchase compared to other categories. Conversely, the income category ‘above AED 50,000′ showed the most variability in the responses, with a standard deviation of 1.255, indicating a wider range of opinions among respondents regarding the appeal of saving money on the initial cost of purchase compared to other categories. Lastly, the ANOVA (
p-value 0.006 < 0.05) suggested that income level does has a significant influence on how appealing people find saving money on the initial cost of purchase.
Overall, respondents across different income levels had a positive outlook on the concept of saving money on petroleum, while their interest in saving money on car maintenance became more pronounced in the higher income levels. Additionally, respondents consistently acknowledged the importance of the initial cost of purchase, which became stronger as the income level increased.
4.5. Impact of Geographical Location on Cost-Saving Measures
We conducted a data visualization analysis to explore the impact of respondents’ geographical location on saving money on petroleum, car maintenance, and the initial cost of purchase. The data were loaded from an Excel file into a pandas. DataFrame. The ‘x’ DataFrame contains respondents’ geographical location and the count of respondents for each preference level: ‘very unappealing’, ‘unappealing’, ‘neutral’, ‘somewhat appealing’, and ‘very appealing’. The ‘y’ DataFrame contains the preferences for saving money on petroleum, car maintenance, and the initial cost of purchase. For the data visualization, we utilized the Seaborn library to create three countplots, each visualizing the relationship between respondents’ geographical location and their preferences for the three cost-saving aspects.
Figure 4 provides a countplot visualization of the relationship between respondents’ geographical location and saving money on petroleum. Abu Dhabi had the highest count for saving money on petroleum with 2515 respondents, and the most frequent response was ‘very appealing ’with 1168 responses. Umm al-Quwain had the lowest count with 70 respondents for saving money on petroleum, and the most frequent response was ‘very appealing’ with 28 responses. Overall, the responses are relatively consistent across locations, with ‘very appealing’ being the most common response in all locations for ‘save money on petroleum’.
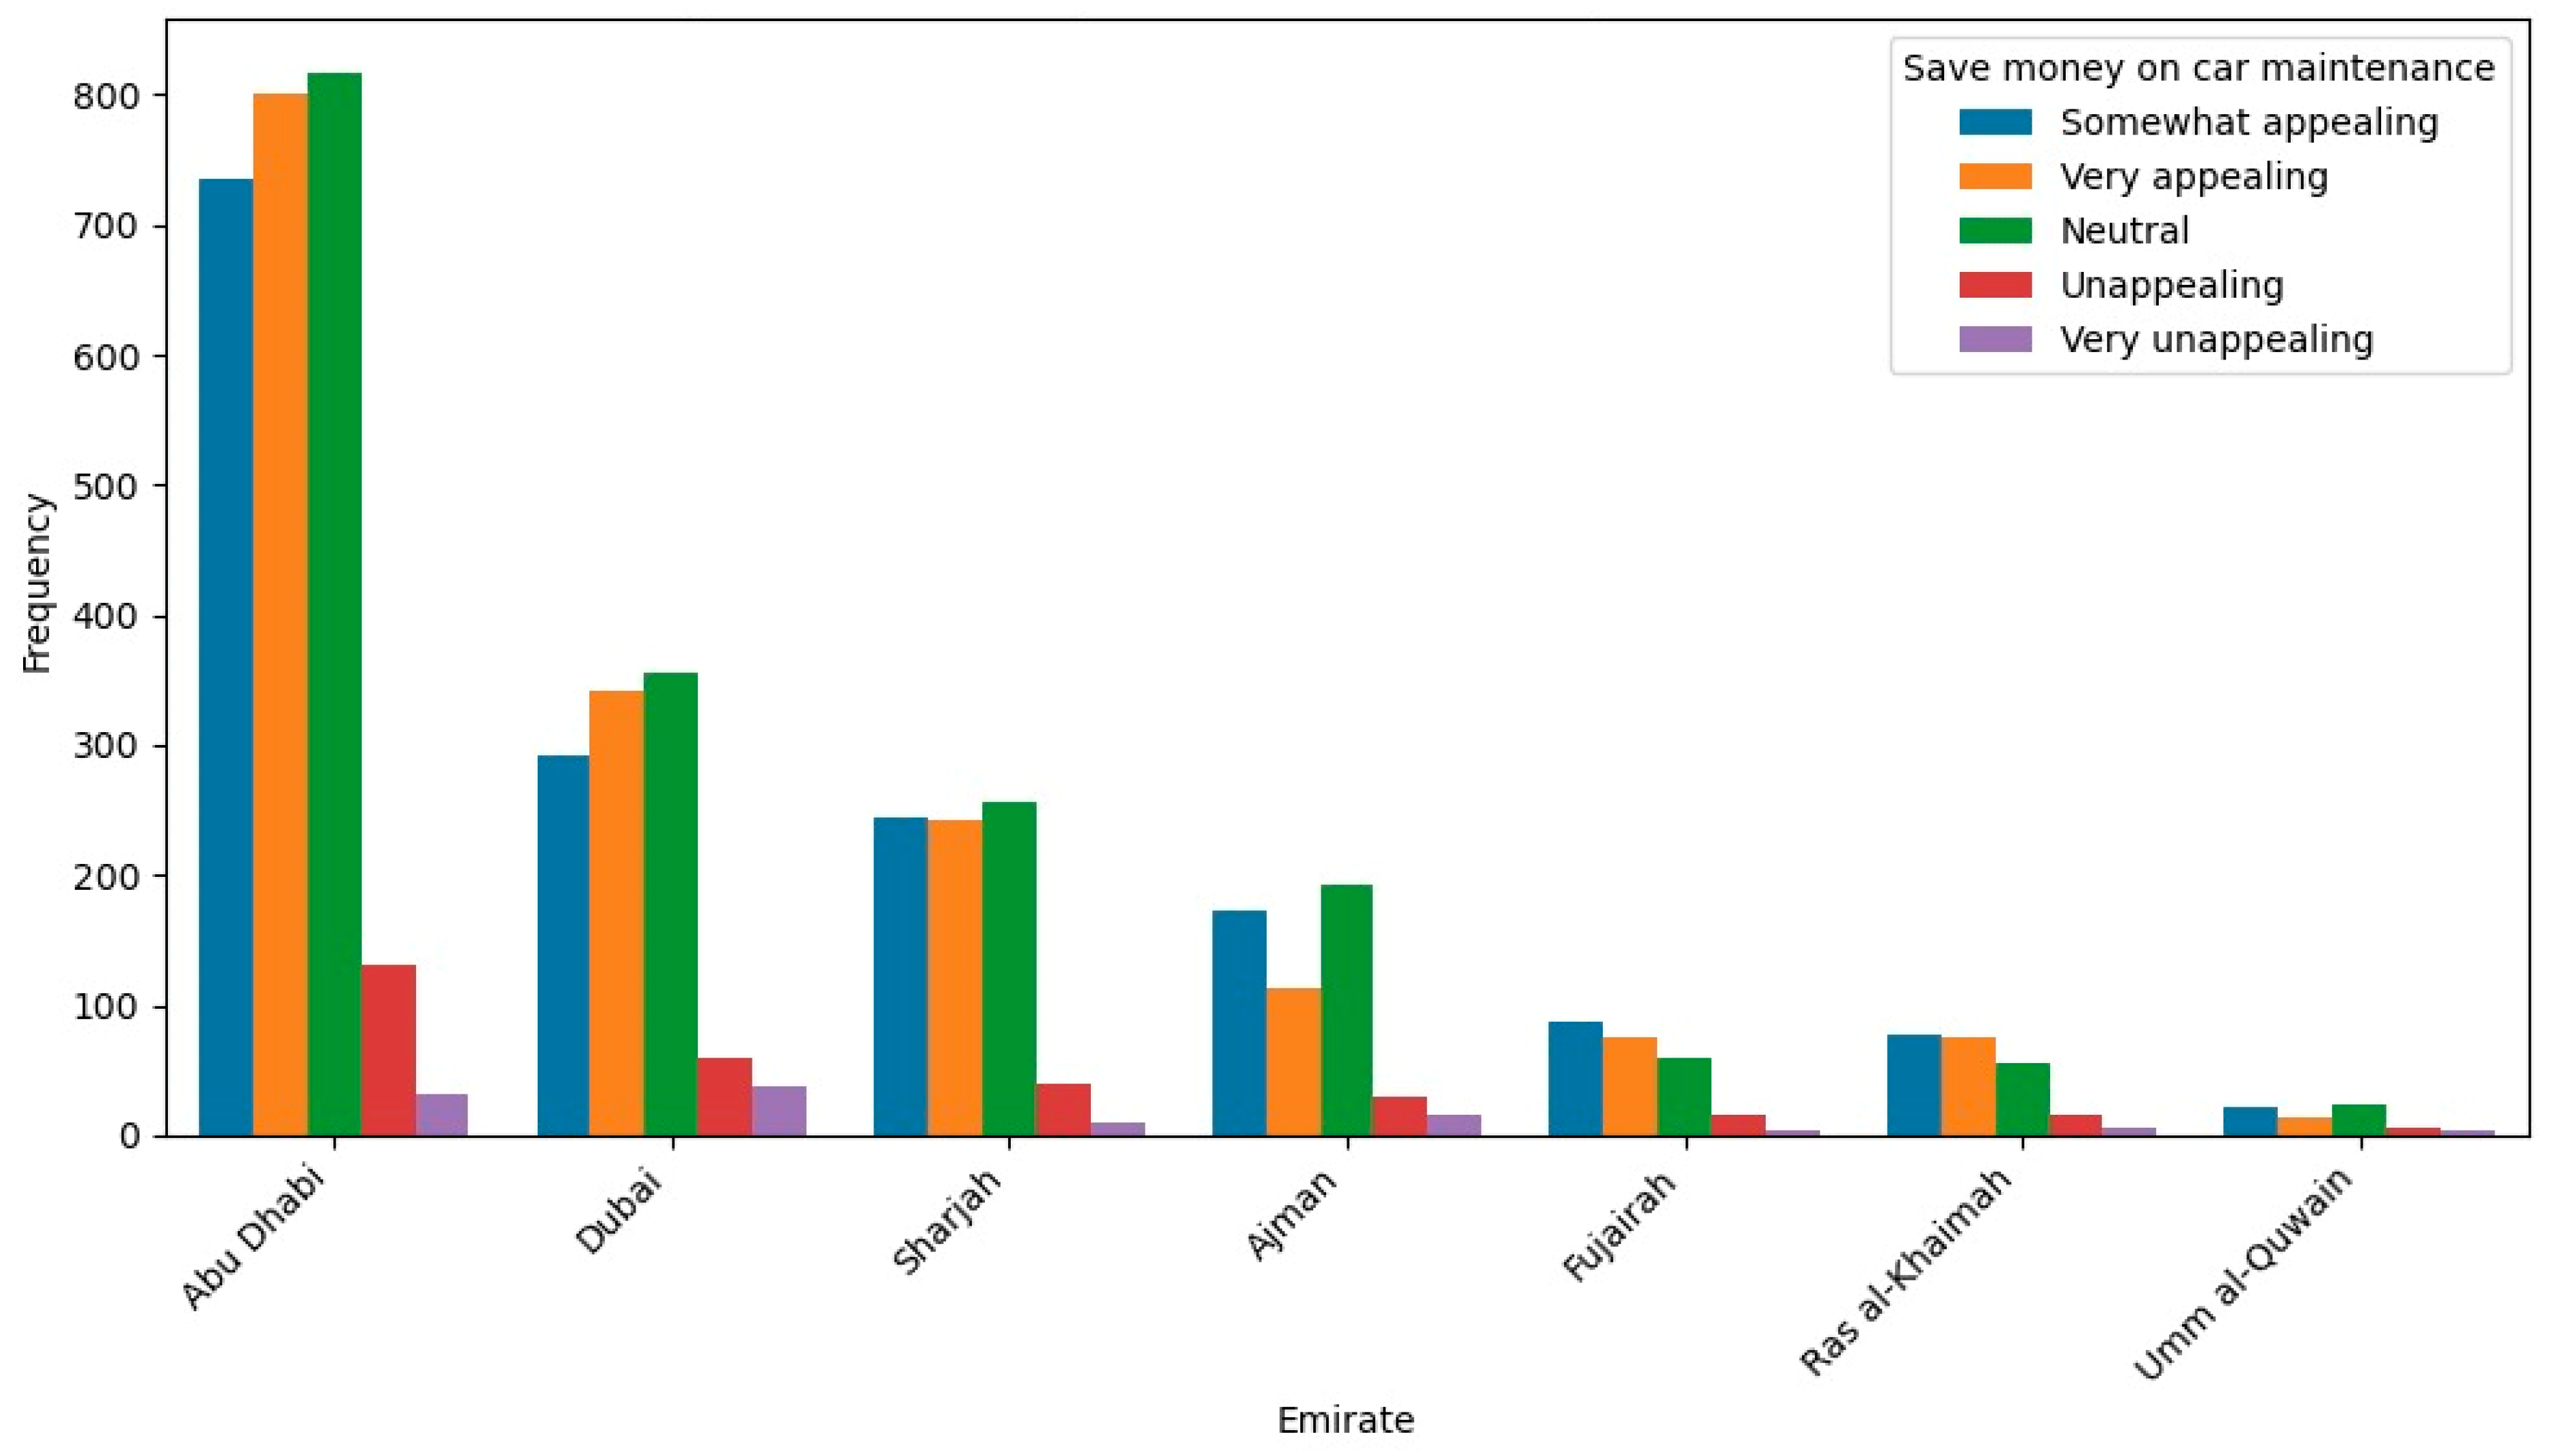
Figure 5 provides a countplot visualization of the relationship between respondents’ geographical location and saving money on car maintenance. Abu Dhabi had the highest count for saving money on car maintenance with 2515 respondents, and the most frequent response ‘neutral’ with 817 responses. Umm al-Quwain had the lowest count for saving money on car maintenance with 70 respondents, and the most frequent response was ‘neutral’ with 24 respondents. Accordingly, ‘neutral’ was the most common response for saving money on car maintenance in most locations.
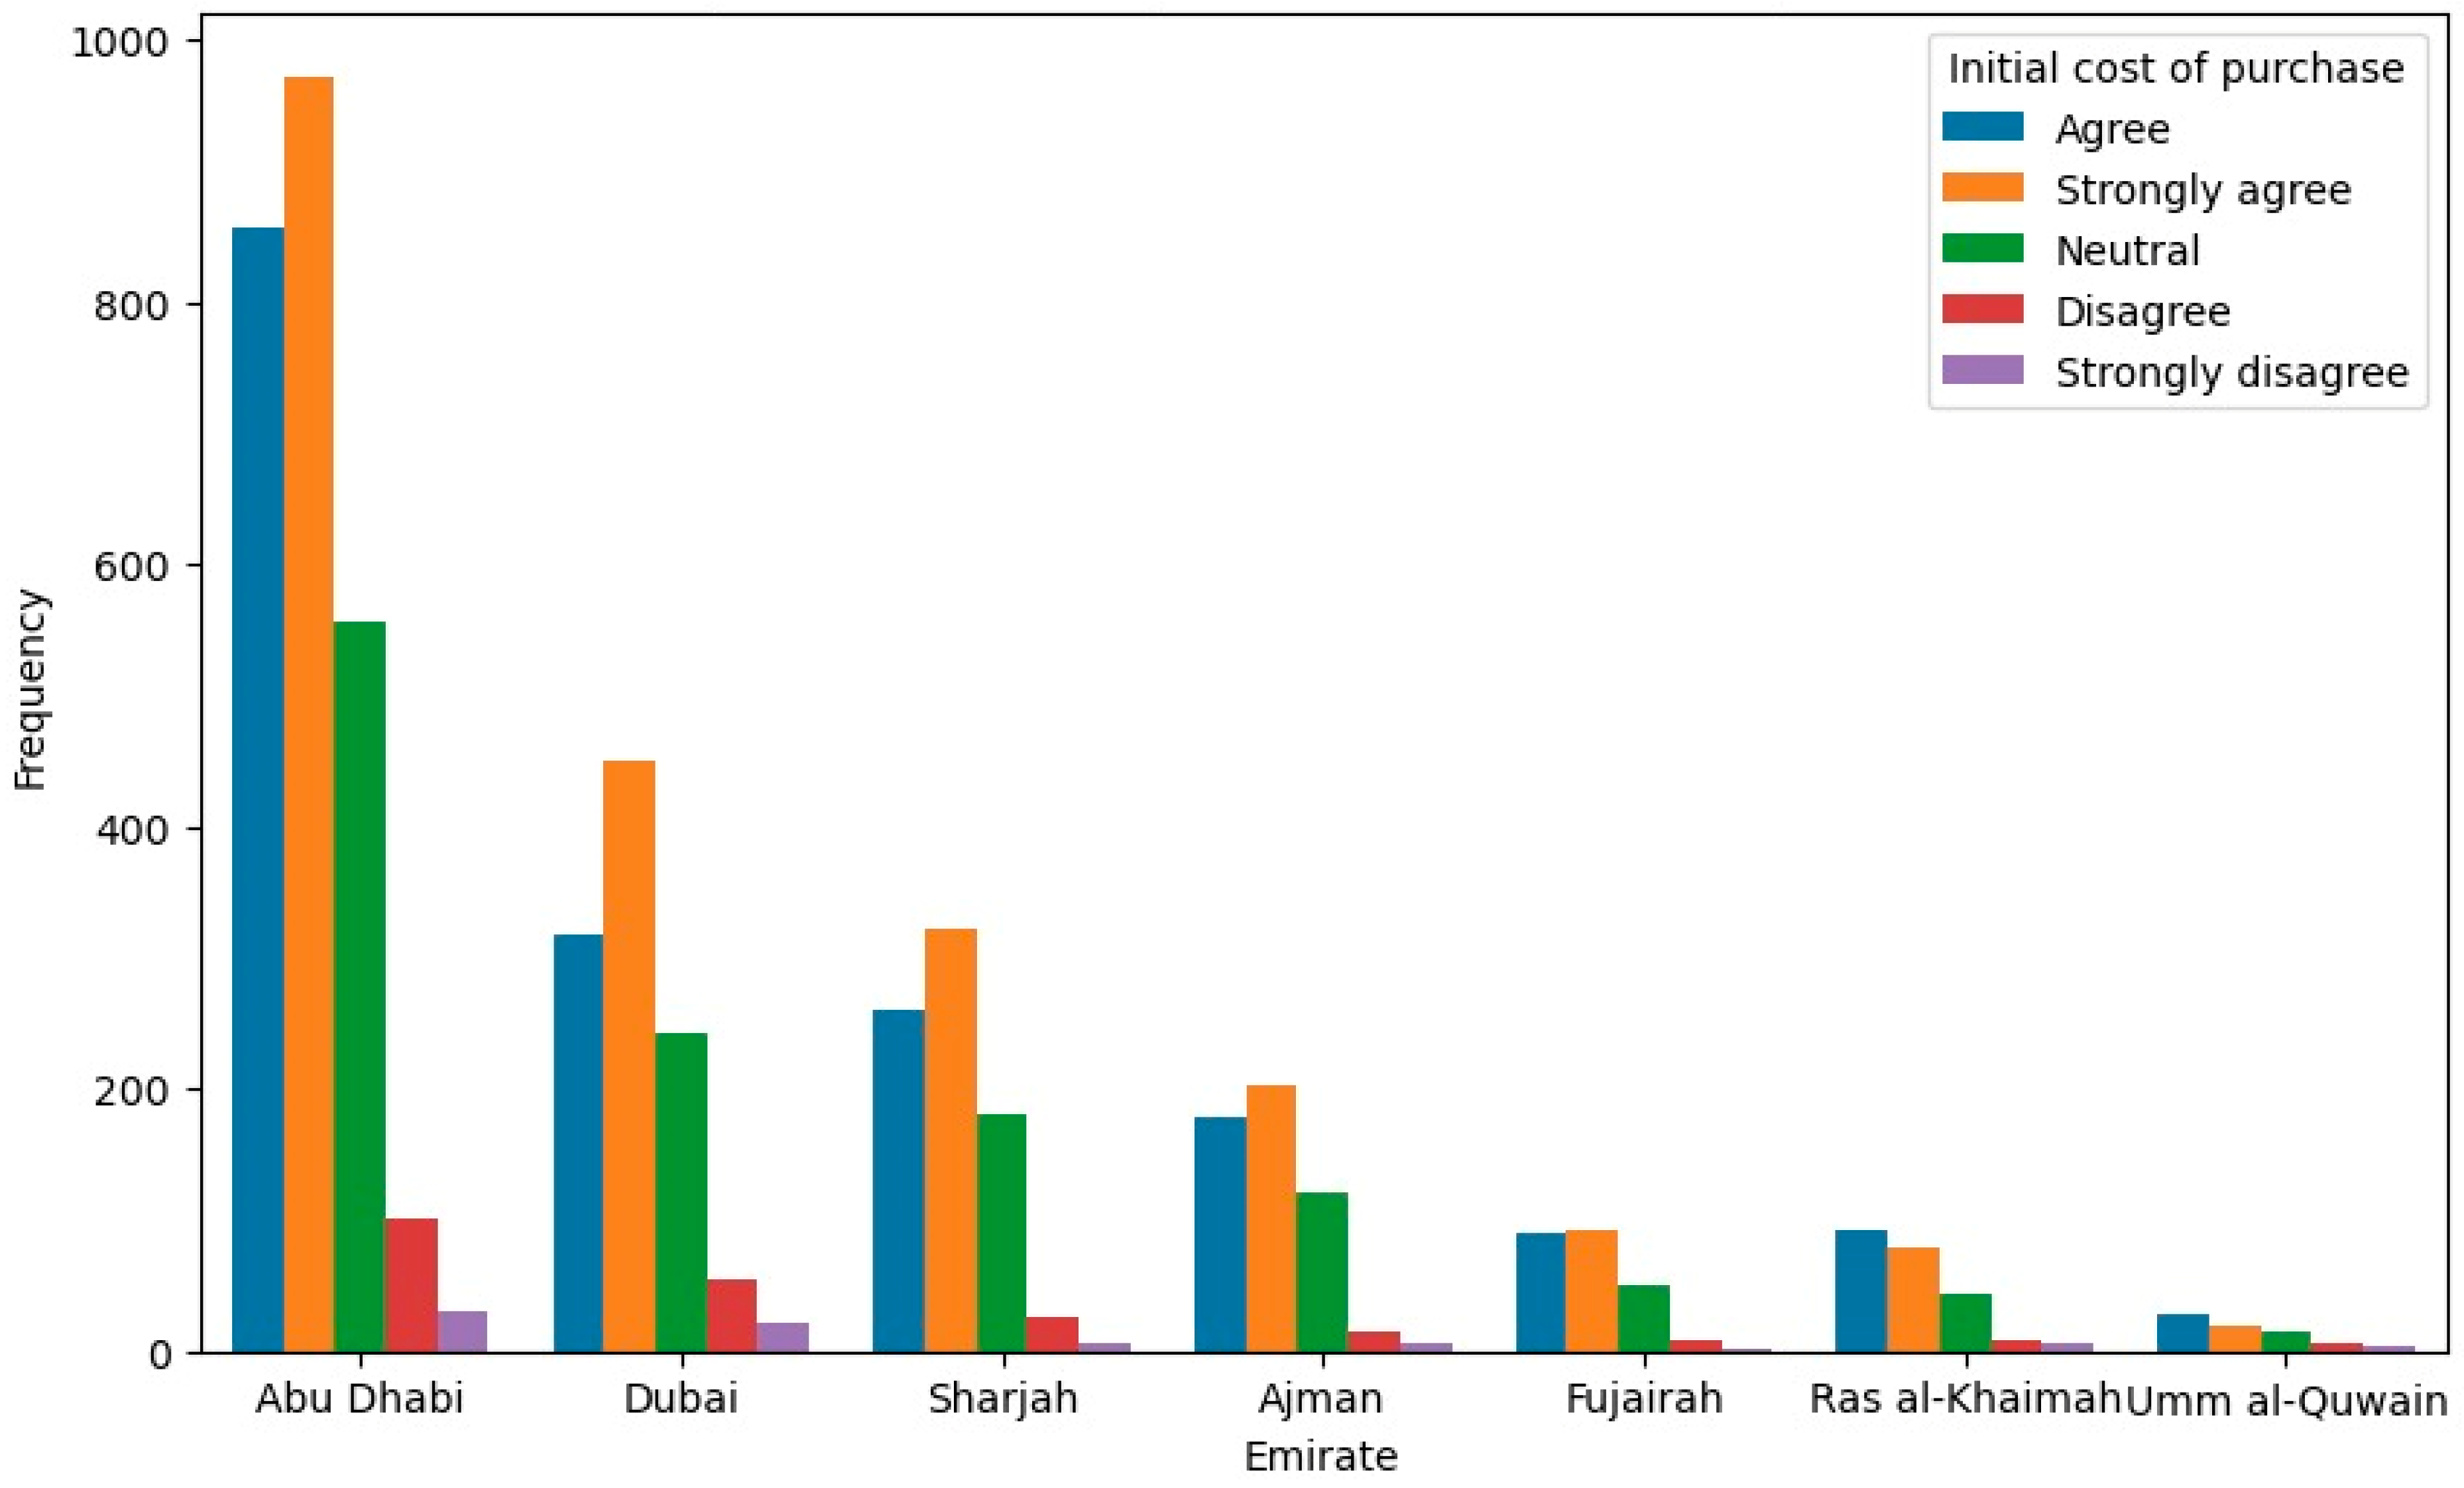
Figure 6 provides a countplot visualization of the relationship between respondents’ geographical location and the initial cost of purchase. Abu Dhabi had the highest count for the initial cost of purchase with 2515 respondents, and the most frequent response was ‘strongly agree’ with 972 responses. Umm al-Quwain had the lowest count for saving money on car maintenance with 70 respondents, and the most frequent response was ‘agree’ with 28 responses. In general, ‘strongly agree’ was the most common response for the initial cost of purchase in most locations.
In summary, the responses for each variable were somewhat similar across different locations, with slight variations in the frequency of specific responses. ‘Very appealing’ and ‘strongly agree’ were the most common responses in multiple locations for saving money on petroleum and the initial cost of purchase, respectively. ‘Neutral’ was the most common response for saving money on car maintenance in most locations.
5. Discussion and Conclusions
The results indicated that individuals from various income brackets shared a favorable perspective on the appeal of EVs for reducing expenses related to petroleum; however, the appeal of cost savings on vehicle maintenance and the initial purchase price were more pronounced as income levels rose. In addition, we discovered that 69% of respondents had monthly incomes of ≤AED 10,000, and 9% of respondents had monthly incomes from AED 30,001 to above AED 50,000. This corresponds primarily with the low- to medium-skilled expatriate workforce in the UAE, which makes up the vast majority of the population with low-income levels, and the high-skilled expatriate workforce and Emirati workforce, which makes up a much smaller proportion of the population with high-income levels (see United Arab Emirates Portal, 2023) [
29]. Finally, we analyzed the distribution of survey participants across the seven Emirates, which closely mirrored the population distribution in the UAE. The Emirates with a high population count and more urban areas such as Dubai and Abu Dhabi found the cost-saving measures associated with EVs more appealing than the Emirates with low population counts and more rural areas such as Ras al-Khaimah and Umm al-Qaywayn (see World Population Review, 2023) [
27].
We disaggregated the data on the cost-saving measures associated with adopting EVs to examine the impact of saving money on petroleum, saving money on car maintenance, and saving money on the initial cost of purchase in relation to income level and geographic location. Regarding the impact of monthly income on saving money on petroleum, the ‘very appealing’ response emerged as the most prevalent choice among participants from various income brackets. This is confirmed by an overall appeal toward saving money on petroleum, quantified by a mean rating of 3.2 out of 4. Furthermore, the ANOVA (p-value 6.972 × 10⁻⁵ > 0.05) suggested that income level does have a significant influence on the appeal of saving money on petroleum.
The income category ‘above AED 50,000’ showed the most variability in the responses, with a standard deviation of 1.204, indicating a variety of opinions among respondents regarding the appeal of saving money on petroleum compared to other categories. Respondents in this income bracket likely exhibit a wider range of financial circumstances, which can influence the appeal of saving money on petroleum. Some individuals with higher incomes may prioritize other aspects of vehicle ownership, such as luxury or performance, over cost savings on fuel. Furthermore, people with higher incomes have different driving patterns and energy consumption habits. This variance in daily commutes, travel distances, and energy requirements can impact the appeal of saving money on petroleum (Sovacool et al., 2019) [
23].
The impact of geographical location on the appeal of EVs for saving money on petroleum was relatively consistent across all seven Emirates, with ‘very appealing’ being the most common response in all locations. This indicated that saving money on petroleum resonates broadly and uniformly throughout the UAE, transcending regional distinctions. While petroleum prices in the UAE are affected by a global increase in the crude oil price, which has soared almost 50% to more than USD 100.00 a barrel since the beginning of 2022 (Arabian Business, 2022) [
30] and will likely continue to increase “in the near-term future as conventional oil and gas are depleted and difficult-to-extract unconventional oil and gas become a larger part of the fossil-fuel supply” (Kreps, 2020, p. 695) [
31], the UAE government provides petroleum subsidies for low-income citizens (not expatriates) amid rising fuel costs (United Arab Emirates Ministry of Community Development, 2023) [
32]. Moreover, petroleum prices in the UAE remained lower compared to 110 countries in 2022, including countries in developed economies (Abbas, 2022) [
33], benefiting both citizens and expatriates. This has traditionally resulted in less concern about petroleum costs in the UAE (Sgouridis et al., 2018) [
26]; however, attitudes are changing as the rise in petroleum costs more recently has affected all individuals in the country.
Regarding the impact of monthly income on saving money on car maintenance, the predominant response among participants across income brackets is ‘neutral’, except for the highest income category (above AED 50,000), where ‘very appealing’ emerged as the prevailing choice. This is confirmed by a moderate overall appeal toward saving money on car maintenance, quantified by a mean rating of 2.8 out of 4. Moreover, the ANOVA (p-value 0.022 < 0.05) suggested that income level does have a significant influence on how appealing people find saving money on car maintenance. The diverse responses signified that the respondents in the lower-income strata tended to exhibit a degree of indifference toward economizing on car maintenance. This sentiment can be partially attributed to the cost of entry into the EV market, which often exceeds the financial means of a significant majority of respondents in the UAE. Thus, the ‘neutral’ stance may stem from the practical realization that contemplating the appeal of low maintenance costs for an EV becomes irrelevant if one cannot afford to acquire such a vehicle. Conversely, as income levels increased, a greater proportion of respondents expressed a favorable disposition toward saving money on car maintenance. This demonstrated that even for individuals with higher incomes, financial prudence remained a priority. Potentially owning an EV with lower maintenance costs allows them to allocate their resources more efficiently, freeing up money for other investments or discretionary spending.
Furthermore, the income category ‘above AED 50,000’ showed the most variability in the responses, with a standard deviation of 1.259, indicating a wider range of opinions among respondents regarding the appeal of saving money on petroleum compared to other categories. The divergence of views among higher-income individuals underscores that financial means do not always translate into a uniform perspective on the appeal of cost savings on car maintenance. While higher-income individuals generally have more financial flexibility, their priorities can differ significantly. Some may prioritize luxury and convenience, willingly accepting higher maintenance costs for premium vehicles with advanced features. Others may place a higher emphasis on frugality and may value the long-term savings offered by vehicles with lower maintenance costs. The diversity in financial priorities reflects that income alone does not dictate one’s perspective on car maintenance savings.
The impact of geographical location on the appeal of EVs for saving money on car maintenance was ‘neutral’ in most locations, implying a degree of regional indifference. Given that the EV market in the UAE is still in its early stages of growth and development, respondents do not have much knowledge about the appeal of EVs for reducing car maintenance costs. The UAE government and private sector are gradually investing in the development of charging infrastructure across the country, including in major cities like Dubai, Abu Dhabi, and Sharjah, but to a lesser degree in places like Ras Al Khaimah, Fujairah, and Umm al Quwain (see Dubai EV Community Hub, 2023) [
34]; however, compared to petroleum and diesel vehicles, the number of EV charging stations is relatively limited. Moreover, issues related to the hot climate in the UAE, such as the overheating and deterioration of EV batteries, have raised concerns about the potential long-term cost of maintenance (Hao et al., 2020) [
22].
Regarding the impact of monthly income on saving money on the initial cost of purchase, the predominant response among participants across income brackets is ‘very appealing’, suggesting that respondents generally agree that the initial cost of purchase is a significant factor. This is confirmed by an overall appeal toward saving money on the cost of purchase, quantified by a mean rating of 3 out of 4. In addition, the ANOVA (p-value 0.006 < 0.05) suggested that income level does have a significant influence on how appealing people find saving money on the initial cost of purchase. This resonates with the majority of the population in the UAE. Saving money on the initial purchase may be an appealing prospect due to the high number of individuals (69% of the population) in the low- to medium-income levels (≤AED 10,000) as it reduces the immediate financial strain and may be viewed as a way to make a desired purchase more accessible. High-income individuals may prefer to save on the initial cost because it frees up capital for other investments or expenses. Ensuring that EVs are affordable to a broad spectrum of consumers is crucial for wider adoption.
The income category ‘above AED 50,000’ showed the most variability in the responses, with a standard deviation of 1.255, indicating a wider range of opinions among respondents regarding the appeal of saving money on the initial cost of purchase compared to other categories. Even within the ‘above AED 50,000’ income category, individuals may have varying financial situations. Some may have considerable disposable income and can comfortably afford an EV, while others in the same category might have more complex financial priorities, such as investments, savings goals, or debts. Individuals with higher incomes often engage in more complex financial planning, which can involve diversified investment portfolios, retirement planning, and other long-term financial goals. Such individuals may weigh the appeal of saving on an EV against other financial priorities they have. Furthermore, people in higher income brackets may have different perceptions of value. While some may view an EV as a worthwhile investment, others might be more focused on luxury or performance-oriented vehicles, where the initial cost might not be a significant concern (Bridi et al., 2022b) [
25].
Regarding the impact of EVs for saving money on the initial cost of purchase, ‘strongly agree’ was the most common response in Dubai, Abu Dhabi, Sharjah, Ajman, and Fujairah; however, in the case of Ras Al Khaimah and Umm al Quwain, ‘agree’ was the most common response. This indicated that saving money on the initial cost of purchase resonates throughout the UAE, especially in the more populated regions of the country. In regions with higher population and more urbanization, residents have greater exposure to information about EVs. This is attributed to the presence of more extensive media coverage, advertising, word-of-mouth communication, data on EV performance and cost savings, and a higher frequency of EV sightings on the streets. In regions with a lower population and less urbanization, the level of awareness about EVs is comparatively lower. These areas do not have the same exposure to EV-related information and promotional campaigns (Singh et al., 2020) [
35].
In addition, economic conditions within a region play a pivotal role in influencing attitudes towards EVs. Higher income levels in Dubai and Abu Dhabi often lead to greater financial flexibility and a higher capacity to invest in relatively expensive vehicles like EVs. Job opportunities and income stability are also more abundant in Dubai and Abu Dhabi, potentially increasing the affordability of EVs for residents. However, income levels and job opportunities differ significantly in Ras Al Khaimah and Umm al Quwain. Lower average incomes and limited employment options result in a more cautious approach to major expenditures like EVs (Sierzchula et al., 2014) [
9].
Lastly, the availability of EV charging infrastructure also varies between highly populated Emirates like Dubai and Abu Dhabi and sparsely populated Emirates like Ras Al Khaimah and Umm al Quwain. Dubai and Abu Dhabi have a well-developed charging network, making EV ownership more practical and appealing. In contrast, Ras Al Khaimah and Umm al Quwain have limited access to charging stations, which can be a deterrent for potential EV buyers (see Dubai EV Community Hub, 2023) [
34].
Overall, the findings highlight the complexity of consumer attitudes in a context where income disparities, economic considerations, and geographical location intersect, emphasizing the need for tailored approaches in both policymaking and marketing strategies. Accordingly, we propose several government policies and marketing strategies that would benefit the UAE. First, EV purchase incentives should be introduced that provide higher subsidies to individuals with lower incomes. Reduced registration fees or exemptions for EVs should be included. This can help lower-income individuals overcome the initial cost barrier of purchasing an EV. Moreover, regional incentives should be implemented that provide additional benefits for residents of Emirates with lower population counts and less urban development. Regional incentives may include enhanced charging infrastructure development, tax incentives, or localized awareness campaigns. Lastly, financial institutions should collaborate amongst themselves to offer low-interest loans for EV purchases, making them more accessible to lower-income individuals. This approach is aligned with the principle of equitable access to sustainable technologies and helps narrow socio-economic disparities in access to green transportation options.
Second, public awareness campaigns should be designed that emphasize the economic benefits of EVs for lower-income individuals, focusing on petroleum and maintenance savings. For higher-income groups, the notion that the adoption of EVs aligns with global sustainability goals, social prestige, and the exclusivity associated with EV ownership should be highlighted. Furthermore, the campaigns should be tailored to address the specific needs and concerns of residents in different Emirates. In Emirates with a high population count and more urban areas, the convenience of charging infrastructure and urban benefits should be stressed, while in Emirates with low population counts and more rural areas, how EVs can be a sustainable option even in less densely populated regions should be emphasized. Lastly, in Emirates with a high population count and more urban areas, messaging can highlight the extensive charging infrastructure, the availability of EV-friendly amenities, and the urban benefits of reduced air pollution and traffic congestion. In Emirates with low population counts and more rural areas, messaging can focus on the environmental benefits of reducing emissions and the potential for using EVs for longer journeys. Overcoming the perception that EVs are exclusively suited for urban environments broadens their adoption in less populated regions.
Third, the expansion of charging infrastructure should be invested in, especially in Emirates with low population counts and more rural areas. This will help address concerns about range anxiety and enhance the appeal of EVs in less urban regions. Moreover, electric buses should be integrated into the public transportation system, offering convenient and cost-effective options for residents with lower incomes. Lower-income individuals, in particular, rely on public transit in the UAE as their primary mode of transportation, given the cost savings and accessibility it offers. Electric buses are not only environmentally sustainable, but can also lead to lower operational costs, making public transit more affordable in the long run (Al Ameer, 2023) [
36]. This aligns with the UAE’s broader urban sustainability objectives: reducing carbon emissions, improving air quality, and promoting green transportation alternatives.
Fourth, research and development for local EV manufacturing should be supported, which can reduce the cost of EVs and create job opportunities. Cost-saving measures include reduced shipping and import costs, shorter supply chains, and easier access to regional components and materials. As a result, locally manufactured EVs can be more cost-competitive compared to imported models. The availability of more affordable EVs aligns with the principle of expanding the appeal of electric mobility to broader demographic groups. Lower-priced EVs can appeal to individuals with various income levels, including lower-income groups, who may otherwise find EVs financially out of reach. This benefits all income brackets and contributes to the UAE’s economy.
Finally, the study’s main findings shed light on the intricate interplay of economic and geographic factors influencing consumer opinions toward adopting EVs in the UAE. The analysis reveals that individuals across income brackets generally view EVs favorably for reducing expenses related to petroleum, with heightened interest in cost savings on vehicle maintenance and the initial purchase price observed among higher income levels. The distribution of monthly incomes aligns with the predominantly low- to medium-skilled expatriate workforce, constituting the majority of the population with low-income levels, and the smaller high-skilled expatriate and Emirati workforce with higher income levels. Geographic variations indicate that highly populated Emirates with more urban areas find cost-saving measures associated with EVs more appealing than less populated, more rural Emirates.
The impact of income on saving money on petroleum is evident, with higher variability among those earning above AED 50,000, suggesting diverse financial circumstances influencing perspectives. Geographical location consistently influences the appeal of EVs for saving money on petroleum across all Emirates, indicating a uniform resonance throughout the UAE. The appeal of saving money on car maintenance is income-dependent, with higher income levels demonstrating greater interest, emphasizing the relevance of financial considerations in shaping attitudes. However, geographical location shows a neutral stance, possibly due to the limited awareness about EV maintenance and charging infrastructure. The appeal of saving money on the initial cost of purchase is generally high across income brackets, with variations in responses among higher income levels reflecting diverse financial priorities. Geographic disparities indicate a greater appeal in highly populated Emirates, which can be attributed to the enhanced exposure to EV-related information and infrastructure. The findings underline the complexity of consumer attitudes, necessitating tailored policy and marketing strategies, including targeted incentives, awareness campaigns, infrastructure development, and support for local EV manufacturing to address the multifaceted influences on EV adoption in the UAE.


