

Software Defect Prediction Analysis Using Machine Learning Techniques


1
Department of Computer Science, Federal Urdu University of Arts, Science and Technology Islamabad, Islamabad 44000, Pakistan
2
Department of Computer Science, College of Computer Science, King Khalid University Abha, Abha 61413, Saudi Arabia
3
Department of Software Engineering, Faculty of Computing, Capital University of Science and Technology, Islamabad 44000, Pakistan
*
Author to whom correspondence should be addressed.
†
These authors contributed equally to this work.
Sustainability 2023, 15(6), 5517; https://doi.org/10.3390/su15065517
Submission received: 2 January 2023
/
Revised: 27 February 2023
/
Accepted: 9 March 2023
/
Published: 21 March 2023
(This article belongs to the Special Issue Advances in Software and Hardware Engineering towards a Sustainable Technology Education)
Abstract
:There is always a desire for defect-free software in order to maintain software quality for customer satisfaction and to save testing expenses. As a result, we examined various known ML techniques and optimized ML techniques on a freely available data set. The purpose of the research was to improve the model performance in terms of accuracy and precision of the dataset compared to previous research. As previous investigations show, the accuracy can be further improved. For this purpose, we employed K-means clustering for the categorization of class labels. Further, we applied classification models to selected features. Particle Swarm Optimization is utilized to optimize ML models. We evaluated the performance of models through precision, accuracy, recall, f-measure, performance error metrics, and a confusion matrix. The results indicate that all the ML and optimized ML models achieve the maximum results; however, the SVM and optimized SVM models outperformed with the highest achieved accuracy, 99% and 99.80%, respectively. The accuracy of NB, Optimized NB, RF, Optimized RF and ensemble approaches are 93.90%, 93.80%, 98.70%, 99.50%, 98.80% and 97.60, respectively. In this way, we achieve maximum accuracy compared to previous studies, which was our goal.
1. Introduction
Software defect prediction (SDP) is a technique for improving software quality and reducing software testing costs through the creation of multiple categorization or classification models utilizing various machine learning approaches. Many companies that develop various types of software want to foresee problems to maintain software quality for customer satisfaction and save testing costs. SDP is part of the software development life cycle in which we predict the fault using a Machine Learning (ML) approach with historical data [1]. It is a structured methodology that enables the creation of high-quality, low-cost software in the short possible time to meet customer expectations.
SDP’s mission is to provide high-quality software and dependability while making efficient use of limited resources. As a result of this, software developers will be able to prioritize the utilization of computer resources at each level of the software development process [2,3]. Many organizations which are producing various types of software wish to predict the defects in software to maintain software quality for customer satisfaction and to save the testing cost. SDP is used to increase the software’s quality and testing can be conducted efficiently by constructing various classification models using different machine learning methods. A wide range of ML approaches has been investigated so far to anticipate errors in software modules to enhance software quality and reduce software testing costs. There are several ML techniques, which are implemented in the SDP Decision tree, Naïve Bayes (NB), Radial basis function, Support Vector Machine (SVM), K-nearest neighbor, Multi-layer perceptron and Random Forest (RF) [4].
New advances in ML are ensembling techniques and various ML techniques with feature selection methods such as PCA, etc. [5,6]. In the extant literature, there are several types of software metrics that have been found and utilized for SDP. It would be more practical to deal with the most important software metrics and focus on them to predict defect in software [7]. SDP analyses data from the past acquired from software repositories to find out the quality and reliability of software modules [8]. There are numerous types of software metrics that have been found and utilized for SDP in existing literature. SDP models are generated with the help of software metrics from data acquired from previously established systems or similar software initiatives [9].
It would be more practical to look at and focus on the most important software metrics to predict bugs in the software. Therefore, the dataset used in the paper has been publicly available on the Promise Repository since 2005, providing information on various applications that NASA (National Aeronautics and Space Administration) has investigated. In the research context, after dataset pre-processing and feature selection (FS), K-means clustering is used to perform the output categorization. Then, ML approaches such as SVM, NB and RF with and without particle swarm optimization (PSO) are used. An ensemble approach is then used to integrate the results. Finally, all ML models are analysed and compared to the previous studies. The models’ performance is evaluated using precision, accuracy, recall, F-measure, performance error metrics, and confusion matrix.
2. Motivation
Software businesses are working hard to create error-free software modules. The software’s quality has been lowered as a result of faults, and it is unable to perform tasks with accuracy and efficiency. The most critical stage of any software, which necessitates comprehensive testing, is software defect identification, which is the most significant aspect of the SDLC [10]. Managing defects not only improves the quality of solutions but also encourages all software development teams to consider quality across the whole project life cycle, resulting in continuous improvement of deliverables. To increase the dependability and utility of the software, software flaws must be immediately identified and fixed.
3. Contribution
The goal of our research is to improve or achieve high accuracy and precision of the CM1 dataset by using ML approaches related to literature techniques. Additionally, we validate the results against a large amount of data compared to other researchers. Therefore, with our proposed analysis method, we achieve maximum accuracy compared with previous studies, which was our goal.
This research paper includes the following sections. Section 4 discuss previous research on the subject as well as methods that have been proposed in the past. Section 5 contains information about the dataset and the techniques used to obtain better results. The results of all analyzed techniques are included in Section 6, along with a comparison of evaluation measures and analyzed methods to earlier approaches. The research is concluded in the conclusion section using strong arguments and maximum accuracy is achieved by the analyzed approaches, which outperform others.
4. Related Work
In SDP, the most commonly used ML approaches are clustering, classification and deep learning. Using ML-based classifiers and statistical approaches, researchers have suggested a variety of SDP models. In their study, Iqbal et al. [4] used multiple classification algorithms to forecast software errors using twelve NASA datasets. Classifiers include NB, Redial basis function, K-nearest neighbor, Multi-layer perceptron, K-star, SVM, Decision tree, One rule, and RF. Precision, accuracy, recall, f-measure, and AUC were used to assess performance. Root cause analysis attempts to find the root causes of the issue in order to remedy the problem. The root cause analysis method helps us to find defects at an early stage. Different types of clustering techniques are implemented in the model [10]. Clustering is a form of unsupervised learning which works on data similarities. Researchers applied the various types of clustering techniques to find out the defect. WEKA was used to implement clustering techniques. K-means clustering presents better performance on this.
ML-based classification is also used for Software bug prediction [11]. The different classifier is applied with Machine Learning for this. Artificial Neural Networks (ANNs) classifier, NB classifier and Decision tree classifier are used in this ML-based classification, which achieved good results. Five classes are the output of this approach with small dataset measurements. The experimentation is implemented on three public datasets. WEKA 3.6.9 is used as a ML tool. ML techniques have good performance in this task. Perreault et al. used five distinct types of classifiers to discover software defects in their investigation [12]. To measure performance, five distinct datasets from NASA’s metrics data program were employed for classification: Neural networks, logistic regression, NB, SVM and k-nearest neighbor. For some datasets, NB and SVM perform best amongst others. Poor software quality is caused by software faults. As a result, it is critical to eliminate software faults in order to improve software quality.
Rawat and Dubey et al. [13] provide numerous models for improving software quality by studying factors that affect software quality and improving product and quality in terms of software in their research. They looked at a variety of size and complexity measurements, as well as models such as Bayesian belief networks, genetic algorithms and neural network, among others. Surndha Naidu et al. [14] presented another good paper. The major purpose of the article was to identify how many problems there were overall in order to save money and time. Volume, difficulty, commitment, and time estimator, as well as program length, have all been used to categorize the defect. They employed a decision tree classifier for this. To classify defects, they used the classification algorithm ID3. They then used a pattern mining approach to classify faulty patterns. They used JAVA to implement the proposed paradigm.
The literature on model prediction focuses on extracting characteristics and utilizing various ML algorithms. Control Flow Graphs (CFG) with a neural network approach is introduced [15]. This model’s first step is about CFG, in which they present a program of software into graphs. After compiling the source code, a program’s CFG is built from the assembly code. A Strong neural network on label graphs is used, which is also known as a multilayer convolution neural network. This model’s performance is evaluated using four datasets.
For prediction, this research in [16] presents a standard ADBBO (Adaptive Dimensional Biogeography-Based Optimization) model combined with RBFNN (Redial Basis Function Neural Network) model. Five datasets that are publicly available and part of the NASA data program are used in the experiments. The authors conduct a comparison with predictions from earlier studies for similar datasets. The class imbalance issue reduces the accuracy of defect prediction. Kernel-based learning was introduced by Ren et al. [17]. This problem is solved using an AKPLSC (Asymmetric Kernel Partial Least Square Classifier) and an AKPCAC (Asymmetric Kernel Principal Component Analysis Classifier). After that, both classifiers are subjected to the kernel function. As a kernel, a Gaussian function is utilized. Experimentation is carried out using SOFTLAB and NASA databases.
In [18], Pooja Paramshetti et al. use K-means clustering and the a priori technique. Clustering is used to achieve discretization, and then a priori is used to extract rules or patterns from data. Experimentation is carried out using NASA defect data. Finally, a comparison with existing techniques is given. The CART technique, which is an optimized regression and classification tree, is proposed in paper [19]. Along with this method, principle component analysis is utilized to minimize dimensions. They claim that optimization run time is an overhead in this case. As a result, further improvements can be realized by shortening the run time.
A genetic algorithm with an upgraded deep neural network is proposed in [20]. For feature optimization, a genetic algorithm is applied. As a result, a hybrid technique is employed to anticipate defects utilizing four datasets. The promise data repository provided the dataset. For implementation, a MATLAB tool is used. The accuracy of this hybrid method is excellent.
The ensemble method based on feature selection was utilized in this study [21]. The proposed framework has been implemented both with and without Feature Selection (FS). NASA provided twelve cleaned public datasets. The proposed findings are compared to those of different classifiers. Although the results are improved, the problem of class imbalance persists in this situation. Different ML algorithms are examined in this work [22]. Artificial neural network, decision tree, NB, PSO and linear classifier are among the algorithms used. The KEEL tool is used to perform the experiments, and seven datasets from NASA’s data repository are used. In four datasets, the linear classifier outperforms the rest.
The ANN approach is combined with the Artificial Bee Colony (ABC) approach in [23]. The ABC algorithm is used to train the artificial neural network. For optimization, the ABC algorithm is applied. In the data, there is a problem with class imbalance. As a result, the results are unbalanced. NASA Data Program provided five separate datasets for this investigation. For performance evaluation, accuracy, AUC and other metrics are used. A mixed strategy is adopted in this study [24]. With a decision tree classifier, a genetic algorithm is applied. The fitness function is applied to those features that have been optimized by this. This study makes use of three promise repository datasets. Experimentation is carried out using the MATLAB program. Alternative approaches to estimating the probability of defects are discussed in this publication [25]. However, the bulk of these experiments rely on predicting defects from a wide variety of device functions.
In this review [26], the authors discuss some software metrics and datasets for predicting defects. They are mostly used for finding defects in the ML approach, which consists of making information from software archives which contain messages as well as sources code. Instances contain a method, class, sources code, packages and code change. The instance also contains some features obtained from the software archives. Metrics values characterize software complexity and development. Instances are considered as labeled or non-labeled. Metrics play an important part in making any predicting model which helps to improve the consistency of software by getting as much as possible defect from the software. Metrics are divided into two-part code, which describes the complexity of code, and process metrics, which describe the complexity of development. The most used code metrics are line of code metrics. A defect dataset is important for predicting defects. Some early studies show that researchers used a non-public dataset. Some publicly available datasets are NASA, SOFTLAB, PROMISE, ReLink, AEEEM, ECLIPSE 1, ECLIPSE 2, etc. For predicting software defects, many evaluation measures are used, i.e., Probability of defect, True Positive (TP) rate, False Negative (FN), True Negative (TN) and False Positive (FP) rate, precision, accuracy, G measure, F measure, AUC. With the new advancement in research, the ML algorithm for SDP has also improved.
In [5], a hybrid technique is utilized to predict faults. The authors use a feature selection approach in conjunction with various machine learning classifiers. For feature selection, the Optimized Artificial Immune Networks (Opt-aiNet) method was utilized. ML classifiers are used to compare the results. From the PROMISE repository, five separate datasets are used. Accuracy and AUC are evaluation metrics. After selecting features, performance improved. The work in [27] suggested a remedy to imbalance problem. Principle component analysis was used to pick features. For cost-sensitive imbalance problems, ANFIS is employed for prediction. This method improves the ROC area by 5%.
Another excellent paper was presented by Alsaeedi et al. [28]. To anticipate flaws, they used three classifiers: Decision tree, RF, SVM and ensemble approaches including Ada-boost and Bagging. For the imbalance data, SMOTE sampling was used. Ten NASA datasets are used in the experiment. Among all approaches, RF and Ada-boost with RF performed best. The use of many classifiers in a combined strategy is a hot issue these days. For defect prediction, the article in [29] also used a mixed or ensemble technique. Six algorithms were used on five different datasets from the NASA MDP database. To improve data quality, SMOTE was employed for sampling. Experimentation was performed using the WEKA tool. The best ensemble algorithm is RF.
The work in [30] employs tree-based ensembling. For the four free source NASA Metric Data Program Datasets, seven ensemblers are employed. Two are bagging, while the other five are boosting. Bagging performs well, however, Ada-boost performs poorly. Different clustering algorithms are used in [31], and the resulting clusters are then integrated into a single model. To increase software quality, PSO is employed. To improve the quality of software, the NB classifier is used in conjunction with ARM, which is used to pick features [32]. NASA datasets are used to test five different datasets. Other methods are used to assess performance. Different ML approaches and frameworks are used with different metrics to eradicate issues in this review [33]. They looked at 40 studies published in various journals between 2009 and 2018. Despite all of the work that has been done in this field, there is always room for improvement due to the imbalanced nature of datasets and ambiguities.
The authors of [6] analyzed five public datasets from the promise repository using ML-based predictions and ten classifiers. Measure accuracy was used in the evaluation. Deep learning techniques were investigated for defect prediction in this survey [34]. None of the methods consistently produced results with great accuracy, recall and precision. SLR was employed to monitor current developments in ensemble or hybrid techniques [35]. A strategy was unveiled to boost performance. From reputable online libraries, 46 papers were chosen for shortlisting. According to a study, FS and data sampling enhance outcomes. Utilizing evaluation metrics, performance is accessed. The ensemble strategy outperforms others.
The literature study shows that various ML techniques have been applied till now but their performance varies across datasets and in terms of ML, their performance is less accurate. Therefore, we want to improve accuracy by analysing various ML techniques combined with FS and K-means clustering. The purpose of research is to improve accuracy with respect to literature studies.
5. Materials and Methods
5.1. Model Design
ML is such a significant achievement in Artificial Intelligence (AI), it is evident that a model for SDP based on ML techniques is necessary to maintain quality and save testing cost [2,4]. We find many issues related to predict software defect from the literature utilizing ML methodologies. On various datasets, the authors used a range of ML algorithms [4,5,21]. Some are precise, while others vary in their performance and accuracy or precision. The objective of this investigation is to create an SDP analysis prototype by saving testing cost while increasing proposed system accuracy. For this purpose, we are analyze different ML techniques with selected features and clustering to achieve good accuracy. We intend to achieve high accuracy utilizing our analyzed methods, which employ ML algorithms, using the CM1 dataset [28,29], which has less accuracy in most techniques [6].
Figure 1 demonstrates the architecture of the suggested model. We examined various well-known ML techniques and optimized ML techniques on a freely available dataset in order to improve the datasets’ accuracy in comparison with previous research. For this purpose, we employed K-means clustering for the categorization of class labels. Further, we applied classification models to selected features. Particle Swarm Optimization was utilized to optimize ML models. We evaluated the performance of models through precision, accuracy, recall, f-measure, performance error metrics and a confusion matrix. Below, we will discuss these figure sections in detail. The aim of choosing ML techniques is to improve accuracy on these well-established ML techniques because in the literature, the findings of these ML techniques vary and can be improved further. Therefore, the objective is to improve performance or accuracy on these ML techniques and analyse the results.
5.2. Dataset
We utilised the PROMISE Software Engineering Repository’s CM1 dataset [36], which is freely available and part of NASA Metrics Data Program (MDP), in our research. CM1 is a C-based NASA spacecraft instrument. There are 498 instances or modules in the collection, as well as 22 properties, as mentioned in Table 1.
This study’s dataset properties are based on four McCabe metrics, twelve Halstead measurements, and a few more metrics. McCabe Metrics are Method-level Metrics that focus on programming principles and are straightforward to gather from source code [6]. Other Halstead Metrics are numerical data and they may be easily gathered with any piece of software [36]. Table 2 lists the dataset metrics.
5.3. Techniques
5.3.1. Data Pre-Processing
From dataset analysis, it is concluded that the dataset needs to be transformed to a standard format before applying any ML models, as there are 498 tuples and 22 features in the dataset. In each column of the dataset, there is a wide range of values, e.g., the column ‘e’ (e is the effort to write program) has a maximum value of 2,153,690.63 and minimum value of 0.0; additionally, the column ‘t’ (t is the time to write program) has a maximum value of 119,649.48 and minimum value of 0.0. The column ‘I’ (I is intelligence) has a maximum value of 1.30 and a minimum value of 0.0. There is a huge gap in-between the columns and with other columns. The mean value of column ‘t’ is 1938.056124 and the standard deviation is 7453.591519, while column ‘I’ has a mean value of 0.146325 and a standard deviation of 0.159337. Thus, for this purpose, a standard scaling technique is used in this study for standardizing the data set. It arranges data in a standard normal distribution. Mathematically, the standard scalar Z can be determined as:
where x is an observation, u is training samples’ mean, while the training samples’ standard deviation is s. In the dataset, we checked for null values, but there were no null values in any tuple.
5.3.2. Feature Selection
The feature selection method is used to reduce the number of features utilized in a predictive model’s training and testing. The variance inflation factor approach and correlation method are utilized in this paper to identify the significance of values and multi-collinearity of a feature after preparing the dataset [4]. Two features have a positive correlation if an increase in one feature value causes an increase in another feature value and a decrease in one feature value causes a decrease in another feature value. If the change in one feature value does not affect another feature value, these two features do not correlate. If an increase in one feature value causes a decrease in another feature value or a decrease in one feature value causes an increase in a feature value, the two features are negatively correlated [7]. Figure 2 shows the correlation between all features of the data set. We chose the top 10 attributes that are negatively associated or have no association based on relevance and high significance without class labels. The major reasons for reducing the number of features are to reduce computational costs and to prevent overfitting difficulties to enhance model performance.
In this research, we utilized unsupervised ML (clustering) for categorizing the output class labels and supervised ML (classification) for prediction purposes.
5.3.3. Clustering
Next, K-means clustering is used to discover class labels, as well as inertia and the elbow approach to select the best number of clusters (K). In K-means clustering, the number of clusters created is denoted by the symbol K. Inertia is a metric for how effectively a data collection is clustered and is derived by squaring the distance between each data point and its centroid, then adding the squares throughout one cluster.The elbow approach makes use of the Within Cluster Sum of Squares idea (WCSS). To calculate the distance between data points and the centroid, the WCSS employs the distance formula. Here, the K value is 2, with an inertia of 5947.92, as shown in Figure 3.
As can be seen from the equations above:
is the sum of the square of the distances between each data point and its centroid within cluster1 and the same for the other terms.
5.3.4. Classification
Supervised ML is applied to data with output class labels. There are two portions to the data set: training and testing. The training dataset makes up 67% of the total, whereas the testing dataset makes up just 33%. First, the data are provided with output class labels for training purposes, and then unseen data with no output class labels are provided for testing. We used three ML classification models for analysis, i.e., SVM as Linear SVC classifier, NB as Gaussian NB classifier, and RF as Random Forest classifier with ensemble method as Stacking classifier to analyze and combine the results of the above three models by using NB as a base model and SVM and RF as member models. The number of trees in the RF model is 1000 and the random state for all classifiers is 42. The classifiers are then analysed with and without PSO techniques. The number of particles during experimentation is kept at 20.
5.3.5. SVM
SVM is a supervised ML model mostly applied to data with two classes as output [10]. SVM models perform better with high speed if the dataset has limited data. The SVM model draws a decision boundary between the data to classify each class. The best hyperplane in an SVM model is when there are maximum margins from both classes. The SVM model is employed in this work to predict the output class label and it obtains the best results. The Random State is 42. As a classifier, linear SVC is utilized.
5.3.6. NB
The NB algorithm is a Bayes algorithm-based categorization method. It works by calculating probabilities against likelihoods. When there is no association between the characteristics of a data set, the NB method works well. The state of randomness is 42. The classifier is a Gaussian NB.
5.3.7. RF
The RF is a classification model that employs the notion of ensemble learning, which entails combining numerous classifiers to improve the outcome. The RF model comprises a number of DTs that are applied to subsets of the data set and then averaged to determine performance measures. The number of trees used has a significant impact on accuracy and other measures. The model improvement, however, becomes constant after a certain number of trees. Knowing the right amount of trees is crucial for training purposes. In this case, 1000 trees are employed, and the random state is 42. As a classifier, Random Forest is utilised.
5.3.8. Ensemble
In ML, the ensemble technique mixes numerous prediction models to provide superior results. In the ensemble method, one model serves as the basis, while the others serve as members. Ensembling can be performed in a variety of ways. The stacking classification approach is employed. The NB model serves as the base model, and the SVM and RF models serve as member models. In the ensemble model, the random state is 42.
Finally, we analysed all models, both without and with optimization. Precision, accuracy, recall, f-measure, performance error measures and a confusion matrix were used to assess model performance.
6. Results and Discussion
6.1. Experimental Setup
The ML classification experiments in this document were performed on a Windows laptop with an Intel(R) Core(TM) i5-2410 M processor, 6 GB of primary storage and 1 TB of secondary storage. The ML model was implemented using the Python programming language. Python is commonly used in predictive analytics and data science projects involving both qualitative and quantitative data. The Python packages pandas, numpy, seaborn, matplotlib, sklearn and pyswarm were used to build the ML predictor.
6.2. Experimental Results
The results of the experiments on the CM1 dataset using various ML techniques are reported in the form of graphs and tables. These graphs offer a comparison of several techniques. We will assess all findings by comparing all strategies with and without optimization to make the notion obvious and understood. Table 3 and Table 4 show the evaluation metrics for all ML approaches studied without and with optimization, respectively. All analysed models have the best results but SVM and optimized SVM have better performance in both cases than others. Here, the SVM model accurately predicted output class 1 as 1 so precision is 100%, while one output class 0 is predicted as 1, which is why recall is lesser. Moreover, NB does not work well as it works well on the high-dimensional dataset. RF and ensemble have almost the same result because Rf is also an ensemble approach that combines the large collection of trees. The RF model achieves a precision of 100% and an accuracy of 98.7%. This model also predicts 100% accurately the output class 1 and misses two values in the 0 class.
The outcomes of all ML models, as well as the ensemble approach, without optimization, are shown in Figure 4. The precision of all algorithms is the greatest among the measures, as seen in the graph. This is because all models have predicted the one class as 1. The NB model does not perform well in the case of recall and f-measure because it works on a large quantity of data or a high-dimensional dataset. The RF model and ensemble model have almost the same results. However, the SVM model outclasses in all evaluating metrics.
Figure 5 is the combined result of all the predicting models with PSO. Overall, all the models along with the ensemble technique achieve good evaluating metrics; however, each model has been outperformed without optimization. The optimization solutions are best when the size of the data set is increased. However, the recall and f-measure values improve in this case. Yet here, the Recall and F-measure are improved compared with the rest.
The major goal and objective of analyzing various ML models are to improve the accuracy of classifiers so that outcomes can be predicted as precisely as feasible. The expected model analysis is compared and distinguished to recognized benchmark metrics such as Mean Absolute Percentage Error (MAPE), Root Mean Square Error (RMSE) and Mean Absolute Error (MAE) to ensure and confirm that the models are adaptive. The following Table 5 and Table 6 show the Performance error values of models. In terms of performance error evaluation, as the values in the table demonstrate, all of the analyzed models have a lower error rate.
Figure 6 and Figure 7 show the error measures of all models without and with optimization. The error measures such as MAE, RMSE, MAPE, etc. show how many errors were there while training and testing the ML model. The smaller the error values, the lesser the error in the model, and the maximum the error values, the more the error in the ML model. All models have lower error rates, but SVM and optimized RF have lower error values in both scenarios without any optimization and optimization from other techniques.
6.3. Statistical Analysis
Statistical analysis is the process of utilizing quantitative tools to look for patterns, trends and relationships in data. The use of statistical analysis may aid in the prediction of future research aspects. One can gather data using the most appropriate approaches, conduct adequate analysis and successfully communicate the results if one has statistical understanding. Statistical analysis, as shown in Table 7 and Table 8, is also used in the research to gain a better understanding of the findings and to forecast future demands. Chi-squared and Anova are performed in this work. The result shows that our analyzed models functioned well in all cases. A p-value is a metric to evaluate test significance in statistics. As a result, a low p-value indicates that the null hypothesis should be rejected, and the alternate hypothesis should be adopted instead, in short, the p-value should be as small as possible to reject the null hypothesis. The significance value in this study is 0.10. p-value of less than 0.10 shows that the null hypothesis is rejected and shows test significance. A smaller p-value than the significance value shows the test significance.
6.4. Discussion
Comparison with Previous Techniques in Terms of Accuracy
Table 9 shows the comparison of numerous ML approaches used in previous studies. We compared numerous ML approaches that were used as state-of-the-art techniques in previous studies, e.g., B. SVM, NB, Boost-RF, Bag-RF, SVM-FS, NB-FS, RF-FS, SVM-AdaBoost, RF-AdaBoost, SVM-PCA, etc. on our selected data set CM1, which is the ML technique with the lowest accuracy and which we wanted to improve by comparing different ML strategies using FS and clustering. As a result of the comparison, our evaluated methods perform well and show improvement in accuracy over prior state-of-the-art methods.
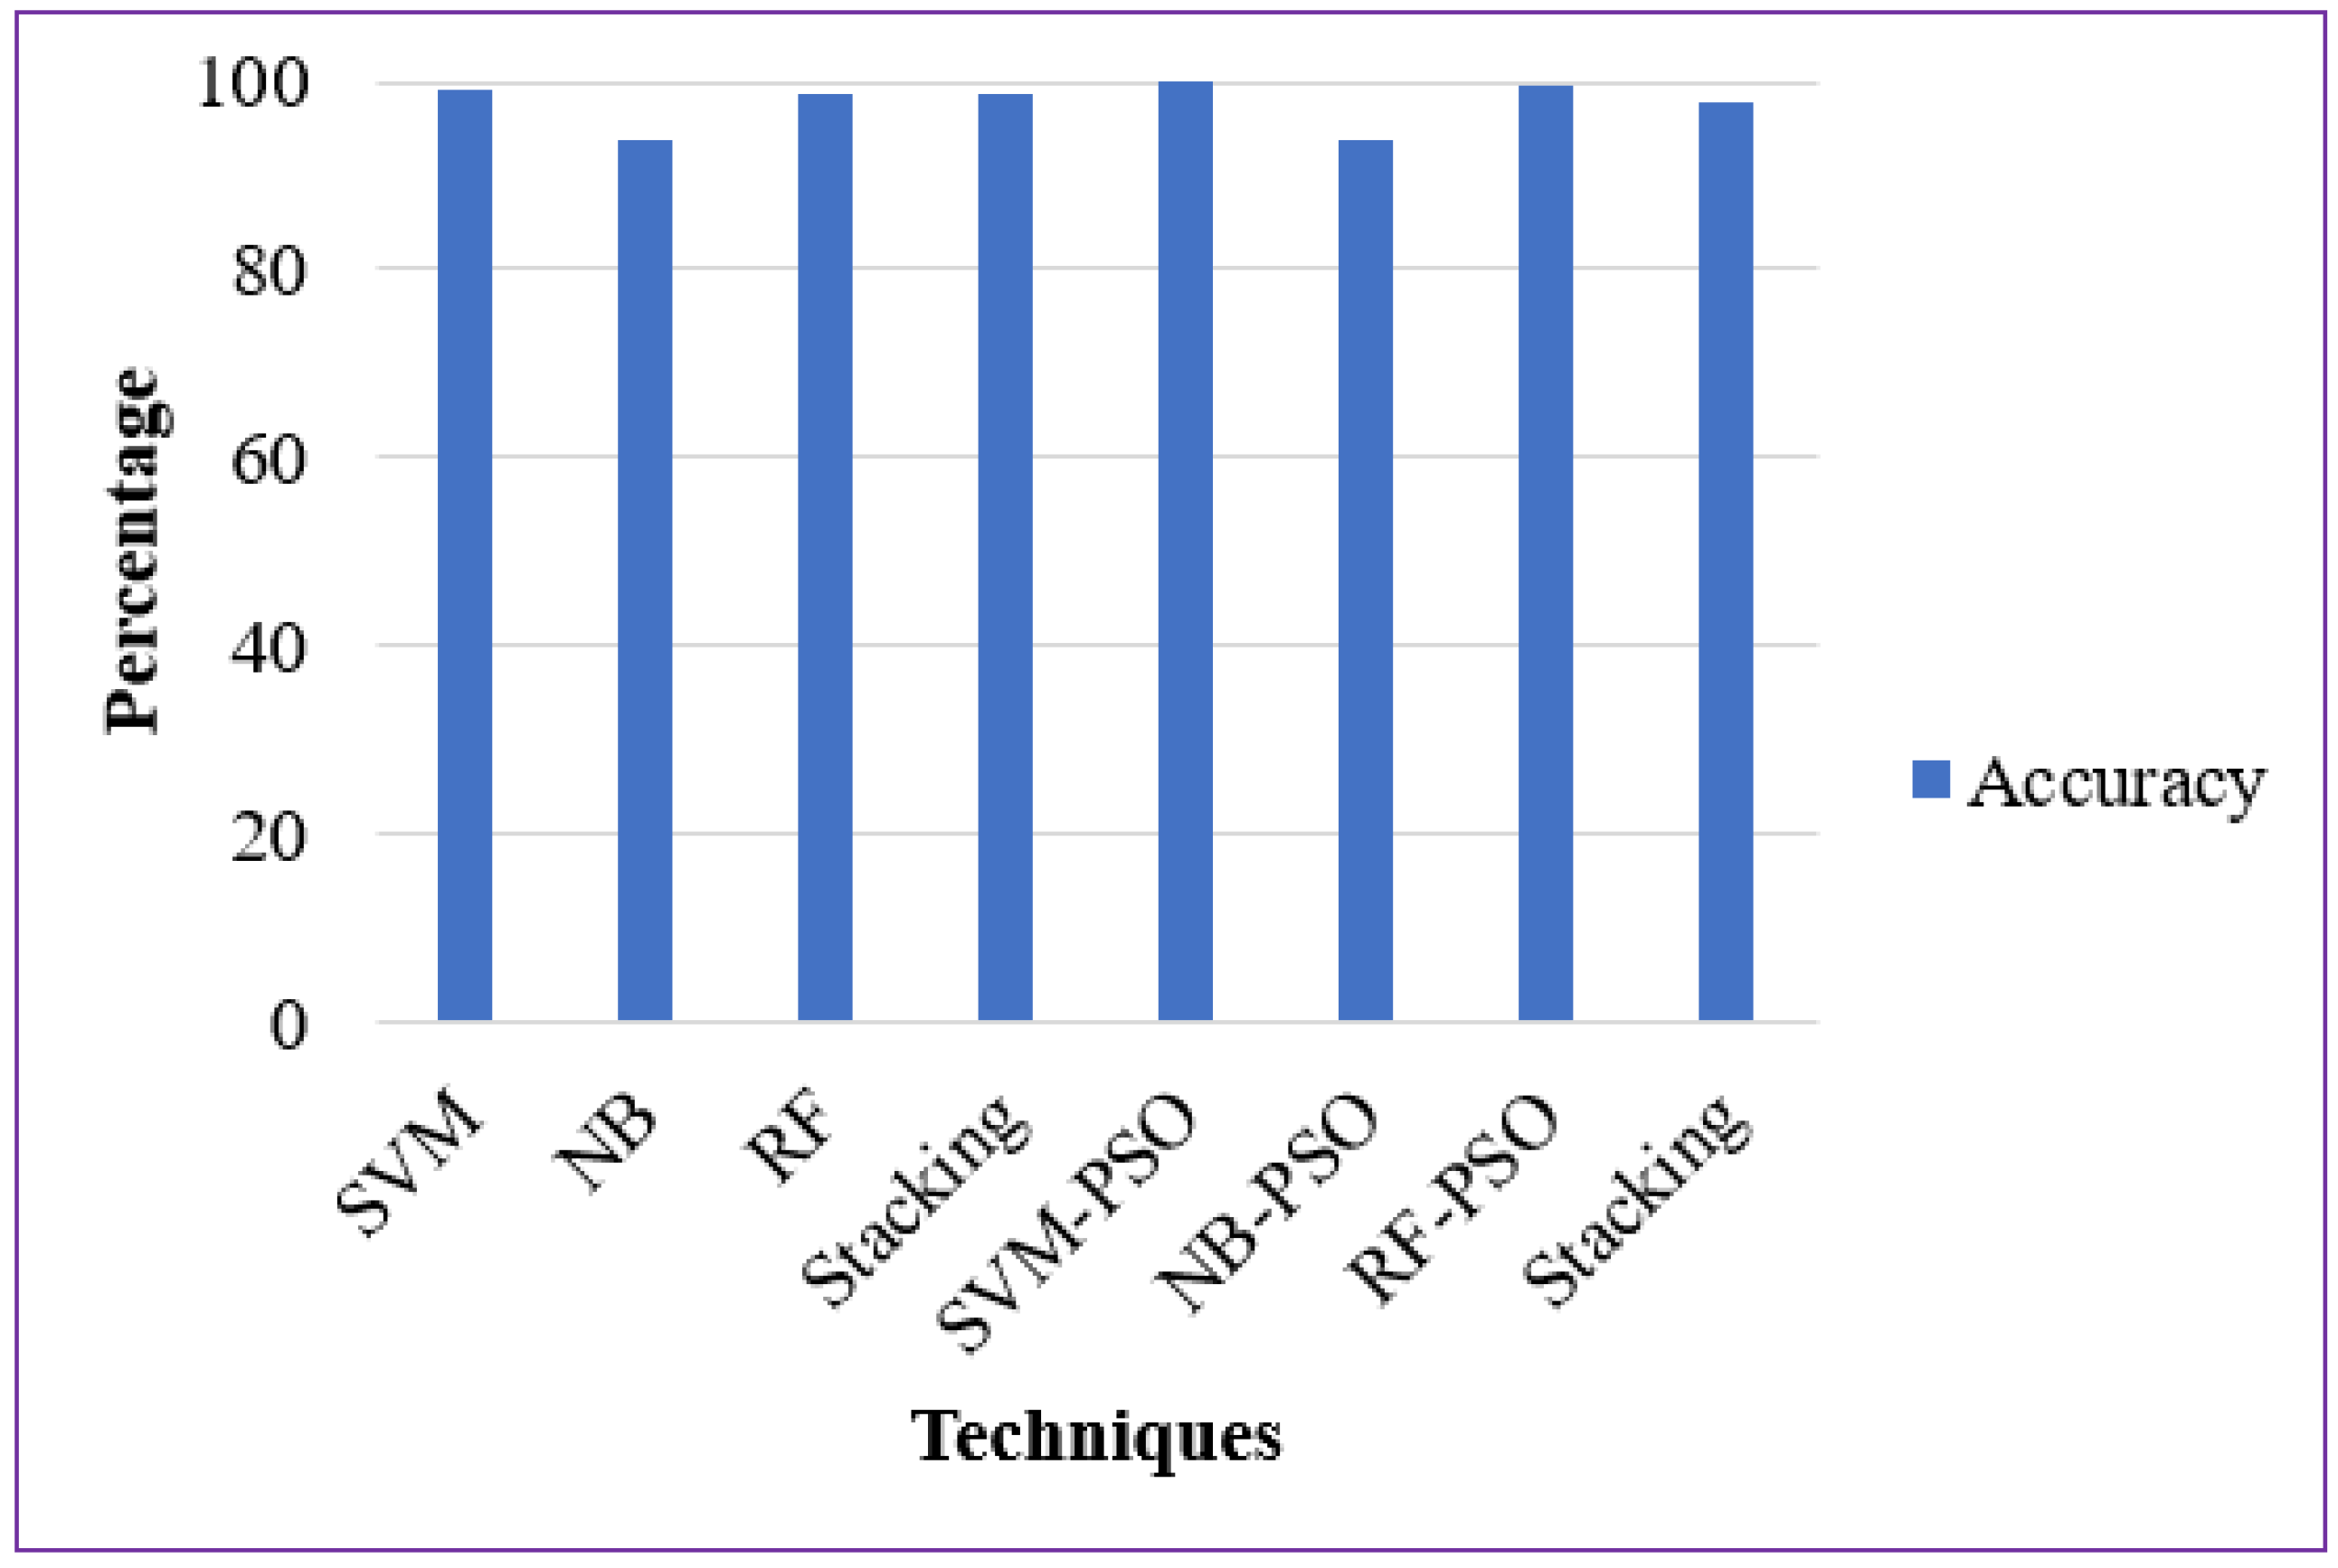
It can be seen from the graphs that our models with FS and clustering outperformed the other techniques from the literature, and we have validated our model on the large data that is 33% as accurate as other studies. Figure 8 shows the graph of the accuracy of literature techniques, and Figure 9 shows the graph of our analyzed techniques with FS and clustering.
6.5. Implication
In this article, we examined various known ML techniques and optimized ML techniques with and without optimization on a freely available data set to save testing costs while increasing system accuracy. The ML model was implemented using the Python programming language. Python is commonly used in predictive analytics and data science projects involving both qualitative and quantitative data. The Python packages pandas, numpy, seaborn, matplotlib, sklearn and pyswarm were used to build the ML predictor. The purpose of the research was to improve the model performance in terms of the accuracy and precision of the dataset compared to previous research. In this way, software companies can utilize this solution for early prediction of defects during development phases and correct them before delivering.
The most crucial phase of any software, which necessitates intensive testing, is software defect detection. It also occupies the most significant position in the software development life cycle (SDLC). The software development team can correct and remove the error before providing the finished product if they can locate the problematic component. Defect detection and repair are expected to cost billions of dollars annually. The goal of SDP is to produce excellent software while effectively utilizing the restricted resources available. The main objectives of our research were:
- -
- Analysis of ML Techniques on Software Metrics;
- -
- Software defect prediction models with high accuracy;
- -
- Increase performance in terms of accuracy.
Precision, accuracy, recall, f-measure, performance error measures and a confusion matrix were used to assess the performance of the models. The findings show that all of the ML and optimized ML models produce the best results, but the SVM and optimized SVM models outperformed with the highest achieved accuracy, respectively, of 98% and 99.80%. The corresponding accuracy rates for the NB, Optimized NB, RF, Optimized RF and ensemble approaches are 93.90%, 93.80%, 98.70%, 99.50%, 98.80% and 97.60%. In this manner, we obtained the highest degree of accuracy in comparison with earlier studies, which was our aim. In this way, we can attain high-quality software by reducing testing costs and time.
In the future, we can expand the data set and try to analyze different types of ensemble approaches with data balancing techniques to improve the error rate as well. Additionally, we can utilize some other optimization techniques that can work best on limited data as well.
7. Conclusions
In this paper, ML techniques are utilized with feature selection and K-means clustering techniques for software defect prediction. We examined various well-known ML techniques and optimized ML techniques on a freely available dataset to improve the accuracy of the dataset in comparison with previous research. The results are also analyzed by utilizing ML with the PSO method and ensemble approach. All ML models are trained and tested through Python programming language using Jupyter notebook. The analysis aimed to improve the accuracy performance of ML on the CM1 dataset. The results indicate that all the ML and optimized ML models achieve the maximum results; however, the SVM and optimized SVM models outperformed with the highest achieved accuracy, 99% and 99.80%, respectively. The accuracy of NB, Optimized NB, RF, Optimized RF and ensemble approaches are 93.90%, 93.80%, 98.70%, 99.50%, 98.80% and 97.60, respectively.
8. Future Work and Limitations
In this article, three ML classification models with and without optimization are performed using an ensemble approach to find bugs in software. These models are applied to a limited dataset. In the future, we will increase the size of the dataset and try to analyze different types of ensemble classifiers after applying data balancing techniques because due to balancing technique we can improve error measure as well to get maximum results. We will also apply a different optimization approach to a large dataset.
Author Contributions
A.K. performed algorithm troubleshooting, visualization, technical editing, conceptualization, resource management and project management. N.A. and G.B. prepared the theoretical framework, methodology and research conceptualization. M.S. and M.G. performed the technical review and improvement. All authors have read and agreed to the published version of the manuscript.
Funding
This research was funded by King Khalid University through Small Groups under grant number RGP. 1/369/43.
Institutional Review Board Statement
Not applicable.
Informed Consent Statement
Not applicable.
Data Availability Statement
Not applicable.
Acknowledgments
The authors extend their appreciation to the Deanship of Scientific Research at King Khalid University for funding this work through Small Groups under grant number RGP. 1/369/43.
Conflicts of Interest
The authors declare no conflict of interest.
Abbreviations
The following abbreviations are used in this manuscript:
| SDP | Software Defect Prediction |
| ML | Machine Learning |
| SVM | Support Vector Machine |
| NB | Naive Bayes |
| RF | Random Forest |
| PSO | Particle Swarm Optimization |
| FS | Feature Selection |
| WCSS | Within Cluster SUM of Squares |
References
- Arora, I.; Tetarwal, V.; Saha, A. Open issues in software defect prediction. Procedia Comput. Sci. 2015, 46, 906–912. [Google Scholar] [CrossRef] [Green Version]
- Ali, M.M.; Huda, S.; Abawajy, J.; Alyahya, S.; Al-Dossari, H.; Yearwood, J. A parallel framework for software defect detection and metric selection on cloud computing. Clust. Comput. 2017, 20, 2267–2281. [Google Scholar] [CrossRef]
- Yadav, H.B.; Yadav, D.K. A fuzzy logic based approach for phase-wise software defects prediction using software metrics. Inf. Softw. Technol. 2015, 63, 44–57. [Google Scholar] [CrossRef]
- Iqbal, A.; Aftab, S.; Ali, U.; Nawaz, Z.; Sana, L.; Ahmad, M.; Husen, A. Performance analysis of machine learning techniques on software defect prediction using NASA datasets. Int. J. Adv. Comput. Sci. Appl. 2019, 10, 300–308. [Google Scholar] [CrossRef] [Green Version]
- Mumtaz, B.; Kanwal, S.; Alamri, S.; Khan, F. Feature selection using artificial immune network: An approach for software defect prediction. Intell. Autom. Soft Comput. 2021, 29, 669–684. [Google Scholar] [CrossRef]
- Cetiner, M.; Sahingoz, O.K. A Comparative Analysis for Machine Learning based Software Defect Prediction Systems. In Proceedings of the 2020 11th International Conference on Computing Communication and Networking Technologies (ICCCNT), Kharagpur, India, 1–3 July 2020; pp. 1–7. [Google Scholar]
- Fenton, N.E.; Neil, M. A critique of software defect prediction models. IEEE Trans. Softw. Eng. 1999, 25, 675. [Google Scholar] [CrossRef] [Green Version]
- Herbold, S.; Trautsch, A.; Grabowski, J. A comparative study to benchmark cross-project defect prediction approaches. IEEE Trans. Softw. Eng. 2018, 44, 811–833. [Google Scholar] [CrossRef]
- Fenton, N.; Bieman, J. Software Metrics: A Rigorous and Practical Approach, 3rd ed.; CRC Press: Boca Raton, FL, USA, 2020; p. 618. [Google Scholar]
- Grishma, B.R.; Anjali, C. Software root cause prediction using clustering techniques: A review. In Proceedings of the 2015 Global Conference on Communication Technologies (GCCT) IEEE, Red Hook, NY, USA, 23–24 April 2015; pp. 511–515. [Google Scholar]
- Hammouri, A.; Hammad, M.; Alnabhan, M.; Alsarayrah, F. Software bug prediction using machine learning approach. Int. J. Adv. Comput. Sci. Appl. 2018, 9, 78–83. [Google Scholar] [CrossRef] [Green Version]
- Perreault, L.; Berardinelli, S.; Izurieta, C.; Sheppard, J. Using classifiers for software defect detection. In Proceedings of the 26th International Conference on Software Engineering and Data Engineering, Sydney, Australia, 2–4 October 2017; pp. 2–4. [Google Scholar]
- Rawat, M.; Dubey, S.K. Software Defect Prediction Models for Quality Improvement: A Literature Study. Int. J. Comput. Sci. 2012, 9, 288–296. [Google Scholar]
- Naidu, M.S.; Geethanjali, N. Classification of defects in software using decision tree algorithm. Int. J. Eng. Sci. Technol. 2013, 5, 1332. [Google Scholar]
- Phan, A.V.; Nguyen, M.L.; Bui, L.T. Convolutional neural networks over control flow graphs for software defect prediction. In Proceedings of the 2017 IEEE 29th International Conference on Tools with Artificial Intelligence (ICTAI), Boston, MA, USA, 6–8 November 2017; pp. 45–52. [Google Scholar]
- Kumudha, P.; Venkatesan, R. Cost-sensitive radial basis function neural network classifier for software defect prediction. Sci. World J. 2016, 2016, 2401496. [Google Scholar] [CrossRef] [PubMed] [Green Version]
- Jinsheng, R.; Ke, Q.; Ying, M.; Guangchun, L. On Software Defect Prediction Using Machine Learning. J. Appl. Math. 2014, 2014, 785435. [Google Scholar]
- Paramshetti, P.; Phalk, D.A. Software defect prediction for quality improvement using hybrid approach. Int. J. Appl. Innov. Eng. Manag. 2015, 4, 99–104. [Google Scholar]
- Yong, L.G.; Ying, X.L.; Qiong, Z.C. Research of software defect prediction based on CART. Int. J. Adv. Comput. Sci. Appl. 2014, 602, 3871–3876. [Google Scholar] [CrossRef]
- Manjula, C.; Florence, L. A Deep neural network based hybrid approach for software defect prediction using software metrics. Clust. Comput. 2019, 22, 9847–9863. [Google Scholar] [CrossRef]
- Iqbal, A.; Aftab, S.; Ullah, I.; Bashir, M.S.; Saeed, M.A. A feature selection based ensemble classification framework for software defect prediction. Int. J. Mod. Educ. Comput. Sci. 2019, 11, 54. [Google Scholar] [CrossRef] [Green Version]
- Singh, P.D.; Chug, A. Software defect prediction analysis using machine learning algorithms. In Proceedings of the 2017 7th International Conference on Cloud Computing, Data Science and Engineering-Confluence IEEE, Noida, India, 12–13 January 2017; pp. 775–781. [Google Scholar]
- Arar, Ö.F.; Ayan, K. Software defect prediction using cost-sensitive neural network. Appl. Soft Comput. 2015, 33, 263–277. [Google Scholar] [CrossRef]
- Manjula, C.; Florence, L. Hybrid approach for software defect prediction using machine learning with optimization technique. Int. J. Comput. Inf. Eng. 2018, 12, 28–32. [Google Scholar]
- Esteves, G.; Figueiredo, E.; Veloso, A.; Viggiato, M.; Ziviani, N. Understanding machine learning software defect predictions. Autom. Softw. Eng. 2020, 27, 369–392. [Google Scholar] [CrossRef]
- Li, Z.; Jing, X.Y.; Zhu, X. Progress on approaches to software defect prediction. IET Softw. 2018, 12, 161–175. [Google Scholar] [CrossRef]
- Maddipati, S.; Srinivas, M. Machine learning approach for classification from imbalanced software defect data using PCA and CSANFIS. Mater. Today Proc. 2021, 52, 471. [Google Scholar]
- Alsaeedi, A.; Khan, M.Z. Software Defect Prediction Using Supervised Machine Learning and Ensemble Techniques: A Comparative Study. J. Softw. Eng. Appl. 2019, 12, 85–100. [Google Scholar] [CrossRef] [Green Version]
- Li, R.; Zhou, L.; Zhang, S.; Liu, H.; Huang, X.; Sun, Z. Software Defect Prediction Based on Ensemble Learning. In Proceedings of the 2019 2nd International Conference on Data Science and Information Technology, Seoul, Republic of Korea, 19–21 July 2019; pp. 1–6. [Google Scholar]
- Aljamaan, H.; Alazba, A. Software defect prediction using tree-based ensembles. In Proceedings of the 16th ACM International Conference on Predictive Models and Data Analytics in Software Engineering, Virtual USA, 8–9 November 2020; pp. 1–10. [Google Scholar]
- Coelho, R.A.; Guimaraes, F.D. Applying Swarm Ensemble Clustering Technique for Fault Prediction Using Software Metrics. In Proceedings of the 2014 13th International Conference on Machine Learning and Applications, Date of Conference, Detroit, MI, USA, 3–6 December 2014; pp. 356–361. [Google Scholar]
- Tua, F.M.; Sunindyo, W.D. Software Defect Prediction Using Software Metrics with Naïve Bayes and Rule Mining Association Methods. In Proceedings of the 2019 5th International Conference on Science and Technology (ICST), Yogyakarta, Indonesia, 30–31 July 2019; pp. 1–5. [Google Scholar]
- Hassan, F.; Farhan, S.; Fahiem, M.A.; Tauseef, H. A Review on Machine Learning Techniques for Software Defect Prediction. Tech. J. 2018, 23, 63–71. [Google Scholar]
- Akimova, E.N.; Bersenev, A.Y.; Deikov, A.A.; Kobylkin, K.S.; Konygin, A.V.; Mezentsev, I.P.; Misilov, V.E. A Survey on Software Defect Prediction Using Deep Learning. Mathematics 2021, 9, 1180. [Google Scholar] [CrossRef]
- Faseeha, M.; Taher, M.; Nasser, T.; Shabib, A.; Munir, A.; Muhhammad, A.; Sagheer, A.; Tariq, R. Software Defect Prediction Using Ensemble Learning: A Systematic Literature Review. IEEE Access 2021, 9, 98754–98771. [Google Scholar] [CrossRef]
- Promise Software Engineering Repository. Available online: http://promise.site.uottawa.ca/SERepository/datasets-page.htm (accessed on 20 October 2021).
Figure 1.
Proposed Method.
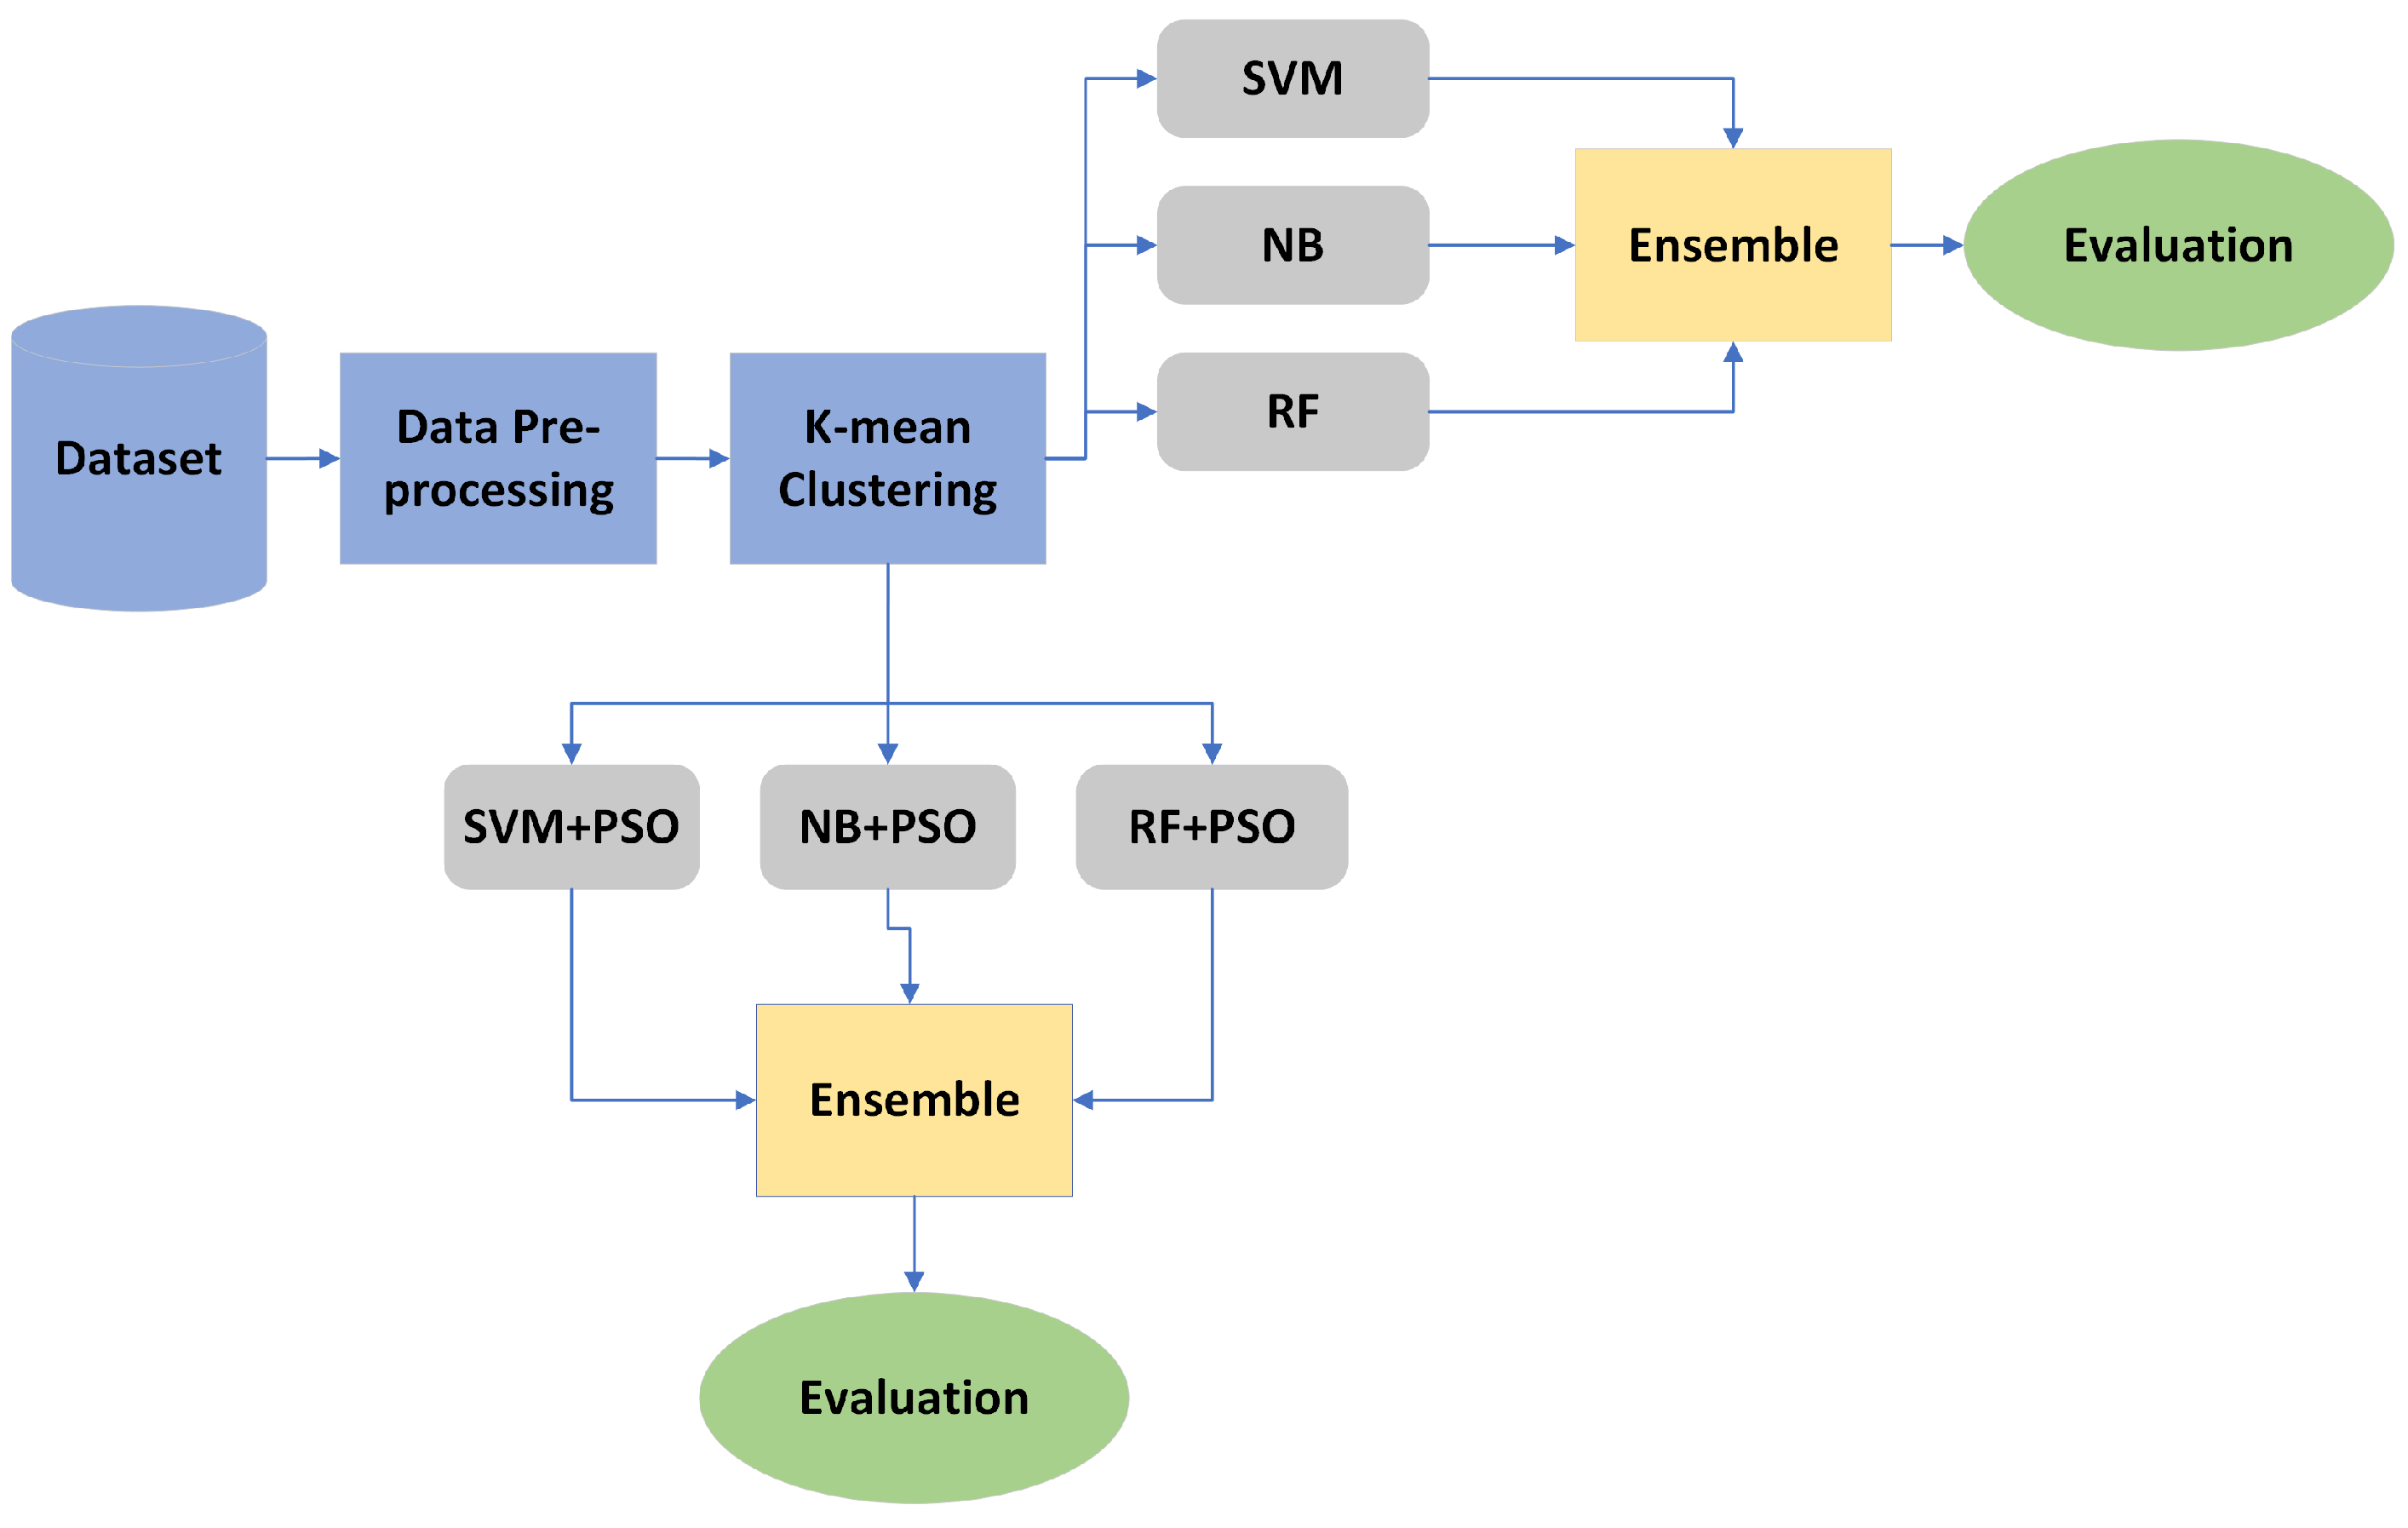
Figure 2.
Features correlation.
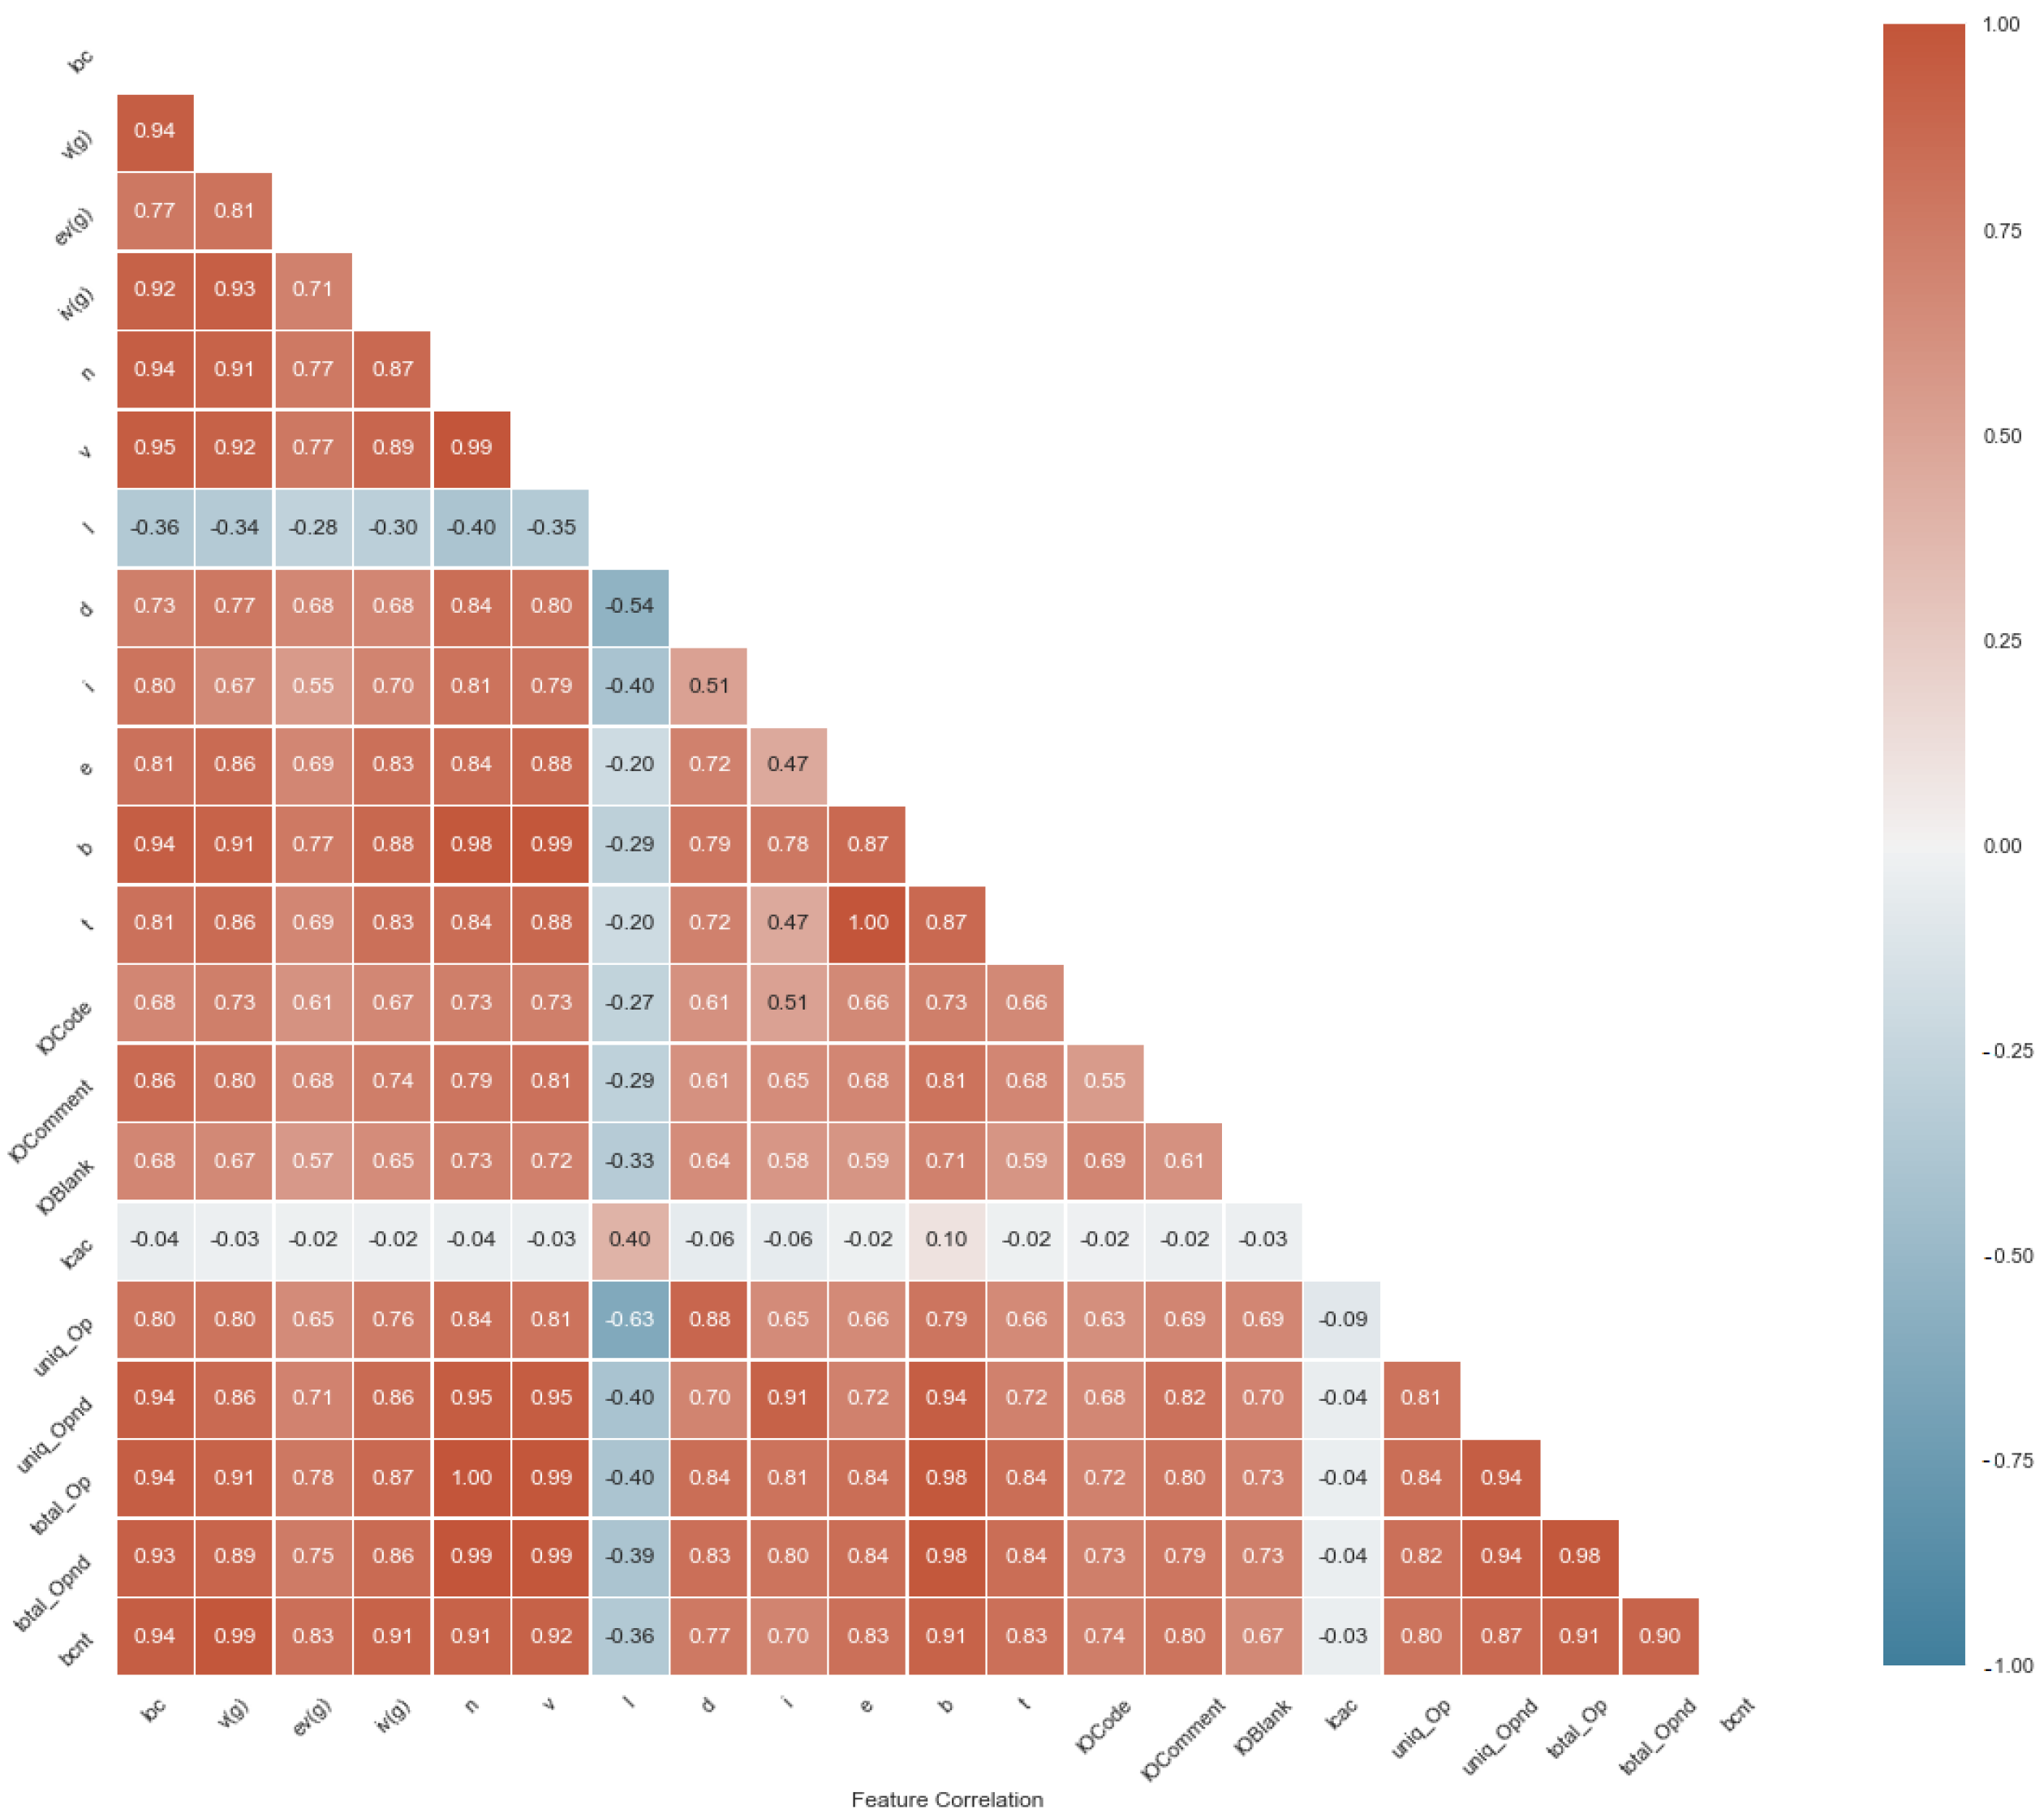
Figure 3.
Relationship of inertia with cluster.

Figure 4.
Evaluation metrics of all models without optimization.
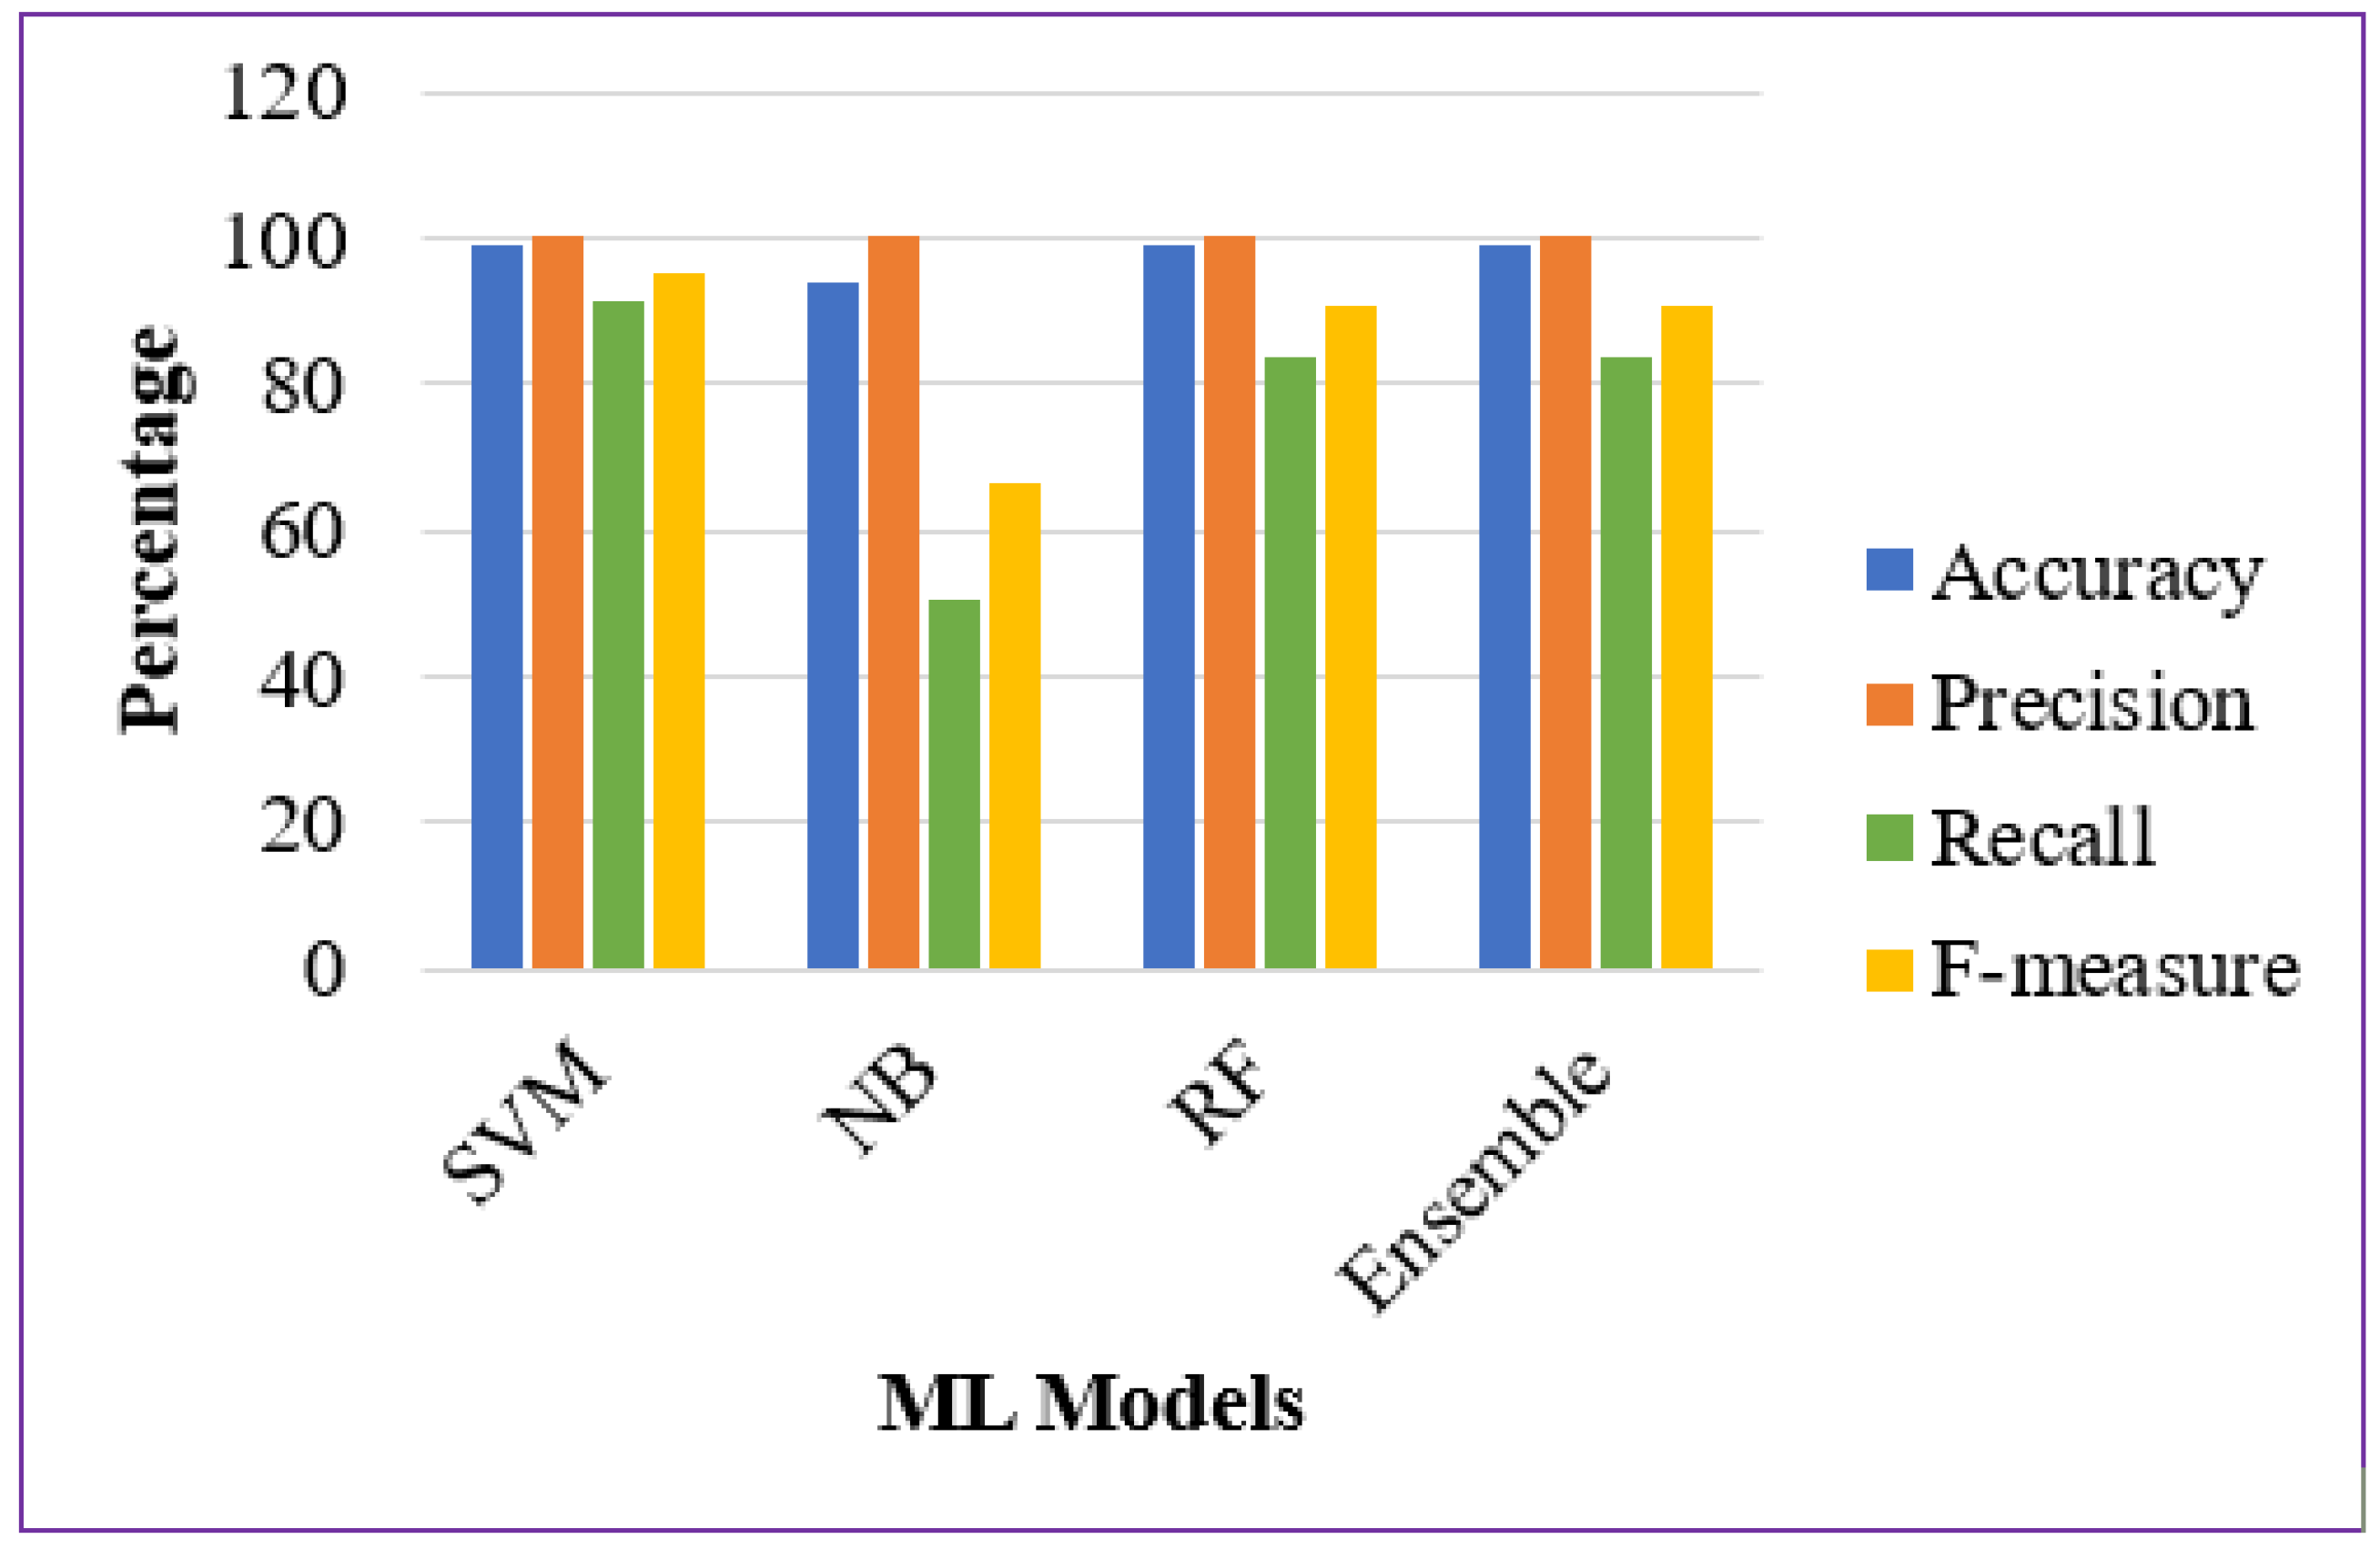
Figure 5.
Evaluation metrics of all models with optimization.
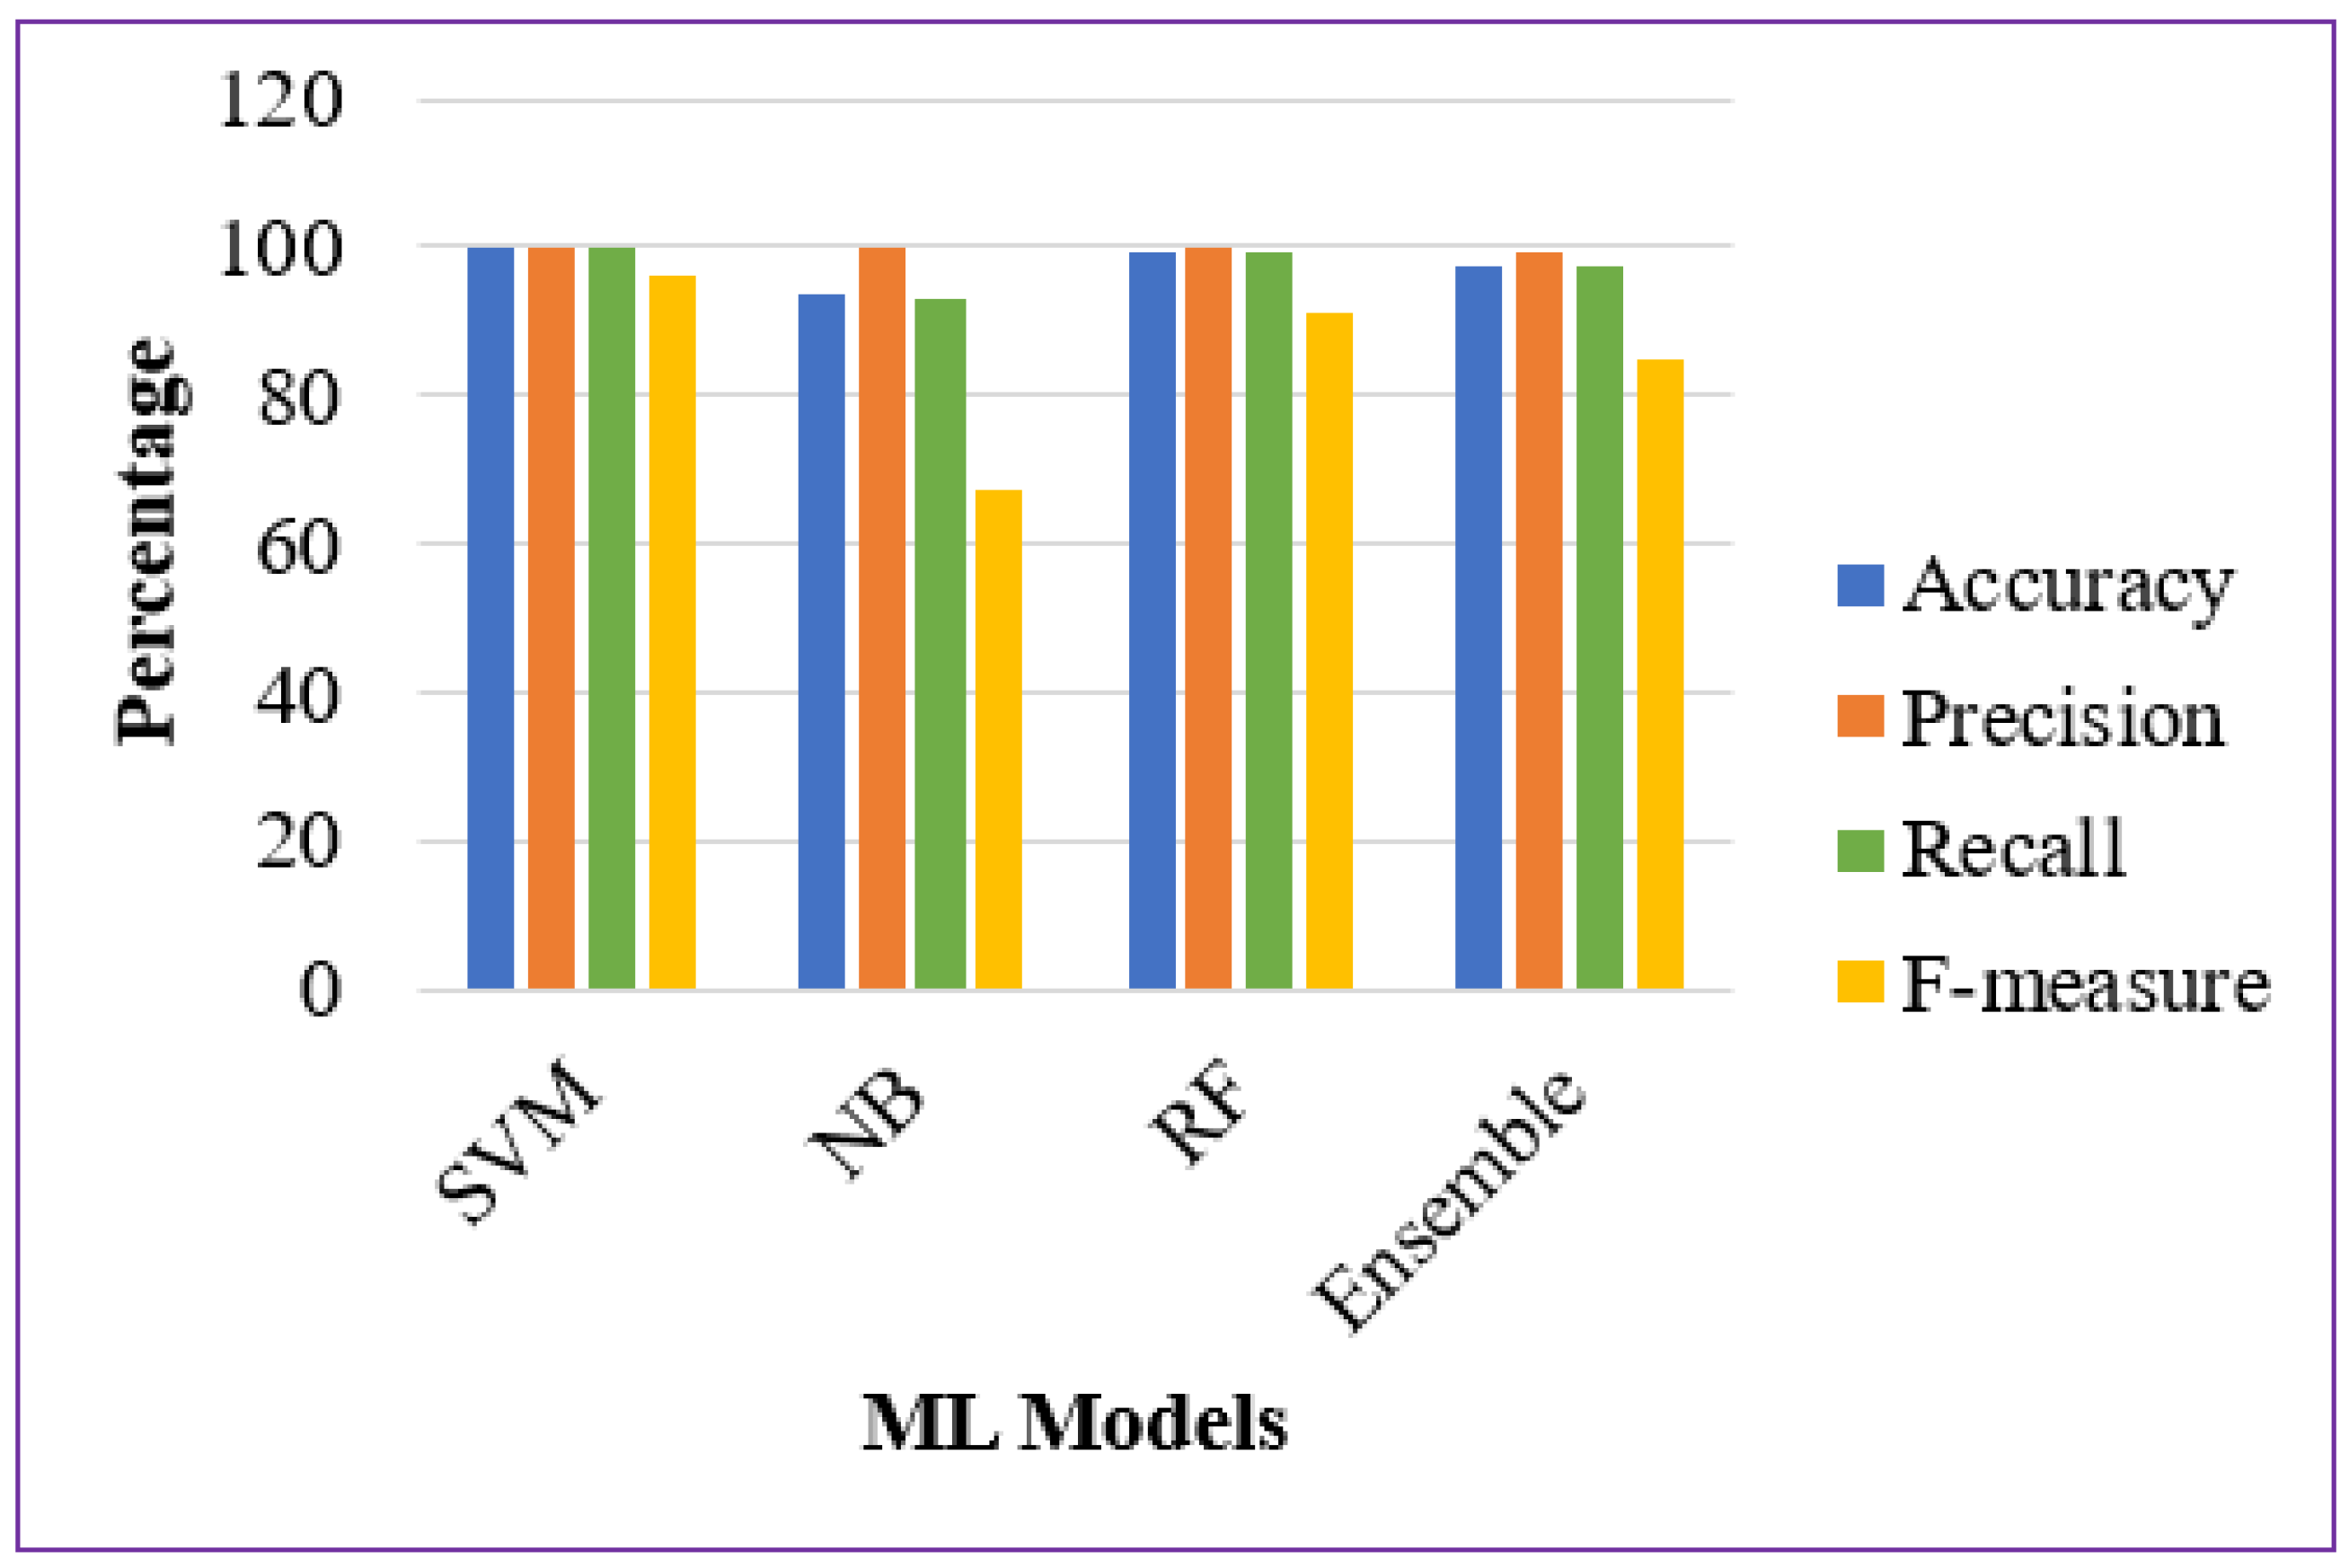
Figure 6.
Error Evaluation Metrics of all Models without Optimization.
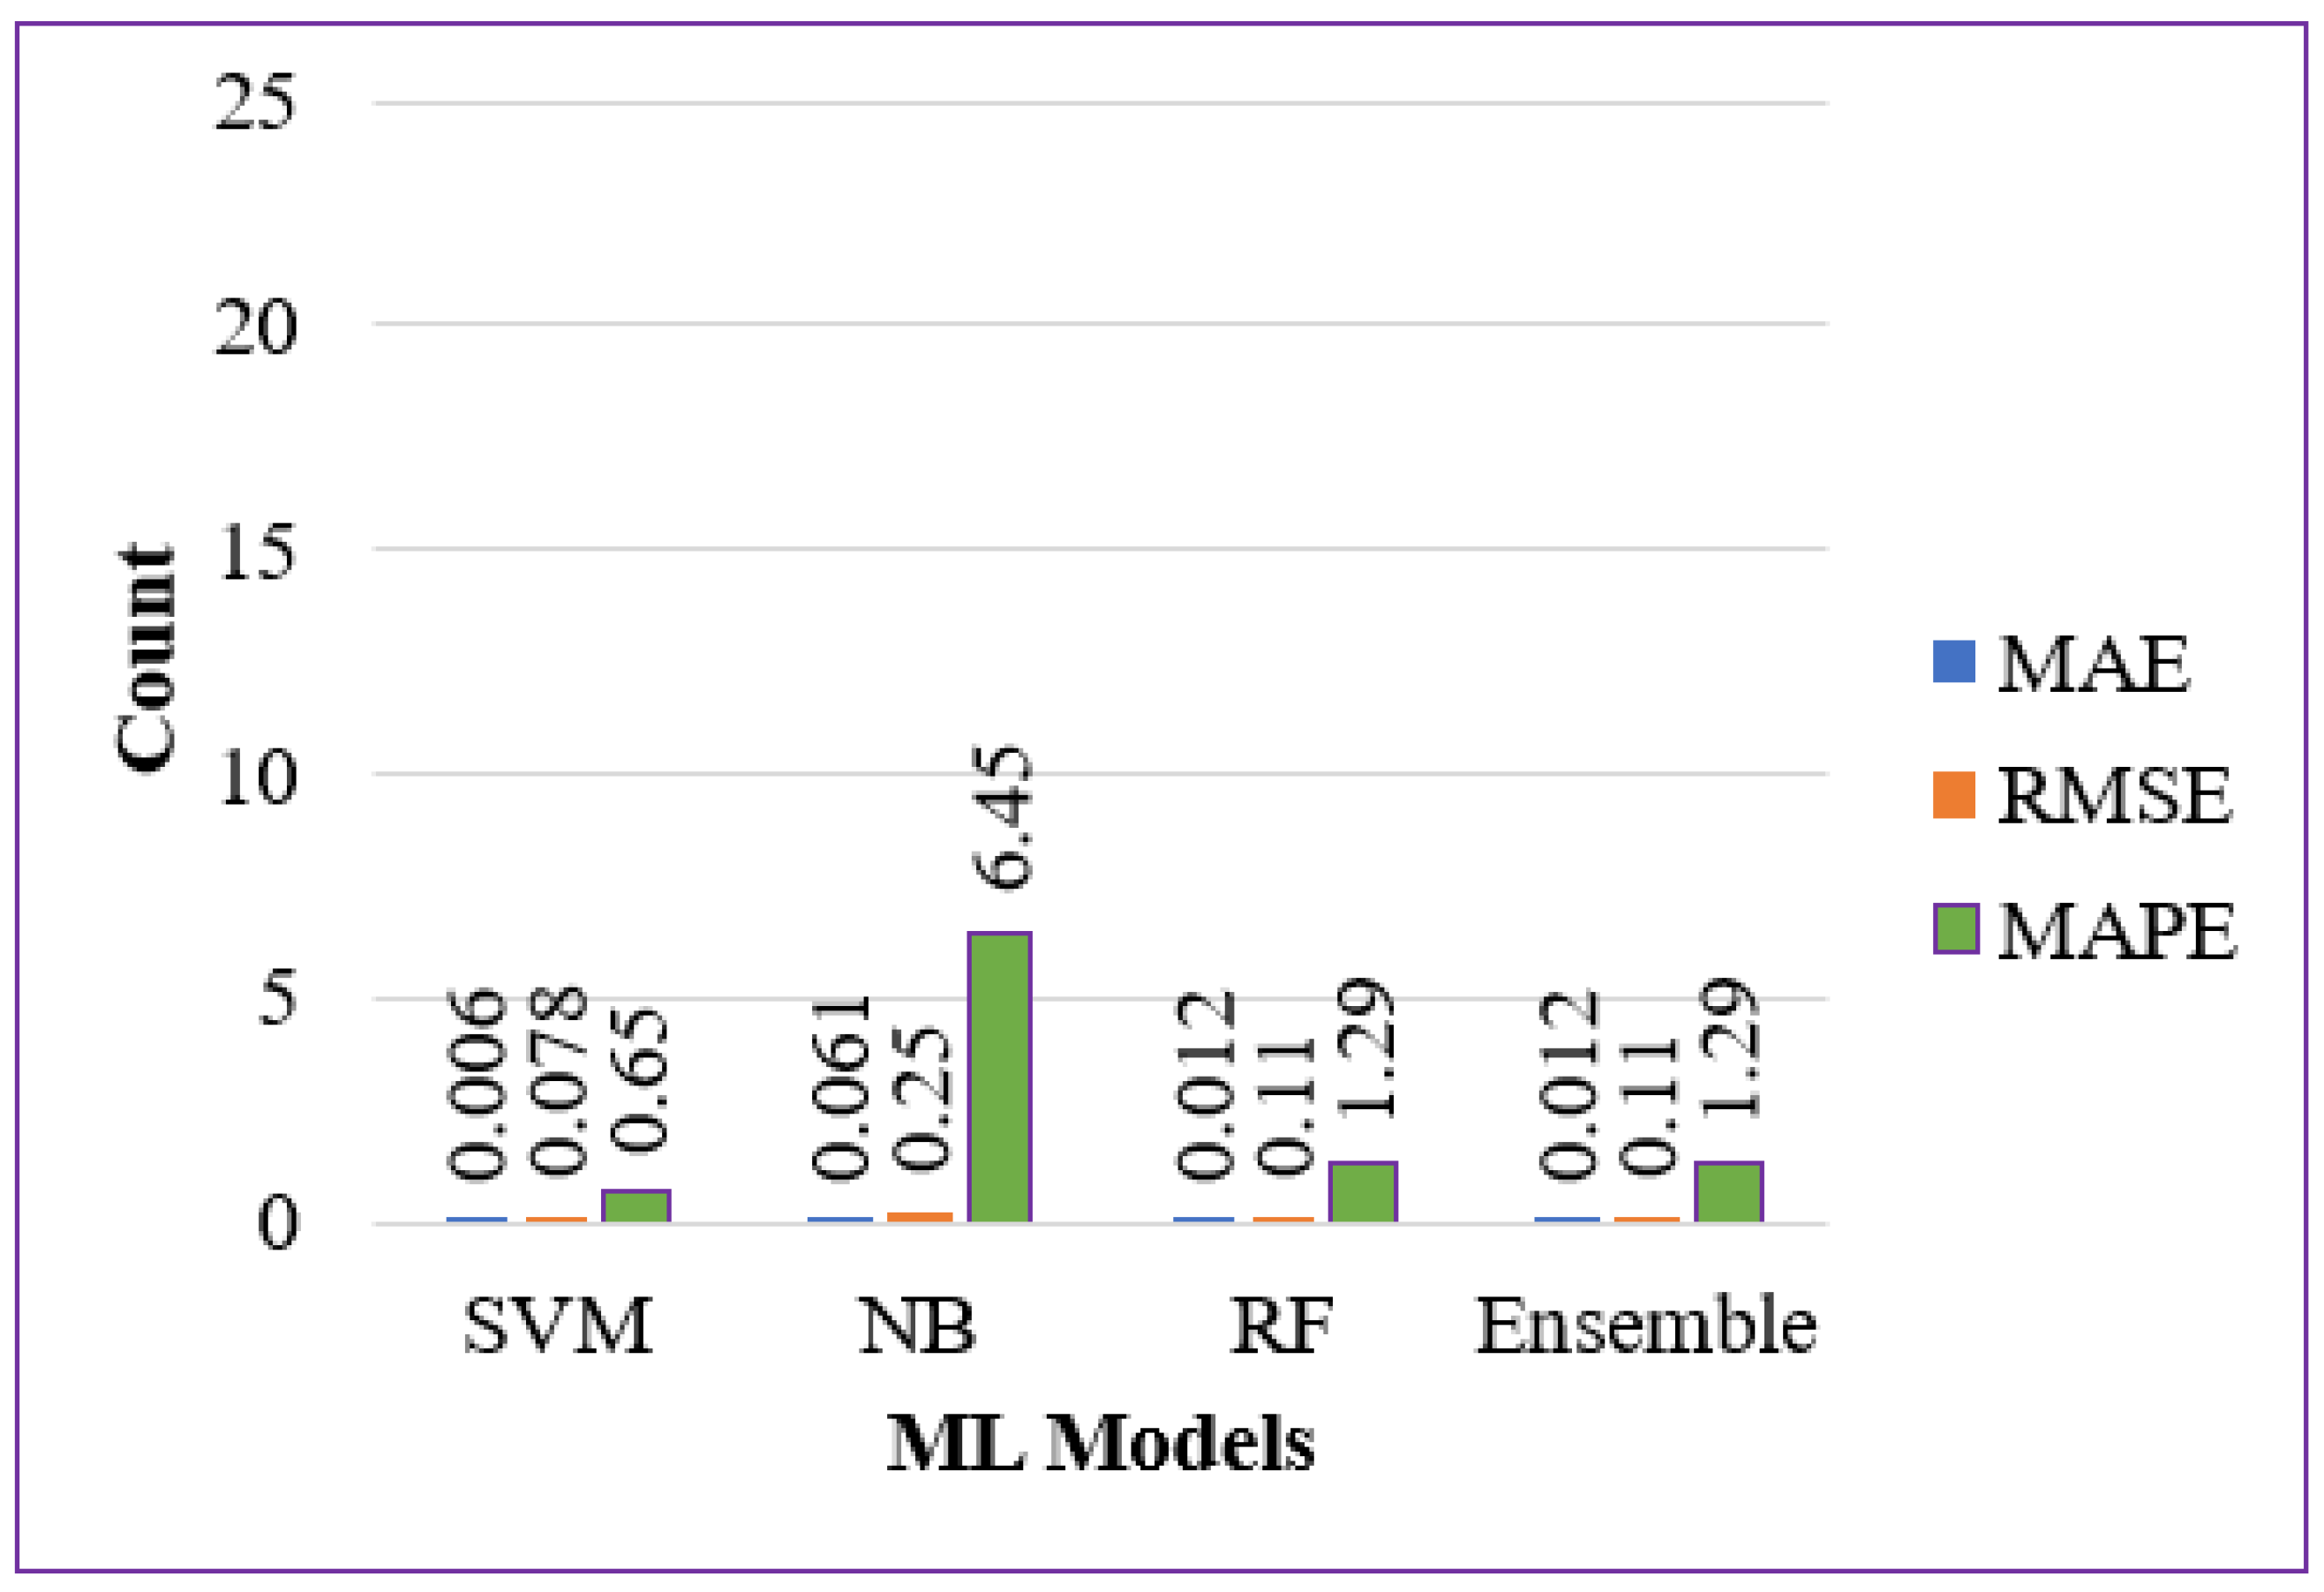
Figure 7.
Error Evaluation Metrics of all Models with Optimization.
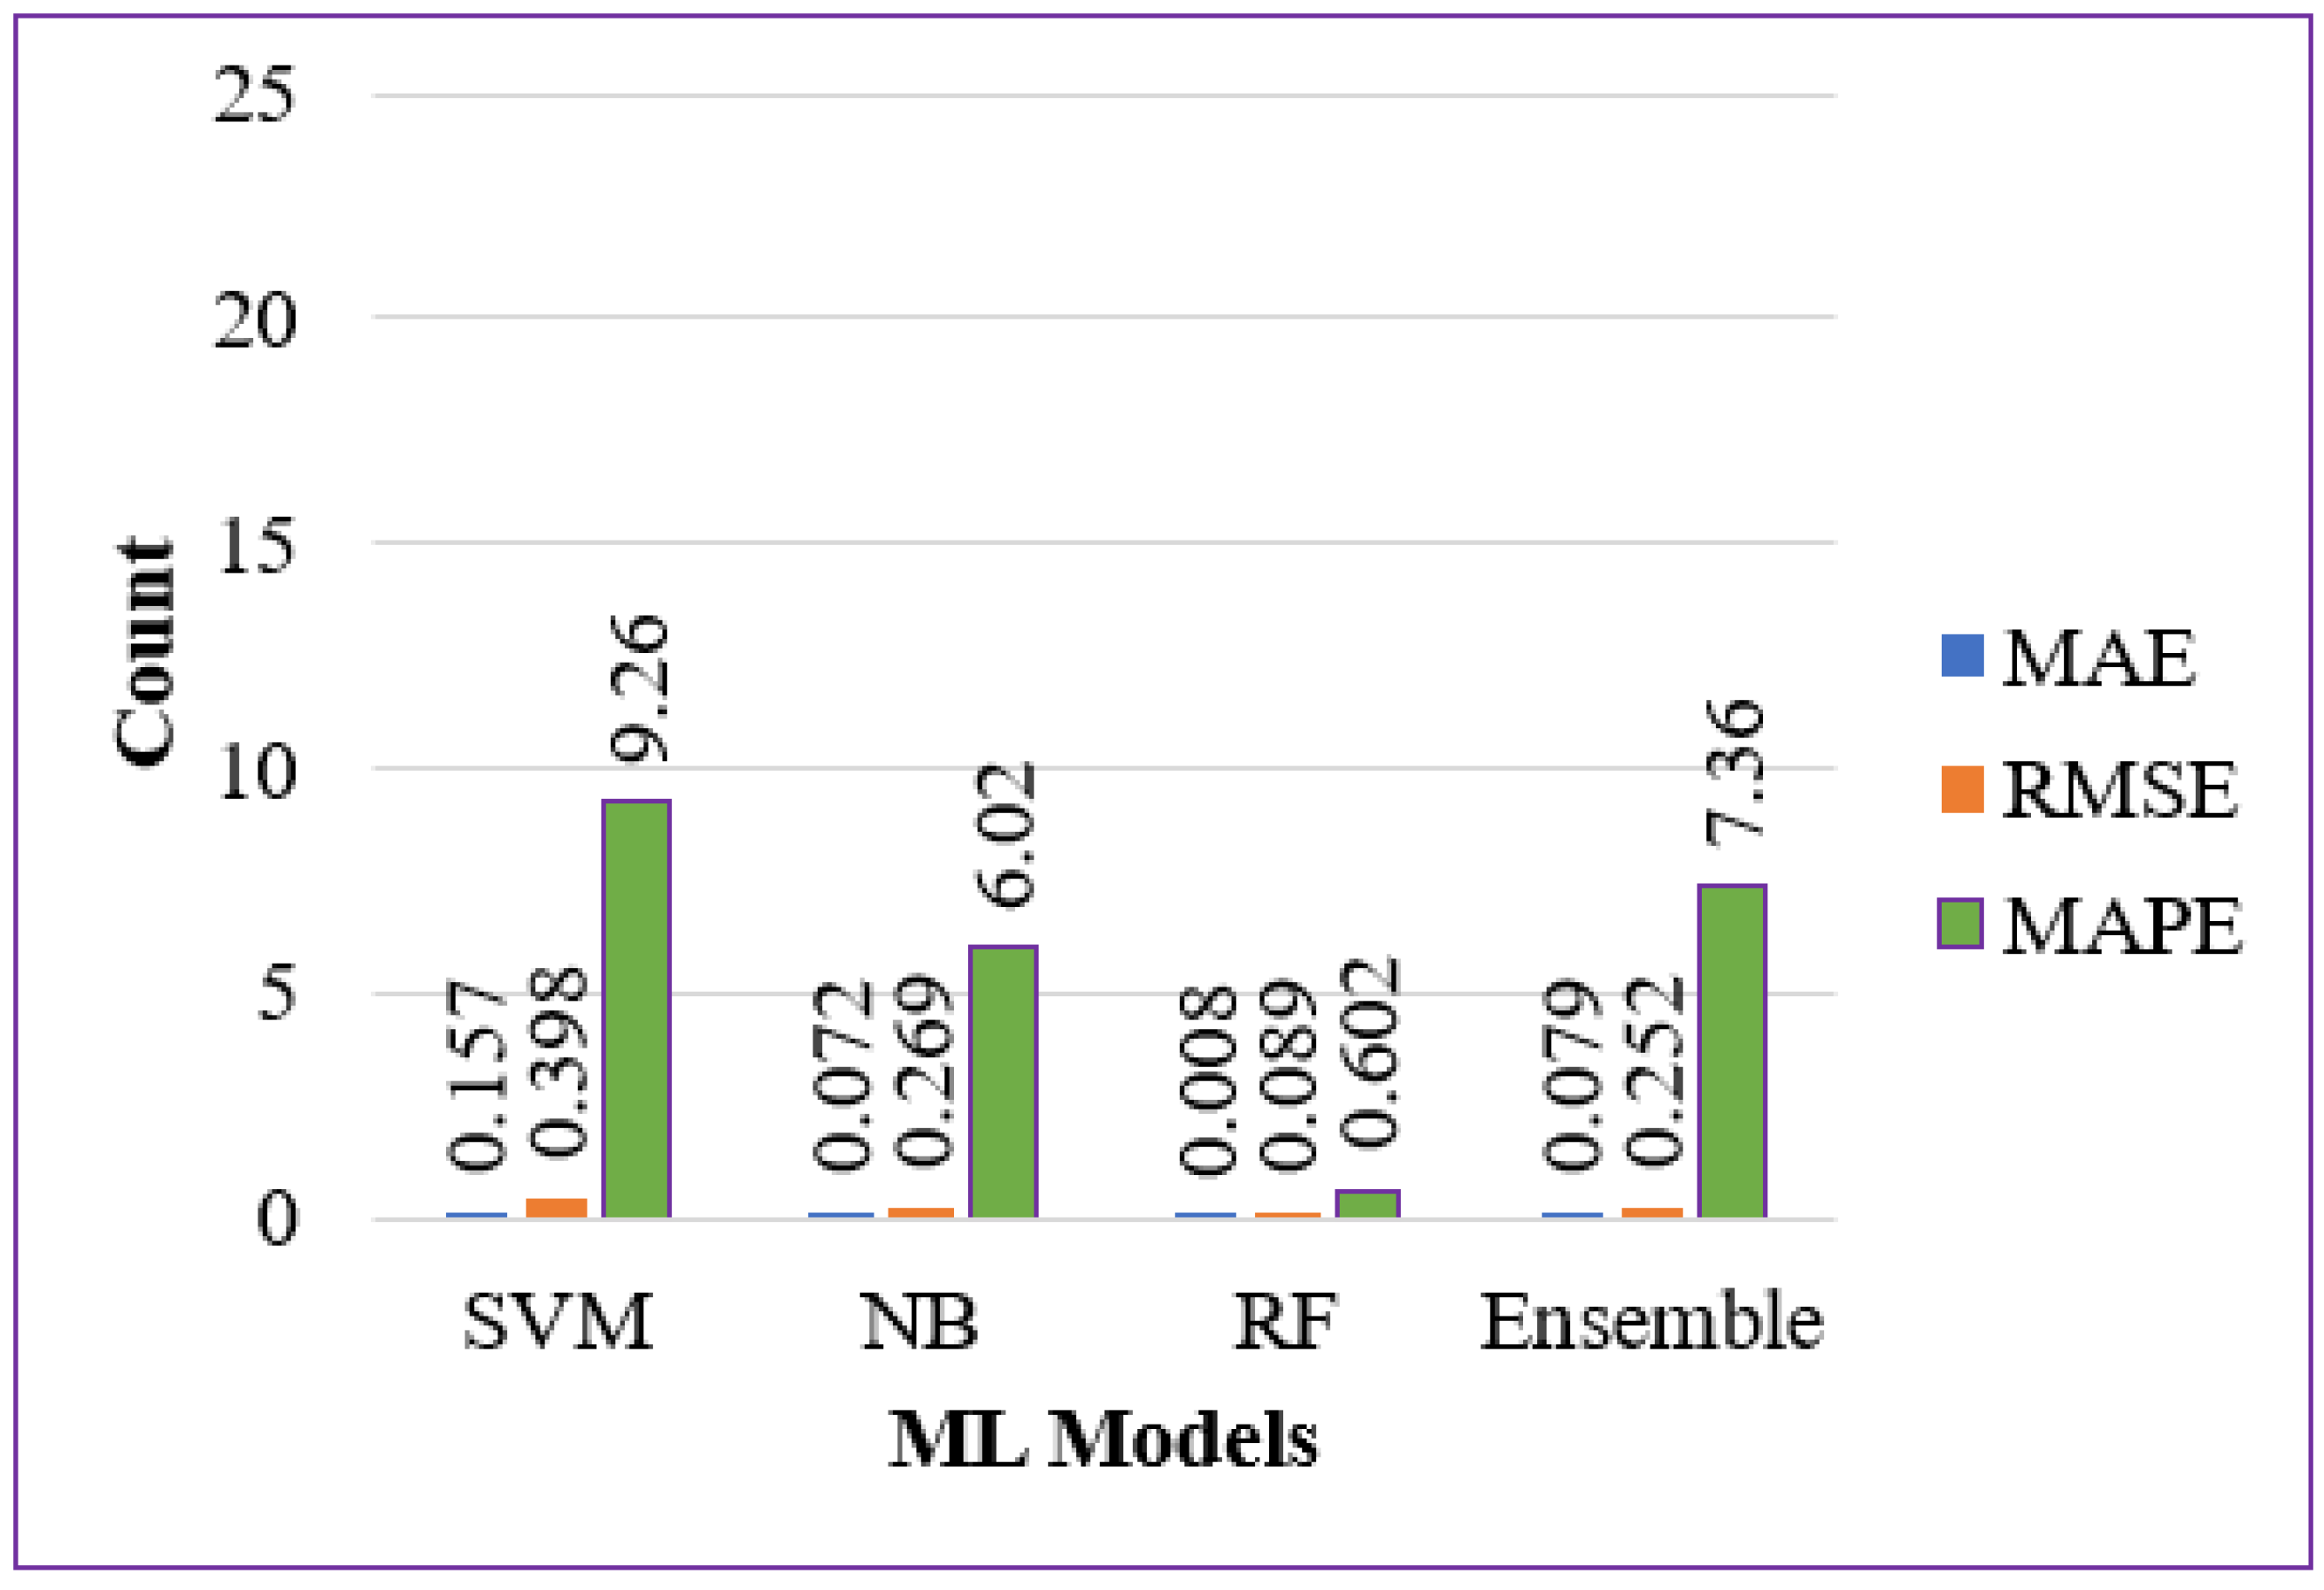
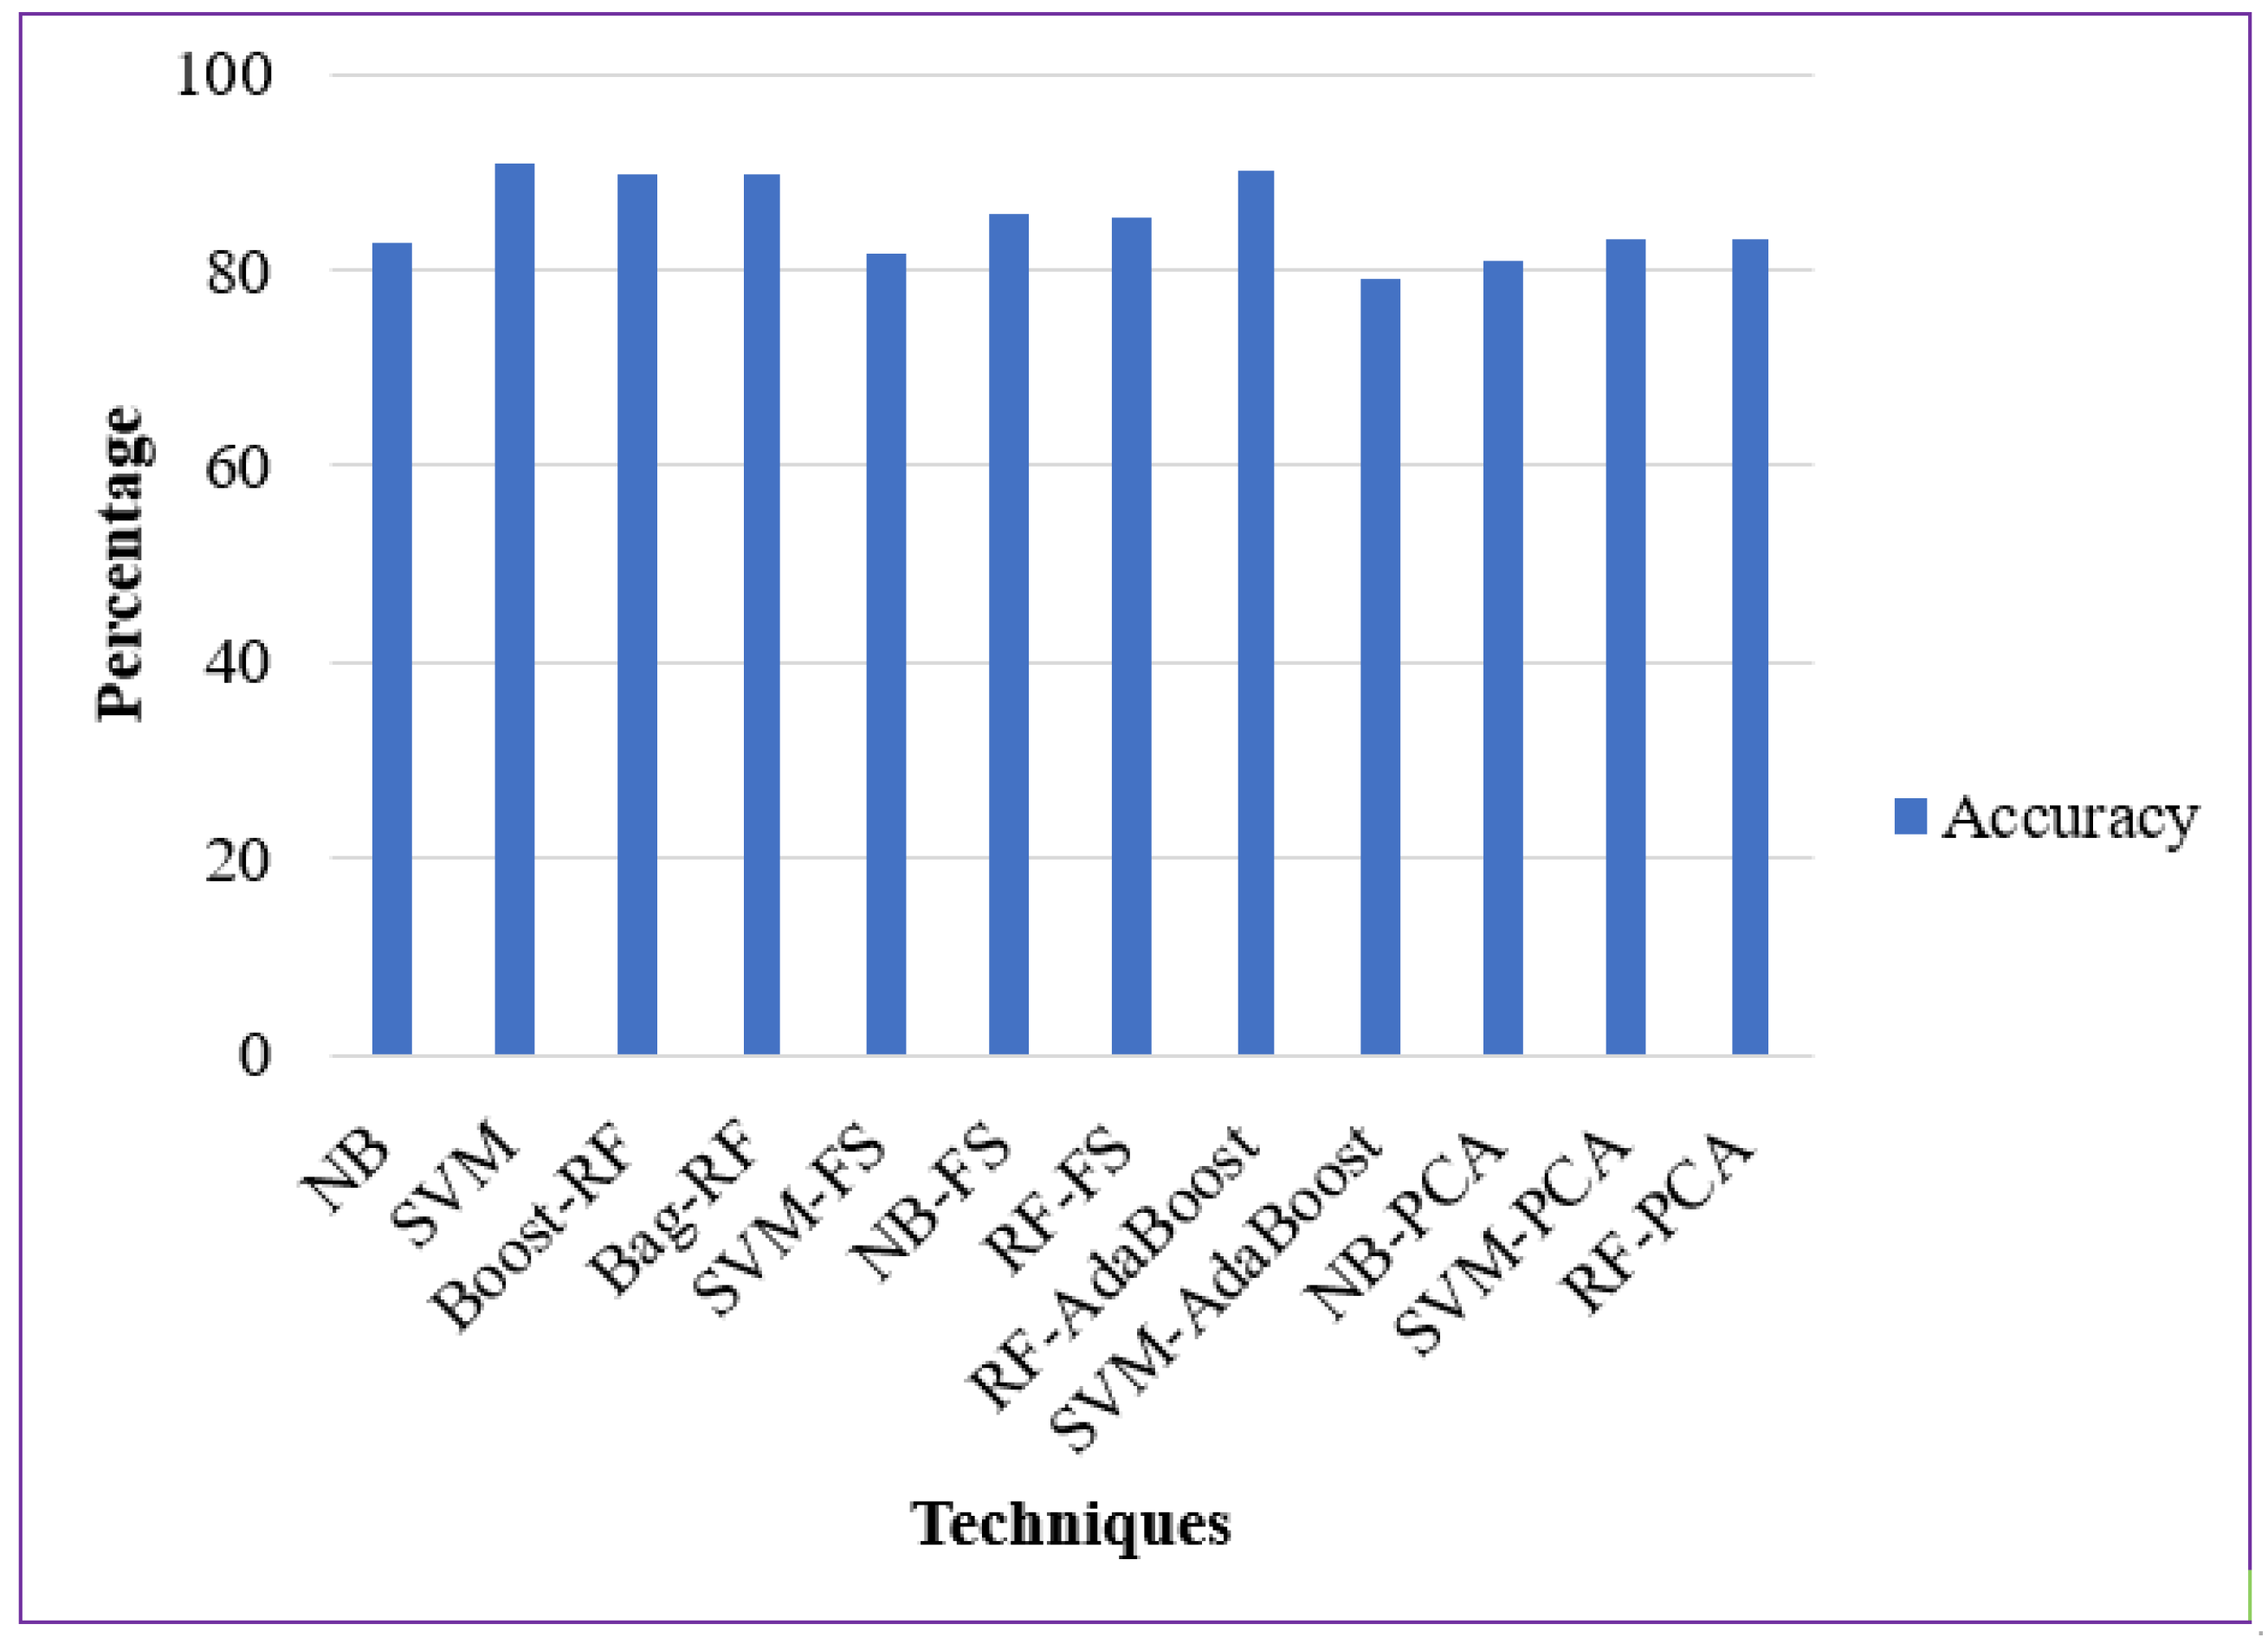
Figure 9.
Analyzed model accuracy with FS and clustering.

Table 1.
Dataset parameteres.
| Title | Language | Source Code | Modules | Features | Defective | Defect-Free | Defect Rate |
|---|---|---|---|---|---|---|---|
| CM1 | C | NASA Spacecraft Instrument | 498 | 22 | 49 | 449 | 9.83% |
Table 2.
Dataset attributes description.
| Dataset | ||
|---|---|---|
| McCabe Metrics | Loc | Line count of code |
| v(g) | Cyclomatic complexity | |
| ev(g) | Essential complexity | |
| iv(g) | Design complexity | |
| Halstead Metrics | N | Total operators + operands |
| V | Volume | |
| L | Program length | |
| D | Difficulty | |
| I | Intelligence | |
| E | Effort to write program | |
| B | Delivered bugs | |
| T | Time estimator | |
| IOCode | Line count of code | |
| IOComment | Count of lines of comments | |
| IOBlank | Count of blank lines | |
| IOCodeAndComment | Lines of code and comments | |
| Other Metrics | uniqOp | Unique operators |
| uniqOpnd | Unique operands | |
| totalOp | Total operators | |
| totalOpnd | Total operands | |
| branchCount | Flow of graph | |
| D | Module has defects or not |
Table 3.
Evaluationmetrics of classifiers without optimization.
| Dataset | Evaluation Measures | SVM | NB | RF | Ensemble |
|---|---|---|---|---|---|
| CM1 | Accuracy | 99 | 93.90 | 98.70 | 98.80 |
| Precision | 100 | 100 | 100 | 100 | |
| Recall | 90.90 | 50 | 82.20 | 82.30 | |
| F-measure | 95.20 | 66.70 | 90.90 | 90.90 |
Table 4.
Evaluation metric of classifiers with optimization.
| Dataset | Evaluation Measures | SVM | NB | RF | Ensemble |
|---|---|---|---|---|---|
| CM1 | Accuracy | 99.80 | 93.80 | 99.50 | 97.60 |
| Precision | 99.70 | 100 | 100 | 99 | |
| Recall | 100 | 92.90 | 99.50 | 97.50 | |
| F-measure | 96 | 67.30 | 91.10 | 84.80 |
Table 5.
Performance error metrics of classifiers without optimization.
| Dataset | Performance Error Metrics | SVM | NB | RF | Ensemble |
|---|---|---|---|---|---|
| CM1 | MAE | 0.006 | 0.061 | 0.012 | 0.012 |
| RMSE | 0.078 | 0.25 | 0.11 | 0.11 | |
| MAPE | 0.65 | 6.45 | 1.29 | 1.29 |
Table 6.
Performance error metrics of classifiers with optimization.
| Dataset | Performance Error Metrics | SVM | NB | RF | Ensemble |
|---|---|---|---|---|---|
| CM1 | MAE | 0.157 | 0.072 | 0.008 | 0.079 |
| RMSE | 0.398 | 0.269 | 0.089 | 0.252 | |
| MAPE | 9.26 | 6.02 | 0.602 | 7.36 |
Table 7.
Statistical analysis of classifiers without optimization.
| Chi-Squared | SVM | NB | RF | Ensemble |
|---|---|---|---|---|
| F-Stat | 0.02964 | 32.736 | 3.549 | 3.45 |
| p-Value | 0.0856 | 0.0041 | 0.0329 | |
| Anova | SVM | NB | RF | Ensemble |
| F-Stat | 18.849 | 2.786 | 0.2987 | 0.2503 |
| p-Value | 0.0085 |
Table 8.
Statisticalanalysis of classifiers with optimization.
| Chi-Squared | SVM | NB | RF | Ensemble |
|---|---|---|---|---|
| F-Stat | 0.2299 | 31.437 | 5.721 | 12.408 |
| p-Value | 2.06E-8 | 0.000245 | ||
| Anova | SVM | NB | RF | Ensemble |
| F-Stat | 12.5958 | 5.503 | 3.432 | 0.87212 |
| p-Value | 0.00041 | 0.0121 | 0.005112 |
Table 9.
Comparison with previous studies in terms of accuracy.
| Dataset | Previous Studies ML Techniques with Research Reference | Accuracy |
|---|---|---|
| CM1 | NB [4] | 82.65 |
| SVM [4] | 90.81 | |
| Boost-RF [21] | 89.79 | |
| Bag-RF [21] | 89.79 | |
| SVM-FS [5] | 81.79 | |
| NB-FS [5] | 85.55 | |
| RF-FS [5] | 85.20 | |
| RF-AdaBoost [28] | 90 | |
| SVM-AdaBoost [28] | 79 | |
| NB-PCA [6] | 81 | |
| SVM-PCA [6] | 83 | |
| RF-PCA [6] | 83 | |
| Analyzed ML Techniques with FS and Clustering | ||
| Dataset | ML Classifiers | Accuracy |
| CM1 | SVM | 99 |
| NB | 93.90 | |
| RF | 98.70 | |
| Stacking | 98.80 | |
| SVM-PSO | 99.80 | |
| NB-PSO | 93.80 | |
| RF-PSO | 99.50 | |
| Stacking | 97.60 | |
Disclaimer/Publisher’s Note: The statements, opinions and data contained in all publications are solely those of the individual author(s) and contributor(s) and not of MDPI and/or the editor(s). MDPI and/or the editor(s) disclaim responsibility for any injury to people or property resulting from any ideas, methods, instructions or products referred to in the content. |
© 2023 by the authors. Licensee MDPI, Basel, Switzerland. This article is an open access article distributed under the terms and conditions of the Creative Commons Attribution (CC BY) license (https://creativecommons.org/licenses/by/4.0/).
Share and Cite
MDPI and ACS Style
Khalid, A.; Badshah, G.; Ayub, N.; Shiraz, M.; Ghouse, M. Software Defect Prediction Analysis Using Machine Learning Techniques. Sustainability 2023, 15, 5517. https://doi.org/10.3390/su15065517
AMA Style
Khalid A, Badshah G, Ayub N, Shiraz M, Ghouse M. Software Defect Prediction Analysis Using Machine Learning Techniques. Sustainability. 2023; 15(6):5517. https://doi.org/10.3390/su15065517
Chicago/Turabian StyleKhalid, Aimen, Gran Badshah, Nasir Ayub, Muhammad Shiraz, and Mohamed Ghouse. 2023. "Software Defect Prediction Analysis Using Machine Learning Techniques" Sustainability 15, no. 6: 5517. https://doi.org/10.3390/su15065517
Note that from the first issue of 2016, this journal uses article numbers instead of page numbers. See further details here.