Article

Optimization of PET Particle-Reinforced Epoxy Resin Composite for Eco-Brick Application Using the Response Surface Methodology

1
Fakulti Kejuruteraan Pembuatan, University Teknikal Malaysia Melaka, Jalan Hang Tuah Jaya Durian Tunggal, Melaka 76100, Malaysia
2
Department of Industrial Engineering, Universitas Ahmad Dahlan, Jalan Jendral Ahmad Yani, Bantul 55166, Indonesia
3
Fakulti Teknologi Kejuruteraan Mekanikal & Pembuatan, University Teknikal Malaysia Melaka, Jalan Hang Tuah Jaya Durian Tunggal, Melaka 76100, Malaysia
4
Department General Education, Faculty of Resilence, Rabdan Academy, Al Dhafeer Street, Abu Dhabi 22401, United Arab Emirates
*
Author to whom correspondence should be addressed.
Sustainability 2023, 15(5), 4271; https://doi.org/10.3390/su15054271
Submission received: 27 January 2023 / Revised: 20 February 2023 / Accepted: 21 February 2023 / Published: 27 February 2023
(This article belongs to the Special Issue Innovative Materials in Sustainable Construction)

Abstract

:
Brick is a common building material that is used in society for constructing buildings. A viable environmental strategy to lessen the amount of plastic waste involves the inclusion of plastic trash in building materials. Globally, there is a severe issue with the disposal of plastic garbage in landfills. The primary and secondary carbon bonds that are formed in plastic packaging wastes can severely contaminate the environment. Hence, managing plastic waste to generate new and useful items is essential. One of the most practical ways to safeguard the environment is to manufacture eco-bricks from PET waste and epoxy resin. Additionally, as there is no combustion involved in the production of this eco-brick; it does not harm the environment. Eco-brick can be defined as a novel concept and approach to waste management and recycling. Eco-bricks have many advantages, such as easy availability and being environmentally friendly. This study aimed to improve the composition of the eco-brick using a mixture of epoxy resin and PET particles. In this study, a mathematical modelling technique called the Response Surface Method (RSM) was designed using the Central Composite Design (CCD). Variable input factors were used to develop eco-bricks such as mixture ratio (10–90%), particle size (1–5 mm), and drying time (1–7 days), whereas the variable response included the compressive strength. The complete experimental design was developed using Design Expert 11 software, and simulation experiments with 17 sets of parameters were generated. The microstructural characteristics of the eco-brick were examined using SEM. The results of the experiments indicated that the most optimised parameters that could be used for eco-brick application were: a PET particle size of 1.1 mm, a mixing ratio of 89.9%, and a curing time of 6.9 days. Earlier research that was conducted regarding the production of eco-bricks using a PET particle and epoxy resin mixture showed that these materials had a high potential to boost compressive strength. The quadratic model was used as the basis for the regression analysis for generating the response equations. Since the difference between the experimental and anticipated values was less than 5%, it was concluded that the results of the experimental and predictive tests showed good agreement. The model used in this study yielded noteworthy outcomes. As a result, the suggested statistical model can offer a clear understanding of designing experiments and variables that affect the production of eco-brick using a blend of PET particles and epoxy resin.

1. Introduction

The construction industry can effectively improve the circular economy by using sustainable techniques for recycling waste [1]. It has been reported that as urban regions and developing countries lack proper garbage collection and disposal infrastructure, they are often plagued with issues regarding solid waste generation. As a result, open dumping techniques are employed for waste disposal. Environmental issues have persisted because actions taken to safeguard the environment must be balanced against the loss of natural resources and growing waste production. Consequently, to address this problem measures for balancing human demands with environmental effects must be considered. This can be used as a strategy for long-term development.
The use of bricks dates to the earliest civilisations. Bricks are one of the most used building construction materials [2]. Most bricks are created by combining appropriate quantities of clay and sand with a binder [1]. Brick is frequently and extensively used in construction. A proper mixture of concrete and stone could be used in the construction sector. The construction brick goods market has, regrettably, reached its saturation point in the last 20 years [3]. Due to the use of waste as an additional material in brick production, the brick manufacturing business can diversify its product line.
Permeable bricks are a method of promoting the ideas of green ecology and energy conservation. This permeable brick has a few benefits, such as a reduction in the heat effect, noise absorption, and improved anti-skid performance [4]. Permeable bricks can be developed by adding plastic waste. Permeable bricks are considered to be more eco-friendly as they utilise plastic waste [2]. Permeable bricks are regarded as an efficient technique to use eco-, energy-friendly, and green principles in the field of construction. Permeability offers many benefits such as heat reduction, noise reduction, and anti-skid properties [3]. Permeability is increased by adding more plastic trash to bricks, making them more environmentally friendly [5]. The current increase in plastic usage will put enormous pressure on the environment and society. Population expansion can also increase the generation of plastic waste. More than 8.3 billion tonnes of plastic have been produced since 1950, and >60% of this debris is currently being disposed of in landfills [4].
Plastics are utilised for everyday packaging because they are inexpensive and display many attractive properties [6]. Since plastics are made of chemical polymers that are not biodegradable, they cannot decompose in the ground. Synthetic polymers such as polyamide, polystyrene, polyethylene, polyvinyl chloride, polyethylene terephthalate, and polypropylene are frequently used in the production of plastic packaging materials [7]. The discarded polymers, resulting from plastic usage, are considered the major constituent of solid waste and negatively affect the environment due to their non-biodegradability. The primary and secondary carbon bonds that constitute the plastic structure lead to environmental contamination [8]. Therefore, it is essential to manage plastic waste and transform it into useful items.
Recycling is an important technique that helps to decrease plastic waste in local communities. Waste materials can be recycled to produce effective items [9]. It is possible to treat inorganic waste to produce some items such as plastic flowers, bags, wallets, and other creative supplies [10]. Plastic products can be used for handicraft production, whereas different plastic compositions can be utilised to create pavement blocks, eco-bricks, road-building materials, and asphalt [9,10,11,12]. Techniques for waste recycling can be used to minimise, prevent, and reuse garbage. Recycling is the process of adding economic, social, and environmental value to waste. Plastic residue can be used to reinforce granular pavement construction materials, and it also displays better deformation characteristics, which should be evaluated before constructing subbase layers or pavements [13]. Currently, alternative materials are required when wastes are used in the construction sector for building purposes. Therefore, recycling plastic waste in building construction projects can greatly aid in accomplishing this goal. Recycling plastic waste can also be used as a substitute in the building and construction sector [14]. Recycling plastic trash can be used in product design to promote sustainability [7].
Plastic wastes are used for creating mixtures for producing bricks. Brick preparation combinations can be made using plastic waste. The most popular polymers used in the production of bricks include HDPE, PET, and LDPE [8,15]. Discarded plastic waste can be used as a binder material during the brick-making process. Bricks made from discarded plastic display better compressive and durability properties [8,16]. The results from porosity evaluation showed that the addition of PET showed a better porosity for the resulting product compared with LDPE and HDPE addition since PET displayed a higher Melt Flow Rate (MFR) [10].
According to Aneke and Shabungu, plastic waste can be used for reinforcing masonry bricks [17]. However, clay is still used as the primary component of the mixture, necessitating the use of the combustion process. Aneke and Shabungu produced several bricks using melted PET plastic waste and crushed glass [18]. In this study, the researchers combined the melted PET plastic wastes and crushed glass materials, which improved the burning process during the brick-making process. Ghita et al. also investigated the use of olive pomace bottom ash combined with clay to produce eco-bricks in Boukili’s research [19]. The drying process was then completed by burning in a kiln. These studies showed that the combustion process must be used for drying the bricks that are developed.
Industries and society are currently working to develop environmentally friendly bricks. Waste materials ranging from plastic to organic waste have been used to create bricks. Since 2015, there has been an increase in the production of eco-friendly bricks [20]. In the past, Edike (2021) [11] and Ariyani (2021) [9] used PET bottle waste to produce bricks. Clay is poured into the PET bottles, which are subsequently assembled into structures [9,11]. Since eco-bricks are made from plastic waste or leftover materials in the environment, this brick model has the benefit of being completely free. However, the bricks made from PET bottles show one disadvantage, i.e., they are more prone to fire. De Silva (2021) [21] investigated the eco-bricks that contained PET bottles and tiny fragments of plastic. Furthermore, the lack of a binder between the plastic components in PET-filled bricks is another disadvantage. In a different study, Bahij (2020) [12] investigated the use of glue as a reinforcement material in the production of eco-bricks. A few adhesives, such as clay, cement, and epoxy resin can also be used [12]. Clay and cement, which are used to make bricks, have several problems, including the fact that they are readily fractured by the weather, which can compromise the structural integrity of a building [22,23,24,25,26]. Polymers are among the materials that could be utilised as adhesives. The mechanical characteristics of these brick-building materials can be enhanced by polymer materials [27]. Composites are frequently produced using thermosetting polymers as metric materials. The material’s microstructure, which includes pores, will also affect its thermal insulation properties. Polymers are materials that do not effectively conduct heat and can be combined with other materials to develop materials with a tight pore structure, which cannot absorb water easily [13]. Epoxy resin is a polymeric material that is used for manufacturing composite materials.
Epoxy resins play a crucial function in composite materials. Petroleum-based epoxy monomers exhibit outstanding stiffness, high tensile strength, and appropriate electrical strength. Epoxy resins are widely employed in the construction, aerospace, and automotive industries. The resin has a wide range of applications due to its outstanding wettability, high mechanical strength, acceptable dimensional stability, flame retardant characteristics, minimal drying shrinkage, and appropriate chemical resistance [28]. Epoxy resins can be made from synthetic and natural elements, display high adhesive properties, and are used to bind materials such as wood, compost, copper, iron, cement, steel, and plastics [29].
Epoxy resin is used as an adhesive for binding bricks. Furthermore, it partially substitutes the binding materials using PET-waste-based glycolates. Guo et al. studied the aqueous epoxy resins that could be used for refining during the Portland cement manufacturing process [30]. Research suggests that epoxy resin was produced using leftover PET bottles. Based on the results of different tests, the strength of Portland cement increases when it is combined with epoxy resin.
The RSM methodology has been extensively employed in the design of experiments (DoE) as it shows a high accuracy while creating mathematical models. This technique helps in attaining optimal performance and offers affordable mixed-design solutions [31]. By characterising the response surface of the factor variable, RSM is regarded as a popular technique to select a better response from the response surface to optimise experimental parameters. RSM is an experimental design technique that uses statistical and mathematical principles to evaluate and model multivariate problems to produce the desired response and results [21]. RSM procedures include experimental planning, developing mathematical models, identifying experimental characteristics, and identifying the important variables.
Recycling of PET plastic wastes made from used plastic bottles is a major concern in this study. Here, the researchers used epoxy resin as an adhesive agent and PET as a filler to produce eco-bricks. The actual experiments were carried out using the RSM methodology, and experimental results were used to validate the mathematical model. In this work, the effects of particle size, ratio, and curing time—three important parameters of compressive strength—were examined using the RSM method. Bricks made from plastic blends do not need to be burned, which reduces greenhouse gas emissions. The construction material necessary for small constructions can be substituted using plastic trash [14].

2. Materials and Methods

2.1. Epoxy Resin Materials

In this study, the researchers used epoxy resin, i.e., bisphenol diglycidyl ether (E-44 and E-51), which was synthesised using bisphenol A (DPP) and epichlorohydrin (ECH). The DPP structure also delivers excellent strength, toughness, and thermal properties. In comparison with hydrogenated bisphenol A, epoxy resin shows a higher weather tolerance, higher durability, and reduces general costs. Additionally, its hardness qualities satisfy the mechanical requirements for pavements, especially when one considers the heat-based surface cracks. The physicochemical properties of epoxy resin are listed in Table 1.

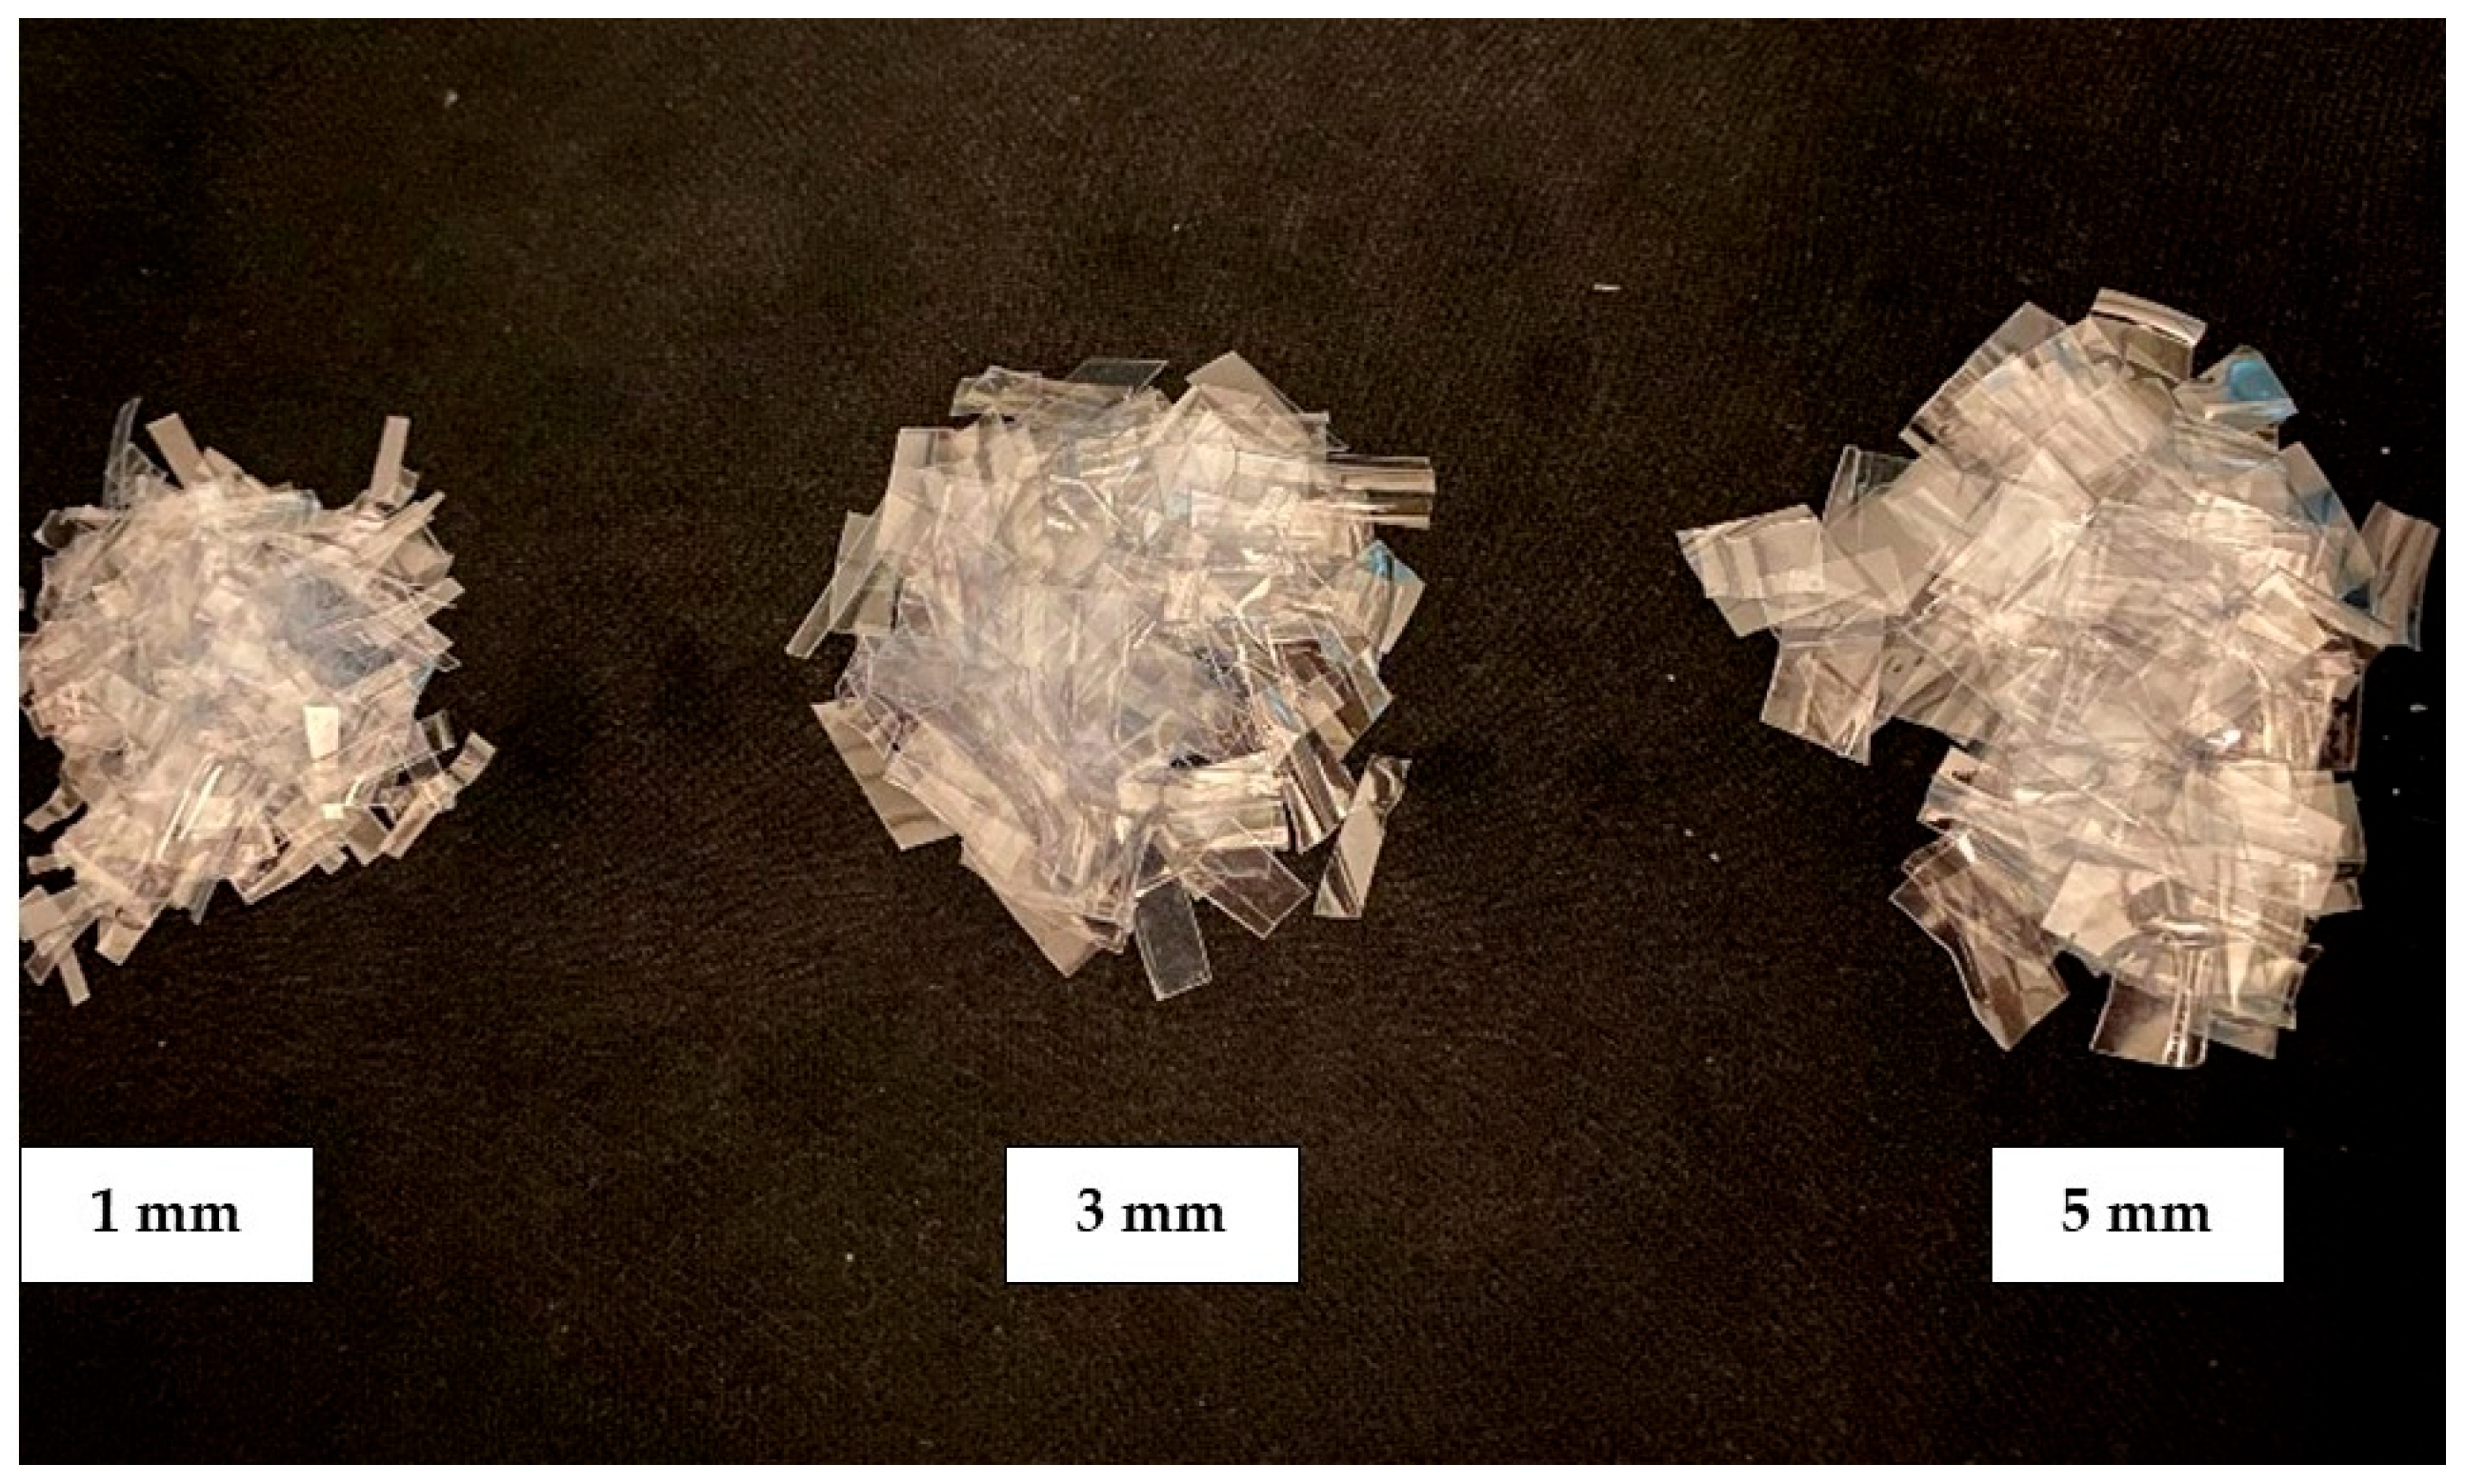
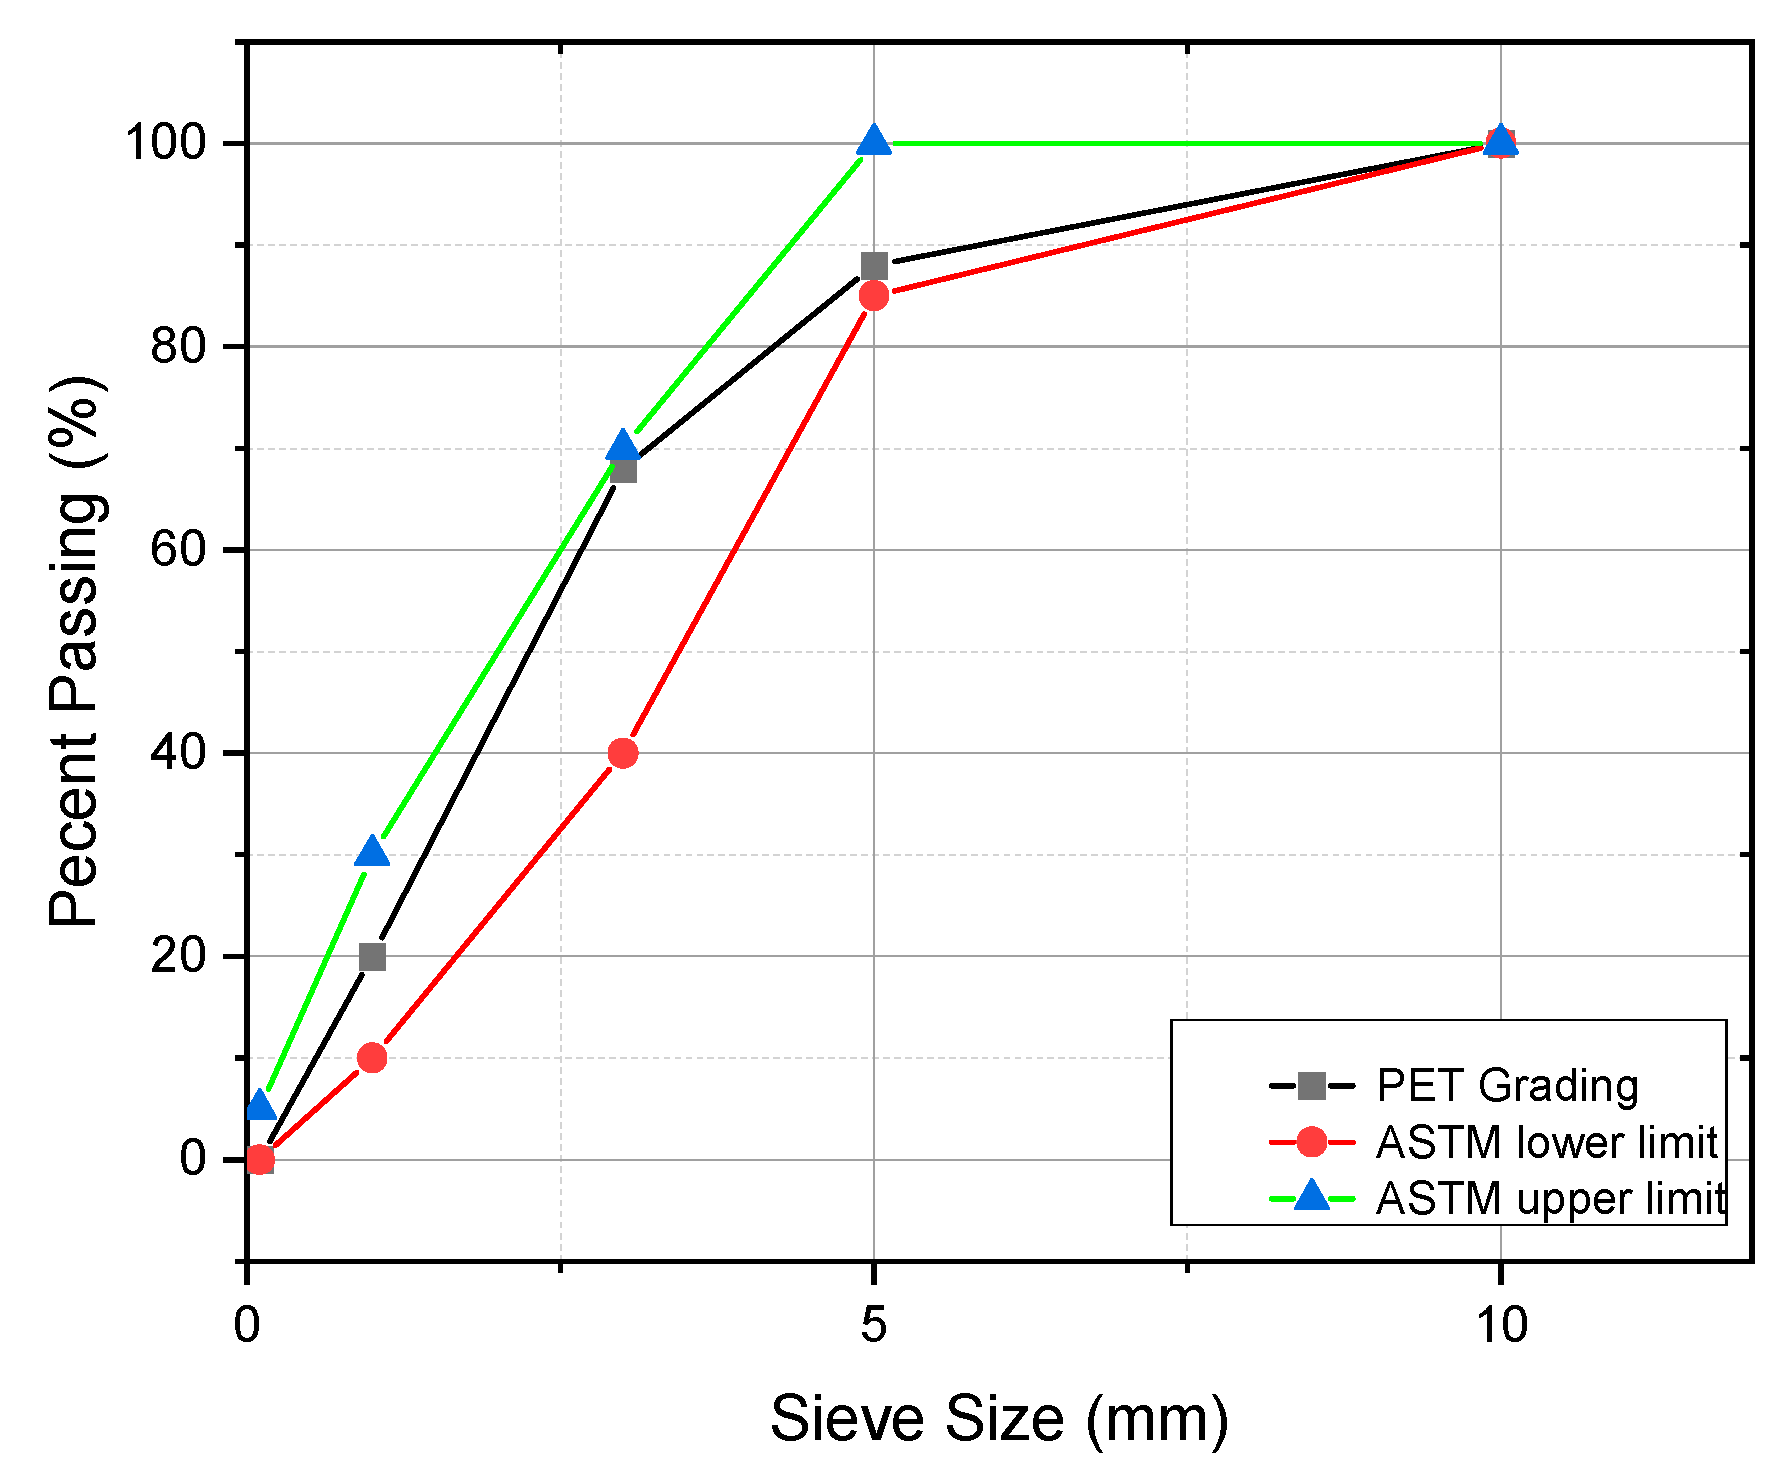
2.2. PET Recycled Aggregates

The PET material used in this study was acquired from a waste bank in Yogyakarta. The material in the waste bank in Yogyakarta is PET bottle waste. Table 2 displays the physical and mechanical properties of PET. As shown in Figure 1, PET plastic was classified into different sets based on their particle size. The sizes of the PET pellets ranged between 1 mm (small) and 5 mm (big). To remove any surface contaminants, the PET particles were initially cleaned and rinsed with water. PET particles were then combined with epoxy resin and dried at room temperature.
Figure 2 depicts the grading of PET particles according to the ASTM C33-03 standards. According to the PET aggregate gradation curve, the particle size distribution of every sample was similar and within the permissible range of ASTM C33-03.

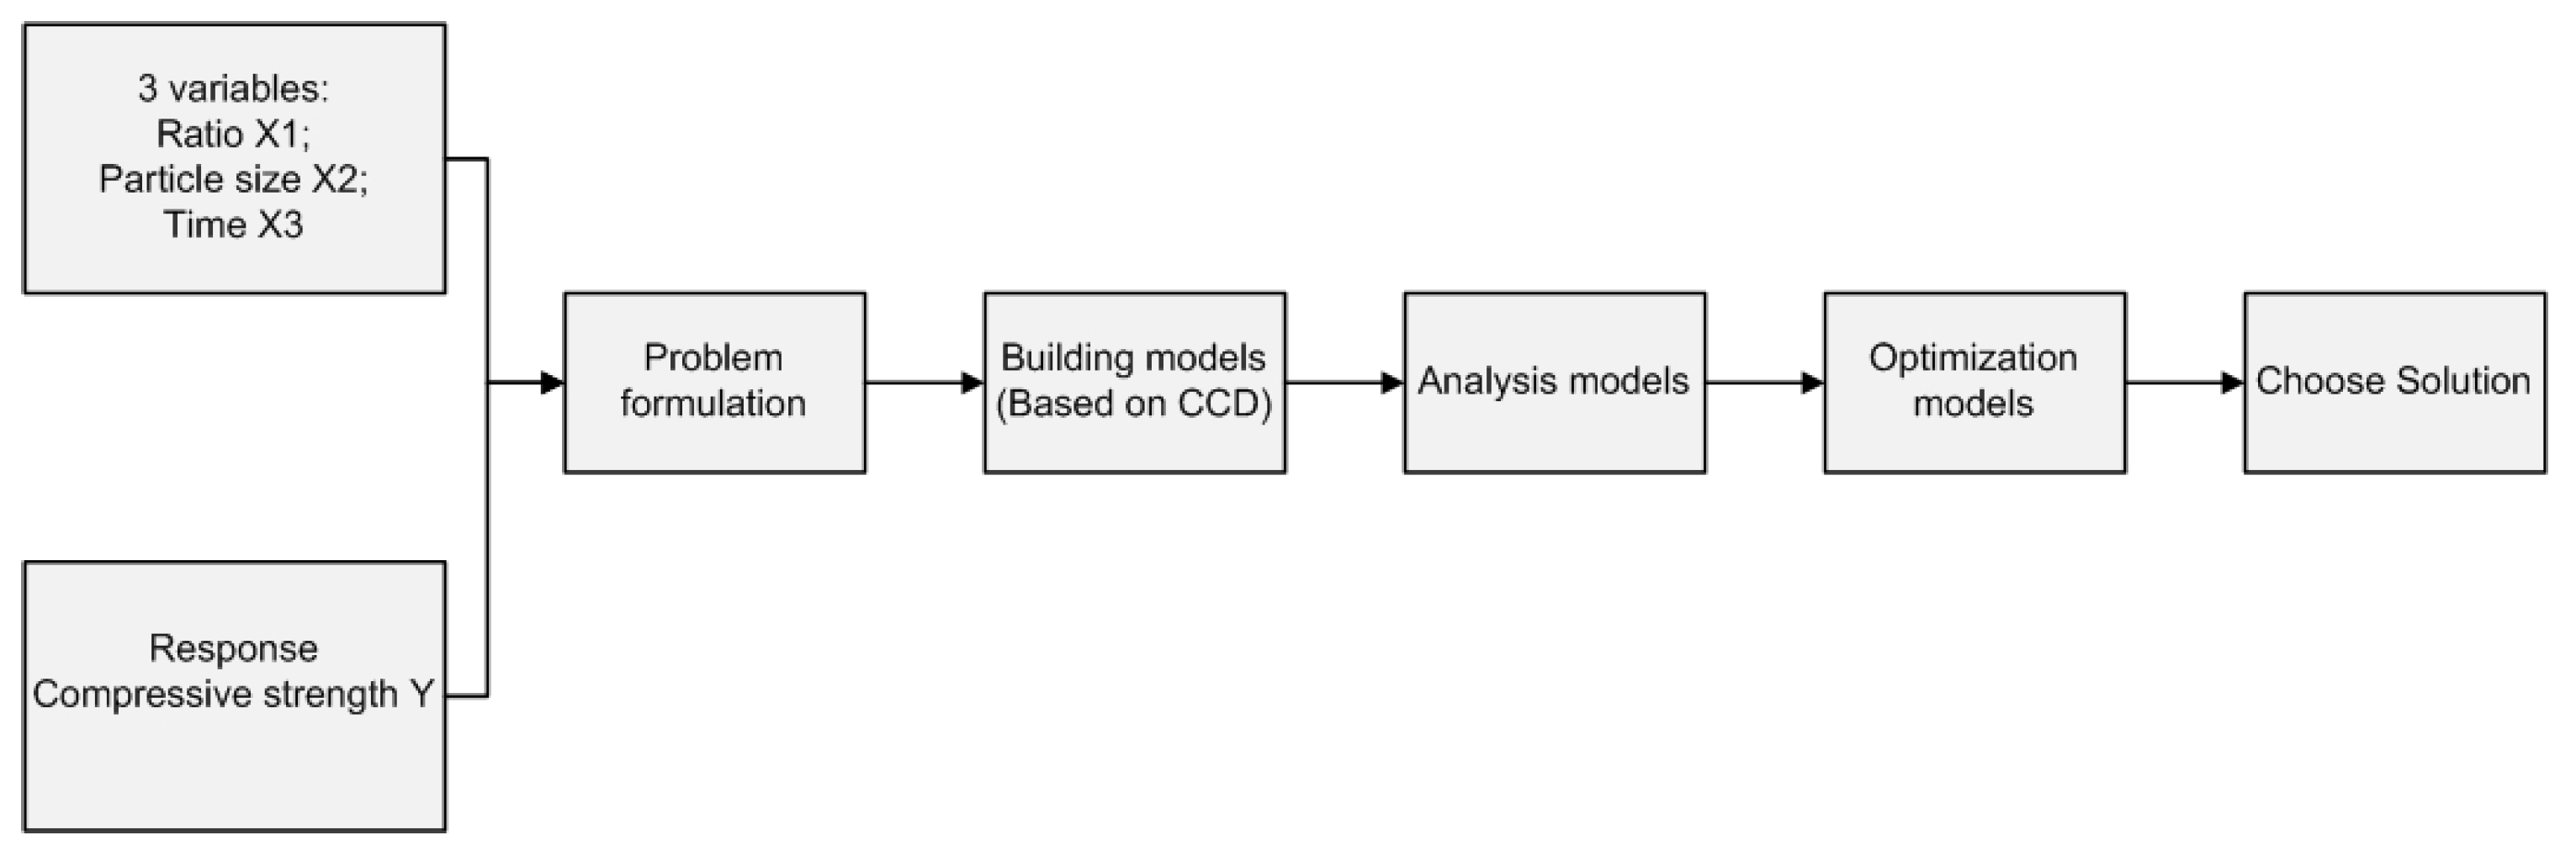
2.3. RSM Model Formulation

Response Surface Methodology (RSM) is an effective technique that is used to determine the relationship between variables and responses. Additionally, RSM assesses the impact of individual variables and variable interactions on responses. Three steps were involved in developing an RSM model: collecting experimental data related to the required response, designing the RSM framework and validating its accuracy, and parameter tuning to satisfy response variable needs.
Material selection and maximising the formulation of the ideal composition were closely associated in this study. As a result, the RSM approach was used in this study to ascertain the optimal value of the interaction between various factors. The interaction that needs to be explored in this study involves the formation of eco-bricks using the best combination of PET particles and epoxy resin. Level 2 polynomial methodology was used in this RSM model. This method explained how different factors interact with each other even though researchers were not aware of the details of the process [15,33,34].
This study is built on an RSM framework that generates a quadratic expression for each response using historical data. The numerous advantages of RSM include its ability to forecast responses accurately, its responsiveness to limited experimental datasets, its ability to assess the impacts of factor correlations, and its ability to determine the best possible response. Central Composite Design (CCD) was used in this study to evaluate how input parameters affected the responses related to the combination of the PET particles and epoxy resin.
The 3 steps of the RSM modelling process are shown in Figure 3: formulating a problem, constructing and application of the model, and optimising and completing the model. The Central Composite Design (CCD) experimental design was the RSM technique used in this study and was appropriate for second-order response surfaces [35]. The main benefit of using CCD is that a variety of outcomes can be evaluated to create a polynomial prediction technique.
The factors chosen are ratio, size, and curing time; this is in accordance with several studies which can be seen in the Table 3. The list was also gathered by focusing only on construction as materials.
This study is based on the dual-level full factorial experimental design and used the 23 full factorial approaches for addressing the 3 predictor variables with 3 repetitions at the centre. Furthermore, 17 experiments could be performed using a single copy of the axial and factorial components. The first independent variable (X1) was the epoxy resin-PET particle ratio, and the second and third predictors (X2, X3) were particle size and curing time, respectively. Table 4 lists the factor values and levels of the indicators.
The dependent parameters evaluated in this study included compressive strength, which was designated Y. Table 5 and Table 6 describe the factorial experiment design combinations that were determined using Design Expert 11.
The Analysis of Variance (ANOVA) technique is employed in statistical analysis to assess the effect of multiple research variables. In this study, mathematical modelling was conducted utilising a second-order polynomial model.
Y = β 0 + i = 1 k β i X i + i = 1 k β i i X i 2 + i < j β i j X i X j + ε
where Y = predicted response, Xi, X2.... Xj were the independent variable, β0 indicates an intercept, βi = linear coefficient, βii = quadratic coefficient, and βij = interaction coefficient [29].

2.4. Compressive Strength Test

The standard used in compressive strength testing is the ASTM D695 standard. Based on ASTM D695, the test method covers the determination of the mechanical properties of rigid plastic reinforces, including high modulus. This test method covers determining the mechanical properties of unreinforced and reinforced rigid composites when loaded in compression at relatively low uniform rates of straining or loading. The compression test is a test that aims to determine the mechanical properties of a material when it is given pressure/load until it cracks or breaks.

3. Results and Discussion

3.1. Model Fitting and ANOVA Assessment

The RSM framework was used in this study to collect 17 data items. The experiments were set up using Design Expert 11, which included the setpoint technique that compares one response with three independent variables. The empirical and predicted data related to the compression tests are listed in Table 7.
To develop the RSM framework, this study evaluated the relationship between epoxy resin size and intermediate PET pellets. The precise composition of polymer concrete can be derived using particle size and ratio. Additionally, the hardening duration is estimated based on the curing time. The compression test response that was generated in the study could help in determining the factor correlation regarding material research [22].
The polynomial framework for the present replies is selected after collecting empirical data. ANOVA was used to determine the F- and p-values to validate the applicability of the model. F- and p-values that were deemed essential for the procedure were used to determine the model’s relevance. Table 8 lists the ANOVA results.
As shown in Table 8, the model had an F-value of 19.16, which indicated model significance. Thus, there was a 0.04% probability that this F-value was due to noise. The F-test showed greater significance (p < 0.001) for the selected framework, whereas the lack of fit was insignificant. The p-value surpassing 0.05 [23] suggested that the predicted results did not significantly lack fit. The results in Table 8 indicated that the p-values for the ANOVA tests indicated that the lack of model fit was insignificant. The model was validated, and ANOVA analysis was used to assess different tests for every response variable. The p-value for each parameter assists in determining the significance based on a cut-off value (usually 0.05), indicating the significance of factors and the importance of building a more accurate model. Table 8 showed that the A, C, and BC factors were the significant terms used in the study model.
Table 9 depicts the statistical summary model. The coefficient value of determination, i.e., R2 = 0.9610, indicated that 96.10% of the sample variables used to build eco-bricks were controlled by independent factors, and only 8.9% of the sample variables were influenced by other variables not included in the model. The goodness-of-fit value of the models is considered adequate when the R2 value is closer to one. In other words, the computed experimental results and the observed data showed good agreement. In addition, a model is regarded as good if its R2 value is >80%. Additionally, Table 8 revealed that the low deviation value was 1.96. A model is more accurate when its deviation value is low or almost zero. The signal-to-noise ratio in the above models was also demonstrated with adequate precision. Previous studies suggested that adequate precision values must be >4 [21,35].
Table 10 presents the coefficients, which are expressed as terms of coded factors in the mathematical model for the experiment. The below equation and mathematical models for the factors and responses have been presented as Equation (1).
y   compression = 34.40 + 4.31 X 1 0.7449 X 2 + 3.40 X 3 + 0.8136 X 1 X 2 0.03450 X 1 X 3 1.60   X 2 X 3 + 1.45   X 1 2 2.40   X 2 2 + 1.83   1.45   X 3 2
The model equation indicates that the variable ratio and hardening times have a significant impact on manufacturing the eco-bricks. The model indicated that the variable ratio and setting time values were positive.
Model validation is one of the parameters to determine whether the developed RSM model can predict the strength of the eco-brick formula being developed. The validation process is carried out by treating the model according to the optimal parameters. The validation process was carried out with three experiments. The experiment for predictive optimization was conducted to validate the accuracy of the models. The results of the experiment can be seen in Table 11.
Validation of the model to determine if the developed response surface model can predict the compressive strength was successfully performed. This validation is conducted by calculating the confidence value obtained from the developed model. The validation results of the three sets of parameter settings are shown in Table 12; the compression test data has a confidence value of 95%. This indicates that the model is accurate enough to predict the compression test of eco-bricks based on PET particles and epoxy resin. The average compressive strength value obtained is 44 MPa, and all are in the prediction interval (PI) of 95%. The results show that the RSM optimization model is reliable for optimizing eco-bricks responses.

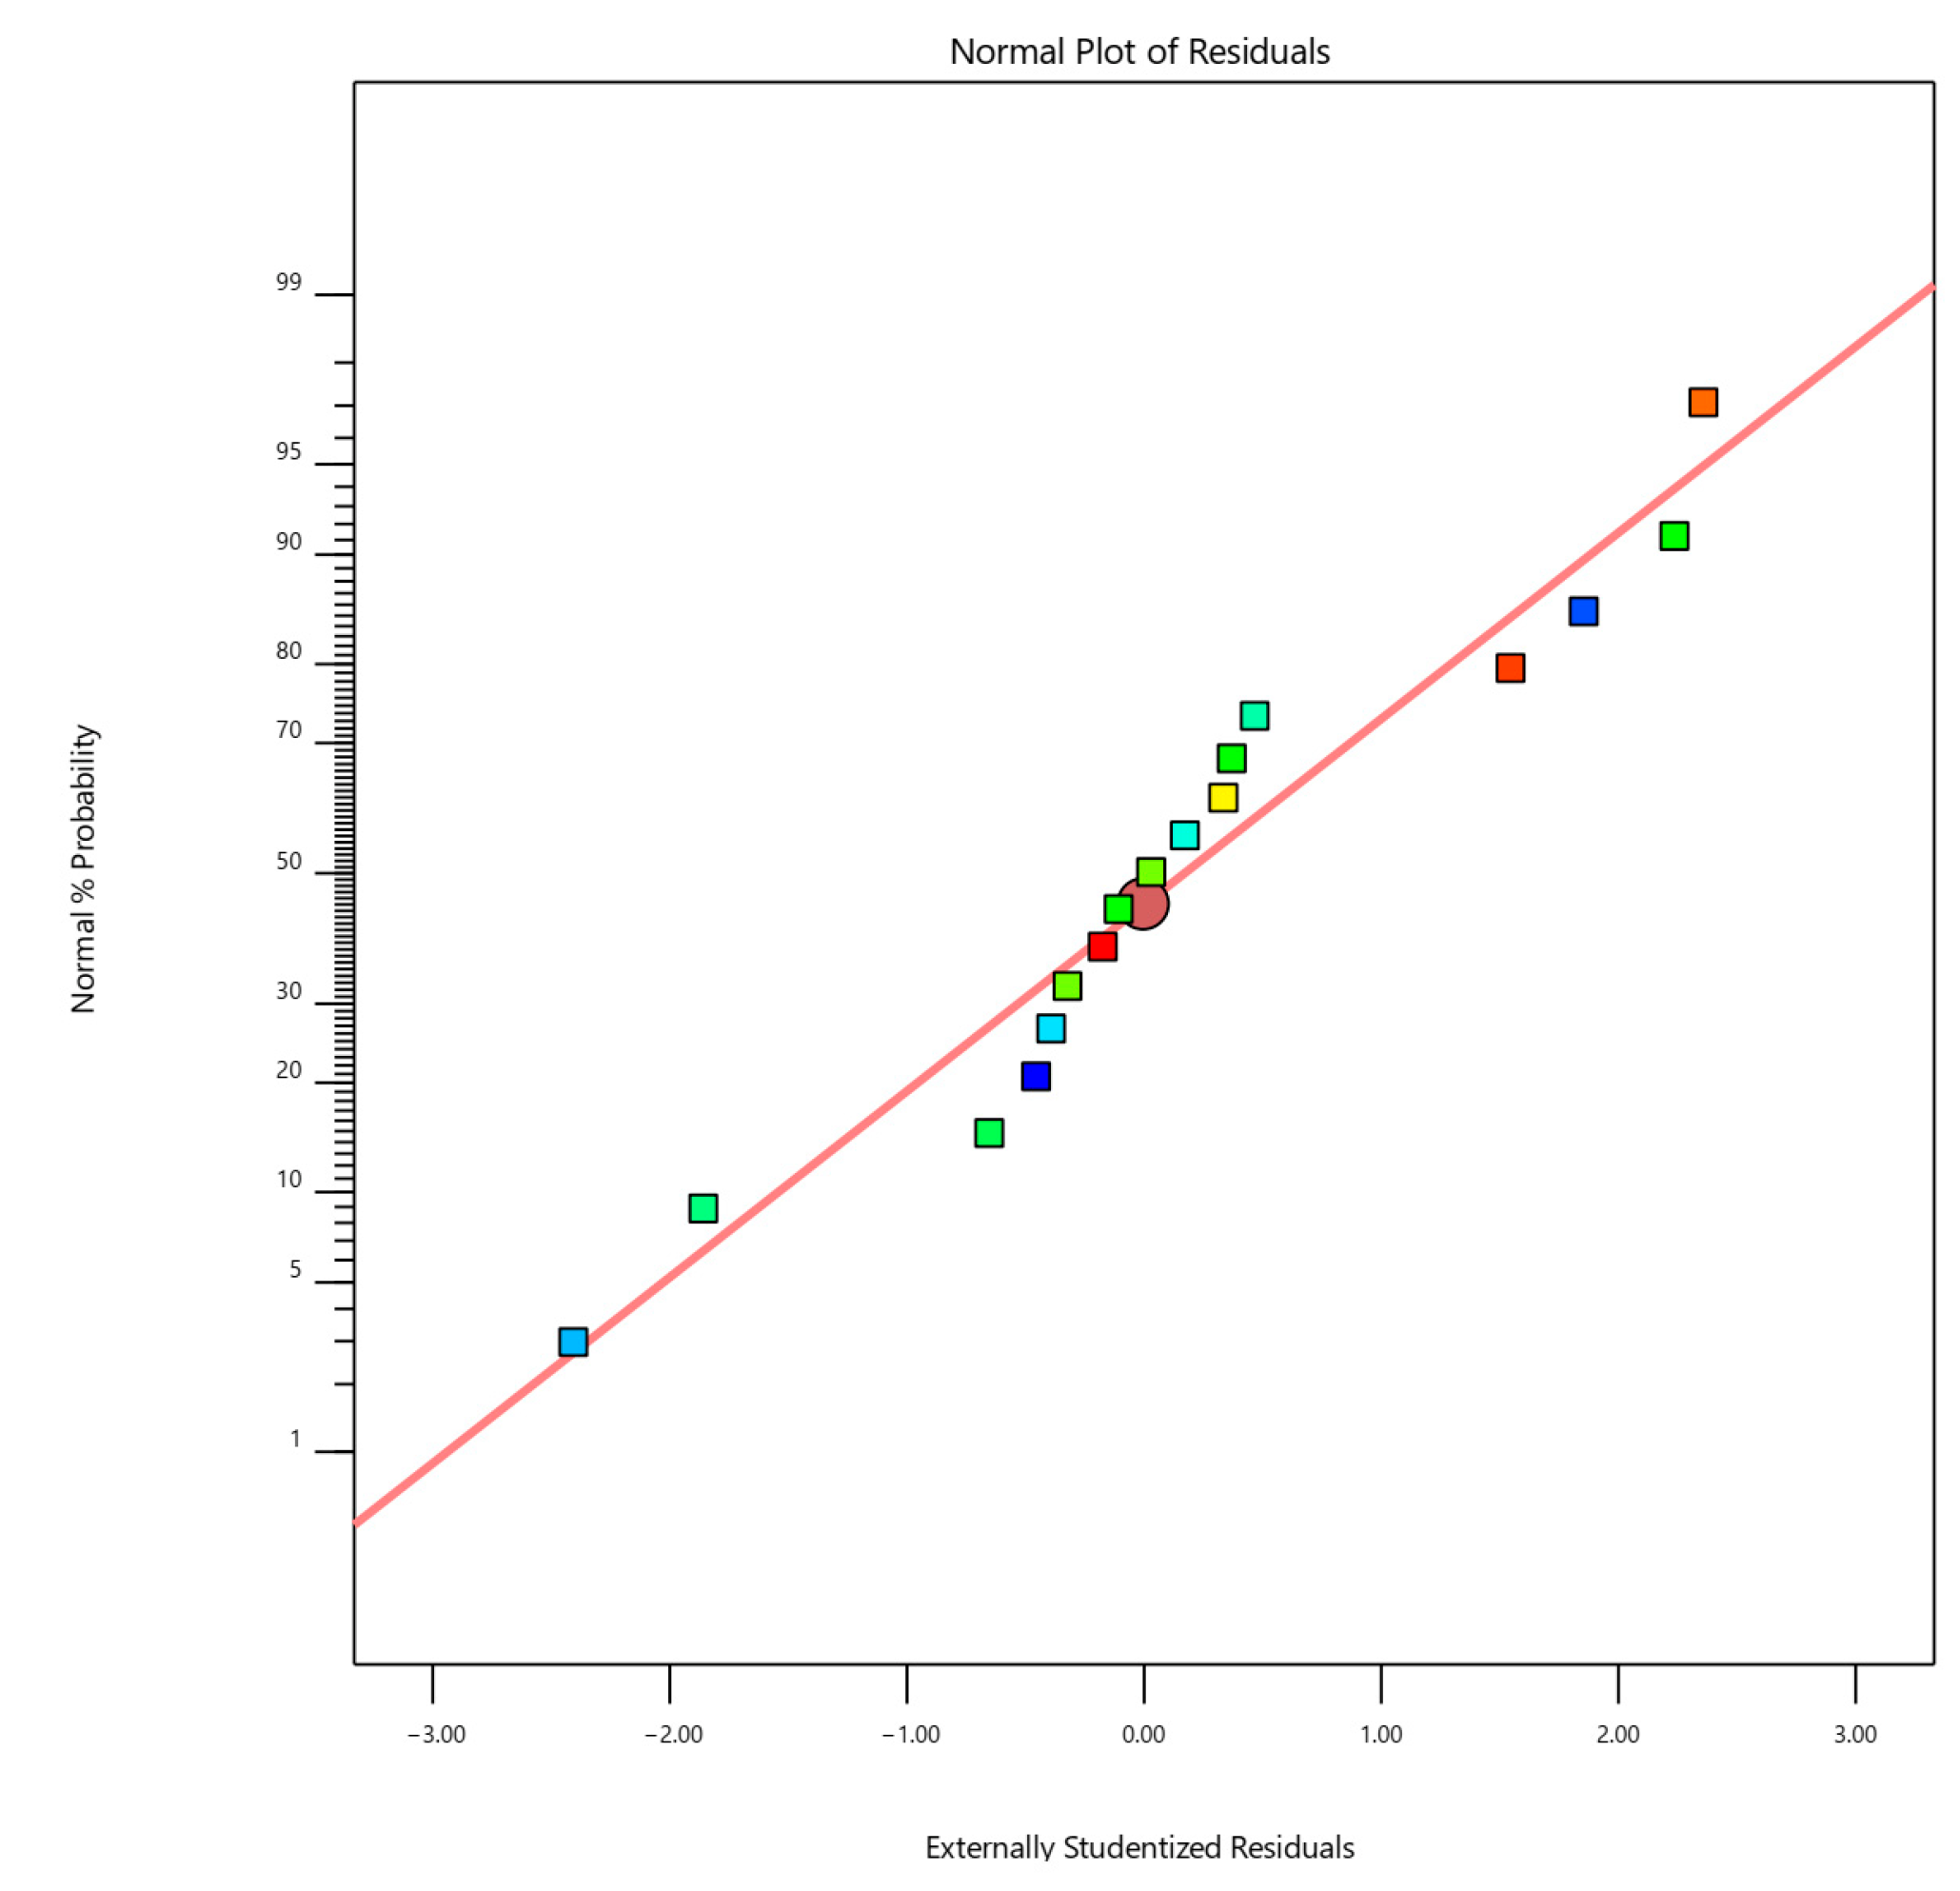
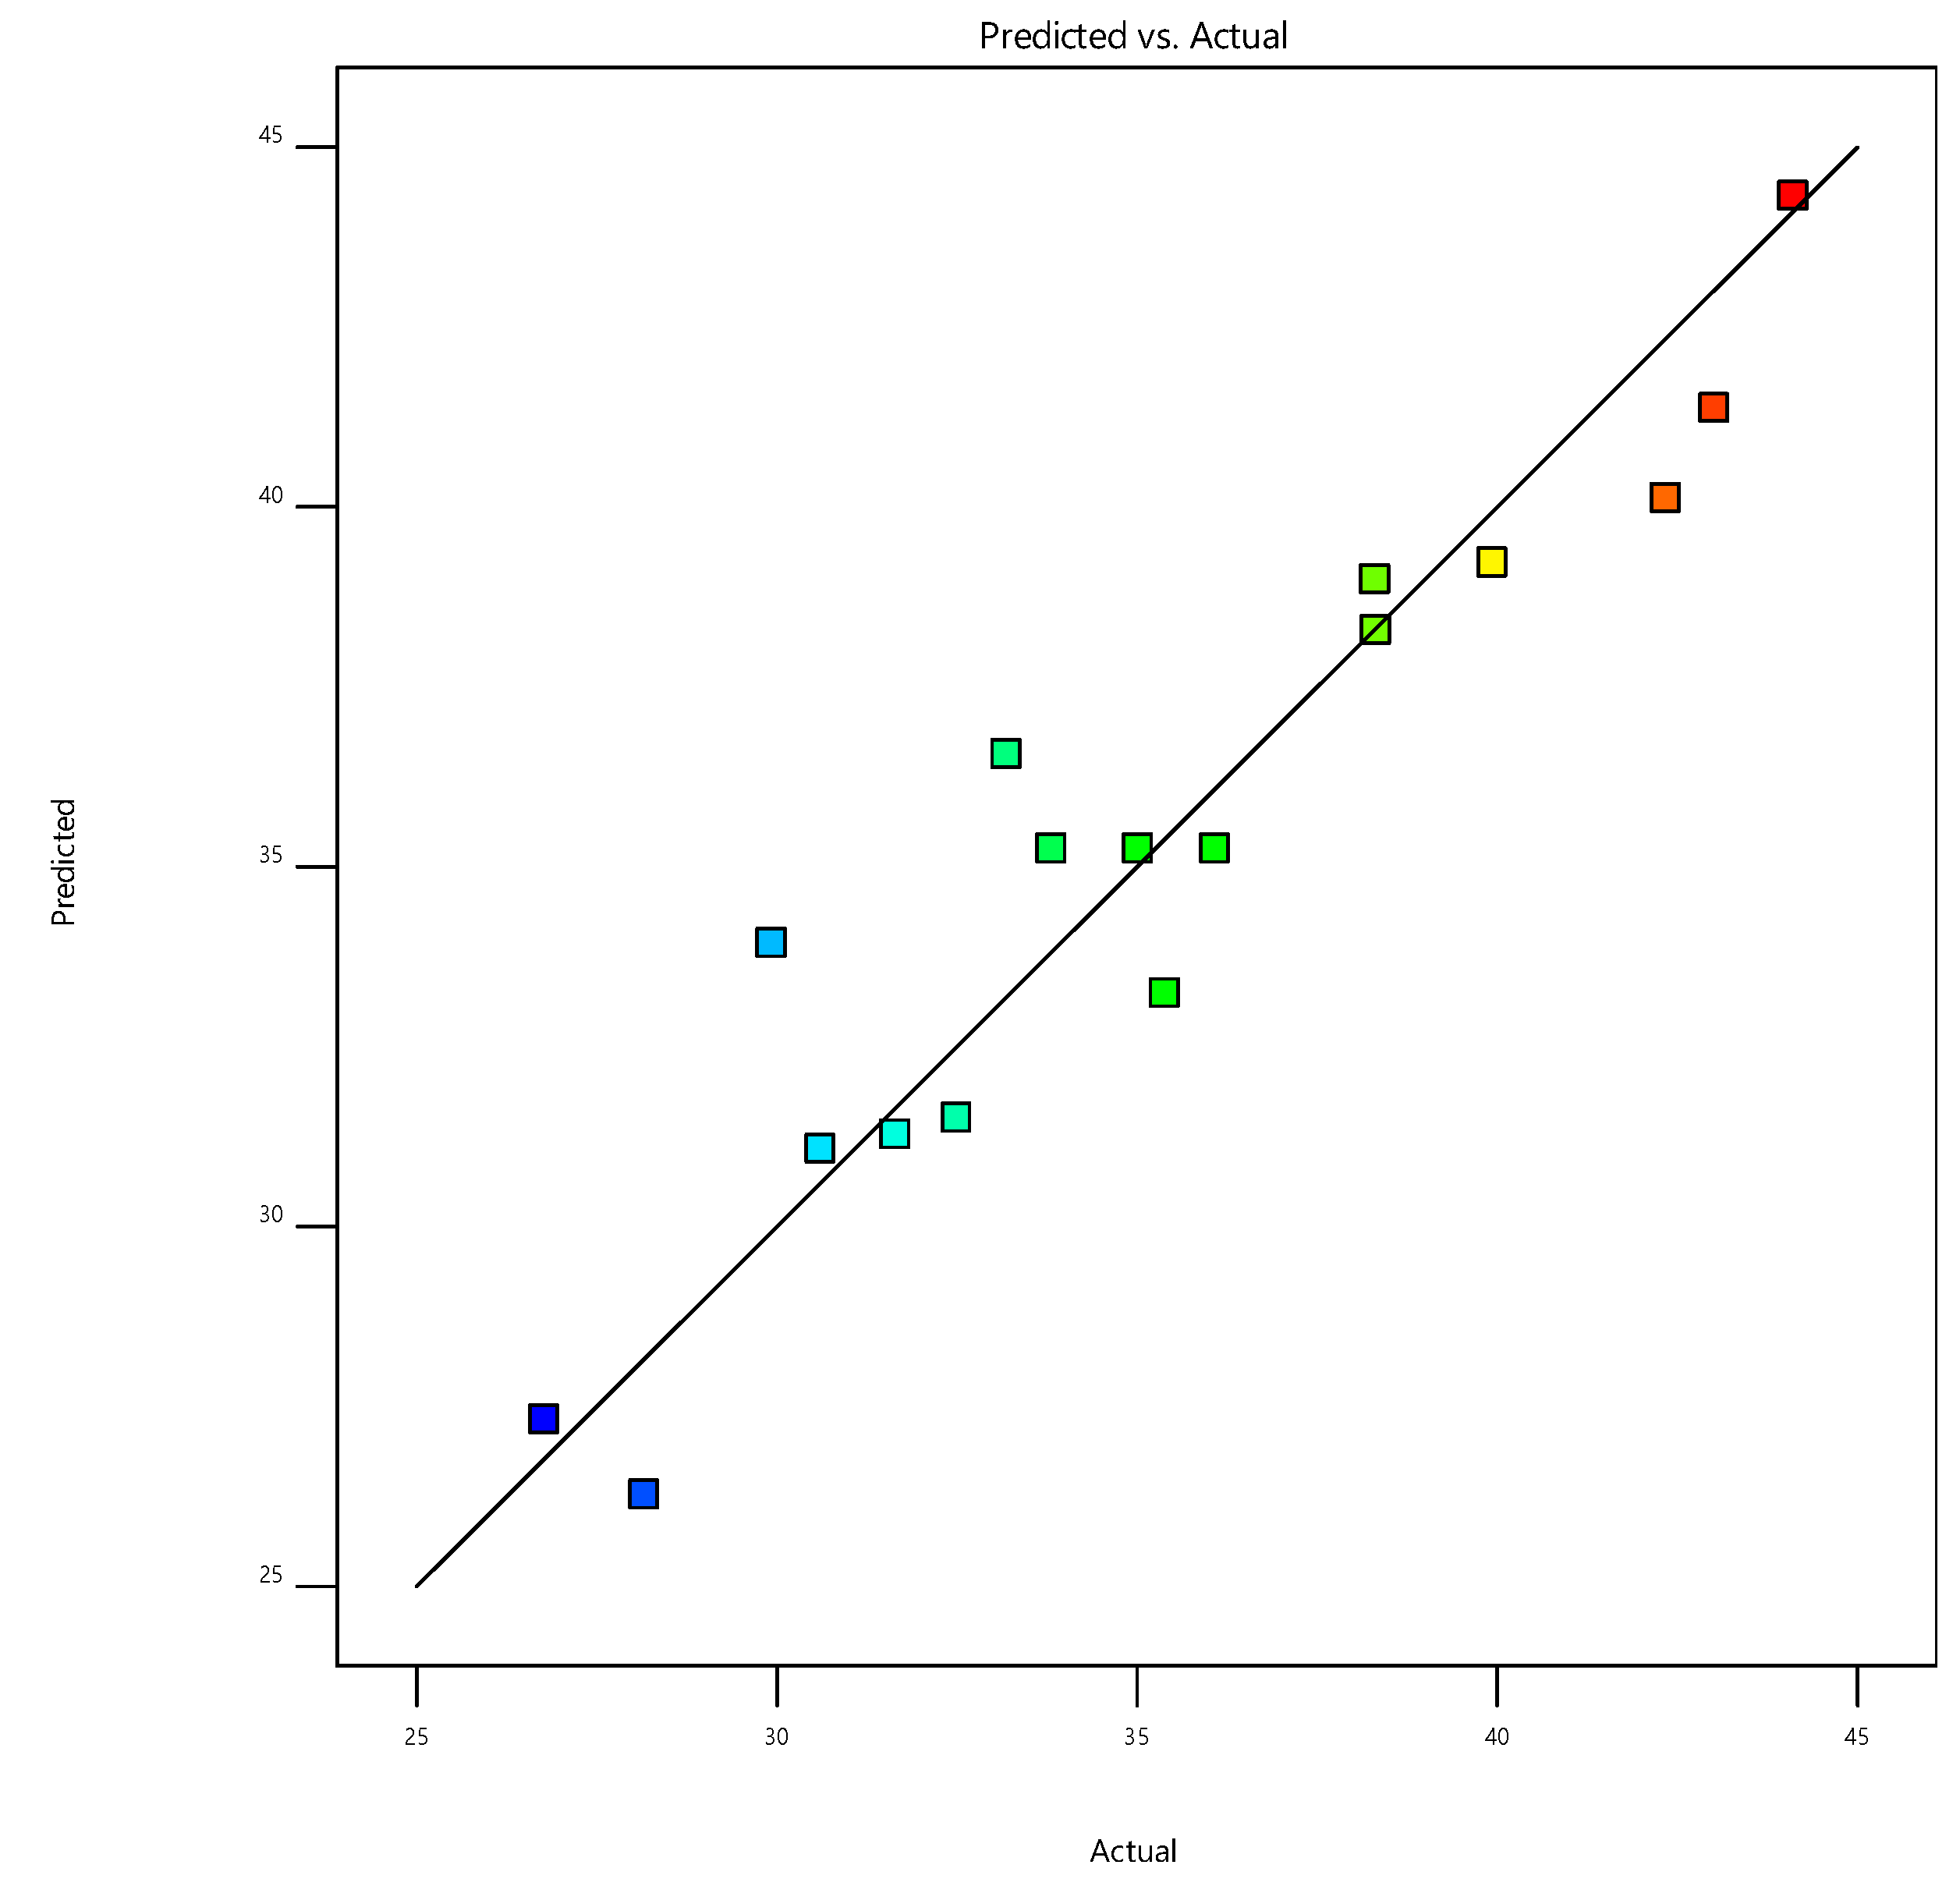
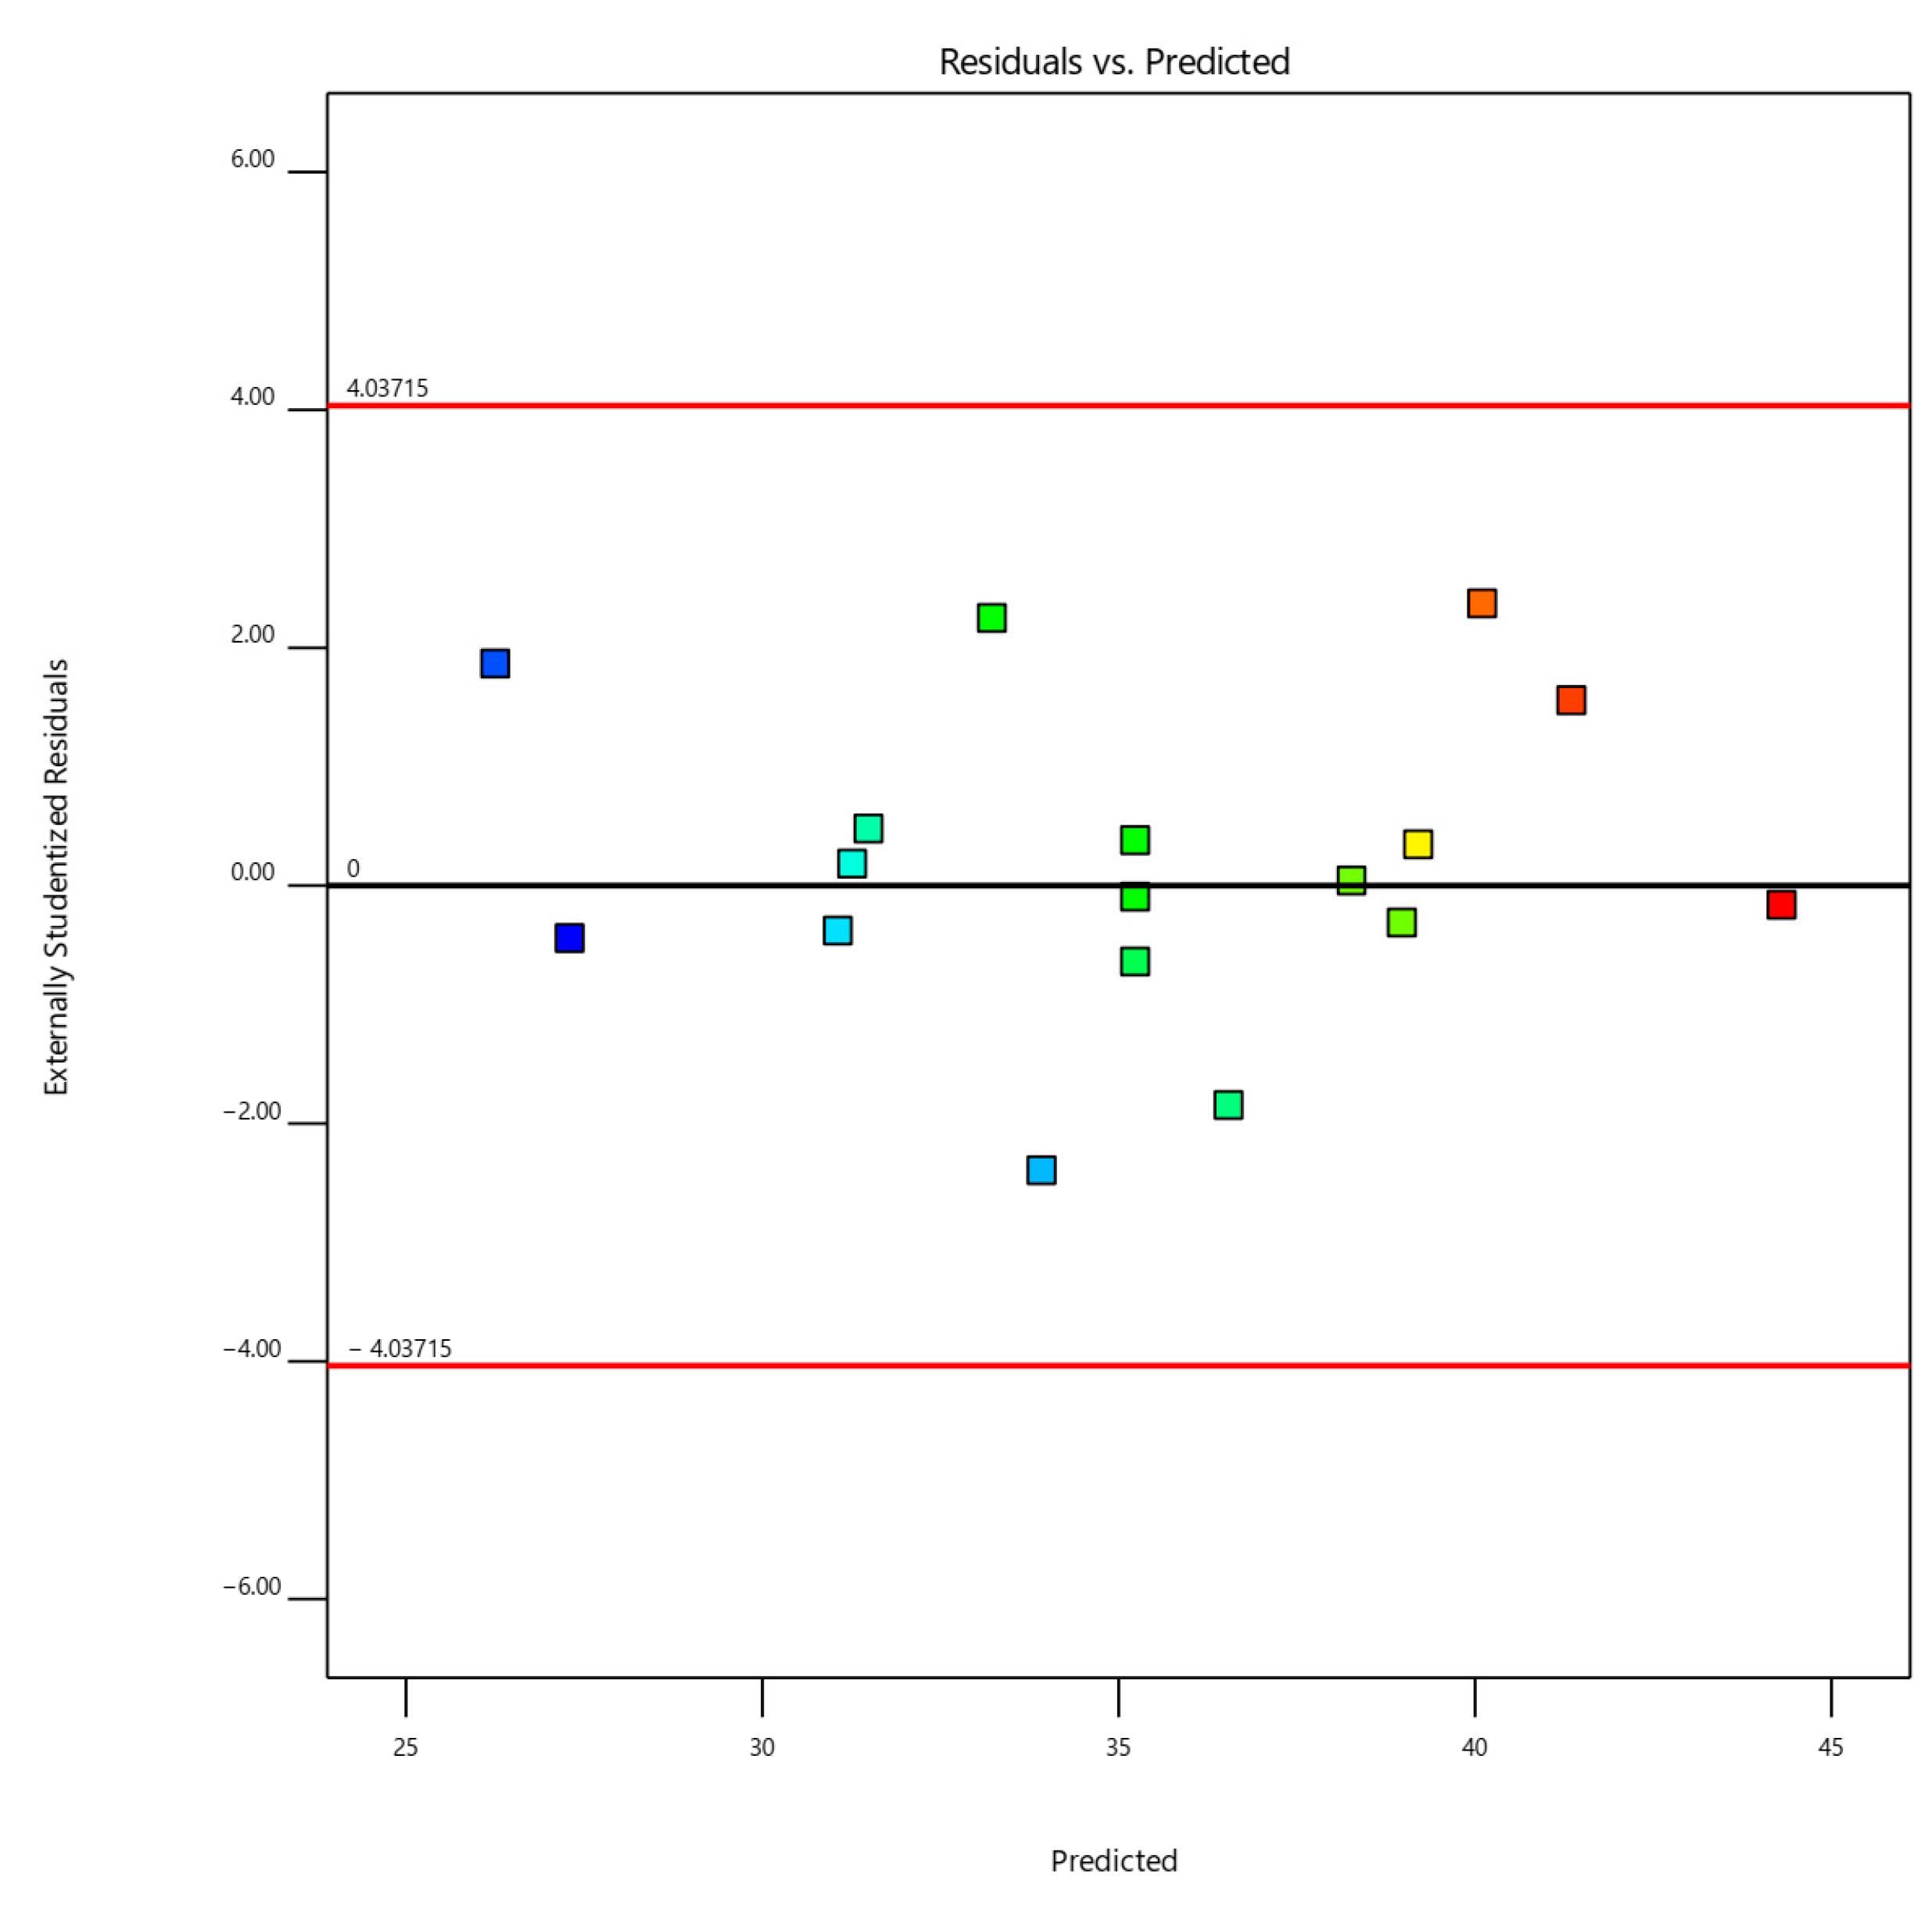
3.2. Residual Plot Adequacy Assessment for Composites

The model adequacy assessment was carried out to confirm that the proposed model could accurately describe the actual phenomenon. Residuals were evaluated using ANOVA value hypotheses for the satisfaction model. The standard deviation that corresponds to the empirical and computed values was calculated using standardised residuals. The typical likelihood values’ relationship to external residuals is shown in Figure 4. Additionally, Figure 4 shows a linear relationship between exterior residuals and normal likelihood values. The fact that every residual is close to the fit line related to the data model indicates that the model does have a normal distribution and is therefore able to predict empirical observations. The optimisation-specific studies indicated that the good model must have a normal distribution [24,25].
As shown in Figure 5, the estimated and actual values were in good agreement. The fact that the data points were dispersed close to the line suggest that the model could accurately estimate the values. According to the cut-off results, the closer the data points were to the reference line, the higher the data accuracy. The residuals and estimated data points are shown in Figure 6, which suggests that the stunted residuals showed a random distribution in a specific area near the zero point. It suggests that there is a lack of consistent patterns to support continual variance. Furthermore, the diagnostic residual vs. projected graph indicated that there were no outliers in the model.

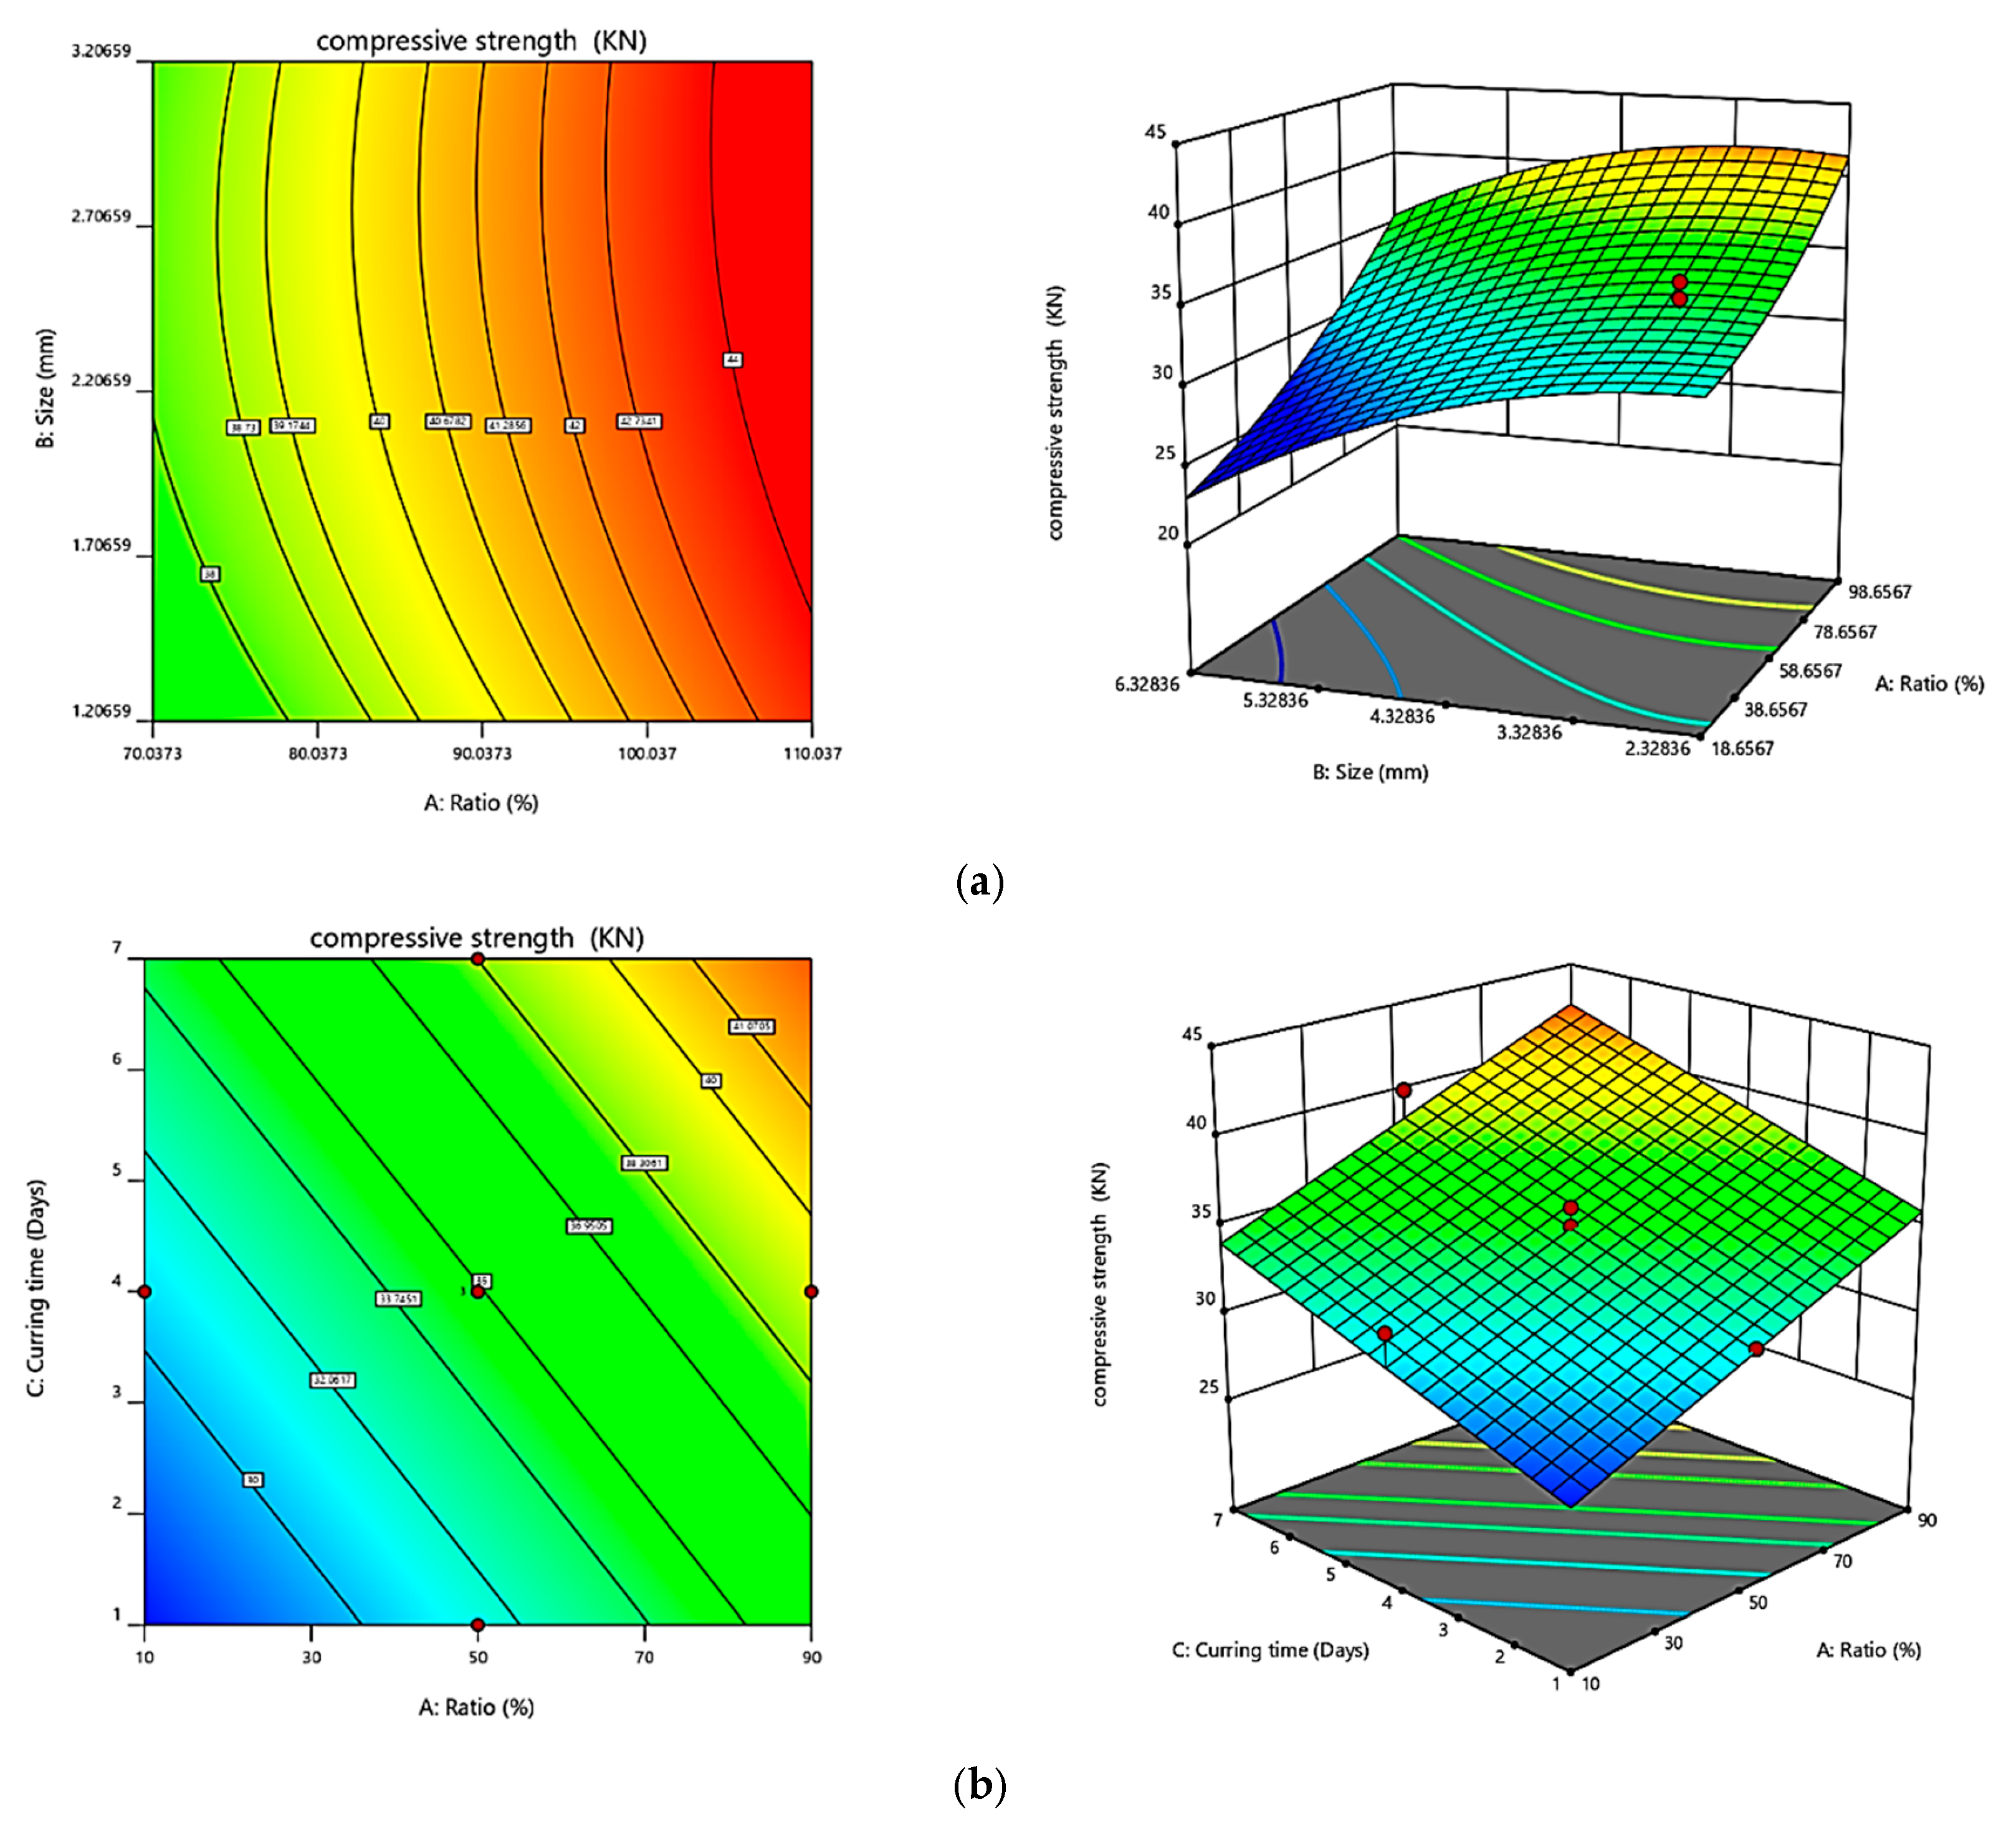
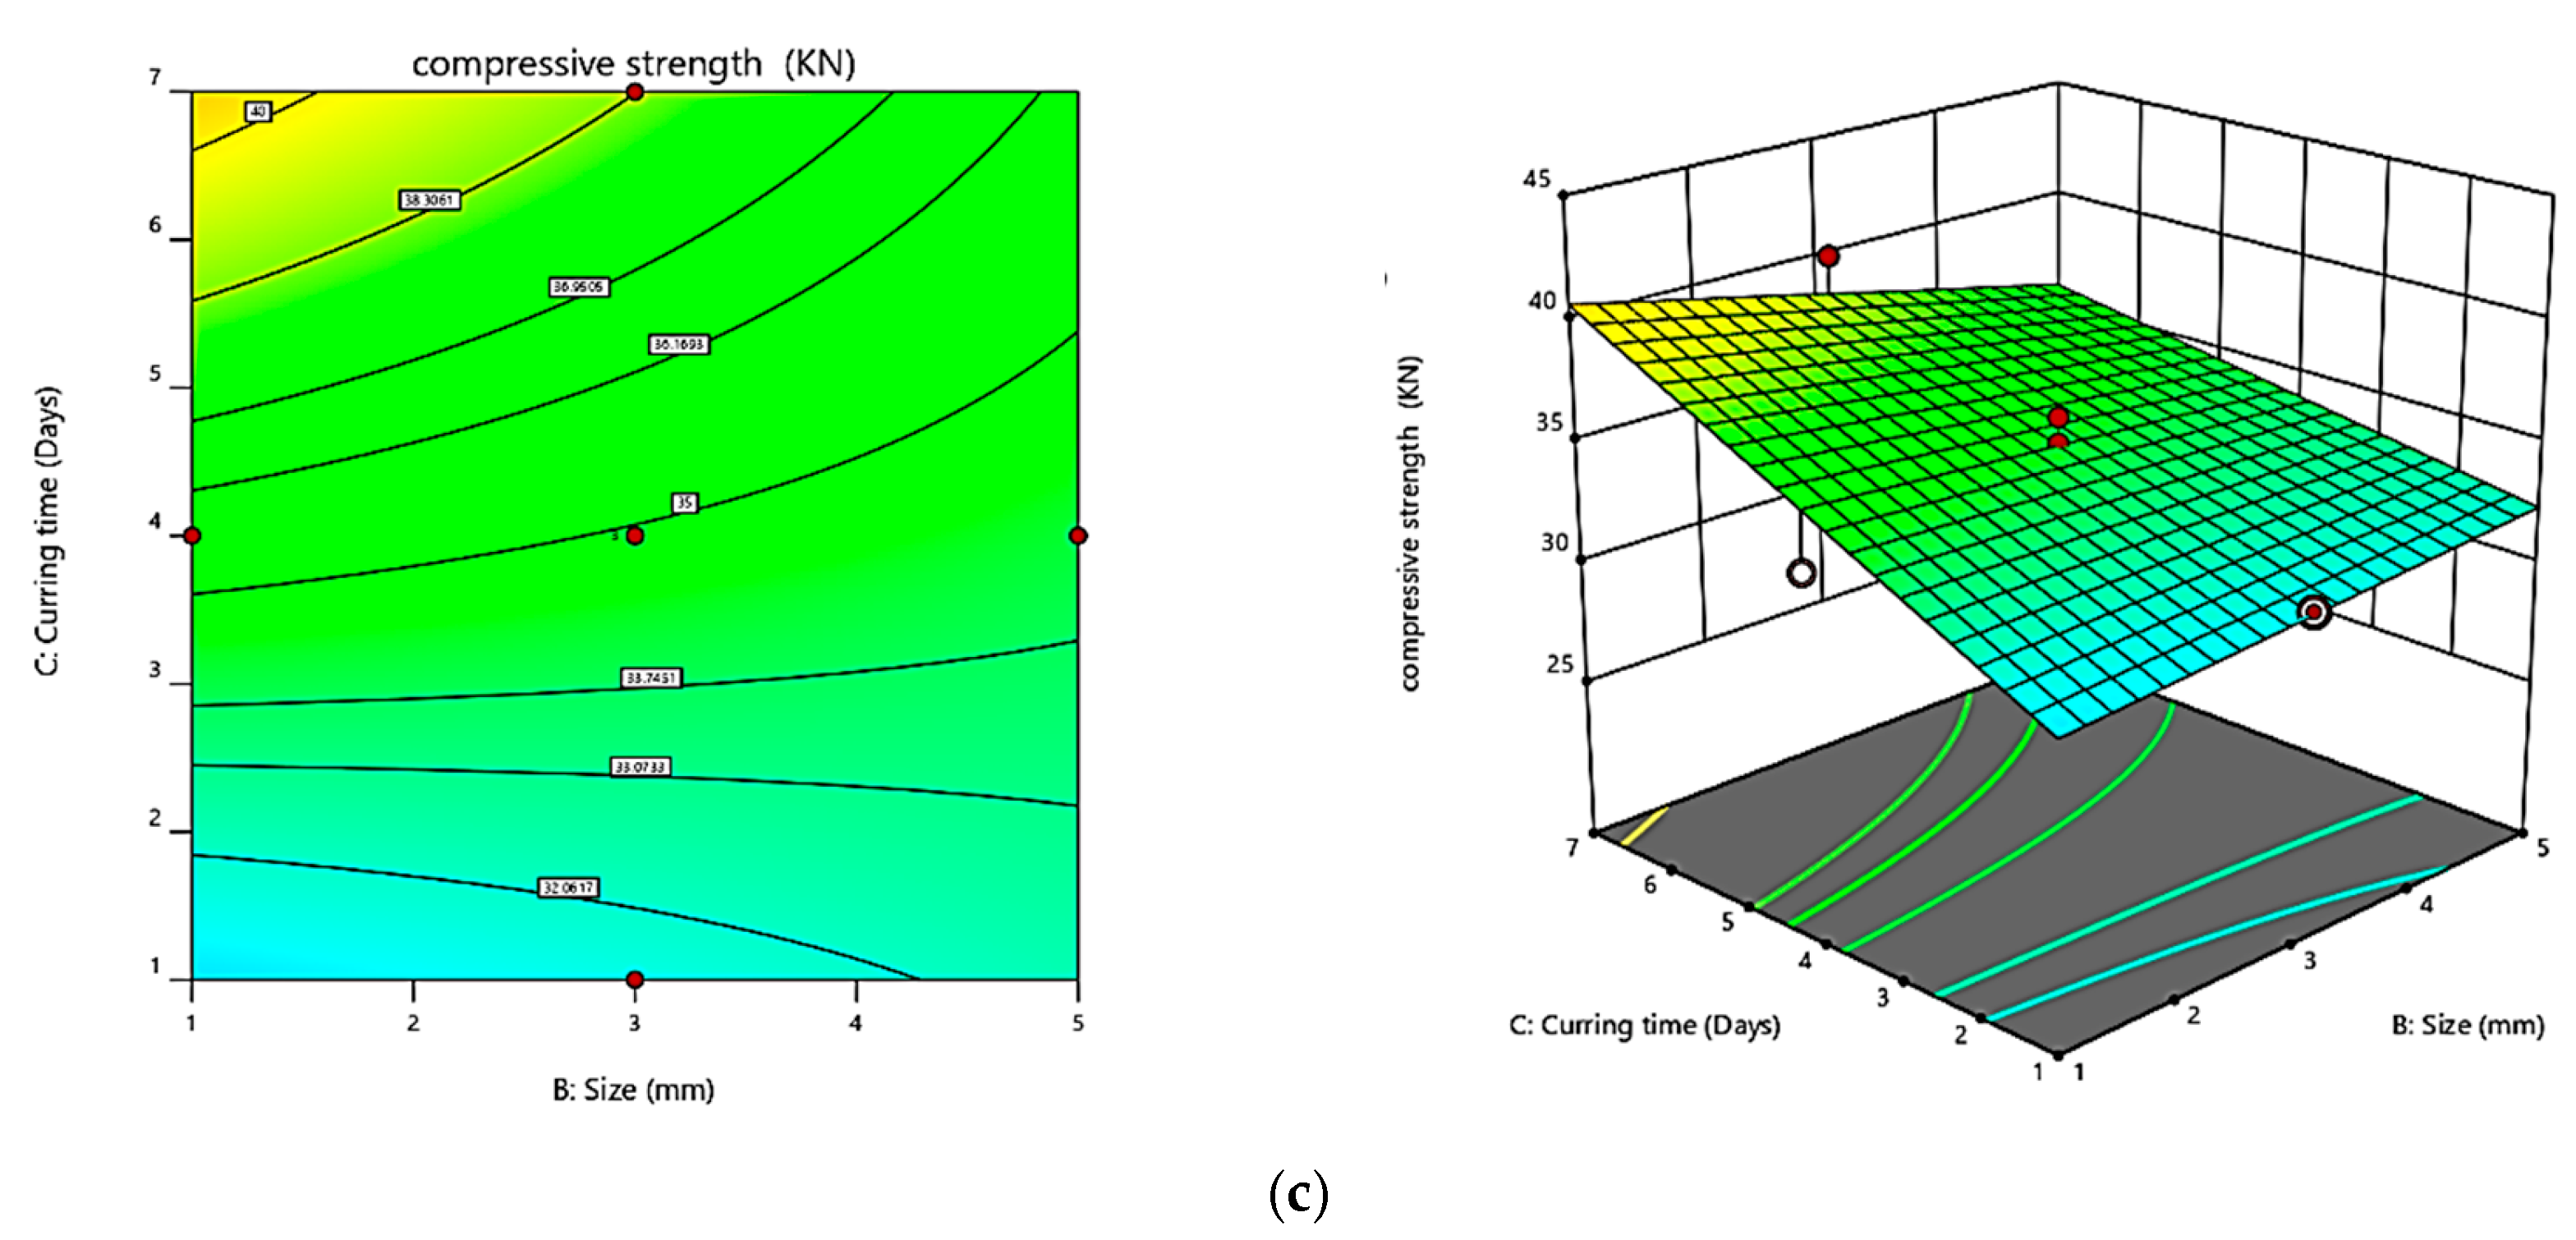
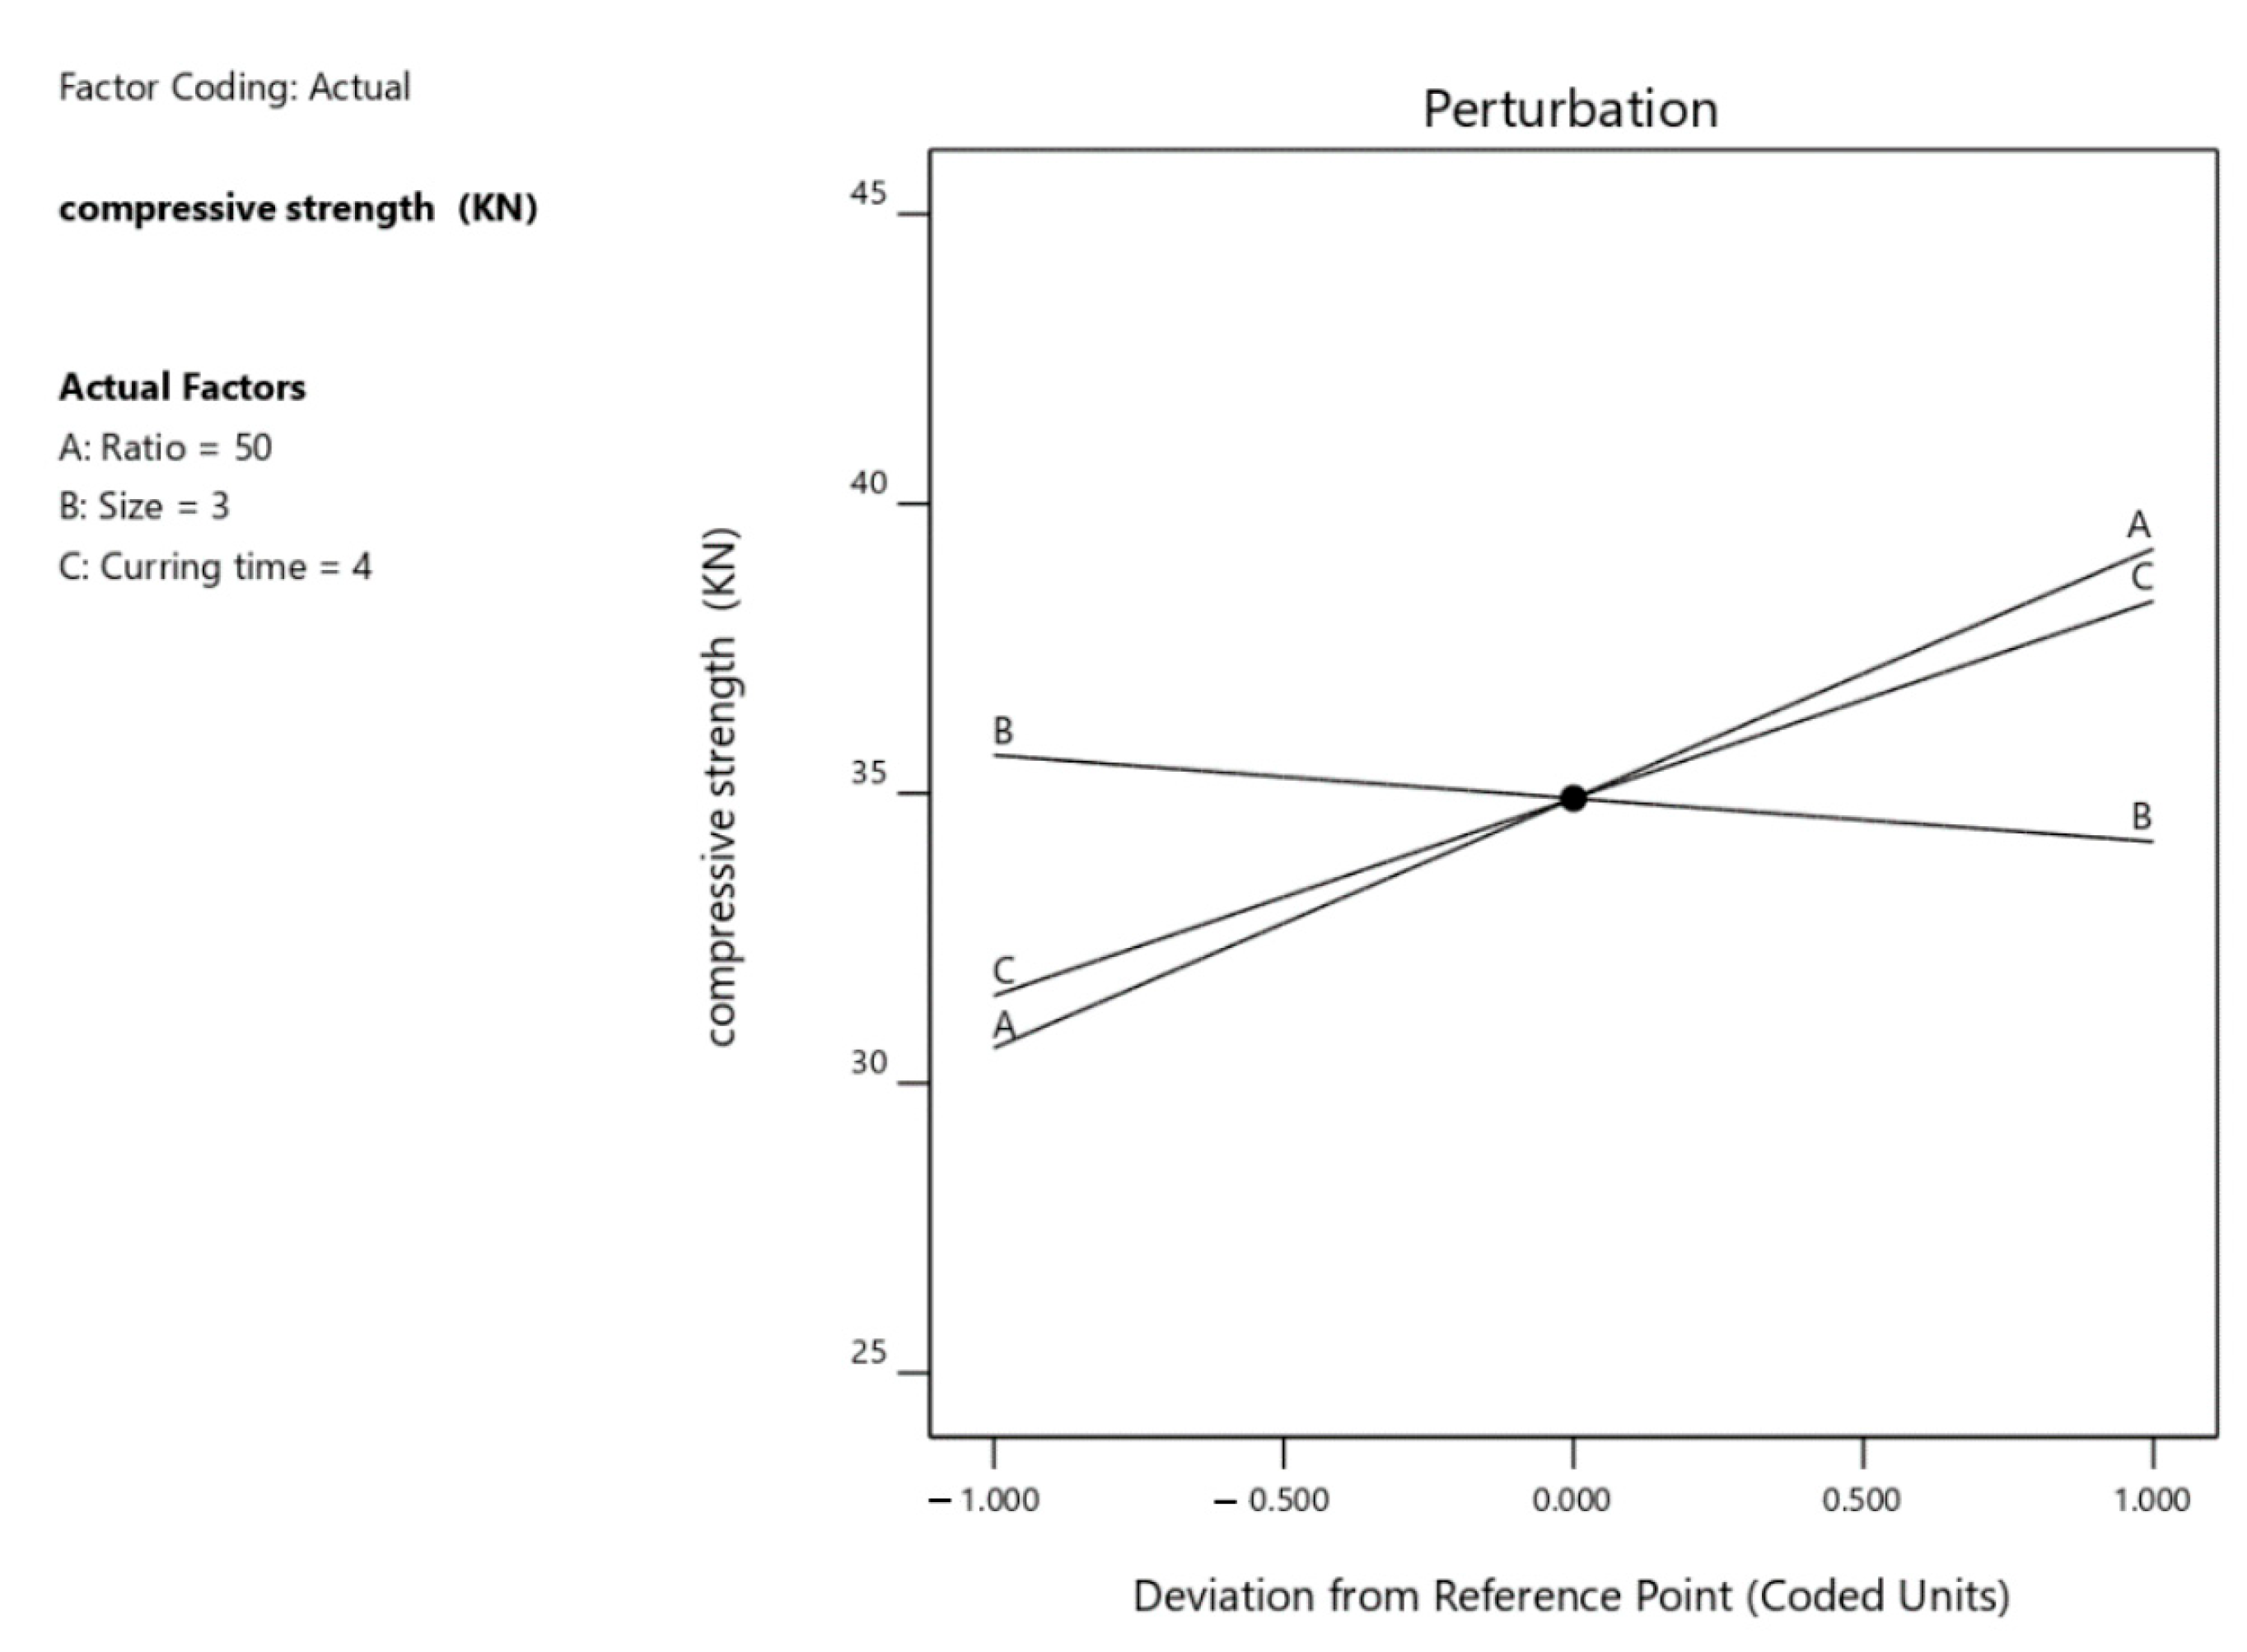
3.3. Surface and Response Surface Contour Plots

An indicator-compression test that includes the three response-regulating factors (size, ratio, and cure period) can be used to map a response boundary to demonstrate the response surface model. Figure 7 depicts the generated contour plot with different colours denoting the output response interval. Compressive strength fluctuation based on a ratio is shown in Figure 8a. The findings in the study suggest that a higher ratio corresponds to a higher measured compression value. The fact that epoxy resin performed better in the compression test demonstrated that it had a solid structure. The results in Figure 8b indicate that the larger PET particles decreased the compressive properties. As a result, the eco-bricks must be constructed using small particles for improving their compressive strength. Additionally, the results in Figure 8c indicate that a longer curing period could offer better compression test results.
Figure 8a shows the effect of the epoxy-PET ratio on compressive properties. Figure 8 demonstrates that a larger ratio, which increases compressive strength, corresponds to an increase in epoxy resin content. The epoxy resin is used to improve the adhesion of PET particles. The results in Figure 8b showed that PET particle size affected the compressive properties of eco-bricks. Therefore, it can be claimed that smaller particles enhance the compressive strength of the eco-bricks, whereas larger particles lower it. PET particles are therefore uniformly dispersed without any gaps or cavities. A longer curing time increases the compressive strength of the eco-bricks, as shown in Figure 8c.

3.4. Residual Plot Adequacy Analysis for Composites

The perturbation graph makes it easier to assess how different factors will affect a particular region in the design space. Except for one parameter, the other parameters were kept constant, and the outputs were charted. The perturbation plot can be used to comprehend the magnitude of the reaction to particular aspects. Curved plots demonstrate that a particular parameter impacts the output. A considerably flatter result, however, implies that the selected factor mildly affects the final output. The relative significance of factor responses related to several factors can be better understood using distraction charts. Figure 9, which displays the relationships between the different process variables using the centre of compressive test results, shows the perturbation properties of the eco-bricks. The perturbation chart revealed the findings of a particular parameter while keeping the other parameters constant and the selected parameter deviated from the designated reference coordinates. In this study, the centre of the design space was selected as a reference coordinate, which corresponds to the 0-point for each parameter.

3.5. Composite Optimisation

Based on the factor ranges depicted in Table 13 and the desired response, Design-Expert software was utilised to perform a numerical optimisation. The results of optimisation are shown in Figure 10. The ideal parameter ratio (A) is 89.9%, whereas the optimum particle size (B) and curing time (C) were 1.1 mm and 6.9 days, respectively. As a result, the desired compressive properties suggest a strength of 44.1193 MPa. In terms of the response variable, a desirability moving towards a value of one was selected as the most important factor.
In this study, a desirability value of one was used for validating and evaluating the compressive characteristics under optimal conditions.
According to the results of the optimisation process, the optimum composition ratio (A) was 89.9%, the ideal particle size (B) was 1.1 mm, and the optimum curing time (C) was 6.9 days. As a result, the optimal compressive properties showed a compressive strength of 44.1 MPa. This demonstrates that the mixture of PET particles and epoxy resin shows a higher compressive strength compared with the eco-bricks constructed using a plastic bottle. Taaffe et al. (2014) showed that the eco-bricks that were constructed in their study showed a compressive strength of 2716 MPa [31]. Bhairappanavar (2021) determined the strength of eco-bricks that were developed using clay and recycled materials. The maximal yield of these bricks was seen to be 16 MPa [24]. Aneke et al. (2021) noted that the maximum strength of eco-bricks that were constructed using a mixture of PET waste and clay was 31.6 MPa [38]. Crespo-López (2022) showed that the clay bricks that were mixed with the household glass waste displayed a compressive strength of 28,191 MPa [14]. Kumar (2021) utilised melted PET particles for developing eco-bricks. These bricks showed a compressive strength of 11,605 MPa [25]. The results of the study indicate that the eco-bricks that were developed using a mixture of PET particles and epoxy resin showed a higher muscular strength compared with the eco-bricks produced in earlier studies. This indicated that the PET and epoxy resin particles could be combined for improving the compressive strength of the eco-bricks that were not burned. Thus, mixed binders could be used for producing non-combustible eco-bricks [26]. Research conducted by Jianjian Song et al. in 2022 shows that epoxy resin can increase compressive strength in manufacturing oil well cement-based composites [39]. The research of Asdollah-Tabar et al. in 2021 also found that the use of recycled PET bottles can increase the compressive strength of polymer concrete [28]. This shows that the addition of materials can increase compressive strength.

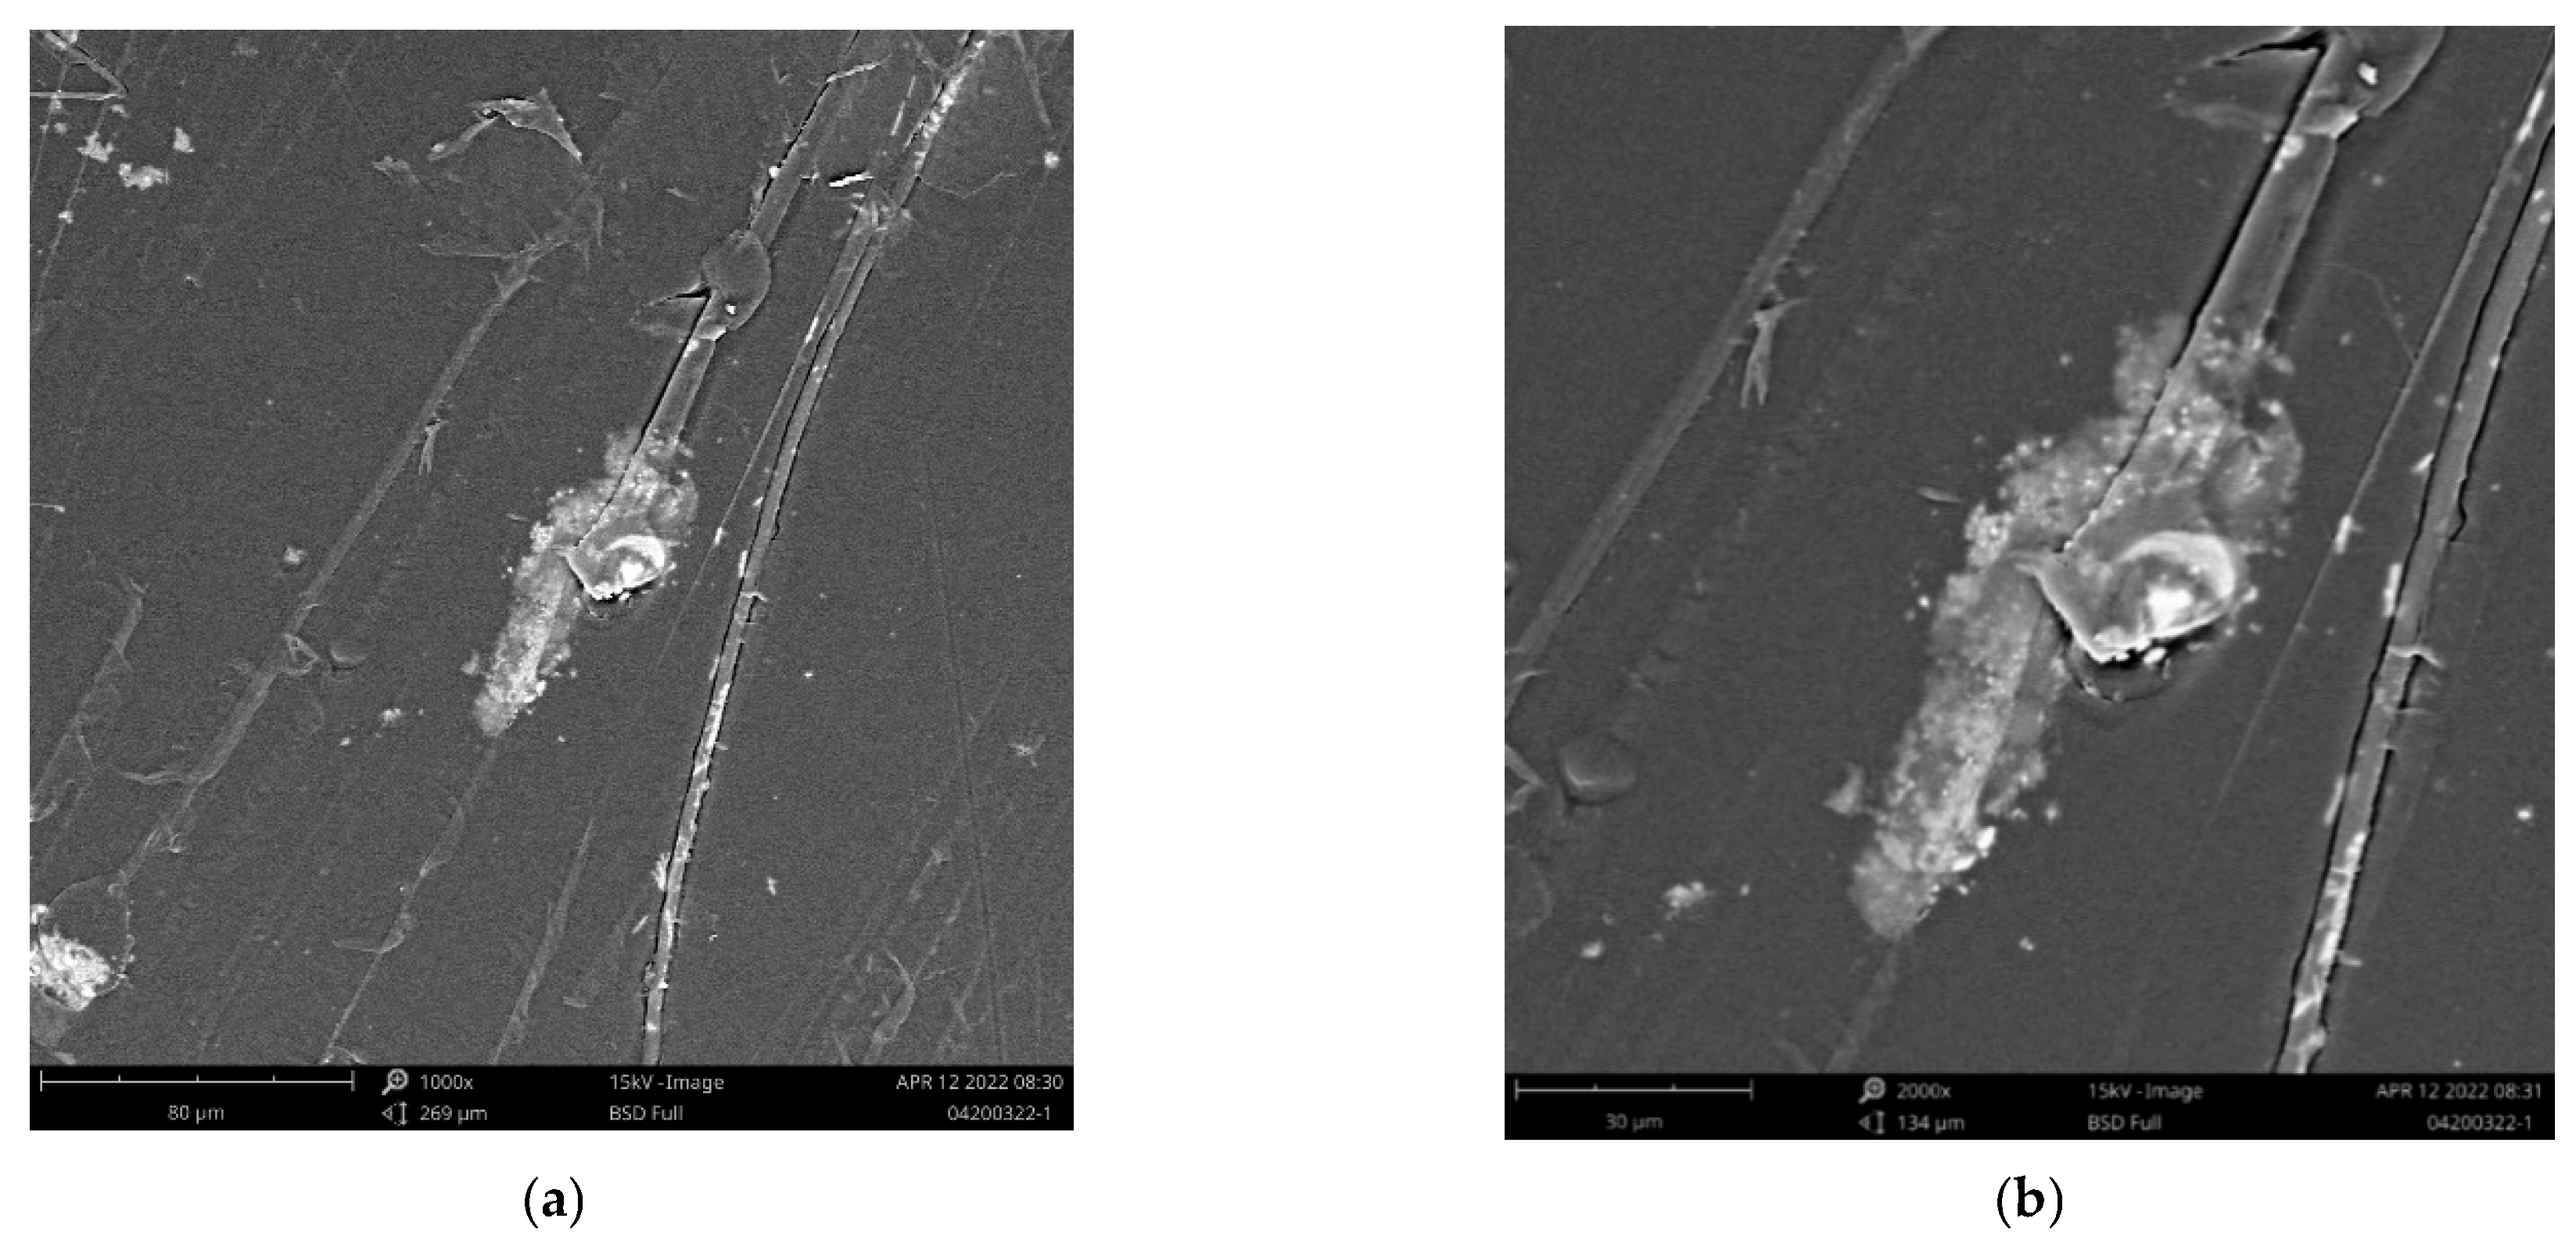
3.6. Microstructure Analysis

In this study, the researchers conducted SEM analysis using the eco-bricks at different magnifications of 1000× and 2000×. The SEM results have been presented in Figure 11, whereas Table 14 presents the results of the EDX tests that were conducted on the eco-bricks.
The surface of the constructed eco-bricks was tested using SEM analysis. Figure 12 displays the findings of the SEM tests.
The SEM results in Figure 12 show that the surface of the eco-brick was plagued with cracks and cavities in the region surrounding the PET plastic. The heat of the resin during the hardening process prevents the PET plastic from blending perfectly with the resin, which results in cracks and voids. The heat treatment of PET plastic can soften and contract the top and bottom layers in the specimen. The eco-brick displays comparatively fewer cracks and voids, and these cracks are present in the region around the PET plastic particles and not on other surfaces. All these factors contribute to the material’s low water absorption level.
As mentioned above, the eco-bricks contained cracks and cavities in the region surrounding the PET plastic that prevent it from blending with the epoxy resin. This is attributed to the heat in the resin during the hardening process, which causes the PET plastic particles to shrink. As very few cracks and air voids are noted around the PET, the water absorption level of the eco-bricks is decreased. Thereafter, the samples were subjected to EDX testing, which was used for determining the atoms or elements in the sample. The EDX results were noted and have been discussed below. The EDX test indicated that the eco-bricks contained the maximal atomic percentage of carbon (C), i.e., 72.31%, followed by oxygen (O), i.e., 17.55%, nitrogen (N), i.e., 9.57%, silicon (Si), i.e., 0.2%, aluminium (Al), i.e., 0.12%, sodium (Na), i.e., 0.13%, calcium (Ca), i.e., 0.05%, and magnesium (Mg), i.e., 0.05%. Based on the atomic percentage values, carbon and oxygen are the two largest elements that form eco-bricks. Most of these carbon and oxygen elements are derived from PET plastics. Carbon and oxygen are the basic building blocks of PET plastic, whereas epoxy resin provides the nitrogen element, which contains a significant number of atoms.

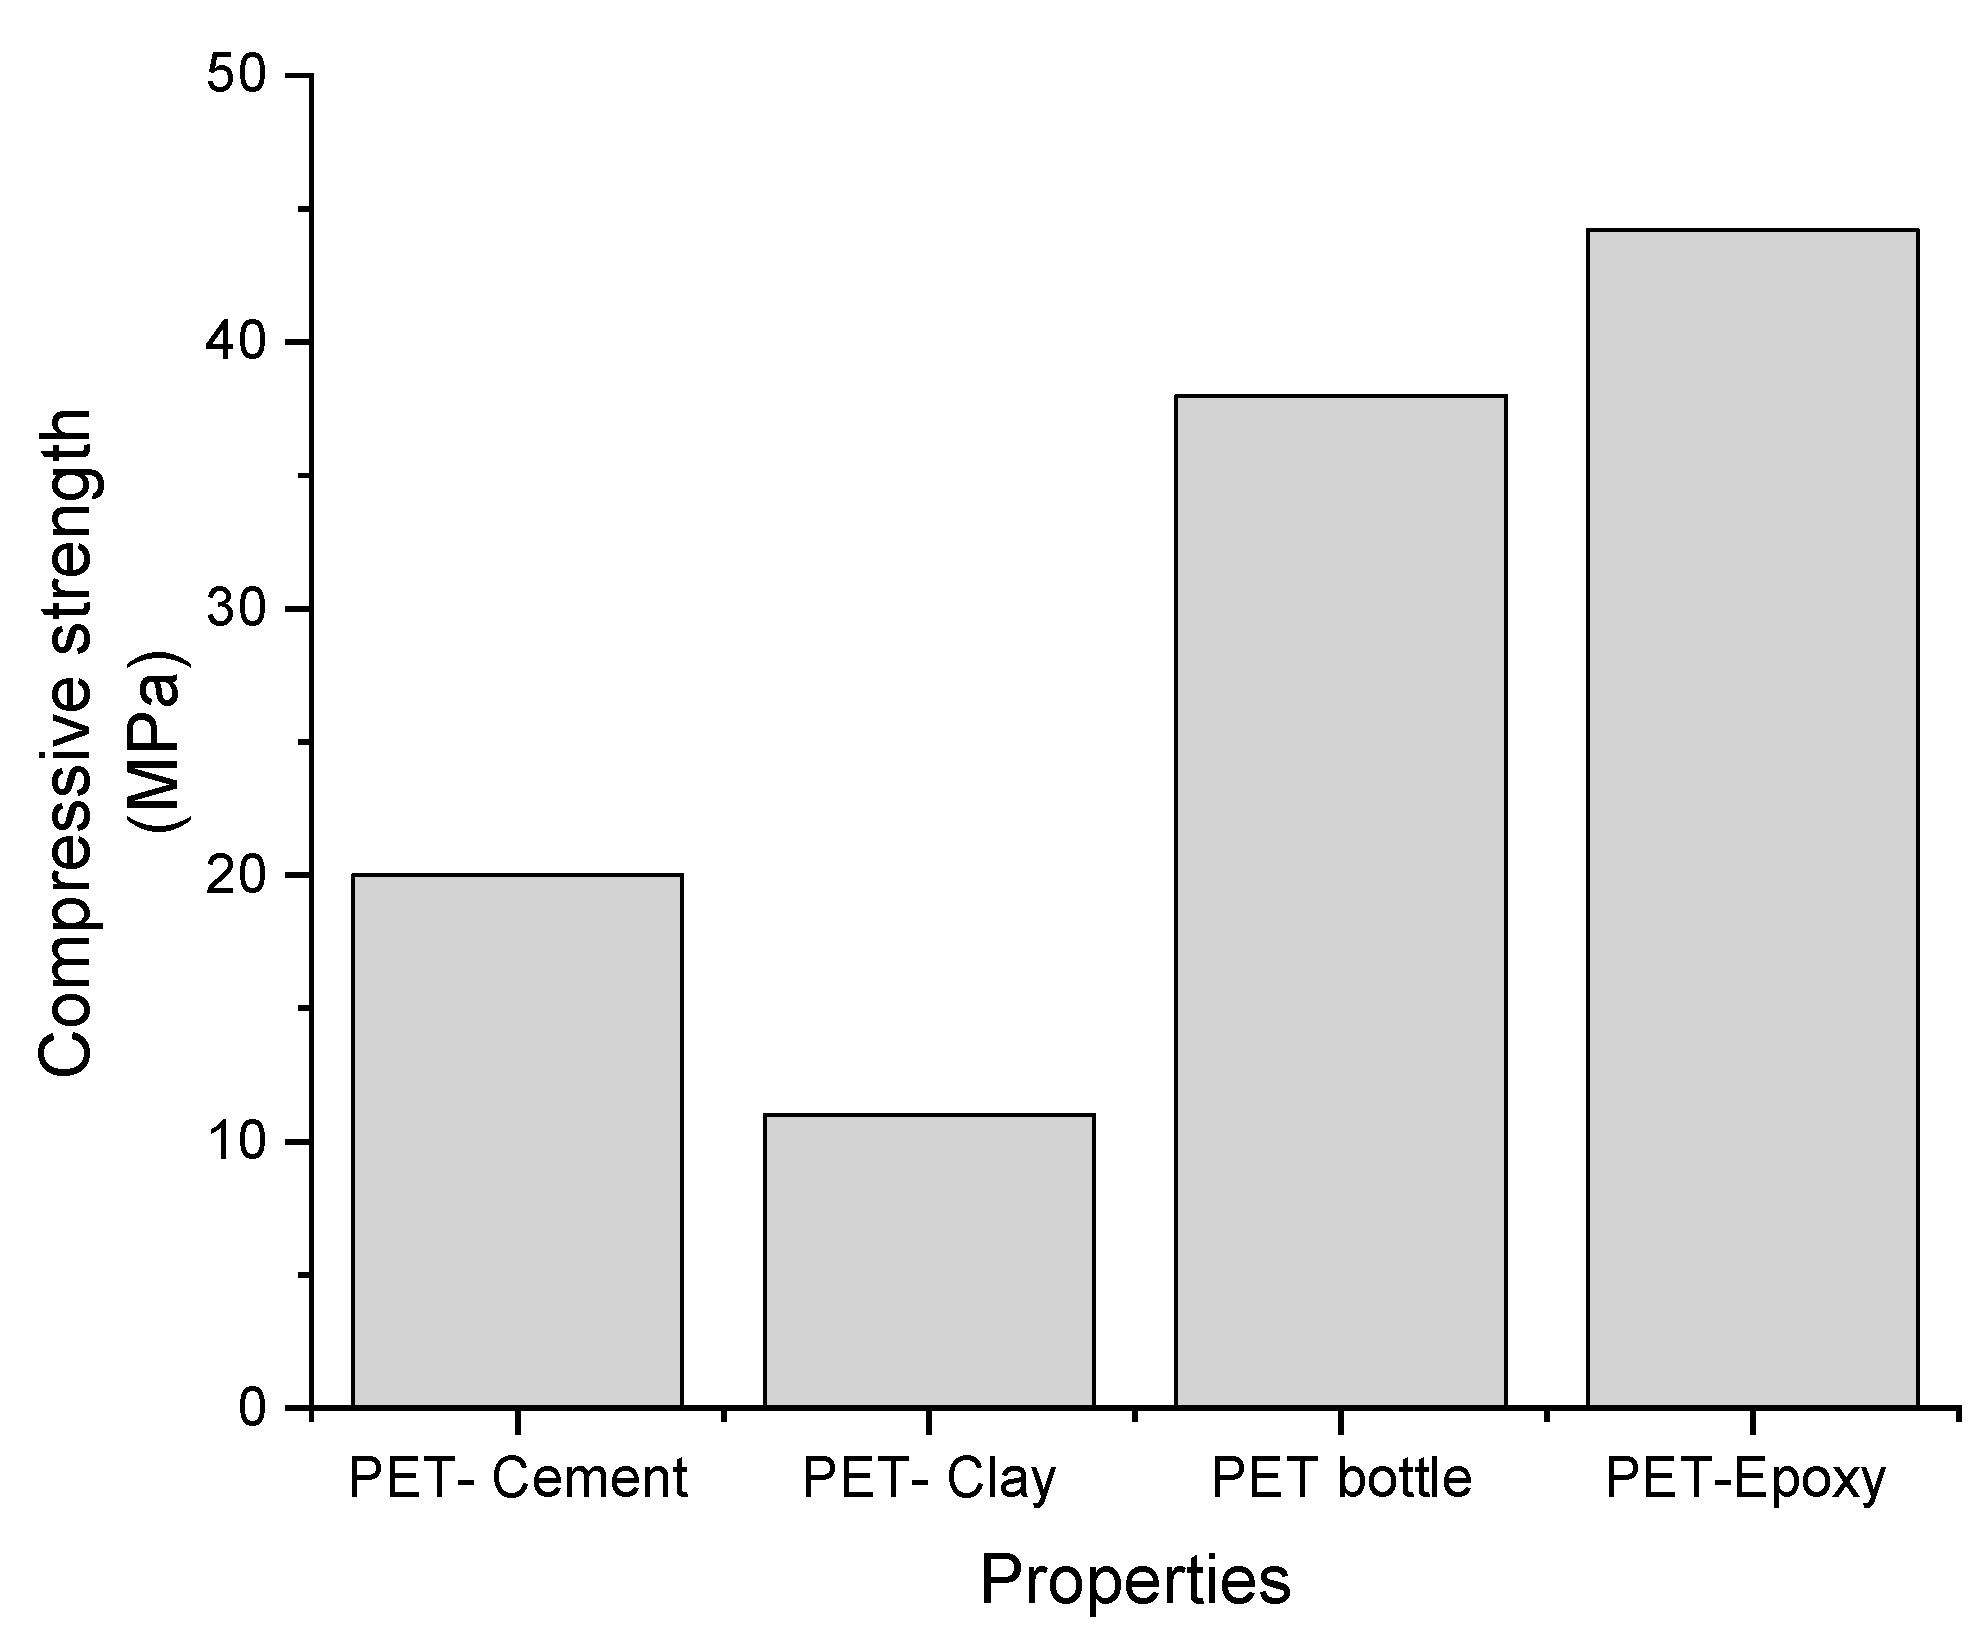
3.7. Comparison of the Other Bricks

The compressive strength value of eco-bricks with PET and epoxy resin materials has a greater value than other basic eco-bricks. A comparison of eco-brick compressive strength values can be seen in Table 15.
In this study, the compressive strength of PET-Cement, PET-Clay, PET bottle, and PET-epoxy resin was compared. The results of the compression test comparison can be seen in Figure 13. Eco-bricks mixed with epoxy resin and PET have higher compressive strength compared with the compressive strength of the other mixes.

4. Conclusions

The selection of materials that are used for constructing eco-bricks is a complicated technique that needs to be effectively and properly implemented for deriving the optimal output. The best composite mix can be determined using a variety of methods. The objective of this study was to determine the best mixture for constructing eco-bricks, which was developed using a combination of PET particles and epoxy resin. This study employed RSM to identify the interactions between the selected factors. In this study, three variables were used: ratio (%), PET particle size (mm), and curing duration (days). The characteristics affect the performance of the plastic waste, particularly the PET particles. As a result, the RSM-based CCD technique was used to analyse the effects of the PET and epoxy resin ratio, the size of the PET particles, and the curing duration. Any variable involved in enhancing the strength of the eco-bricks can be predicted using the RSM approach. In this study, the researchers used the compressive strength of the eco-bricks as a parametric factor. The proposed equation, which is based on a statistical model and regression analysis, offers an acceptable value for the eco-brick’s compressive strength. The statistical model yields significant results. The R2 value of the model was 0.9610, which was determined using the ANOVA analysis and depicted the reliability and accuracy of the model.
The optimal compressive properties were noted at a PET: epoxy resin ratio of 89.9%, a PET particle size of 1.1 mm, and a curing period of 6.9 days. The findings of this study suggest that CCD provides a time-saving and inexpensive technique for calculating the optimum mechanical properties. Plastic waste can be recycled and used as a binder material to make eco-bricks. It can increase the compressive strength and durability of bricks. The compressive strength of eco-bricks is significantly influenced by the ratio and curing time. As a result, the RSM approach is a sound modelling technique for predicting the optimum composition. The RSM method will speed up executing and analysing experiments and improve the performance and the reliability of the product. Finally, it can be stated that PET bottle waste and epoxy resin mixtures could be used as raw materials to construct eco-bricks without using the combustion process.

Author Contributions

Conceptualization, O.A.; methodology, O.A.; software, O.A. and M.F.; resources, M.I.R.; writing—original draft preparation, O.A.; writing—review and editing, E.M., I. and R.J.; supervision, E.M., I. and R.J. All authors have read and agreed to the published version of the manuscript.

Funding

This research was funded by Rabdan Academy Abu Dhabi and Universiti Teknikal Malaysia Melaka.

Institutional Review Board Statement

Not applicable.

Informed Consent Statement

Not applicable.

Data Availability Statement

Not applicable.

Acknowledgments

The authors are grateful to Rabdan Academy Abu Dhabi and Universiti Teknikal Malaysia Melaka (UTeM) for funding the research with the collaboration Universitas Ahmad Dahlan and Center of Energy and Environmental (PSEL).

Conflicts of Interest

The authors declare no conflict of interest.

References

  1. Murmu, A.L.; Patel, A. Towards sustainable bricks production: An overview. Constr. Build. Mater. 2018, 165, 112–125. [Google Scholar] [CrossRef]
  2. Zhou, C. Production of eco-friendly permeable brick from debris. Constr. Build. Mater. 2018, 188, 850–859. [Google Scholar] [CrossRef]
  3. Agyeman, S.; Obeng-Ahenkora, N.K.; Assiamah, S.; Twumasi, G. Exploiting recycled plastic waste as an alternative binder for paving blocks production. Case Stud. Constr. Mater. 2019, 11, e00246. [Google Scholar] [CrossRef]
  4. Khan, K.; Gudainiyan, J.; Iqbal, M.; Jamal, A.; Amin, M.N.; Mohammed, I.; Al-Faiad, M.A.; Abu-Arab, A.M. Modelling compression strength of waste PET and SCM blended cementitious grout using hybrid of LSSVM models. Materials 2022, 15, 5242. [Google Scholar]
  5. Liliani; Tjahjono, B.; Cao, D. Advancing bioplastic packaging products through co-innovation: A conceptual framework for supplier-customer collaboration. J. Clean. Prod. 2020, 252, 119861. [Google Scholar] [CrossRef]
  6. Wulandari, D.; Utomo, S.H.; Narmaditya, B.S. Waste bank: Waste management model in improving local economy. Int. J. Energy Econ. Policy 2017, 7, 36–41. [Google Scholar]
  7. Guebsi, W.; Zouari, A. Investigation on multi-criteria decision making methods application in sustainable product desig. SPEKTA J. Pengabdi. Kpd. Masy. Teknol. Dan Apl. 2022, 3, 91–104. [Google Scholar] [CrossRef]
  8. Movilla-Quesada, D.; Raposeiras, A.; Silva-Klein, L.; Lastra-González, P.; Castro-Fresno, D. Use of plastic scrap in asphalt mixtures added by dry method as a partial substitute for bitumen. Waste Manag. 2019, 87, 751–760. [Google Scholar] [CrossRef]
  9. Ariyani, D.; Warastuti, N.; Arini, R.N. Ecobrick method to reduce plastic waste in Tanjung mekar village, Karawang regency. Civ. Environ. Sci. 2021, 004, 022–029. [Google Scholar] [CrossRef]
  10. Limami, H.; Manssouri, I.; Cherkaoui, K.; Khaldoun, A. Study of the suitability of unfired clay bricks with polymeric HDPE & PET wastes additives as a construction material. J. Build. Eng. 2020, 27, 100956. [Google Scholar] [CrossRef]
  11. Edike, U.E.; Aina, O.; Adeoye, A.B. Adoption of eco-bricks for housing: The case of Yelwa, Nigeria. Afr. J. Sci. Technol. Innov. Dev. 2021, 14, 801–812. [Google Scholar] [CrossRef]
  12. Bahij, S.; Omary, S.; Feugeas, F.; Faqiri, A. Fresh and hardened properties of concrete containing different forms of plastic waste—A review. Waste Manag. 2020, 113, 157–175. [Google Scholar] [CrossRef]
  13. Rabello, L.G.; Ribeiro, R.C.D.C. A novel vermiculite/vegetable polyurethane resin-composite for thermal insulation eco-brick production. Compos. Part B Eng. 2021, 221, 109035. [Google Scholar] [CrossRef]
  14. Crespo-López, L.; Cultrone, G. Improvement in the petrophysical properties of solid bricks by adding household glass waste. J. Build. Eng. 2022, 59, 105039. [Google Scholar] [CrossRef]
  15. Shaqour, E.N.; Alela, A.H.A.; Rsheed, A.A. Improved fired clay brick compressive strength by recycling wastes of blacksmiths’ workshops. J. Eng. Appl. Sci. 2021, 68, 5. [Google Scholar] [CrossRef]
  16. Bezerra, M.A.; Santelli, R.E.; Oliveira, E.P.; Villar, L.S.; Escaleira, L.A. Response surface methodology (RSM) as a tool for optimization in analytical chemistry. Talanta 2008, 76, 965–977. [Google Scholar] [CrossRef]
  17. Tulashie, S.K.; Boadu, E.K.; Kotoka, F.; Mensah, D. Plastic wastes to pavement blocks: A significant alternative way to reducing plastic wastes generation and accumulation in Ghana. Constr. Build. Mater. 2020, 241, 118044. [Google Scholar] [CrossRef]
  18. Liu, L.; Cheng, X.; Miao, X.; Shi, Y.; Zhang, M.; Guo, M.; Cheng, F.; Zhang, M. Preparation and characterization of majority solid waste based eco-unburned permeable bricks. Constr. Build. Mater. 2020, 259, 120400. [Google Scholar] [CrossRef]
  19. Muyen, Z.; Barna, T.N.; Hoque, M.N. Strength properties of plastic bottle bricks and their suitability as construction materials in Bangladesh. Progress. Agric. 2016, 27, 362–368. [Google Scholar]
  20. Ongpeng, J.M.C.; Barra, J.; Carampatana, K.; Sebastian, C.; Yu, J.J.; Aviso, K.B.; Tan, R.R. Strengthening rectangular columns using recycled PET bottle strips. Eng. Sci. Technol. Int. J. 2020, 24, 405–413. [Google Scholar] [CrossRef]
  21. Li, J.; Peng, J.; Guo, S.; Zhang, L. Application of response surface methodology (RSM) for optimization of sintering process for the preparation of magnesia partially stabilized zirconia (Mg-PSZ) using natural baddeleyite as starting material. Ceram. Int. 2013, 39, 197–202. [Google Scholar] [CrossRef]
  22. Hassan, M.Z.; Sapuan, S.; Roslan, S.A.; Sarip, S. Optimization of tensile behavior of banana pseudo-stem (Musa acuminate) fiber reinforced epoxy composites using response surface methodology. J. Mater. Res. Technol. 2019, 8, 3517–3528. [Google Scholar] [CrossRef]
  23. Sinkhonde, D.; Onchiri, R.O.; Oyawa, W.O.; Mwero, J.N. Response surface methodology-based optimisation of cost and compressive strength of rubberised concrete incorporating burnt clay brick powder. Heliyon 2021, 7, e08565. [Google Scholar] [CrossRef] [PubMed]
  24. Bhairappanavar, S.; Liu, R.; Shakoor, A. Eco-friendly dredged material-cement bricks. Constr. Build. Mater. 2020, 271, 121524. [Google Scholar] [CrossRef]
  25. Kumar, G.S.; Sreerath, S. Development of Bricks Using Plastic Wastes; Springer International Publishing: Midtown Manhattan, NY, USA, 2021; Volume 97. [Google Scholar]
  26. Niyomukiza, J.B.; Nabitaka, K.C.; Kiwanuka, M.; Tiboti, P.; Akampulira, J. Enhancing Properties of Unfired Clay Bricks Using Palm Fronds and Palm Seeds. Results Eng. 2022, 16, 100632. [Google Scholar] [CrossRef]
  27. Kang, X.; Gan, Y.; Chen, R.; Zhang, C. Sustainable eco-friendly bricks from slate tailings through geopolymerization: Synthesis and characterization analysis. Constr. Build. Mater. 2021, 278, 122337. [Google Scholar] [CrossRef]
  28. Asdollah-Tabar, M.; Heidari-Rarani, M.; Aliha, M. The effect of recycled PET bottles on the fracture toughness of polymer concrete. Compos. Commun. 2021, 25, 100684. [Google Scholar] [CrossRef]
  29. Hou, D.; Chen, D.; Wang, X.; Wu, D.; Ma, H.; Hu, X.; Zhang, Y.; Wang, P.; Yu, R. RSM-based modelling and optimization of magnesium phosphate cement-based rapid-repair materials. Constr. Build. Mater. 2020, 263, 120190. [Google Scholar] [CrossRef]
  30. Dixit, S.; Yadav, V.L. Optimization of polyethylene/polypropylene/alkali modified wheat straw composites for packaging application using RSM. J. Clean. Prod. 2019, 240, 118228. [Google Scholar] [CrossRef]
  31. Taaffe, J.; O’Sullivan, S.; Rahman, M.E.; Pakrashi, V. Experimental characterisation of polyethylene terephthalate (PET) bottle eco-bricks. Mater. Des. 2014, 60, 50–56. [Google Scholar] [CrossRef]
  32. Wang, X.; Ma, B.; Chen, S.; Wei, K.; Kang, X. Properties of epoxy-resin binders and feasibility of their application in pavement mixtures. Constr. Build. Mater. 2021, 295, 123531. [Google Scholar] [CrossRef]
  33. Kaliyavaradhan, S.K.; Li, L.; Ling, T.-C. Response surface methodology for the optimization of CO2 uptake using waste concrete powder. Constr. Build. Mater. 2022, 340, 127758. [Google Scholar] [CrossRef]
  34. Abdulwahed, H.S.; Aljanabi, K.R.; Abdulkareem, A.H. Optimization of equivalent modulus of RAP-geopolymer-soil mixtures using response surface methodology. J. King Saud Univ. Eng. Sci. 2022, in press. [Google Scholar] [CrossRef]
  35. Abdulredha, M.M.; Hussain, S.A.; Abdullah, L.C. Optimization of the demulsification of water in oil emulsion via non-ionic surfactant by the response surface methods. J. Pet. Sci. Eng. 2019, 184, 106463. [Google Scholar] [CrossRef]
  36. Maharaj, C.; Maharaj, R.; Maynard, J. The effect of polyethylene terephthalate particle size and concentration on the properties of asphalt and bitumen as an additive. Prog. Rubber Plast. Recycl. Technol. 2015, 31, 1–23. [Google Scholar] [CrossRef]
  37. Albano, C.; Camacho, N.; Hernández, M.; Matheus, A.; Gutiérrez, A. Influence of content and particle size of waste pet bottles on concrete behavior at different w/c ratios. Waste Manag. 2009, 29, 2707–2716. [Google Scholar] [CrossRef]
  38. Ikechukwu, A.F.; Awuzie, B.O.; Mostafa, M.M.; Okorafar, C. Durability assessment and microstructure of high strength performance bricks produced from PET waste and foundry san. Materials 2021, 14, 1–19. [Google Scholar] [CrossRef]
  39. Song, J.; Xu, M.; Tan, C.; You, F.; Wang, X.; Zhou, S. Study on an epoxy resin system used to improve the elasticity of oil-well cement-based composites. Materials 2022, 15, 5258. [Google Scholar] [CrossRef]
  40. Del Rey Castillo, E.; Almesfer, N.; Saggi, O.; Ingham, J.M. Light-weight concrete with artificial aggregate manufactured from plastic waste. Constr. Build. Mater. 2020, 265, 120199. [Google Scholar] [CrossRef]
  41. Akinyele, J.O.; Igba, U.; Adigun, B. Effect of waste PET on the structural properties of burnt bricks. Sci. Afr. 2020, 7, e00301. [Google Scholar] [CrossRef]
Figure 1. Plastic particles size.
Sustainability 15 04271 g001
Figure 2. Grading curve of PET particles.
Sustainability 15 04271 g002
Figure 3. Modelling process.
Sustainability 15 04271 g003
Figure 4. Normal probability vs. external residual plot.
Sustainability 15 04271 g004
Figure 5. Estimated vs. Actual Values.
Sustainability 15 04271 g005
Figure 6. Residual vs. predicted values.
Sustainability 15 04271 g006
Figure 7. Contour and surface plots. (a) 2D and 3D contour plot ratio vs. size. (b) 2D and 3D contour plot ratio vs. curing time. (c) 2D and 3D contour plot size vs. curing period.
Sustainability 15 04271 g007aSustainability 15 04271 g007b
Figure 8. Ratio, particle size, and curing period vs. compression characteristics. (a) Ratio vs. compression assessment. (b) PET particle size vs. compression assessment. (c) Curing duration vs. compression assessment.
Sustainability 15 04271 g008
Figure 9. Perturbation plot.
Sustainability 15 04271 g009
Figure 10. Ramp-type optimal operating conditions.
Sustainability 15 04271 g010
Figure 11. SEM images—1000× magnification and 2000× magnification. (a) SEM analysis of an eco-brick; magnification 1000×. (b) SEM analysis of an eco-brick; magnification 2000×.
Sustainability 15 04271 g011
Figure 12. SEM image of eco-brick material.
Sustainability 15 04271 g012
Figure 13. Compressive strength comparison of eco-bricks.
Sustainability 15 04271 g013
Table 1. Physicochemical characteristics of epoxy resin [32].
TypeViscosity (MPa·s)Density (g/cm3)Epoxy Number (mol/100 g)Molecular Weight
(g/mol)
Bisphenol A epoxy resin30.0001.170.49450
Table 2. Physical and mechanical properties [32].
Physical and Mechanical Properties of PETCharacteristics
ColourClear
Shape of particleFlat
Specific gravity1.42
Specific density̴1.35 g/cm3
Bulk density̴550 kg/m3
Size1 mm, 3 mm, 5 mm
Tensile strength59.8 MPa
Viscosity0.62 to 0.75 dL/g
Approx. melting point200–250 °C
Table 3. Construction factors.
ReferencesFactor
[36]Size and volume
[37]Size
[17]Size and volume
[18]Size
[19]Size
[27]Curing time
[20]Curing time and size
[10]Curing time and size
Table 4. Factor Levels.
Ratio
(X1; Epoxy: PET Particle; %)
Size Particles
(X2, mm)
Curing Time
(X3, days)
10 (minimal)1 (minimal)1 (minimal)
90 (maximal)5 (maximal)7 (maximal)
Table 5. Factors and their variation range.
FactorsCoded Level
−101
X1 = ratio Epoxy resin: PET particles105090
X2 = Size particles135
X3 = Curing time147
Table 6. Full factorial central composite design for optimization.
Experiment CodeFactor
X1
Ratio Epoxy Resin: PET Particles
X2
Size Particles
X3
Curing Time
%mmdays
10−10
211−1
3000
4000
5100
6−11−1
7000
8010
900−1
10−111
11001
12111
131−1−1
14−100
15−1−11
16−1−1−1
171−11
Table 7. Empirical and predicted data.
Standard OrderRun OrderFactorsResponse
Compression Test (MPa)
Residual
1
(Ratio)
2
(Size)
3
(Curing Time)
ExperimentPredicted
91103432.5031.510.9931
12101126.7827.31−0.5352
173503435.0235.25−0.2313
74105730.6131.08−0.4615
145503739.9439.220.7184
116501433.1936.56−3.37
67901744.1244.32−0.2032
158503436.0935.250.8385
139503131.6531.280.3773
510101743.0241.371.65
311105128.1726.271.90
1212505429.9333.94−4.00
1613503433.8235.25−1.43
1014903438.3138.99−0.6756
215901135.3933.242.16
816905742.3540.122.23
417905138.3238.280.0410
Table 8. ANOVA Assessment Outcomes.
SourceSum of SquaresdfMean SquareF-Valuep-ValueSignificance
Model357.01939.6719.160.0004Significant
A-Ratio185.641185.6489.66<0.0001
B-Size5.5515.552.680.1456
C-Curing Time115.911115.9155.980.0001
AB5.3015.302.560.1538
AC0.009510.00950.00460.9479
BC20.55120.559.930.0161
A25.5915.592.700.1442
B215.40115.407.440.0295
C29.0119.014.350.0754
Residual14.4972.07
Lack of Fit11.9252.381.850.3865Not significant
Pure Error2.5721.29
Cor Total371.5016
Table 9. Model summary statistic.
Std.Dev.1.44R20.9610
Mean34.91Adjusted0.9108
C.V. %4.12Predicted0.6925
Table 10. Coefficient estimates of the model.
FactorCoefficient EstimatedfStandard Error95% CI Low95% CI HighVIF
Intercept34.4010.615732.9435.85
A-Ratio (X1)4.3110.45503.235.381.0000
B-Size (X2)−0.744910.4550−1.820.33111.0000
C-Curing time (X3)3.4010.45502.334.481.0000
AB (X1X2)0.813610.5087−0.38942.021.0000
AC (X1X3)−0.034510.5087−1.241.171.0000
BC (X2X3)−1.6010.5087−2.81−0.39991.0000
A21.4510.8791−0.63373.521.54
B2−2.4010.8791−4.48−0.31851.54
C21.8310.8791−0.24453.911.54
Table 11. Validation optimization based on experimental results.
Validation RunInput ParametersOutput
X1
(Ratio)
X2
(Size)
X3
(Curing Time)
Compressive Strength (MPa)
189.461.086.9944
289.461.086.9943
389.461.086.9945
Table 12. RSM model validation data set for compressive strength response.
ResponsePredicted MeanPredicted MedianStd DevStd DevnSE Pred95% PI LowData Mean
Compressive strength45.011745.01171.632691.6326931.6974240.99844
Table 13. Range of factors and expected target of response.
Optimized ItemUnitLower LimitUpper LimitDesired Goal
Volume%1090In range
Particle sizemm15In range
Curing timeday17In range
Compressive strengthMPa26.779444.162Maximum
Table 14. EDX Results on Eco-bricks.
Element
Number
Element
Symbol
Element
Name
Atomic
Conc. (%)
6CCarbon72.31
8OOxygen17.55
7NNitrogen9.57
14SiSilicon0.20
13AlAluminium0.12
11NaSodium0.13
20CaCalcium0.05
12MgMagnesium0.05
Table 15. Comparison of eco-brick production based on compressive strength.
MixingMaximal MPaReference
PET and cement20[40]
PET and clay11.02[41]
PET bottle38[31]
Disclaimer/Publisher’s Note: The statements, opinions and data contained in all publications are solely those of the individual author(s) and contributor(s) and not of MDPI and/or the editor(s). MDPI and/or the editor(s) disclaim responsibility for any injury to people or property resulting from any ideas, methods, instructions or products referred to in the content.

