Article

Characterizing Informal Settlement Dynamics Using Google Earth Engine and Intensity Analysis in Durban Metropolitan Area, South Africa: Linking Pattern to Process

by
Dadirai Matarira
1,
Onisimo Mutanga
2,
Maheshvari Naidu
3,
Terence Darlington Mushore
1,4 and
Marco Vizzari
5,*
1
School of Agriculture, Earth and Environmental Science, University of KwaZulu-Natal, P. Bag X01 Scottsville, Pietermaritzburg 3209, South Africa
2
Department of Geography, University of KwaZulu-Natal, P. Bag X01 Scottsville, Pietermaritzburg 3209, South Africa
3
School of Social Sciences, University of KwaZulu-Natal, Durban 4041, South Africa
4
Department of Space Science and Applied Physics, Faculty of Science, University of Zimbabwe, 630 Churchill Avenue, Mt Pleasant, Harare 00263, Zimbabwe
5
Department of Agricultural, Food and Environmental Sciences, University of Perugia, 06121 Perugia, Italy
*
Author to whom correspondence should be addressed.
Sustainability 2023, 15(3), 2724; https://doi.org/10.3390/su15032724
Submission received: 23 December 2022 / Revised: 18 January 2023 / Accepted: 26 January 2023 / Published: 2 February 2023
(This article belongs to the Special Issue Application of Remote Sensing for Sustainable Development)

Abstract

:
The growing population in informal settlements expedites alterations in land use and land cover (LULC) over time. Understanding the patterns and processes of landscape transitions associated with informal settlement dynamics in rapidly urbanizing cities is critical for better understanding of consequences, especially in environmentally vulnerable areas. The study sought to map and systematically analyze informal settlement growth patterns, dynamics and processes, as well as associated LULC transitions in Durban Metropolitan area, from 2015 to 2021. The study applied an object-based image classification on PlanetScope imagery within the Google Earth Engine (GEE) platform. Further, intensity analysis approach was utilized to quantitatively investigate inter-category transitions at category and transition levels. Thus far, no study of land conversion to and from informal settlement areas in South Africa has exploited both GEE and intensity analysis approaches. The results suggest spatial growth of informal settlements with a total net gain of 3%. Intensity analysis results at category level revealed that informal settlements were actively losing and gaining land area within the period, with yearly gain and loss intensity of 72% and 54%, correspondingly, compared to the uniform intensity of 26%. While the growth of informal settlements avoided water bodies over the studied period, there was an observed systematic process of transition between informal settlements and other urban land. Government policy initiatives toward upgrading informal housing could be attributed to the transitions between informal and other urban settlements. This study illustrates the efficacy of intensity analysis in enhancing comprehension of the patterns and processes in land changes, which aids decision making for suitable urban land upgrading plans in the Durban Metropolitan area.

1. Introduction

Globalization, typifying advancements in the economic and social dimensions [1], has stirred urban population dynamics, with subsequent emergence of social inequalities in most cities of the Global South [2]. Informal settlements are growing at unprecedented rates in response to disjointed urbanization [3], instigating major land use/land cover (LULC) changes, with implications on functioning of urban landscape components and disaster risk [4,5]. Urban poverty, lack of cities’ capacities to meet increasing housing demands, inability of states or the market to provide affordable housing for the urban poor, combined with the inability to provide basic services, drive the growth and persistence of informal settlements [5,6]. Diverse morphological characteristics of informal settlements worldwide, from country to country, within the same country, across cities, across informal settlement areas within the same city, or within the same informal settlement landscape [7] help explain various names used to refer to these settlements. For instance, when considering tenure status, settlements are usually denoted as “illegal”, “squatter, or “informal” [8]. In the context of growth dynamics, they are referred to as “spontaneous” or “irregular” [9]. Such morphologic variations also explain diversities of growth patterns from place to place [4,10]. Systematic empirical analysis of informal settlement growth patterns and comprehension of associated LULC transitions are critical in addressing questions that deal with how much, what kind of land is consumed and the process at play [11]. Subsequent findings would be key in the modelling of future rates of change, with potential to reveal insights on better matched solutions, whether in the form of informal settlement management policies or adaptive strategies [12,13].
With its characteristic repeat coverage, remote sensing is an important data source for producing consistent and easily updateable land use maps that allow detection of relationships between different classes of LULC changes [14]. In recent times, increasing availability of high-resolution time series data within the GEE data archives has brought forth robustness in mapping urban area LULC changes. Since the advent of GEE, scores of studies have harnessed GEE’s powerful image processing capabilities in accessing multi-temporal data, as well as its estimation tools for change detection analyses in broader urban areas [15,16,17]. For instance, Celik [18] investigated the possibilities of identifying changed areas in Ankara, Turkey, using Sentinel-1 and Sentinel-2 within GEE. In one study, Mugiraneza, et al. [16] used Landsat data for continuous monitoring of urban land cover change trajectories in Kigali Rwanda. In another study, Zurqani, et al. [19] mapped urban growth trends in a forested landscape in the southeastern United States. These analyses were able to identify the patterns, magnitude, as well as rates of LULC changes [12]. However, some studies [20,21,22] have discounted net change analyses due to failure to account for all area gains and losses, and incapacity to offer in-depth signals concerning land changes as well as insight into the underlying processes [22,23,24]. Inasmuch as zero net change may ordinarily mean absence of change, there could be a probability of location changes or swapping among categories [12]. A comprehensive understanding of observed change patterns and their link with processes responsible for the changes is insightful as it allows integration of remote sensing and social science in developing sustainable urban management policies [10].
Intensity analysis framework analyzes land cover changes by considering categorical transitions with regard to gains, losses, net change and swapping [25]. Apart from being designed to gain in-depth understanding of factors and processes driving LULC changes, the mathematical approach allows visualization of both the size and intensity of land transitions and evaluates the consistency and irregularity of the LULC patterns [26,27]. Intensity analysis is designed to explore changes among land categories at three levels: interval, category and transition, quantifying the deviation between observed change intensity and hypothesized uniform change intensity [28]. In addition to consideration of the sizes of categories in the calculation of change intensities [29,30], the approach allows detection of systematic and random processes of landscape transitions [12,31]. Identifying the processes at play would aid in relating the observed change patterns to possible causes and potential pressures on environmental sustainability [31,32].
A plethora of studies have successfully employed intensity analysis in various applications [28,30,33,34,35,36]. In an earlier study, Gandharum, et al. [37] used Landsat data to produce LULC maps within GEE and incorporated intensity analysis, simultaneously, to analyze influence of urban growth on agricultural land in the North Coastal region of West Java Province. In another study, Tong, et al. [36] employed intensity analysis and barycenter migration models to investigate land use dynamics from 1990 to 2015 in four municipalities of China (Beijing, Tianjin, Shanghai and Chongqing). Results of intensity analysis revealed that transitions were mainly between arable land and construction land. In addition, Nyamekye, et al. [35] utilized a combined approach of machine learning and intensity analysis to investigate the changes among the major LULC categories in New Juaben Municipality, Ghana. Their results indicated that transitions between built-up and agricultural land were the most prominent. Mushore, et al. [34] used local climate zones (LCZs) and intensity analysis to assess the influence of long-term urban growth on surface urban heat islands. Results of transition level intensity demonstrated that growth of built LCZs was rampant in areas designated as water, low plants and dense forest LCZ in the two analyzed intervals (2005–2020). Notably, the majority of the aforementioned studies focused on the broader LULC changes involving built up areas, a broad class including all impervious surfaces in a locality. In one of the first attempts, Badmos, et al. [10] applied intensity analysis for the quantification of yearly change intensities at categorical and transitional levels, relating patterns and processes of informal settlement expansion in Lagos city. Their results revealed that, at the category level, slums gained and lost land area, simultaneously. One of the explanations for the gain was encroachment onto bodies of water and vacant space. Most importantly, the loss was explained in terms of gentrification and demolition processes.
Durban is a city with rapidly expanding informal settlement landscape. The city’s spatial structure is neither shaped by planned growth nor is it a vision of urban form, but a result of legacy of past Apartheid-based planning [38]. The legacy has caused inequalities in access to decent housing causing spread of lower income settlements that are usually located on precarious land [39]. According to Mazeka, et al. [40], the spatial expansion of informal settlements in Durban in 2000 led to the expansion of its area by 68%, leading to redefinition of the city boarders. Reflecting on the morphology of informal settlements in Durban, the informal settlements locate close to road networks, on vacant land, steep slopes sometimes characterized by fragile soils, and follow natural features such as rivers or ravines [41]. Such locations make the residents vulnerable to landslides and flood hazards during extreme climatic conditions. Of late, Durban has been experiencing worse climate scenarios in terms of flood hazard, with informal settlement dwellers being the worst affected. For instance, Quarry Road settlement had on several occasions been badly affected by impacts of floods, with the huge impacts being attributed to their location on a road reserve and flood plain [42,43,44]. Despite the flood impacts, Quarry Road West has also undergone several periods of rapid expansion, with most of these occurring just after a significant flood [45]. Such developments create evidence that, while the mapping of perimeter extensions serves as a tool to confirm the challenges and resilience of informal settlements [13], in-depth analysis is required to link the pattern and the process, and subsequently establish the possible driving forces. In support, Manzoor, et al. [46] iterated that intensity analysis can support evidence for a hypothesized change process and, sometimes, potential for development of new hypotheses. According to Solecki, et al. [11], lack of intrinsic analysis of the fundamentals involved in land use change makes interpretations fragmented, lacking scientific consensus on which to build evidence based policies. Therefore, there is need for in-depth analysis such as authored by intensity analysis in order to improve interpretation of land use changes especially in complex settings of informal settlements.
Owing to this background, the current study sought to exploit the intensity analysis approach to quantitatively measure the spatiotemporal changes of LULC and understand the dynamics of informal settlements in Durban over a period of six years. Currently, there are limited land change studies in South Africa [39]. Moreso, most previous land cover change studies in Durban concentrated on general land changes with focus on the transitions between vegetation and broader built-up land, but little focus on informal settlements [39,40,47]. The aforementioned studies largely used the “from–to” change detection approach which is not as revealing of the change process as intensity analysis. In addition to the usual “from–to” analysis, intensity analysis also calculates important information such as which transitions are targeted or avoided by specific classes during a period. Intensity analysis not only shows changes in coverage of informal settlements but also has potential to depict and quantify the land use and land cover types that were affected by their dynamics. Interestingly though, Jewitt, et al. [48] earlier attempted to apply intensity analysis to systematically analyze land cover changes in Kwa-Zulu Natal Province, South Africa but with focus on impacts of the changes on biodiversity loss.
The current study expands on work by Gandharum, et al. [37] in the combined use of GEE and intensity analysis. While Gandharum, et al. [37] successfully combined the two approaches, their focus was on agricultural land, and without emphasis on other important applications of the intensity approach that link patterns to causes of change. In the study in Lagos, Badmos, et al. [10] characterized informal settlement growth over one time period using RapidEye data, but without exploiting GEE provisions. Thus, to the best of the authors’ knowledge, to date, no study has made a combined application of intensity analysis and GEE for in-depth analysis of complex, spatial and temporal patterns in informal settlement dynamics in urban areas, especially in South Africa. Furthermore, there is lack of literature on studies which integrate PlanetScope and S1 data within GEE for characterization of spatial and temporal patterns in informal settlements. Given the irregular nature and perceived expansion of informal settlements globally, it is crucial to understand area specific patterns in order to inform policies and strategies to ensure sustainable growth of cities. Most importantly, knowing how much and what kind of land use is consumed by informal settlements informs authorities about potentially threatened ecosystems, possibly located on marginal lands which could be threatened by natural or man-made disasters.
Badmos, et al. [10] conducted an in-depth analysis of informal settlement patterns in Lagos where spatial structures, temporal trends and government policies differ from those in South Africa. The current study provides an analysis specific to Durban, which is important for regional and international comparison, as well as for guidance of formulation of government and local policies and strategies toward sustainable and smart cities in South Africa. The specific objectives of the study are thus: (1) to determine and examine spatiotemporal changes in LULC from 2015 to 2021 in Durban informal settlement landscape; (2) to measure the intensity of land cover alterations involved during informal settlement expansion process; and (3) to link the informal settlement growth patterns with processes in land transitions together with related national policy factors.

2. Materials and Methods

2.1. Study Area

The area of study encompasses part of Durban metropolitan region, which includes the central city area of Durban. It is located in the province of KwaZulu-Natal, South Africa (Figure 1a) and stretches from 30°55′00″ E to 31°00′30″ E and from 29°50′30″ N to 29°47′30″ N, occupying an area of 7410 ha. Durban is characterized by an estimated population of 3.6 million [43]. The topography of the area is steep and highly undulating, ranging from about 30 m to 120 m above sea level. The humid subtropical climate, with mean annual precipitation exceeding 1000 mm per annum characterizes Durban [45]. In addition, warm, wet summers and mild, dry winters form part of the climate of the city. The morphological informal settlements in Durban follow a steep topography and often lead down to Umgeni River, making the residents vulnerable to flood hazards during extreme climatic conditions. Their location on vacant land, low land areas, and steep slopes, sometimes characterized by fragile soils [41] often contributes to their exposure to landslides and flood hazards. For instance, the Havelock informal settlement is located on privately owned land and a portion is within the Durban Metro Open Space System [49], while the Quarry Road settlement is partly in close proximity to the road network and in a flood plain. Durban’s landscape is described as complex, in terms of both physical and biological diversity perpetuated by varied use and ownership of the landscape [48].
The workflow of this approach mainly included (1) image collection, pre-processing, and composition; (2) image segmentation and texture feature extraction [50]; (3) object-based image classification and accuracy assessment; and (4) LULC change and intensity analysis (Figure 2). The first step involved the collection of PlanetScope and Sentinel-1 images for the chosen period and study area. Secondly, segmentation of the image into clusters was performed using SNIC algorithm whereas GLCM algorithm was computed for the calculation of texture metrics using PlanetScope data. Thirdly, object-based classification was performed using random forest protocol with subsequent accuracy assessment performed using confusion matrix. Fourth, a cross tabulation matrix was produced in ARGIS Pro, and finally, intensity analysis was performed using Pontius Excel file.

2.2. Data Collection and Preprocessing

The study utilized data from optical and SAR (Synthetic Aperture Radar), PL and S1 that fell within the study period (1 June 2021 to 31 December 2021). PL imagery is acquired by 120 CubeSat 3U satellites measuring 10 cm × 10 cm × 30 cm, referred to as a dove [51]. PL sensors can detect four spectral bands (RGB and NIR) with a spatial resolution of 3–5 m. PL high-resolution composite base maps have recently become accessible in GEE for tropical regions, thanks to a partnership between Google and the NICFI (Norway’s International Climate and Forest Initiative). For the study period, PL images are available in GEE as cloud-free monthly composites. Normalized difference vegetation index (NDVI), and normalized difference water index (NDWI) were calculated from PL data. NDVI and NDWI have been extensively used to improve the accuracy of classification in complex environments [52,53]. The NDVI layer was calculated from the red (B3) and near-infrared (B4) bands of the PL image, while NDWI was calculated from the green (B2) and near-infrared (B4) bands of the same satellite. S1 carries a single C-band synthetic aperture radar instrument that supports operation in single polarization (HH or VV) and dual polarization (HH + HV or VV + VH). The study utilized two diverse polarization modes, which include single co-polarization with vertical transmit/receive (VV) and dual-band co-polarization with vertical transmit and horizontal receive (VH). Following Vizzari [54], the ratio between two polarization modes was used to create an additional band, VH_VV. The ratio feature partially compensates for the radiometric instability of the sensor and shows higher stability than the single polarization [55]. The mean values were obtained in GEE with a simple “reduce” step for all the PL and S1 bands and derived indices, thus creating 6-month composite images.

2.3. Object-Based Image Classification

Object-based image analysis (OBIA) was utilized in the preparation of LULC maps for the 2015 and 2021 time points, within the GEE. OBIA involves segmentation of images, that is, splitting an image into homogeneous clusters of pixels called segments [56]. According to Mui, et al. [57] the packaging of pixels into discrete objects minimizes the variance experienced by high spatial resolution images, allowing the objects, rather than individual pixels to be classified. In the current study, image segmentation was performed using the SNIC algorithm within the GEE environment. SNIC categorizes the objects (clusters) according to set input parameters, visits pixels only once and clusters pixels without iterations [58]. SNIC analysis was executed on the visible and NIR (4) bands of PL datasets, segmenting the image into a set of superpixels. Contextual information in the form of textural information was also extracted from the segments using GLCM algorithm within the GEE [54]. Following prior studies that have incorporated image texture in OBIA for informal settlement detection [59,60,61,62], contrast, entropy, variance, homogeneity, mean and angular second moment were the texture indices employed in the mapping. Object-based classification was carried out on the composite image made from mean bands of PL and S1. The LULC classification scheme included informal settlements, bare land, other urban, water and vegetation. Table 1 shows LULC class descriptions. One thousand seven hundred fifty random sample points were collected and classified using high spatial resolution imagery. These points were used to train the RF classifier (70%) and to validate the final LULC classification results (30%).

2.4. Land-Cover Transition Matrix

A post-classification technique was utilized for detection of transitions in the land use maps over the study period. The post-classification was explored because of its provision of change matrix for different categories [29]. Superimposition of the LULC maps generated a transition matrix for 2015 and 2021. The matrix shows areas that transition from the initial category to the subsequent category [33]. The study exploited the thematic change workflow in ArcGIS Pro software for detection of the spatial changes in absolute terms, as well as through consideration of inter-category transitions to and from informal settlements. The transition matrix/cross-tabulation matrix became the input for intensity analysis for the time period.

2.5. Intensity Analysis

Intensity analysis is a mathematical approach that examines LULC dynamics through calculation of categorical changes in relation to the sizes of the categories and the intensities of change [35,63]. The approach depends on accessibility of maps for disparate time points for the same area and consisting of similar land cover categories. Because of limited availability of temporal data at high resolution, the current study’s focus was on one time period (2015–2021). In this study, intensity analysis was carried out on category, and transition levels using a PontiusMatrix41.xlsx available for free from www.clarku.edu/~rpontius and developed by Aldwaik and Pontius Jr. [25] (accessed 25 October 2022).

2.5.1. Category Level Analysis

The category level of analysis focuses on intensity of gain or loss of each land use type in the time interval [63]. Category analysis entailed examination of the degree and magnitude of gross gains and gross losses in five LULC classes and among different categories during time interval t (where t represents the time interval period 2015 to 2021), producing change trends for each individual LULC category. According to Quan, et al. [30], there is a common hypothesis with regard to the category level suggesting that for each interval all categories undergo gross loss and gross gain with the same yearly intensity. The intensity of a uniform change during interval t is St. Equation (1) calculates the uniform intensity by dividing size of the transition by length of the time interval resulting in a percentage of spatial extent. Using Equation (2) a category’s annual gross gain intensity (Gtj) in an interval is determined by the size of the category’s annual gross gain divided by the size of the category at the final stage of each time interval [30]. On the other hand, a category’s yearly gross loss intensity [64] in an interval is attained using Equation (3) by dividing the size of the category’s yearly gross loss by the size of the category at the starting point of each interval.
The annual percentage of the study area that changed during the time interval, St, is calculated by:
S t = C h a n g e   d u r i n g   [ Y t , Y t + 1 ] ( D u r a t i o n   o f   [ Y t , Y t + 1 ] ( E x t e n t   S i z e ) · 100 % = j = 1 j ( i = 1 j C t i j ) C t i j ( Y t + 1 , Y t ) ( j = 1 j j = 1 j C t i j ) · 100 %
The gross gain intensities, Gtj, were calculated by:
G tj = A n n u a l   g a i n   o f   j   d u r i n g   [ Y t , Y t + 1 ] S i z e   o f   j   a t   Y t + 1 · 100 % = [ ( i = 1 j C t i j ) C t i j ] / ( Y t + 1 Y t ) i = 1 j C t i j · 100 %
The gross loss intensities, Lti, were calculated by:
L ti = A n n u a l   l o s s   o f   i   d u r i n g [ Y t , Y t + 1 ] S i z e   o f   i   a t   Y t · 100 % = [ ( i = 1 j C t i j ) C t i j ] / ( Y t + 1 Y t ) i = 1 j C t i j · 100 %
Category level also provides information on all the dormant and active categories during that time period [10]. If Lti < St, or Gtj < St then we say the respective loss from category i or gain to category j during interval t is dormant. On the other hand, if Lti > St, or Gtj > St, then the respective loss from category i or gain to category j is considered active within the time interval t. Table 2 shows descriptions of mathematical notations used in the equations involving intensity analysis at both category and transition levels.

2.5.2. Transition Level Analysis

Intensity analysis at transition level evaluates which land-cover categories transition to which other land-cover categories in a process expressed as either “targeting” or “avoidance” [46]. At this level, the size and intensity of transitions as category gains from other categories are calculated [37]. In this study, the transition level focuses on informal settlement areas. Equations (4) and (5) represent the transition level equations. Equation (4) calculates observed intensity Rtin of annual transition from category i to category n for a given time period relative to the size of category i at the start of the interval [12]. It is the transition intensity from category i to category n where in. The observed intensity Rtin is compared with uniform intensity Wtn calculated using Equation (5) which assumes that category n gains uniformly across the landscape. If Rtin > Wtn, the gain of category n is considered to target category i at time t. In the event that Rtin < Wtn, the gain of category n is seen as avoiding the category i at time t.
R tin   =   S i z e   o f   a n n u a l   t r a n s i t i o n   f r o m   i   t o   n   d u r i n g   [ Y t ,   Y t + 1 ] s i z e   o f   i   a t   t   =   C t i n / ( Y t + 1 Y t ) j = 1 J C t i j · 100 %
The uniform intensity for category n, Wtn, which distributes the intensity of annual transition gains to category n uniformly across the study area, is calculated by:
W tn   =   S i z e   o f   a n n u a l   g a i n   o f   n   d u r i n g   [ Y t ,   Y t + 1 ] s i z e   o f   n o t   n   a t   t     =   [ ( i = 1 J C t i n ) C t n n ] / ( Y t + 1 Y t ) j = 1 J [ ( i = 1 J C t i j ) C t n j ] · 100 %
The transition level intensity allows the identification of which land use categories are targeted or avoided during the process of informal settlement expansion.

3. Results

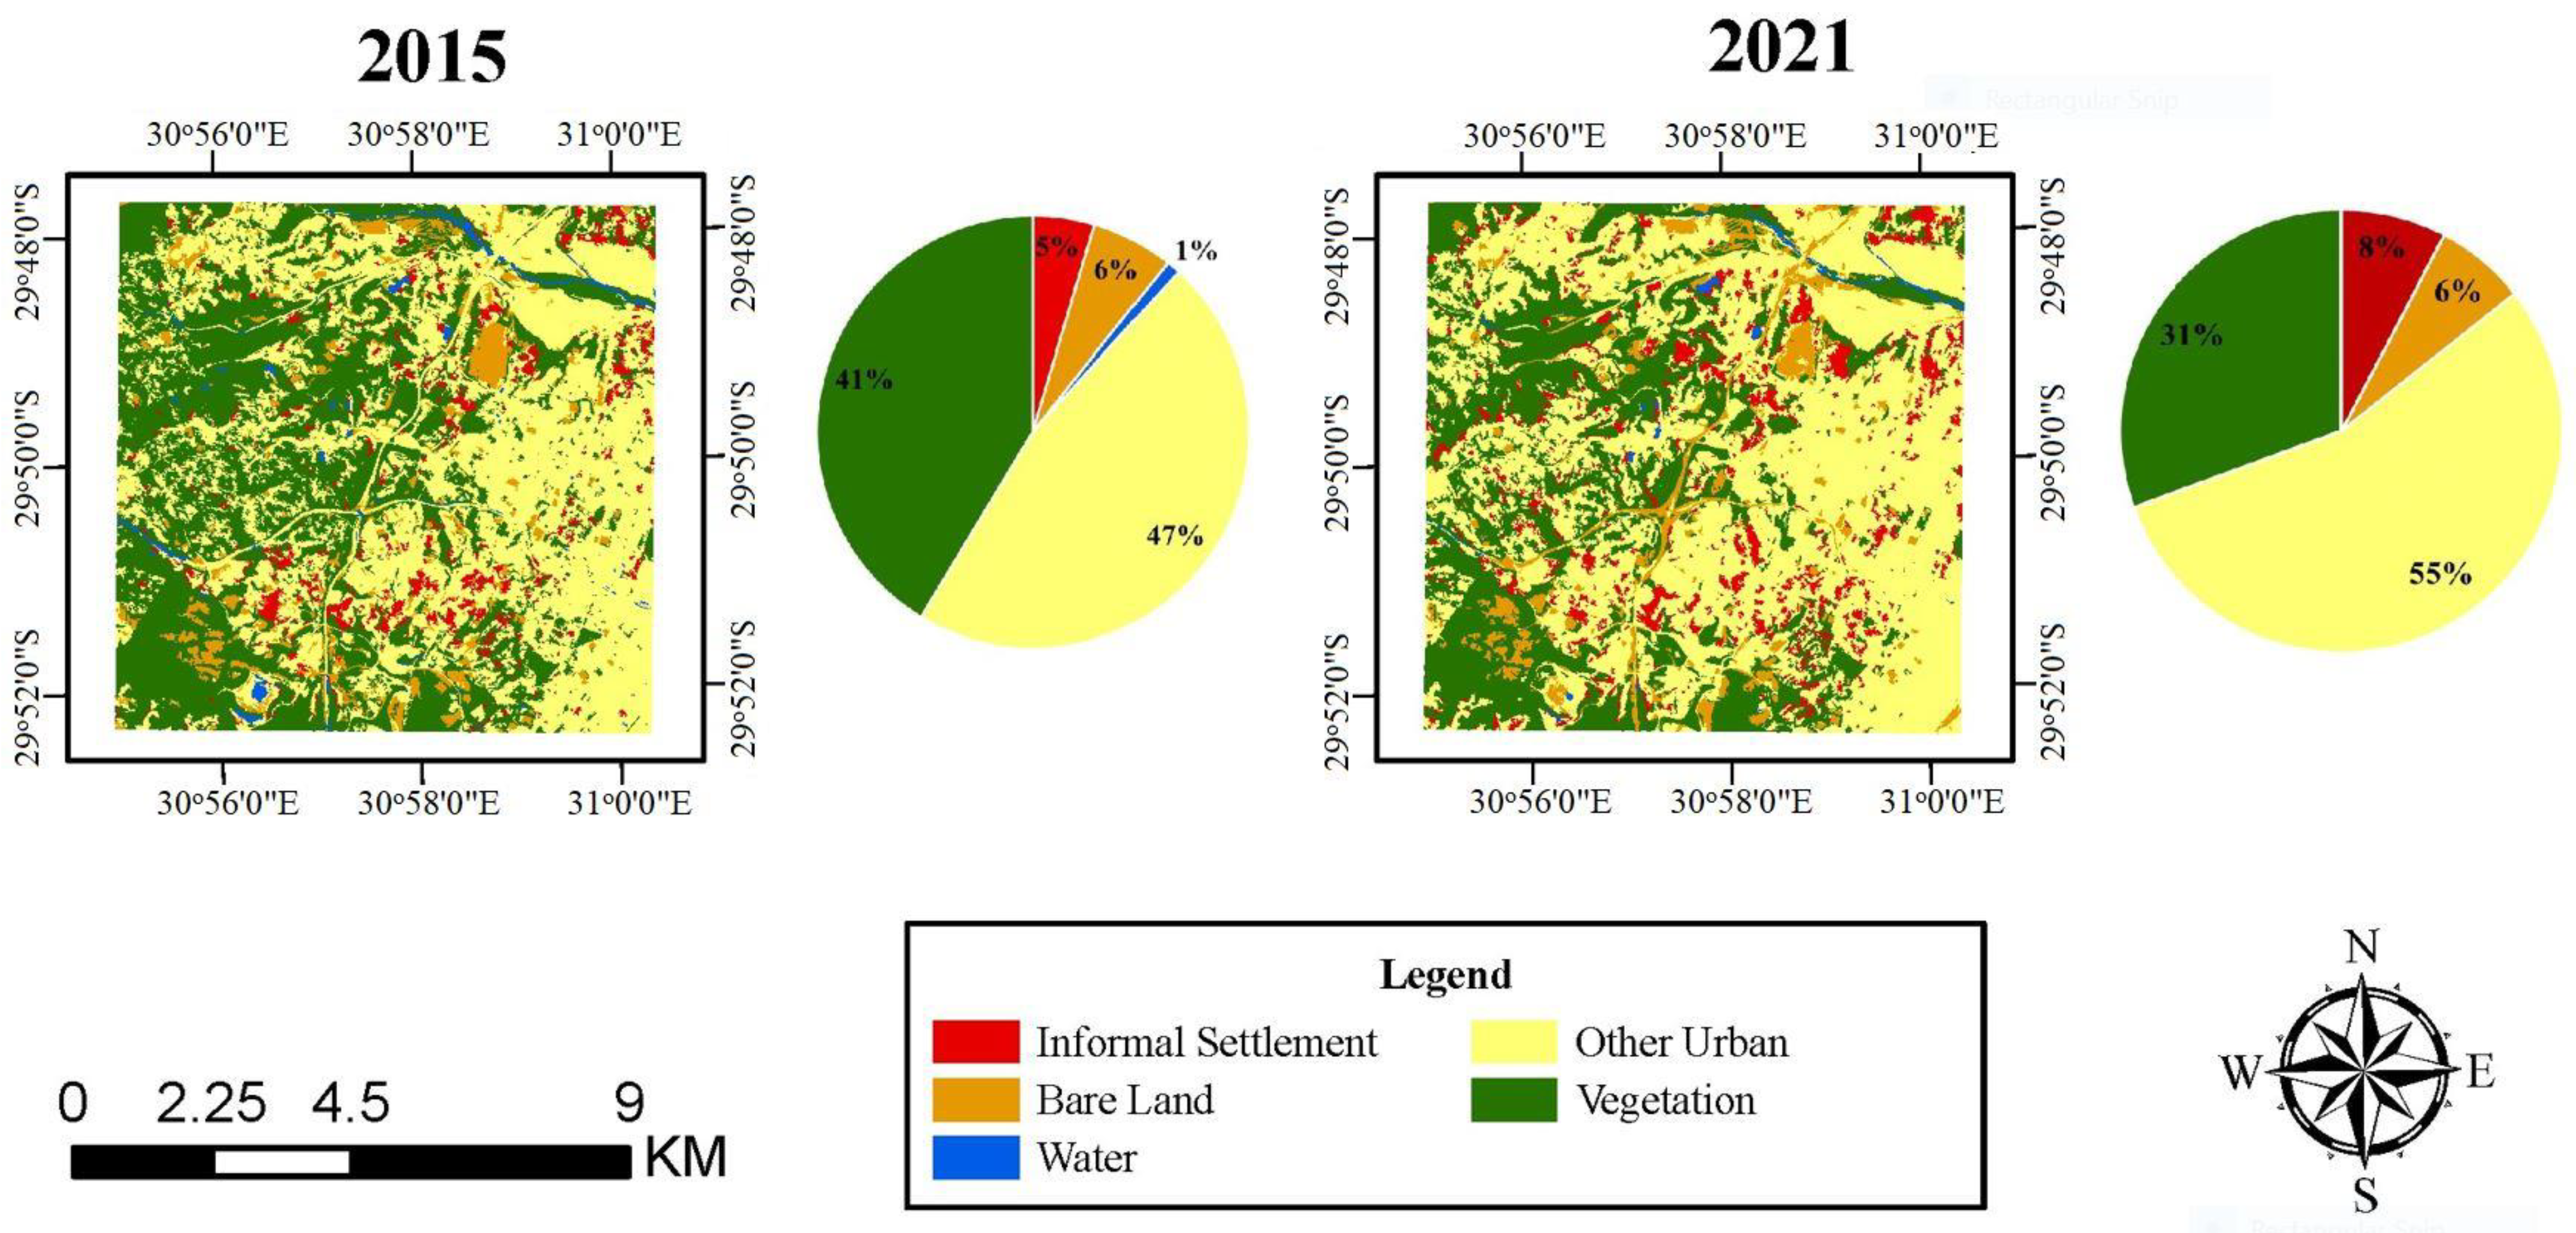
3.1. Observed Patterns of LULC Change Dynamics

Figure 3 shows the LULC maps produced for the years 2015 and 2021 as well as the proportions of all the categories at the time points. The accuracy assessment revealed estimated overall accuracies of 96% and 97% for 2015 and 2021, respectively. The accuracies of LULC classification for 2015 and 2021 are illustrated in Table 3. The accuracy assessment matrices used were overall accuracy (OA), user accuracy (UA), producer accuracy (PA) and F-score.
The year 2015 yielded overall accuracy and F-score for informal settlement class of 96% and 67%, respectively. On the other hand, year 2021 yielded higher overall accuracy of 97% and F-score value of 92% for informal settlement class.
Figure 3 presents maps showing the amounts of modifications of different categories during the time interval. The maps for the two time points appear similar, indicating small areal changes between consecutive time points. At the initial time the results reveal that urban was the dominant land, covering 47% of the study area. The second largest category was vegetation. Between the two time points, results indicate increases in area for informal settlements, other urban and bare land areas, and decreases for vegetated areas and water. As shown in Figure 3, the informal settlement category had a net increase of 3%, an increase from 5% to 8% of the total study area. The other urban class increased by 8% (47% to 55%). Vegetated land experienced a major decline, considering all the other land cover classes, with a net decrease of 10% (41% to 31%). Figure 4 clearly shows the areal changes over the time period.
Figure 5 presents the maps of category losses and gains distinguished from persistence (no change) during the interval. Grey indicates areas of no change and any other color represents either corresponding loss or gain of the category. The results indicate that vegetation is the category with the largest losses, while the largest gaining category is other urban.

3.2. Intensity Analysis

3.2.1. Category Level

Figure 6 shows graphical representation of the loss and gain intensities for different classes at the category level. Each category has a pair of bars which show the intensity of the changes. The main focus in the current study is on the informal settlement class losses or gains. The results revealed that the informal settlements were actively gaining and actively losing during the period since the intensities passed the uniform intensity line. Bare land also actively gained and lost in land area during the period, and together with informal settlement class, could be regarded as the most active of all land use categories [10]. However, for both categories the gain was more intensive than the loss. Although the other urban class experienced gross gains, the gain was dormant. In fact, the other urban class was dormant for both gain and loss during the interval.

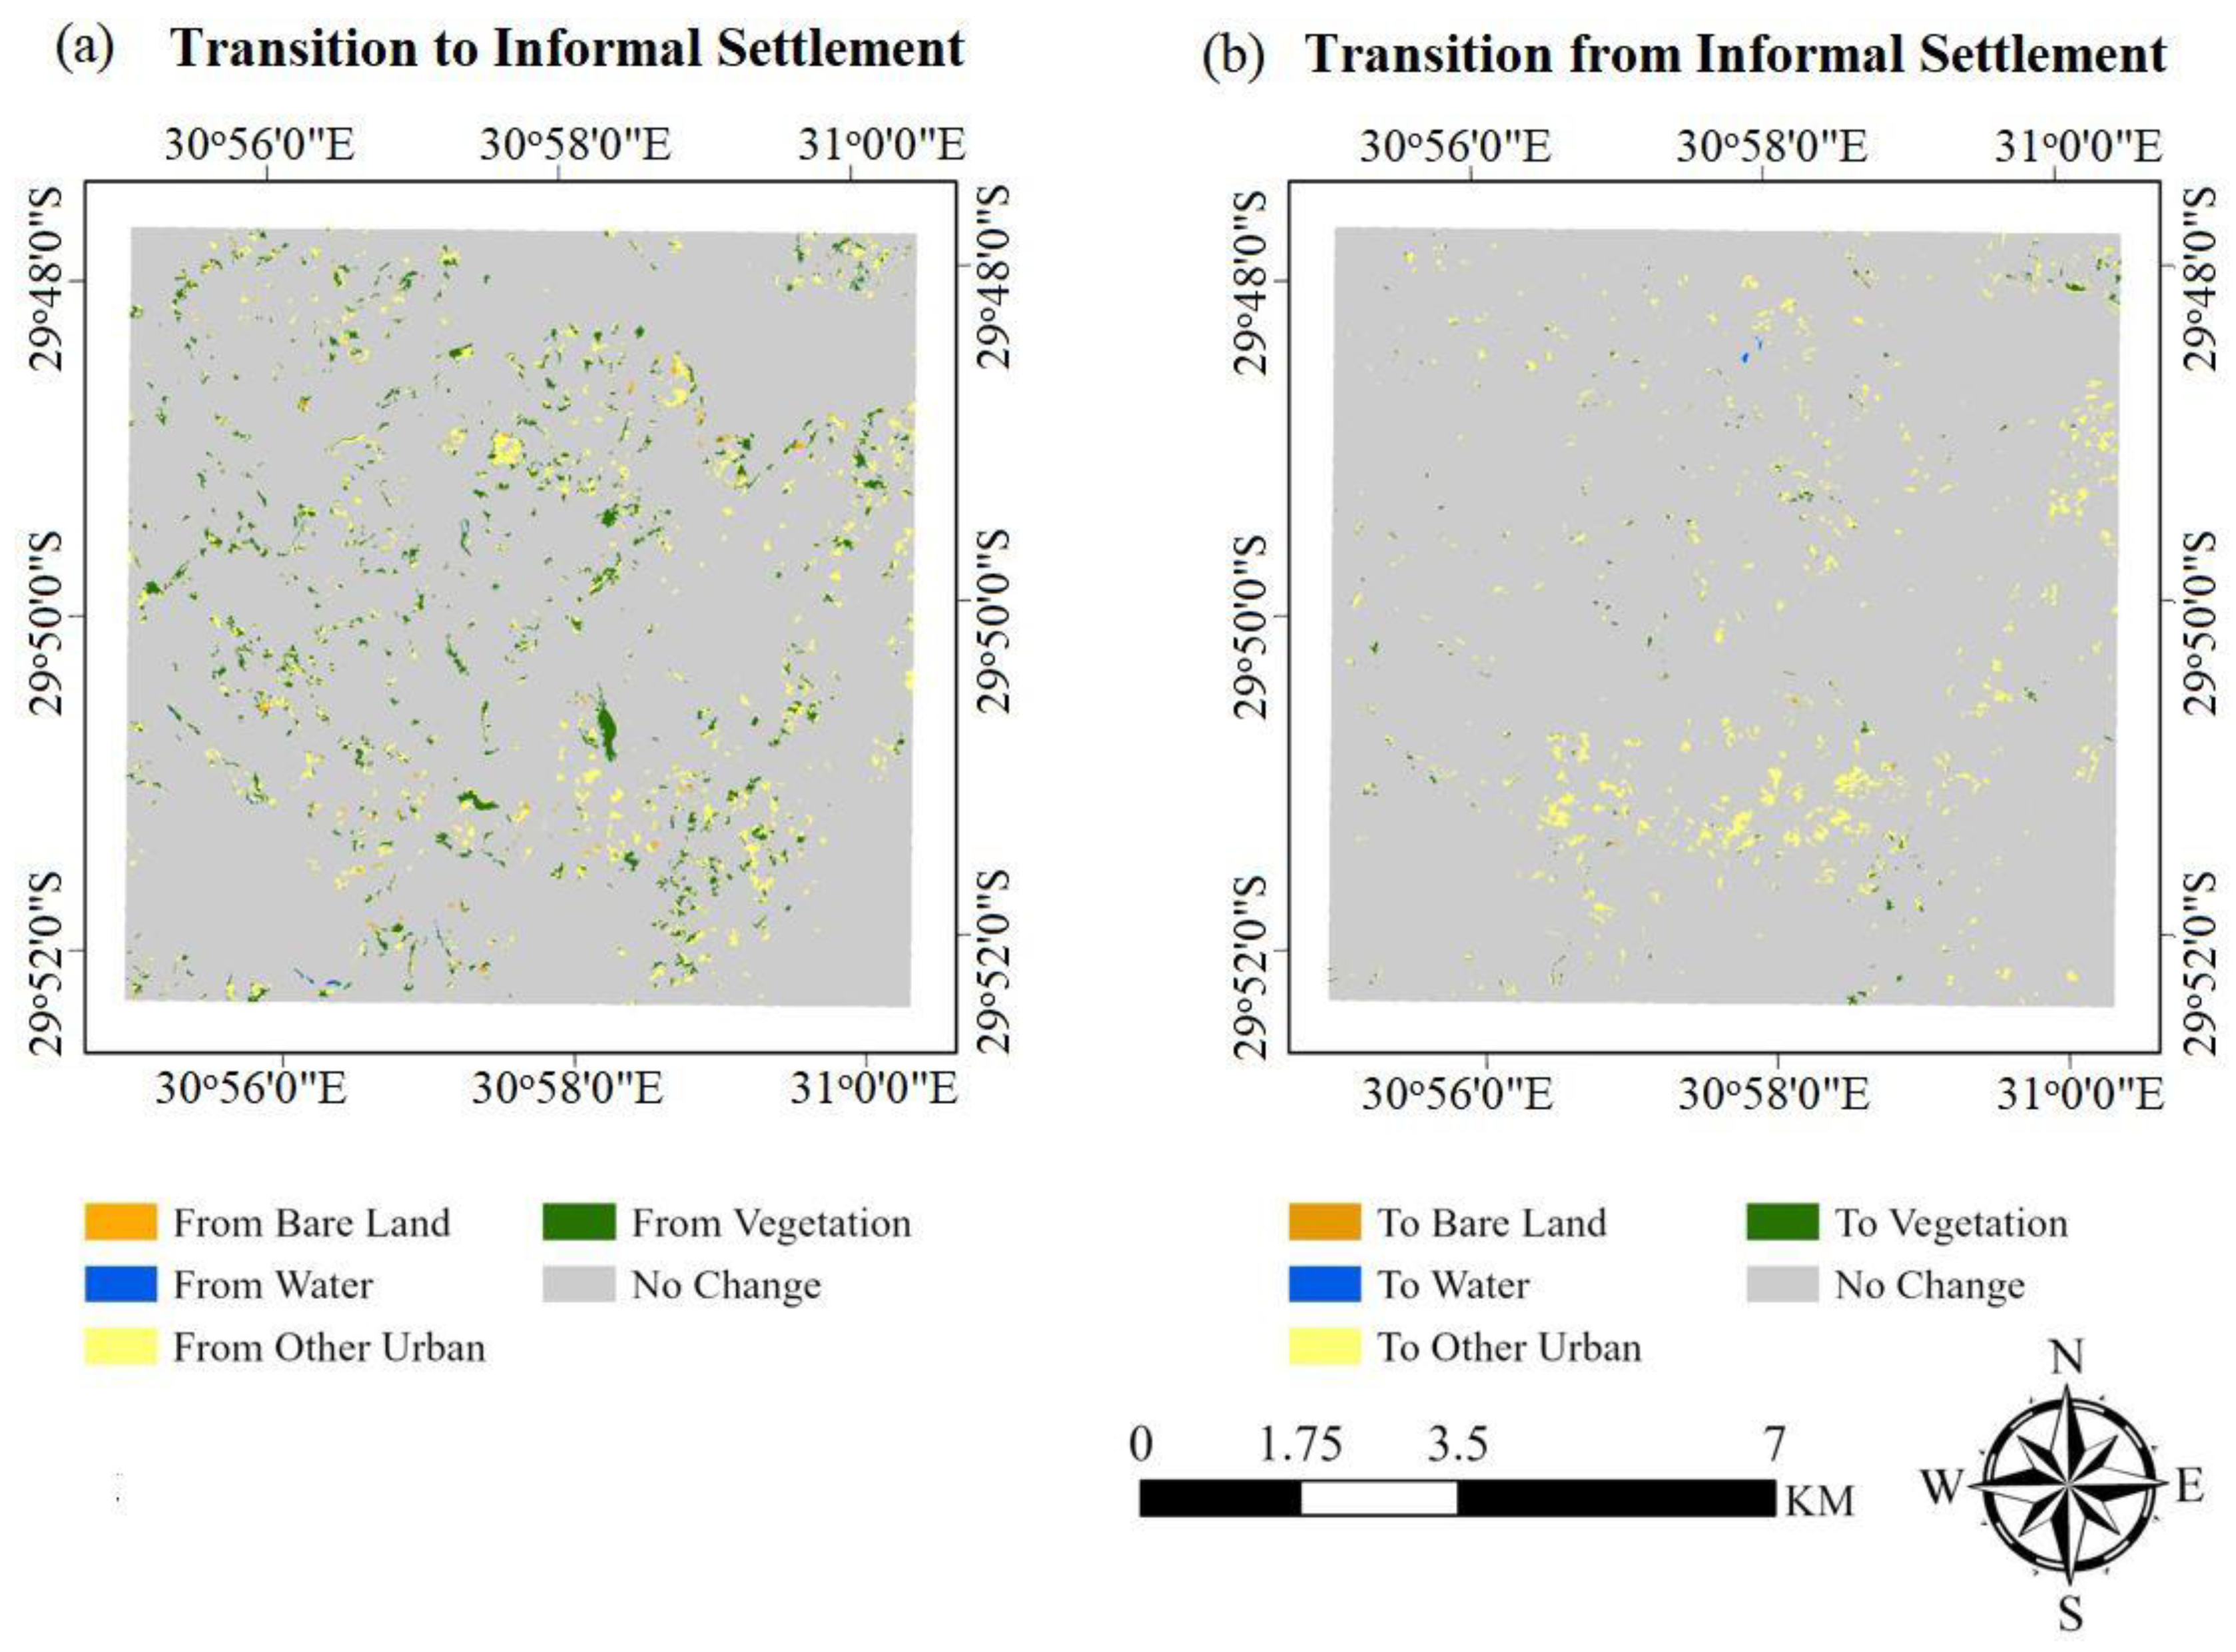
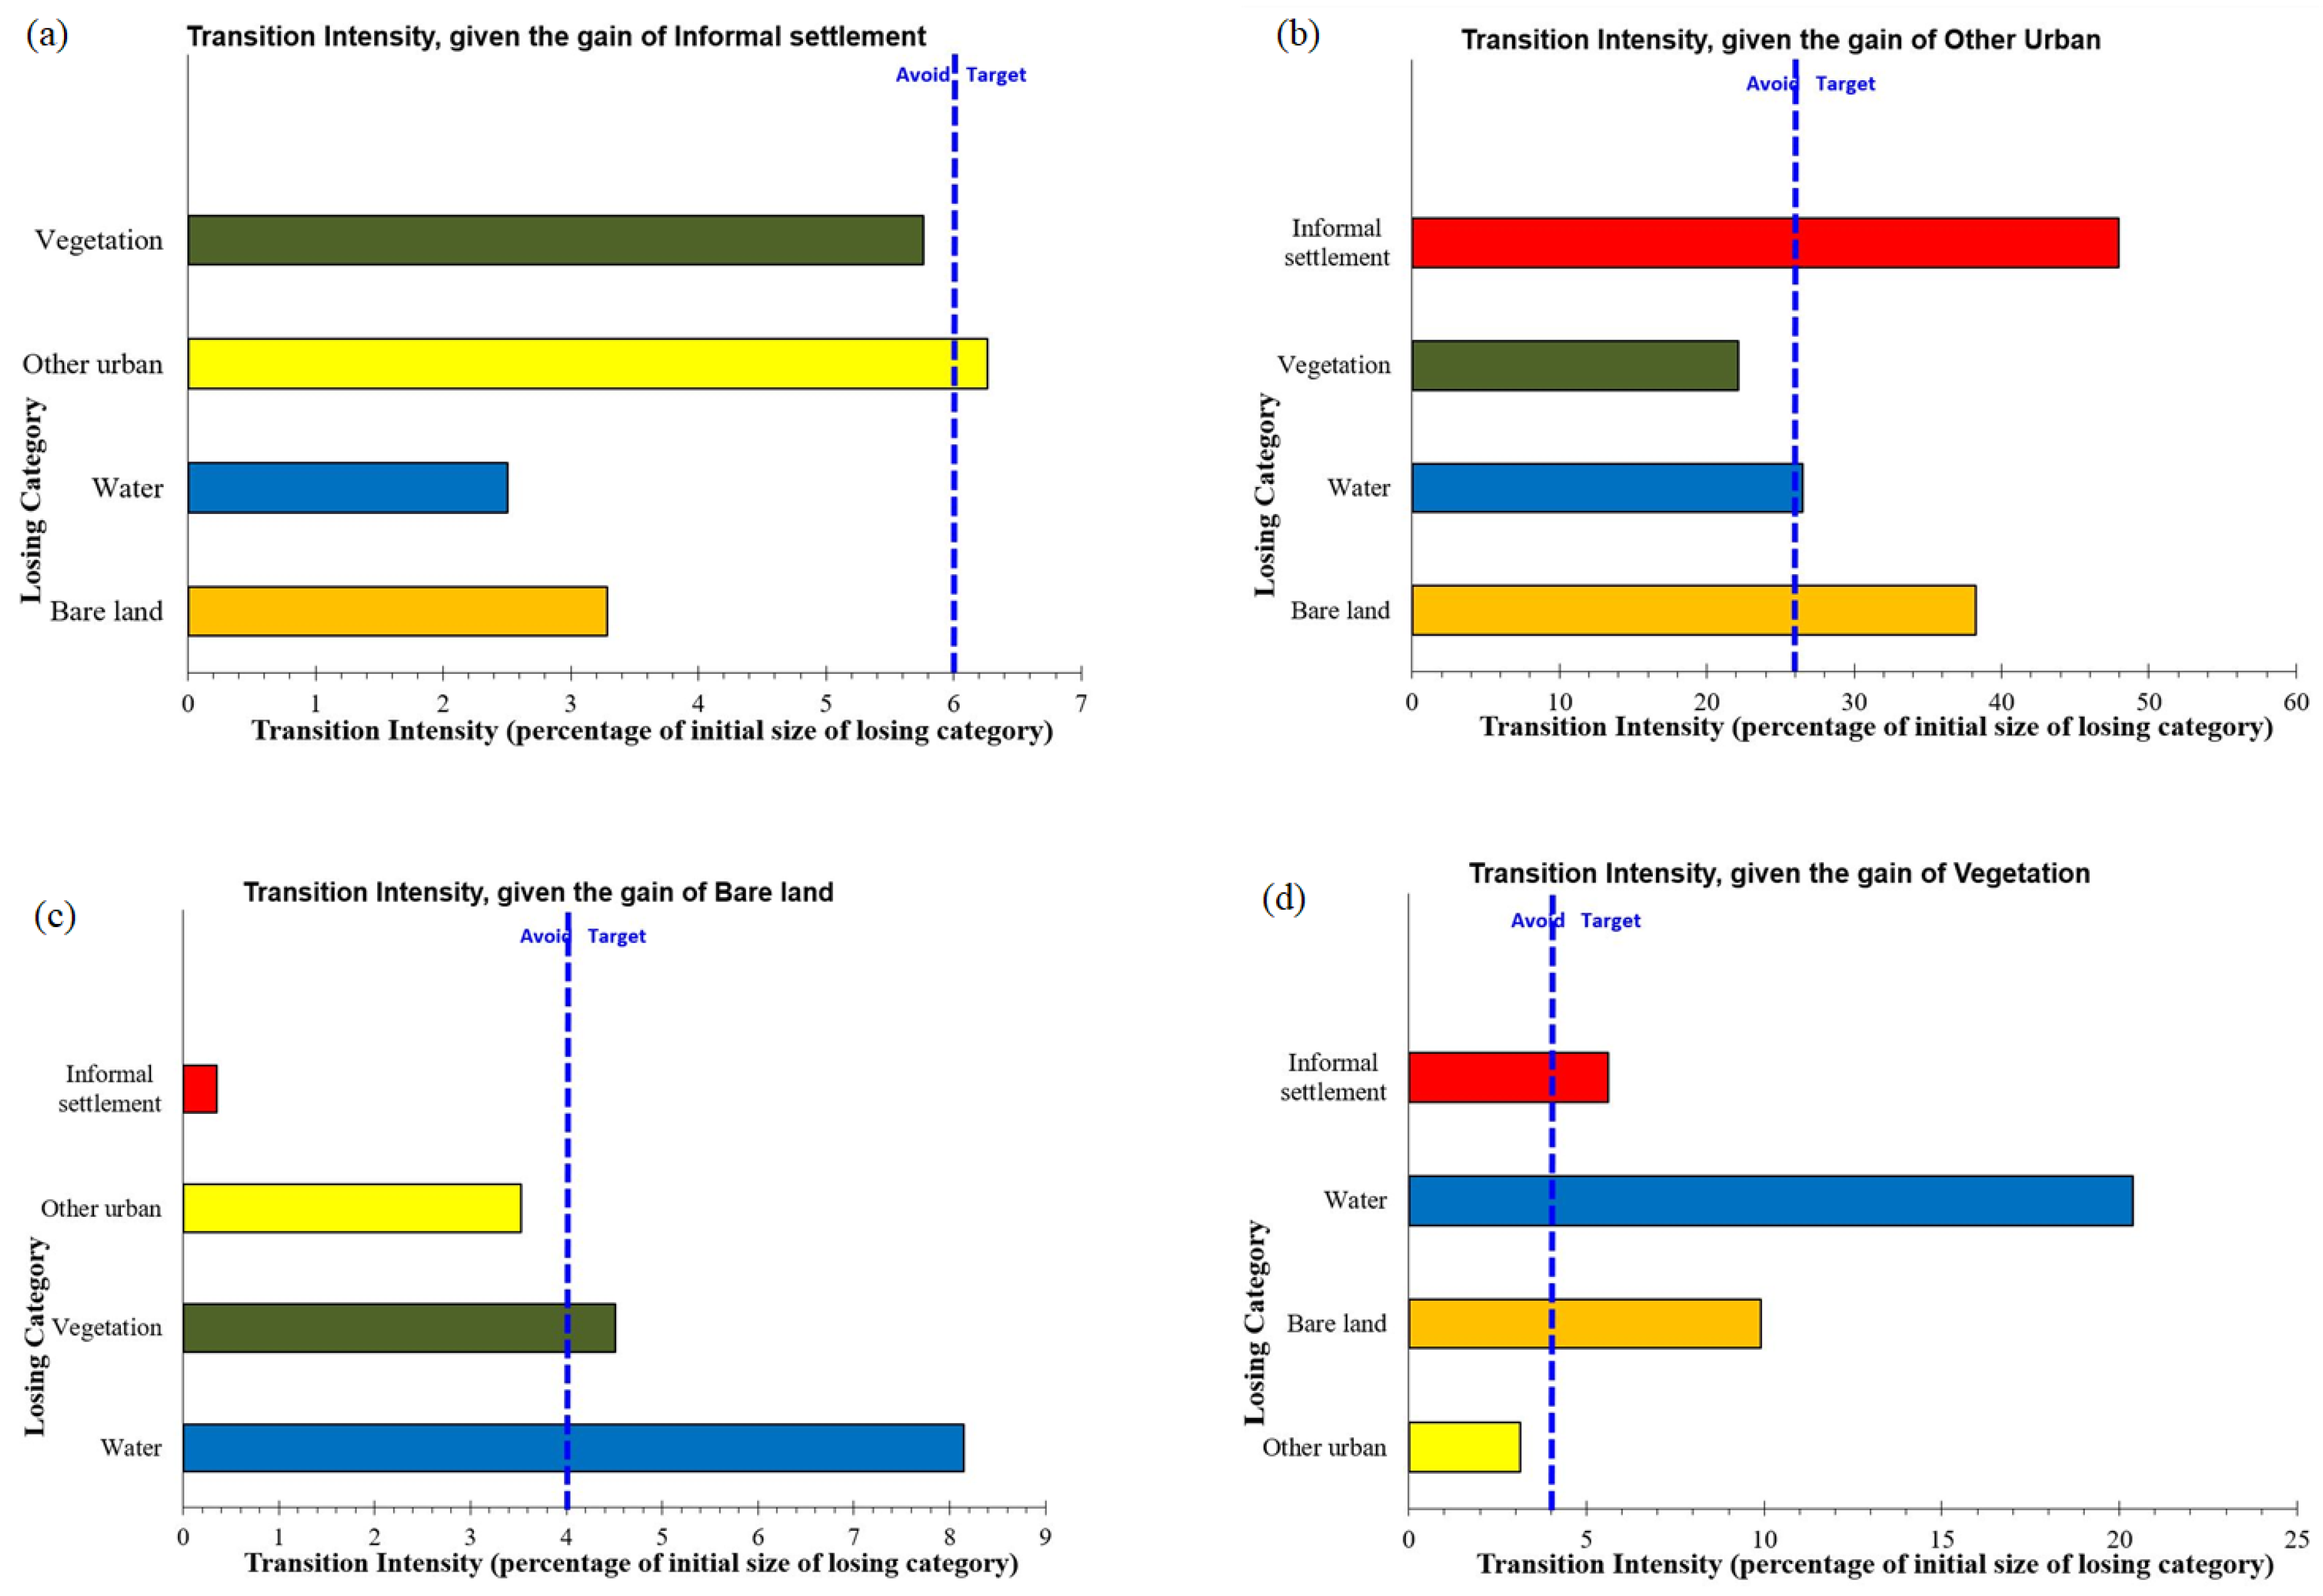
3.2.2. Transition Level

The category level analysis revealed that informal settlements were actively losing and gaining. Of importance is the determination of which land use categories the informal settlements were either gaining from or losing to. Figure 7 presents the map of the transitions between informal settlements and other categories. Figure 7a shows transition of other categories to informal settlement, while Figure 7b shows transition from informal settlement to other categories. Throughout the time period, other urban, bare land and vegetation categories were transforming into informal settlements (Figure 7a), so informal settlements experienced high rates of increase from those classes. Similarly, informal settlements also lost to other urban and vegetated lands (Figure 7b).
Figure 8 presents a graphical representation of intensities of observed transitions given the gain of informal settlement, gain of other urban, gain of bare land, and gain of vegetation. The transition of water class to informal settlement lies to the left of the transition intensity line indicating avoidance of the water category. The bar for other urban stretches beyond the uniform line. This suggests that the informal settlement class most intensively targeted other urban. It is also crucial to note that during the same time interval other urban areas were also systematically targeting informal settlements, so informal settlements experienced high conversion rates into other urban category in the study area. The scenario where on one hand informal settlements target other urban areas and, simultaneously, urban area targets informal settlements represents a systematic process of transition [66].
Interestingly, the rate at which other categories were changing into the informal settlement class is higher than the rate at which informal settlements were changing to other classes, as shown in Figure 9. Considering all the transitions between informal settlements and other categories over the time period, about 68.9% of the transitions involved changes from other categories to informal settlements. This shows that informal settlement expansion was greater than its decline during the period.

4. Discussion

The study sought to investigate informal settlement dynamics in the context of subsequent LULC transitions for an area in Durban Metropolis, South Africa. In this study, GEE, with its geospatial analysis tools and parallel processing capabilities, allowed effective implementation of OBIA for LULC classification. Classification results revealed a much lower F-score value of 67% for informal settlement class for the year 2015 than the year 2021, which yielded F-score of 92%. The 2015 classification result potentially demonstrates substantial confusion between informal settlements and other classes. However, the accuracy levels for these maps were reasonable considering the large size of the study area and computational efficiency of object-based classification. Following Amani, et al. [67], in their mapping of complex wetland environment, a trade off was considered between the efficiency of the model and level of accuracy. Due to fragmentation of the landscape, the lower classification result is potentially explained by the informal settlement class being less spectrally distinguishable during that year. Visual analysis of informal settlement layouts indicates sparsely laid out informal settlements in 2015 which, hypothetically, would be complex to distinguish from formal built up residential areas due to similarity of the spectrum. Because of the dynamic nature of informal settlements [9], they changed significantly over time and assumed morphological layout of contiguity, typical of informal settlements, making 2021 class level more reasonable. In addition, unclear and fuzzy boundaries between formal and informal housing units could have caused uncertainties in boundary delineation. Some informal settlements are found adjacent to high density formal buildings without clear cut borders, making them hardly distinguishable. According to Amani, et al. [67], boundaries should be conservatively determined in order to avoid transitional areas.
Generally, the results of intensity analysis showed a net increase in area coverage of informal settlements. Category level analysis revealed informal settlements as actively gaining and losing within the period. However, the intensity of gain was higher than the loss. While rural to urban migration has been regarded as the major cause of rapid expansion of informal settlements—for example Quarry Road West informal settlement in Durban [44], South Africa also grapples with influx of illegal migrants from the neighboring countries—the influx of these migrants potentially explains the gain as they increasingly settle into these spontaneous, low-income settlements. These results compare favorably with Badmos, et al. [10] who also observed a net increase in area covered by informal settlements within the study period. It was also observed that areas that were initially covered by informal settlements in 2015 had been changed to other land use categories in 2021 (bare land, other urban area, and vegetation). Such conversions potentially explain the intense loss of informal settlements within the period. The observed transitions of informal settlements to other land cover classes in this interval could be attributed to some catastrophic events that happened between 2015 and 2021. For example, a fire engulfed Havelock informal settlement in December 2019 and engulfed the whole settlement [68]. Devastating climate events, for example floods that occurred in Durban in 2016 and 2019, can also help explain transitions from informal settlements to other classes. For instance, in May 2016 and April 2019 informal settlements experienced some of the worst and most devastating floods in the Quarry Road West informal settlement, as they caused washing away of houses and massive displacements [69]. Despite these disaster events, Williams, et al. [45] put forward that the settlement encountered numerous periods of rapid expansion, with most of these occurring just after significant flood and fire events.
Government responses to such catastrophic events help explain transitions from informal settlements to urban class. For instance, in response to the Havelock fire incident, Project Preparation Trust, a local non-profit organization, embarked on a reconstruction program in which new typologies, for instance, double-story shacks were tested together with introduction of climate-proof dwelling design in ten informal settlements in Durban, including Havelock [68]. Thus, the conversion of informal settlements to the other urban land use category in the study area could be a result of these disaster events or upgrading programs. The current results showing evidence of transitions from informal settlement to other categories is also consistent with results of Badmos, et al. [10], where transitions were observed from informal settlements to other land use categories. However, while the causes of the transitions in Durban are naturally induced through disasters, Badmos, et al. [10] attributed the transitions in Lagos to demolitions. This reveals differences in government policies between the nations, with South Africa aiming at protecting the right of each individual to the city.
The findings of the current study revealed an increase in area covered by other urban within the time interval. One explanation for the expansion is potentially due to South Africa’s spatial development policies [70] aimed at restructuring and redressing imbalances created by apartheid spatial planning, through upgrading programs, as well as associated physical infrastructural development. Before 1994, South Africa’s highly regulated urban growth was shaped by the restrictive Prevention of Illegal Squatters Act of 1951 [71]. Today, the South African constitution enforces citizens’ “right to the city” [49]. However, the post-apartheid continues to define human settlements. The South African Constitution (1996) maintains a progressive legal and policy framework that guarantees the right of the individual to access adequate housing [49]. Thus, in an effort to redress the imbalances, state-subsidized housing programs are ongoing, where eligible beneficiaries are granted a variety of state subsidized housing options.
Transition level analysis results indicated that informal settlements actively targeted other urban class. Theoretically, the transition from other urban to informal settlement could also be large for two reasons. First, other urban’s start size is larger than most categories. Second, informal settlement’s gain targets other urban. If all transition intensities were equal, then informal settlement would take more from other urban than any other category. A question would be asked “What processes drive informal settlement dwellers to target other urban and to avoid vegetation?” Given the gain of informal settlement (Figure 8a), it can be deduced that less than half of other urban’s intensity bar is to the right of the uniform line, which means that informal settlement’s targeting of other urban explains less of the transition from other urban to informal settlement. Instead, more than half of other urban’s intensity bar is to the left of the uniform line meaning that other urban’s size explains most of the transition from other urban to informal settlement. The fact that other urban targets informal settlements and informal settlements targets other urban implies systematic process of transition [10]. Accentuating the argument, Teixeira, et al. [31] alluded that a given systematic transition over a period corroborates potential link of that specific transition to some management policy prevailing during that period of time. The targeting of informal settlement class by other urban class (Figure 8b) can, thus, be attributed to the in situ upgrading programs that involve the formalization of informal settlements in their original location, preserving social and economic networks [72].
There was also an indication of decline in vegetated area as well as area designated as water between 2015 and 2021 (Figure 4). According to Badmos, et al. [10], vegetation loss is a common feature in urban areas, where encroachment of vegetated land forms part of urban expansion. In their investigation of LULC in the context of green spaces, an earlier study by [47] also revealed a decline in green urban spaces owing to transformation of the landscape in eThekwini municipality through government’s Reconstruction and Development Program aiming to address housing challenges. It is important to note that, although there was evident decline in vegetation over time, results of intensity analysis stipulated that informal settlement class avoided vegetation. This is partially expounded by the fact that most vegetated land in South Africa is protected. Even so, a previous study by Odindi, et al. [71] submitted that once green areas are cleared for establishment of physical structures, the informal dwellers may contribute to further exploitation of the greenery through wood extraction for fuel. Ordinarily, an increase in population is usually associated with increased demand for fuel firewood which makes logging prevalent in areas near human settlements. In agreement with results of the current study, Badmos, et al. [10], in their study in Lagos, also identified a decline in vegetated areas. Similarly, the authors revealed that informal settlements in Lagos were not targeting vegetation. However, the authors acknowledged that as migrants flocked Lagos the inflow was accommodated in already established informal settlement communities. Thus, their expansion cannot be explained in terms clearance of forest for establishment of new settlements but expansion of existing informal settlements. However, despite the fact that informal settlement’s gain avoids vegetation, the change from vegetation to informal settlement is large (Figure 7a), theoretically because of vegetation’s large start size.
Satterthwaite, et al. [70] asserted that informal settlements experience the worst climate change effects because of their ill preparedness, poor construction materials, and lack of preventative infrastructure that makes them highly vulnerable to high risks of floods and landslides. They tend to be located in flood prone areas such as flood plains or in proximity to water bodies [71,72]. Although the findings for transition level of intensity analysis demonstrated avoidance of water bodies by informal settlements during the 2015–2021 time interval, the loss in area of coverage is indicative of encroachment. Since other urban class has shown that it targets water, and similarly informal settlements target urban, the systematic process of transition could be indicative of encroachment of water bodies even by the informal settlements.
Overall, the main two targeting transitions from other urban to informal settlement and vice versa are in line with policy. However, if land change patterns are not adequately linked to processes, sustainability issues persist. Given the complexity of KwaZulu-Natal landscape, it is vital to understand the drivers, patterns and processes of LULC change for different urban management and policy implications. To help in developing the best land use strategies, a further validation on social factors is imperative.

5. Conclusions

The study successfully utilized GEOBIA, within GEE, as well as intensity analysis, for time-series analysis of LULC and understanding of systematic transitions involved during informal settlement expansion process in Durban metropolitan, South Africa. Specifically, the use of intensity analysis framework has been effective in identifying spatiotemporal land use transition patterns and comprehensive analysis of potential driving forces in the metropolitan area. The study established that from 2015 to 2021, informal settlement dimensions, as well as their spatial extent increased with a net percentage increase of 3%. This could be attributed to immigration from rural areas and neighboring countries. Although category level analysis showed both active gain and loss for informal settlement category, growth has been faster than the decline, with gain intensity of 72%. Such results reveal the potential for spatial challenges to continue to marginalize the poor, with impact on South Africa’s long-term development. More specifically, such dynamics pose potential planning challenges for disaster risk protection and municipal service provision. On the other hand, transition level intensity analysis showed a systematic process of transition between informal settlements and other urban areas, potentially influenced by government policy, through its development programs. Although the Durban municipality strives to improve the livelihoods of informal settlement dwellers through in situ upgrading, under the National Housing Code, the findings read as a tale of caution to policy makers within South Africa, as well as countries within the developing world as a whole. The results suggest that city authorities should respond to the detailed urban space and planning requirements for sustainable urban area management policies, design of effective intervention strategies in order to minimize disaster risk, as well as legislative decisions toward curbing settling on precarious areas.

Author Contributions

D.M. developed the aim and objective of the research, conceptualized the manuscript, analyzed data and results, and prepared the original draft. O.M., as the main supervisor, verified the analytical approaches and results of the study, including interpretation and discussion of the obtained results. M.N., as co-supervisor, also constructively gave comments and suggestions that helped to improve the manuscript. M.V. contributed with Google Earth Engine scripting, helped with the land cover classification methodology, and editing of the manuscript. T.D.M. helped with interpretation of Pontius Excel file and implementation of intensity analysis approach. All authors have read and agreed to the published version of the manuscript.

Funding

SARChI Chair in Landuse Planning and Management, Grant No. 84157 supported the research through generous financial support.

Data Availability Statement

Sentinel 1 data used in the research are available within Google Earth Engine (GEE). NICFI Planet data are accessible for the tropical area within GEE after NICFI (Norway’s International Climate and Forest Initiative) approval. The GEE codes developed in this research are available by emailing the author upon any reasonable request.

Acknowledgments

The authors acknowledge University of Kwa- Zulu Natal (UKZN) Big Data for Science and Society Project (BDSS) for their financial support. The authors thank the NICFI (Norway’s International Climate and Forest Initiative) for having allowed the access to PlanetScope data within GEE. The authors also thank Pontius for assisting with understanding of the Pontius Excel file.

Conflicts of Interest

The authors declare no conflict of interest.

References

  1. Lopez, J.M.R.; Heider, K.; Scheffran, J. Frontiers of urbanization: Identifying and explaining urbanization hot spots in the south of Mexico City using human and remote sensing. Appl. Geogr. 2017, 79, 1–10. [Google Scholar] [CrossRef]
  2. Balsa-Barreiro, J.; Li, Y.; Morales, A.; Pentland, A.S. Globalization and the shifting centers of gravity of world’s human dynamics: Implications for sustainability. J. Clean. Prod. 2019, 239, 117923. [Google Scholar] [CrossRef]
  3. Jones, P. Formalizing the Informal: Understanding the Position of Informal Settlements and Slums in Sustainable Urbanization Policies and Strategies in Bandung, Indonesia. Sustainability 2017, 9, 1436. [Google Scholar] [CrossRef]
  4. Samper, J.; Shelby, J.A.; Behary, D. The Paradox of Informal Settlements Revealed in an ATLAS of Informality: Findings from Mapping Growth in the Most Common Yet Unmapped Forms of Urbanization. Sustainability 2020, 12, 9510. [Google Scholar] [CrossRef]
  5. Tellman, B.; Eakin, H.; Turner, B.L. Identifying, projecting, and evaluating informal urban expansion spatial patterns. J. Land Use Sci. 2022, 17, 100–112. [Google Scholar] [CrossRef]
  6. Kohli, D.; Sliuzas, R.; Kerle, N.; Stein, A. An ontology of slums for image-based classification. Comput. Environ. Urban Syst. 2012, 36, 154–163. [Google Scholar] [CrossRef]
  7. Kuffer, M.; Pfeffer, K.; Sliuzas, R.; Baud, I. Extraction of Slum Areas From VHR Imagery Using GLCM Variance. IEEE J. Sel. Top. Appl. Earth Obs. Remote Sens. 2016, 9, 1830–1840. [Google Scholar] [CrossRef]
  8. Kuffer, M.; Pfeffer, K.; Sliuzas, R. Slums from Space—15 Years of Slum Mapping Using Remote Sensing. Remote Sens. 2016, 8, 455. [Google Scholar] [CrossRef]
  9. Kraff, N.J.; Wurm, M.; Taubenböck, H. The dynamics of poor urban areas—Analyzing morphologic transformations across the globe using Earth observation data. Cities 2020, 107, 102905. [Google Scholar] [CrossRef]
  10. Badmos, O.; Rienow, A.; Callo-Concha, D.; Greve, K.; Jürgens, C. Urban Development in West Africa—Monitoring and Intensity Analysis of Slum Growth in Lagos: Linking Pattern and Process. Remote Sens. 2018, 10, 1044. [Google Scholar] [CrossRef] [Green Version]
  11. Solecki, W.; Seto, K.C.; Marcotullio, P.J. It’s Time for an Urbanization Science. Environ. Sci. Policy Sustain. Dev. 2013, 55, 12–17. [Google Scholar] [CrossRef]
  12. Mwangi, H.; Lariu, P.; Julich, S.; Patil, S.; McDonald, M.; Feger, K.-H. Characterizing the Intensity and Dynamics of Land-Use Change in the Mara River Basin, East Africa. Forests 2017, 9, 8. [Google Scholar] [CrossRef]
  13. Msofe, N.; Sheng, L.; Lyimo, J. Land Use Change Trends and Their Driving Forces in the Kilombero Valley Floodplain, Southeastern Tanzania. Sustainability 2019, 11, 505. [Google Scholar] [CrossRef]
  14. Hamud, A.M.; Shafri, H.Z.M.; Shaharum, N.S.N. Monitoring Urban Expansion And Land Use/Land Cover Changes In Banadir, Somalia Using Google Earth Engine (GEE). IOP Conf. Ser. Earth Environ. Sci. 2021, 767, 012041. [Google Scholar] [CrossRef]
  15. Mugiraneza, T.; Nascetti, A.; Ban, Y. Continuous Monitoring of Urban Land Cover Change Trajectories with Landsat Time Series and LandTrendr-Google Earth Engine Cloud Computing. Remote Sens. 2020, 12, 2883. [Google Scholar] [CrossRef]
  16. Rudiastuti, A.; Farda, N.M.; Ramdani, D.; Wicaksono, P.; Wibowo, S.B. Mapping built-up land and settlements: A comparison of machine learning algorithms in Google Earth engine. SPIE 2021, 12, 47. [Google Scholar] [CrossRef]
  17. Celik, N. Change detection of urban areas in Ankara through Google Earth engine. In Proceedings of the 2018 41st International Conference on Telecommunications and Signal Processing (TSP), Athens, Greece, 4–6 July 2018; IEEE: Washington, DC, USA, 2018; pp. 1–5. [Google Scholar]
  18. Zurqani, H.A.; Post, C.J.; Mikhailova, E.A.; Allen, J.S. Mapping Urbanization Trends in a Forested Landscape Using Google Earth Engine. Remote Sens. Earth Syst. Sci. 2019, 2, 173–182. [Google Scholar] [CrossRef]
  19. Fuchs, R.; Herold, M.; Verburg, P.H.; Clevers, J.G.; Eberle, J. Gross changes in reconstructions of historic land cover/use for Europe between 1900 and 2010. Glob. Change Biol. 2015, 21, 299–313. [Google Scholar] [CrossRef]
  20. Manandhar, R.; Odeh, I.O.A.; Pontius, R.G. Analysis of twenty years of categorical land transitions in the Lower Hunter of New South Wales, Australia. Agric. Ecosyst. Environ. 2010, 135, 336–346. [Google Scholar] [CrossRef]
  21. Xie, Z.; Pontius, R.G., Jr.; Huang, J.; Nitivattananon, V. Enhanced Intensity Analysis to Quantify Categorical Change and to Identify Suspicious Land Transitions: A Case Study of Nanchang, China. Remote Sens. 2020, 12, 3323. [Google Scholar] [CrossRef]
  22. Huang, F.; Huang, B.; Huang, J.; Li, S. Measuring Land Change in Coastal Zone around a Rapidly Urbanized Bay. Int. J. Environ. Res. Public Health 2018, 15, 1059. [Google Scholar] [CrossRef] [PubMed]
  23. Yuan, Y.; Li, B.; Gao, X.; Liu, H.; Xu, L.; Zhou, C. A method of characterizing land-cover swap changes in the arid zone of China. Front. Earth Sci. 2015, 10, 74–86. [Google Scholar] [CrossRef]
  24. Aldwaik, S.Z.; Pontius, R.G., Jr. Map errors that could account for deviations from a uniform intensity of land change. Int. J. Geogr. Inf. Sci. 2013, 27, 1717–1739. [Google Scholar] [CrossRef]
  25. Akinyemi, F.O.; Pontius, R.G.; Braimoh, A.K. Land change dynamics: Insights from Intensity Analysis applied to an African emerging city. J. Spat. Sci. 2016, 106, 1–15. [Google Scholar] [CrossRef]
  26. Zhou, P.; Huang, J.; Pontius, R.G., Jr.; Hong, H. Land classification and change intensity analysis in a coastal watershed of Southeast China. Sensors 2014, 14, 11640–11658. [Google Scholar] [CrossRef] [PubMed]
  27. Yang, Y.; Liu, Y.; Xu, D.; Zhang, S. Use of intensity analysis to measure land use changes from 1932 to 2005 in Zhenlai County, Northeast China. Chin. Geogr. Sci. 2017, 27, 441–455. [Google Scholar] [CrossRef]
  28. Hasani, M.; Sakieh, Y.; Dezhkam, S.; Ardakani, T.; Salmanmahiny, A. Environmental monitoring and assessment of landscape dynamics in southern coast of the Caspian Sea through intensity analysis and imprecise land-use data. Environ. Monit. Assess. 2017, 189, 163. [Google Scholar] [CrossRef]
  29. Quan, B.; Pontius, R.G.; Song, H. Intensity Analysis to communicate land change during three time intervals in two regions of Quanzhou City, China. GIScience Remote Sens. 2019, 57, 21–36. [Google Scholar] [CrossRef]
  30. Teixeira, Z.; Teixeira, H.; Marques, J.C. Systematic processes of land use/land cover change to identify relevant driving forces: Implications on water quality. Sci. Total Environ. 2014, 470–471, 1320–1335. [Google Scholar] [CrossRef]
  31. Pontius, R.G.; Shusas, E.; McEachern, M. Detecting important categorical land changes while accounting for persistence. Agric. Ecosyst. Environ. 2004, 101, 251–268. [Google Scholar] [CrossRef]
  32. Huang, J.; Pontius, R.G.; Li, Q.; Zhang, Y. Use of intensity analysis to link patterns with processes of land change from 1986 to 2007 in a coastal watershed of southeast China. Appl. Geogr. 2012, 34, 371–384. [Google Scholar] [CrossRef]
  33. Mushore, T.D.; Mutanga, O.; Odindi, J. Determining the Influence of Long Term Urban Growth on Surface Urban Heat Islands Using Local Climate Zones and Intensity Analysis Techniques. Remote Sens. 2022, 14, 2060. [Google Scholar] [CrossRef]
  34. Nyamekye, C.; Kwofie, S.; Ghansah, B.; Agyapong, E.; Boamah, L.A. Assessing urban growth in Ghana using machine learning and intensity analysis: A case study of the New Juaben Municipality. Land Use Policy 2020, 99, 105057. [Google Scholar] [CrossRef]
  35. Tong, S.; Bao, G.; Rong, A.; Huang, X.; Bao, Y.; Bao, Y. Comparison of the Spatiotemporal Dynamics of Land Use Changes in Four Municipalities of China Based on Intensity Analysis. Sustainability 2020, 12, 3687. [Google Scholar] [CrossRef]
  36. Gandharum, L.; Hartono, D.M.; Karsidi, A.; Ahmad, M. Monitoring Urban Expansion and Loss of Agriculture on the North Coast of West Java Province, Indonesia, Using Google Earth Engine and Intensity Analysis. Sci. World J. 2022, 2022, 3123788. [Google Scholar] [CrossRef] [PubMed]
  37. Loggia, C.; Govender, V. A hybrid methodology to map informal settlements in Durban, South Africa. Proc. Inst. Civ. Eng. Eng. Sustain. 2019, 5, 257–268. [Google Scholar] [CrossRef]
  38. Jagarnath, M.; Thambiran, T.; Gebreslasie, M. Modelling urban land change processes and patterns for climate change planning in the Durban metropolitan area, South Africa. J. Land Use Sci. 2019, 14, 81–109. [Google Scholar] [CrossRef]
  39. Mazeka, B.; Phinzi, K.; Sutherland, C. Monitoring Changing Land Use-Land Cover Change to Reflect the Impact of Urbanisation on Environmental Assets in Durban, South Africa. In Sustainable Urban Futures in Africa; Routledge: Abingdon, UK, 2021; pp. 132–158. [Google Scholar]
  40. Marx, C.; Charlton, S. Global Report on Human Settlements; UN-HABITAT (Hg.): Durban, South Africa, 2003; pp. 195–223. [Google Scholar]
  41. Membele, G.M.; Naidu, M.; Mutanga, O. Using local and indigenous knowledge in selecting indicators for mapping flood vulnerability in informal settlement contexts. Int. J. Disaster Risk Reduct. 2022, 71, 102836. [Google Scholar] [CrossRef]
  42. Williams, D.; Costa, M.M.; Celliers, L.; Sutherland, C. Informal Settlements and Flooding: Identifying Strengths and Weaknesses in Local Governance for Water Management. Water 2018, 10, 871. [Google Scholar] [CrossRef]
  43. Williams, D.S.; Costa, M.M.; Sutherland, C.; Celliers, L.; Scheffran, J. Vulnerability of informal settlements in the context of rapid urbanization and climate change. Environ. Urban. 2019, 31, 157–176. [Google Scholar] [CrossRef] [Green Version]
  44. Manzoor, S.A.; Griffiths, G.H.; Robinson, E.; Shoyama, K.; Lukac, M. Linking Pattern to Process: Intensity Analysis of Land-Change Dynamics in Ghana as Correlated to Past Socioeconomic and Policy Contexts. Land 2022, 11, 1070. [Google Scholar] [CrossRef]
  45. Otunga, C.; Odindi, J.; Mutanga, O. Land Use Land Cover Change in the fringe of eThekwini Municipality: Implications for urban green spaces using remote sensing. South Afr. J. Geomat. 2014, 3, 145–162. [Google Scholar] [CrossRef]
  46. Jewitt, D.; Goodman, P.S.; Erasmus, B.F.N.; O’Connor, T.G.; Witkowski, E.T.F. Systematic land-cover change in KwaZulu-Natal, South Africa: Implications for biodiversity. South Afr. J. Sci. 2015, 111, 1–9. [Google Scholar] [CrossRef]
  47. Parikh, P.; Bisaga, I.; Loggia, C.; Georgiadou, M.C.; Ojo-Aromokudu, J. Barriers and opportunities for participatory environmental upgrading: Case study of Havelock informal settlement, Durban. City Environ. Interact. 2020, 5, 100041. [Google Scholar] [CrossRef]
  48. Dong, J.; Xiao, X.; Menarguez, M.A.; Zhang, G.; Qin, Y.; Thau, D.; Biradar, C.; Moore, B., III. Mapping paddy rice planting area in northeastern Asia with Landsat 8 images, phenology-based algorithm and Google Earth Engine. Remote Sens. Environ. 2016, 185, 142–154. [Google Scholar] [CrossRef]
  49. Marfai, M.A.; Farda, N.M.; Khakhim, N.; Wicaksono, P.; Wicaksono, A. Tidal Correction Effects Analysis on Shoreline Mapping in Jepara Regency. J. Appl. Geospat. Inf. 2018, 2, 145–151. [Google Scholar] [CrossRef]
  50. Amani, M.; Mahdavi, S.; Afshar, M.; Brisco, B.; Huang, W.; Mohammad Javad Mirzadeh, S.; White, L.; Banks, S.; Montgomery, J.; Hopkinson, C. Canadian Wetland Inventory using Google Earth Engine: The First Map and Preliminary Results. Remote Sens. 2019, 11, 842. [Google Scholar] [CrossRef]
  51. Mahdianpari, M.; Salehi, B.; Mohammadimanesh, F.; Homayouni, S.; Gill, E. The First Wetland Inventory Map of Newfoundland at a Spatial Resolution of 10 m Using Sentinel-1 and Sentinel-2 Data on the Google Earth Engine Cloud Computing Platform. Remote Sens. 2018, 11, 43. [Google Scholar] [CrossRef]
  52. Vizzari, M. PlanetScope, Sentinel-2, and Sentinel-1 Data Integration for Object-Based Land Cover Classification in Google Earth Engine. Remote Sens. 2022, 14, 2628. [Google Scholar] [CrossRef]
  53. Vergni, L.; Vinci, A.; Todisco, F.; Santaga, F.S.; Vizzari, M. Comparing Sentinel-1, Sentinel-2, and Landsat-8 data in the early recognition of irrigated areas in central Italy. J. Agric. Eng. 2021, 52, 4. [Google Scholar] [CrossRef]
  54. Ye, S.; Pontius, R.G.; Rakshit, R. A review of accuracy assessment for object-based image analysis: From per-pixel to per-polygon approaches. ISPRS J. Photogramm. Remote Sens. 2018, 141, 137–147. [Google Scholar] [CrossRef]
  55. Mui, A.; He, Y.; Weng, Q. An object-based approach to delineate wetlands across landscapes of varied disturbance with high spatial resolution satellite imagery. ISPRS J. Photogramm. Remote Sens. 2015, 109, 30–46. [Google Scholar] [CrossRef]
  56. Achanta, R.; Susstrunk, S. Superpixels and polygons using simple non-iterative clustering. In Proceedings of the IEEE Conference on Computer Vision and Pattern Recognition, Honolului, HI, USA, 21–26 July 2017; pp. 4651–4660. [Google Scholar]
  57. Fallatah, A.; Jones, S.; Mitchell, D. Object-based random forest classification for informal settlements identification in the Middle East: Jeddah a case study. Int. J. Remote Sens. 2020, 41, 4421–4445. [Google Scholar] [CrossRef]
  58. Fallatah, A.; Jones, S.; Mitchell, D.; Kohli, D. Mapping informal settlement indicators using object-oriented analysis in the Middle East. Int. J. Digit. Earth 2019, 12, 802–824. [Google Scholar] [CrossRef]
  59. Fallatah, A.; Jones, S.; Wallace, L.; Mitchell, D. Combining Object-Based Machine Learning with Long-Term Time-Series Analysis for Informal Settlement Identification. Remote Sens. 2022, 14, 1226. [Google Scholar] [CrossRef]
  60. Prabhu, R.; Raja, R.A.A. Urban Slum Detection Approaches from High-Resolution Satellite Data Using Statistical and Spectral Based Approaches. J. Indian Soc. Remote Sens. 2018, 46, 2033–2044. [Google Scholar] [CrossRef]
  61. Pontius, R.; Gao, Y.; Giner, N.; Kohyama, T.; Osaki, M.; Hirose, K. Design and Interpretation of Intensity Analysis Illustrated by Land Change in Central Kalimantan, Indonesia. Land 2013, 2, 351–369. [Google Scholar] [CrossRef]
  62. Ioannidis, C.; Psaltis, C.; Potsiou, C. Towards a strategy for control of suburban informal buildings through automatic change detection. Comput. Environ. Urban Syst. 2009, 33, 64–74. [Google Scholar] [CrossRef]
  63. Niya, A.K.; Huang, J.; Karimi, H.; Keshtkar, H.; Naimi, B. Use of Intensity Analysis to Characterize Land Use/Cover Change in the Biggest Island of Persian Gulf, Qeshm Island, Iran. Sustainability 2019, 11, 4396. [Google Scholar] [CrossRef]
  64. Aldwaik, S.Z.; Pontius, R.G. Intensity analysis to unify measurements of size and stationarity of land changes by interval, category, and transition. Landsc. Urban Plan. 2012, 106, 103–114. [Google Scholar] [CrossRef]
  65. Georgiadou, M.C.; Loggia, C.; Bisaga, I.; Parikh, P. Towards sustainable informal settlements: A toolkit for community-led upgrading in Durban. Proc. Inst. Civ. Eng. Eng. Sustain. 2021, 174, 83–93. [Google Scholar] [CrossRef]
  66. Membele, G.M. Integrating Local, Indigenous Knowledge and Geographical Information System in Mapping Flood Vulnerability at Quarry Road West Informal Settlement in Durban. Ph.D. Thesis, University of Kwazulu-Natal, Durban, South Africa, 2022. [Google Scholar]
  67. Plessis, D.J.D. Land-use mix in South African cities and the influence of spatial planning: Innovation or following the trend? South Afr. Geogr. J. (Suid-Afrik. Geogr. Tydskr.) 2015, 97, 217–242. [Google Scholar] [CrossRef]
  68. Odindi, J.; Mhangara, P.; Kakembo, V. Remote sensing land-cover change in Port Elizabeth during South Africa’s democratic transition. South Afr. J. Sci. 2012, 108, 1–7. [Google Scholar] [CrossRef]
  69. Del Mistro, R.; Hensher, D.A. Upgrading Informal Settlements in South Africa: Policy, Rhetoric and what Residents really Value. Hous. Stud. 2009, 24, 333–354. [Google Scholar] [CrossRef]
  70. Satterthwaite, D.; Archer, D.; Colenbrander, S.; Dodman, D.; Hardoy, J.; Mitlin, D.; Patel, S. Building Resilience to Climate Change in Informal Settlements. One Earth 2020, 2, 143–156. [Google Scholar] [CrossRef]
  71. Abunyewah, M.; Gajendran, T.; Maund, K. Profiling informal settlements for disaster risks. Procedia Eng. 2018, 212, 238–245. [Google Scholar] [CrossRef]
  72. De Risi, R.; Jalayer, F.; De Paola, F.; Iervolino, I.; Giugni, M.; Topa, M.E.; Gasparini, P. Flood risk assessment for informal settlements. Nat. Hazards 2013, 69, 1003–1032. [Google Scholar] [CrossRef]
Figure 1. Location of the study area in South Africa’s KwaZulu-Natal province (a); enlargement of the study area (box) within Durban Metropolis (outlined) (b); and overview of the study area obtained with an RGB PlanetScope imagery, in UTM/WGS84 plane coordinate system (c).
Sustainability 15 02724 g001
Figure 2. Workflow of the study.
Sustainability 15 02724 g002
Figure 3. LULC maps and class percentages for 2015 and 2021.
Sustainability 15 02724 g003
Figure 4. Areal changes of land use categories in the study area from 2015 to 2021.
Sustainability 15 02724 g004
Figure 5. The category loss map and the category gain map for the time interval 2015 to 2021.
Sustainability 15 02724 g005
Figure 6. Intensity analysis for category-level changes for each land category during the time interval 2015–2021.
Sustainability 15 02724 g006
Figure 7. Maps of land transitions to informal settlements (a) and transitions from informal settlements (b) for the 2015–2021 time period.
Sustainability 15 02724 g007
Figure 8. Intensity of the observed transitions given the gross gain of informal settlement (a), gross gain of other urban (b), gross gain of bare land (c), and gross gain of vegetation (d).
Sustainability 15 02724 g008
Figure 9. A representation of variation of uniform transition intensity of informal settlement during the 2015–2021 time interval.
Sustainability 15 02724 g009
Table 1. LULC class descriptions.
ClassDescription
Informal settlementDensely, irregularly built housing units that are contiguous
Bare landUnused land, including barren land, exposed soil with neither grass, trees nor built up structures
WaterWater bodies such as dams, rivers, ponds and swamps
Other urbanHigh and low density formal residential buildings, commercial and industrial buildings, transportation networks
VegetationArea covered by grasslands, forests, croplands, small shrubs, sparse and dense trees, plantations
Table 2. Descriptions of mathematical notations used for intensity analysis calculations (Adopted from [65]).
SymbolDescription
Tnumber of time points
Ytyear at time point t
tindex for the initial time point of an interval (YtYt+1), where t ranges from 1 to T − 1
Jnumber of categories
iindex for a category at the initial time point of an interval
jindex for a category at the latter time point of an interval
nindex of the gaining category for the selected transition
Ctijsize of transition from category i to category j during interval
(YtYt+1)
Stannual change during interval (YtYt+1)
Gtjintensity of annual gain of category j during interval (YtYt+1) relative to size of category j at time t + 1
Ltiintensity of annual loss of category i during interval (YtYt+1) relative to size of category i at time t
Rtinintensity of annual transition from category i to category n during interval (YtYt+1) relative to size of category i at time t
Wtnuniform intensity of annual transition from all non-n categories to category n during interval (YtYt+1) relative to size of all non-n categories at time t
Table 3. Summary of LULC map accuracies for 2015 and 2021 (UA: user’s accuracy, PA: producer’s accuracy, OA: overall accuracy).
20152021
Land UseUA (%)PA (%)F-ScoreUA (%)PA (%)F-Score
Informal settlement756067968892
Bare land10092961008190
Water100100100100100100
Other urban959896959997
Vegetation99100100100100100
OA (%) 9697
Disclaimer/Publisher’s Note: The statements, opinions and data contained in all publications are solely those of the individual author(s) and contributor(s) and not of MDPI and/or the editor(s). MDPI and/or the editor(s) disclaim responsibility for any injury to people or property resulting from any ideas, methods, instructions or products referred to in the content.

