


Reasons to Pedestrianise Urban Centres: Impact Analysis on Mobility Habits, Liveability and Economic Activities


Abstract
:1. Introduction
2. Literature Review
3. Case Study
3.1. Transferability and Complementarity
3.2. Policy Framework
3.3. Madrid: A Varied Case Study
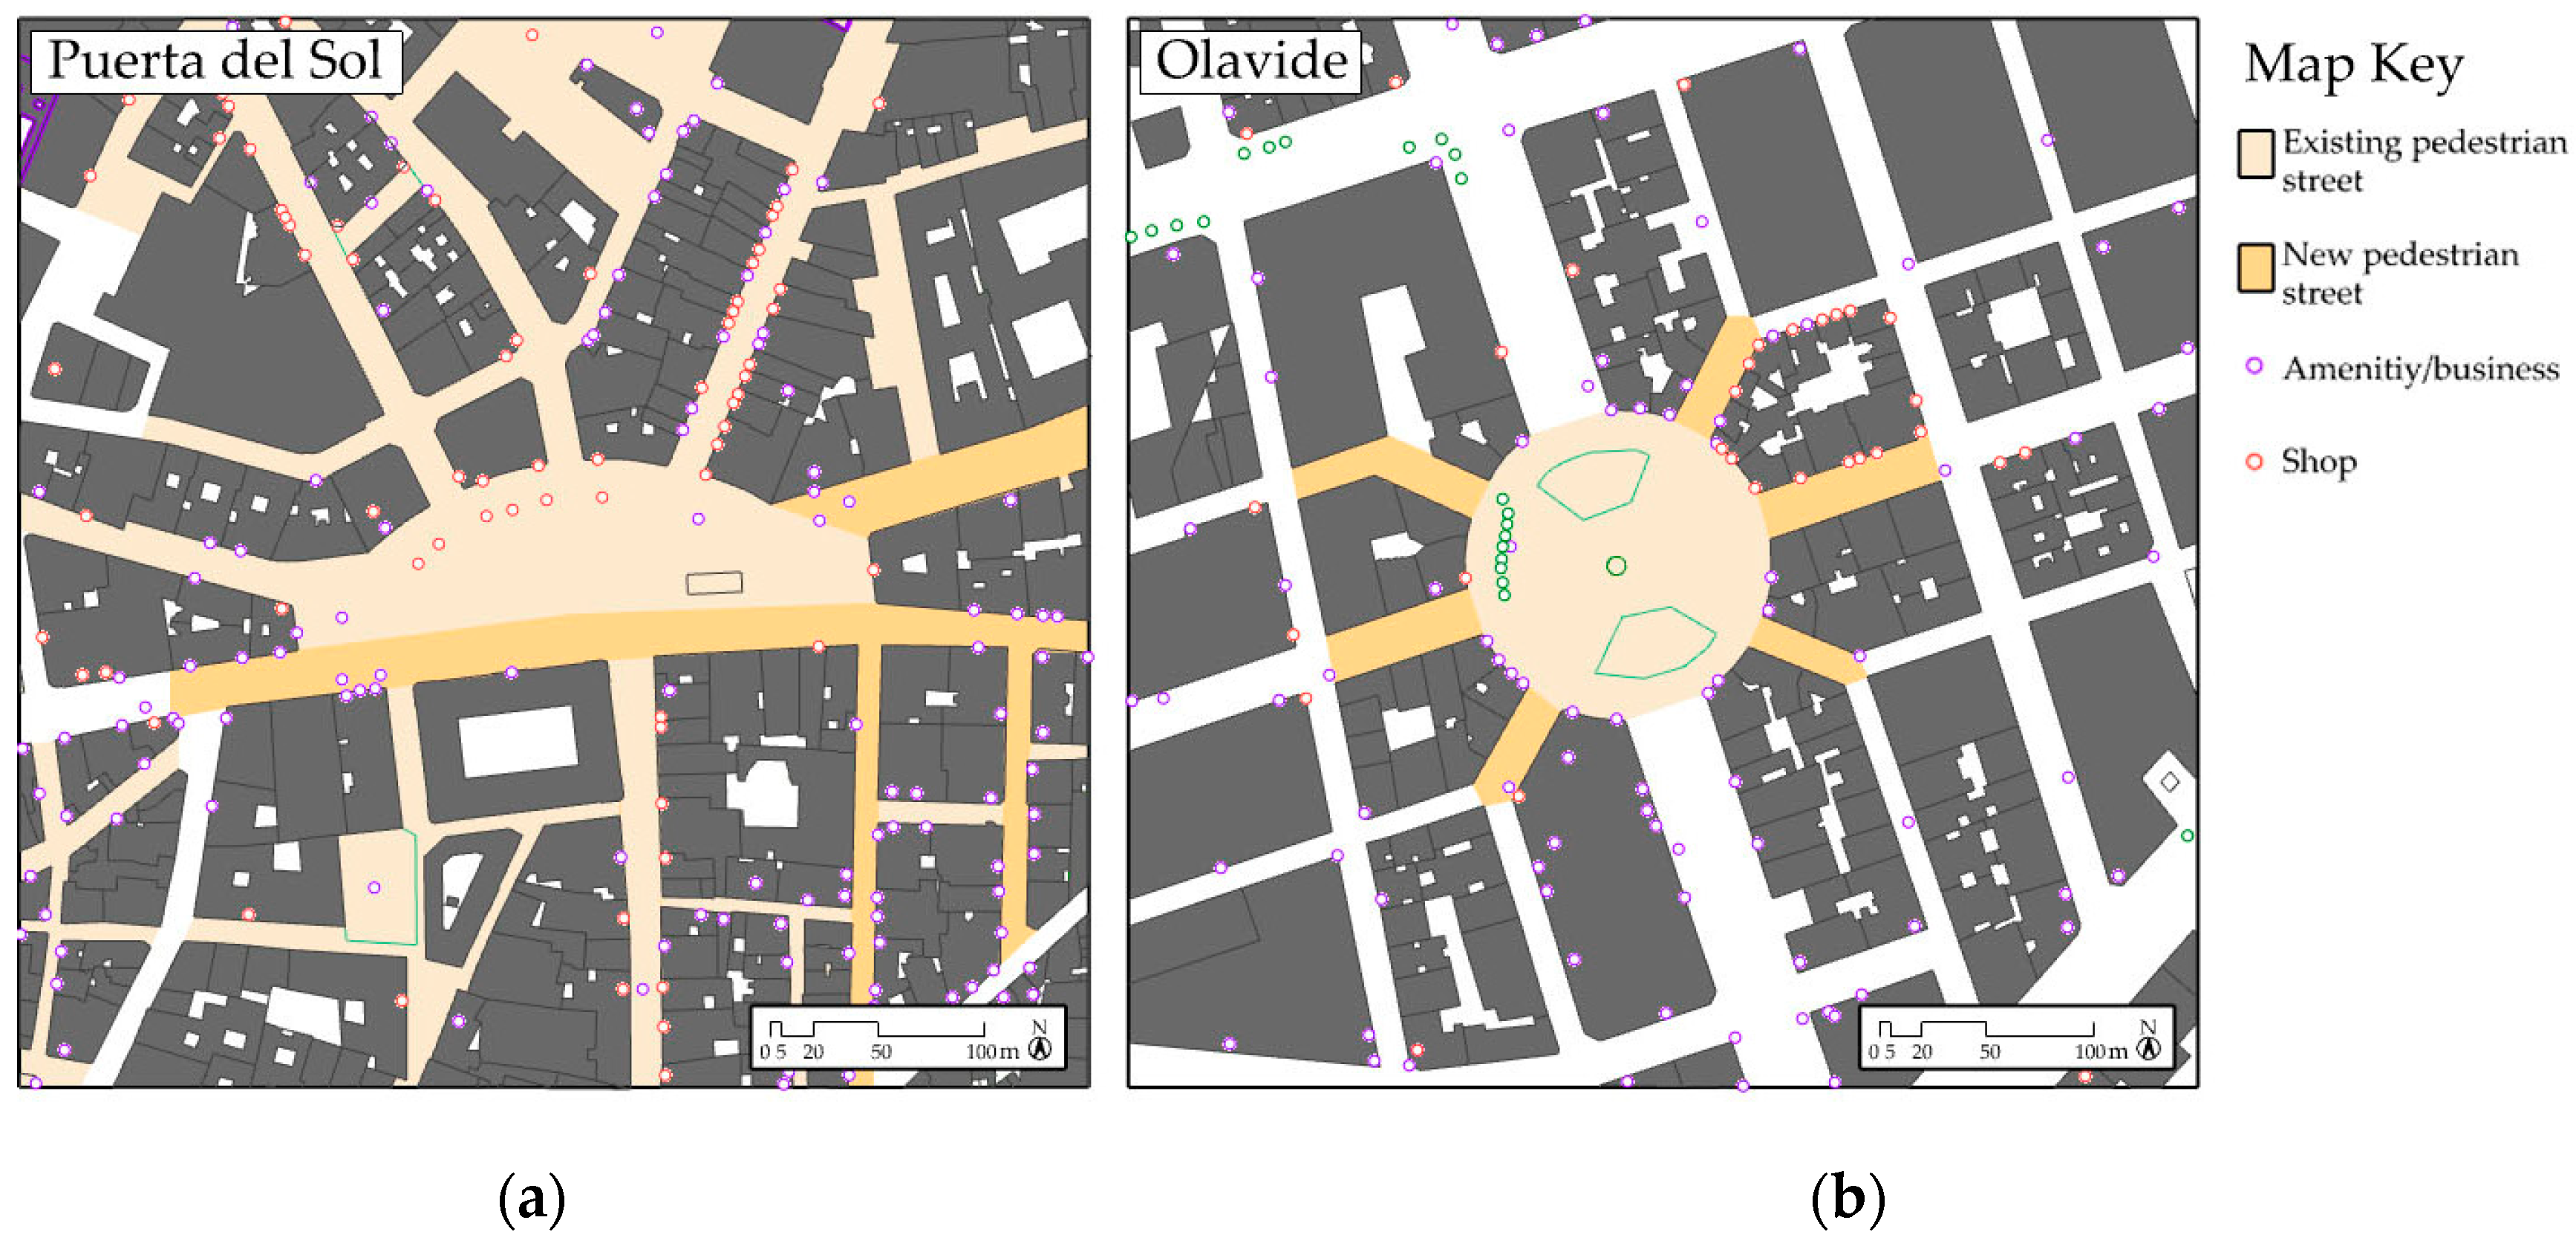
- Puerta del Sol pedestrianisation. In Centro District, the most ambitious Zero-Emission Zone is being deployed. It covers an area of 5546 m2 and has meant the elimination of almost 1 km of road. Puerta del Sol is the central square of the city and symbolizes the centre of Spain (0 km). Sol is known for its bustling activity, shops and bars. A total of 80,000 people walk through it on a Sunday. The square has progressively been pedestrianised since the 1960s, and this action has meant the definitive removal of cars in the area. The latest pedestrianisation has addressed the streets leading to the square that still allowed traffic, and the single-lane road that crossed the square. It is also worth highlighting that this pedestrianisation has meant cutting off one of the main east–west axes of the city centre. This means, on the one hand, that driving through the centre has become more difficult for private motorised vehicles, and on the other hand, it has also meant that three bus lines have been diverted. The 9 day-time bus stops, and 12 night-time bus stops have been relocated to nearby streets (https://www.madrid.es/portales/munimadrid/es/Inicio/Movilidad-y-transportes/Peatonalizacion-de-la-Puerta-del-Sol/?vgnextfmt=default&vgnextoid=3bbdc0c2e5153710VgnVCM1000001d4a900aRCRD&vgnextchannel=220e31d3b28fe410VgnVCM1000000b205a0aRCRD, accessed on 15 September 2023). Please see Figure 1a for more details.
- Plaza de Olavide pedestrianisation. This action is being deployed in Chamberí District, 2 km north of Puerta del Sol. It consists of the removal of cars in six out of eight streets leading to Olavide Square, changing 361 m of road to pedestrian streets, resulting in 26,776 m2 of pedestrianised area. There are two remaining streets that have not been affected by the pedestrianisation since an underground tunnel connects them without interfering with Olavide Square. This district is known for being an upper middle-class residential area. Businesses in the area are of local character and small trades. Olavide Square is a meeting place for residents in the neighbourhood and has different amenities such as many seating areas, trees, a fountain and a playground. It is a traditional Madrilenian neighbourhood, with a tight community and neighbour associations. Nonetheless, many similar neighbourhoods can be found in other cities, since it is characterised by being upper middle class with mixed uses. The table below (Table 1) gives an overview of the main characteristics of each district and pedestrianised area. Please see Figure 1b for more details.
4. Materials and Methods
4.1. Hybrid Survey to Citizens
4.1.1. Customised Survey
- (A)
- Pedestrian general aspects. The first subsection was designed to capture relevant information regarding the respondents’ pedestrian behaviour, such as the most valued attributes of the street and the reason for being in a pedestrian area.
- (B)
- Mobility. It is key to analyse attributes related to mobility, such as car ownership, since they have been found to be related to the acceptability of other car-restriction measures [61].
- (C)
- (D)
- Assessment and satisfaction. These two aspects are presented separately, considering them dependent variables of the rest.
- (E)
- Socioeconomic data. Elements such as gender, age, wealth, and education have been found to be related to travel choices [54].
4.1.2. Survey Campaign
4.1.3. Data Analysis
4.2. Semi-Structured Interview with Retailers
4.2.1. Interview Structure
- (A)
- Pedestrianisation assessment. A series of short questions regarding the pedestrianisation action.
- (B)
- Impacts of the pedestrianisation. In this section, the aim was to learn about changes regarding customers and logistics, addressing therefore, social and environmental elements.
- (C)
- Expected changes in revenue. This section focused on the economic aspect.
- (D)
- Acceptability and satisfaction. As in the case of the citizens’ survey, acceptability and satisfaction were left separate as dependent on the other variables.
- (E)
- Data on commercial activity. The age of the business, number of employees, or turnover are asked about in order to be examined as variables affecting acceptability in future research.
4.2.2. Interviewing Process
4.2.3. Interview Answer Analysis
5. Impacts
5.1. Sample Description
5.2. Impact Assessment: Pedestrians’ Perspective
5.2.1. Impacts on Mobility
5.2.2. Impacts on Liveability
5.2.3. Overall Satisfaction
5.3. Impact Assessment: Local Retailers’ View
6. Discussion
6.1. Discussion of Impacts on Citizens
6.2. Discussion of Impacts on Retail
7. Conclusions and Future Research
Author Contributions
Funding
Institutional Review Board Statement
Informed Consent Statement
Data Availability Statement
Conflicts of Interest
Appendix A

| Section | Question Description | Question Type |
|---|---|---|
| (A) Pedestrian general aspects | Pedestrian area of the respondent | Single-answer question |
| Awareness of Madrid 360 pedestrianisation scheme | ||
| Frequency with which the respondent visits the pedestrianised area | ||
| Changes in frequency with which they visit the area | ||
| Reason for visiting the area | ||
| Most valued street qualities as a pedestrian | Ranking question | |
| (B) Mobility | Do you have a…: car/driving license/public transport pass/motorcycle/bicycle | Multi-answer question |
| Most frequently used mode to access the area (before and after pedestrianisation) | Multi-answer question | |
| Effect in commute of traffic restrictions caused by pedestrianisation | Multi-answer question | |
| (C) Impacts | Level of agreement with effects of the pedestrianisation regarding the following: attractiveness of the area, pedestrian safety, new businesses, shopping in the neighbourhood, traffic congestion, difficulty parking | Likert Scale (1 strongly disagree, 5 strongly agree) |
| Changes in habits as a result of pedestrianisation: I…walk, cycle, use public transport, use my car, make use of public spaces, eat out in the area, shop in the area…more often/the same/less often | Matrix | |
| (D) Assessment and satisfaction | Assessment: How beneficial is it | Likert Scale (1 not at all, 5 very) |
| Level of satisfaction | ||
| (E) Socioeconomic data | Age | Single-answer question |
| Gender | ||
| Level of studies | ||
| Occupation | ||
| Mobility issues | ||
| Household structure | ||
| Monthly income |
| Section | Question Description | Question Type |
|---|---|---|
| (A) Pedestrianisation assessment | Pedestrian area where the business is located | Single-answer question |
| Awareness of Madrid 360 pedestrianisation scheme | ||
| Impact on business assessment | ||
| Possible advantages of the pedestrianisation | ||
| Possible disadvantages of the pedestrianisation | ||
| Level of agreement with the following: awareness of air quality problems/environmental benefits of pedestrianisation/pedestrianisation fosters tourism | Five-point Likert Scale (1 strongly disagree, 5 strongly agree) | |
| (B) Impact of the Pedestrianisation | Age of target group | Multi-answer question |
| Changes in the type of customers | ||
| Changes in age of customers | ||
| Effect on sales level | Five-point Likert Scale (1 gone down a lot, 5 gone up a lot) | |
| Effect of following factors on sales: difficulty to access by car/lower stock due to logistical problems related to pedestrianisation/customers have changed where they shop/more people in the streets/streets are more pleasant and less noisy | Five-point Likert Scale (1 nothing, 5 very much) | |
| Effect of pedestrianisation on supply of products needed on a regular basis | Five-point Likert Scale (1 strongly disagree, 5 strongly agree) | |
| Percentage of online sales | Single-answer question | |
| Effect of pedestrianisation on online sales: increase in delivery time/increase in costs/problems for delivery/no effect/no online sales service | Multiple-answer question | |
| (C) Expected changes in revenue | Effect on business when pedestrianisation works are finished | Single-answer question |
| (D) Data on commercial activity | Annual turnover | Single-answer question |
| Number of employees | ||
| Age of business |
References
- Claris, S.; Scopelliti, D. Cities Alive: Towards a Walking World; ARUP: London, UK, 2016; Available online: https://www.arup.com/-/media/arup/files/publications/c/cities-alive_towards-a-walking-world_lowres.pdf (accessed on 6 October 2023).
- Smith, K.R.; Brown, B.B.; Yamada, I.; Kowaleski-Jones, L.; Zick, C.D.; Fan, J.X. Walkability and Body Mass Index. Density, Design, and New Diversity Measures. Am. J. Prev. Med. 2008, 35, 237–244. [Google Scholar] [CrossRef]
- Garcia, L.; Pearce, M.; Abbas, A.; Mok, A.; Strain, T.; Ali, S.; Crippa, A.; Dempsey, P.C.; Golubic, R.; Kelly, P.; et al. Non-Occupational Physical Activity and Risk of Cardiovascular Disease, Cancer and Mortality Outcomes: A Dose-Response Meta-Analysis of Large Prospective Studies. Br. J. Sports Med. 2023, 57, 979–989. [Google Scholar] [CrossRef] [PubMed]
- Gallo, M.; Marinelli, M. Sustainable Mobility: A Review of Possible Actions and Policies. Sustainability 2020, 12, 7499. [Google Scholar] [CrossRef]
- Banister, D. The Sustainable Mobility Paradigm. Transp. Policy 2008, 15, 73–80. [Google Scholar] [CrossRef]
- Lee, I.M.; Buchner, D.M. The Importance of Walking to Public Health. Med. Sci. Sports Exerc. 2008, 40, 512–518. [Google Scholar] [CrossRef] [PubMed]
- López-Lambas, M.E.; Sánchez, J.M.; Alonso, A. The Walking Health: A Route Choice Model to Analyze the Street Factors Enhancing Active Mobility. J. Transp. Health 2021, 22, 101133. [Google Scholar] [CrossRef]
- Department for Transport, United Kingdom. Gear Change: A Bold Vision for Cycling and Walking. Available online: https://assets.publishing.service.gov.uk/media/5f1f59458fa8f53d39c0def9/gear-change-a-bold-vision-for-cycling-and-walking.pdf (accessed on 6 October 2023).
- World Health Organisation. WHO Guidelines on Physical Activity and Sedentary Behaviour: Web Annex Evidence. 2020. Available online: https://iris.who.int/bitstream/handle/10665/336657/9789240015111-eng.pdf?sequence=1 (accessed on 6 October 2023).
- Breda, J.; Jakovljevic, J.; Rathmes, G.; Mendes, R.; Fontaine, O.; Hollmann, S.; Rütten, A.; Gelius, P.; Kahlmeier, S.; Galea, G. Promoting Health-Enhancing Physical Activity in Europe: Current State of Surveillance, Policy Development and Implementation. Health Policy 2018, 122, 519–527. [Google Scholar] [CrossRef] [PubMed]
- European Commission. Mobility and Transport. Available online: https://transport.ec.europa.eu/transport-themes/mobility-strategy_en (accessed on 6 October 2023).
- Nieuwenhuijsen, M.J.; Khreis, H. Car Free Cities: Pathway to Healthy Urban Living. Environ. Int. 2016, 94, 251–262. [Google Scholar] [CrossRef]
- Yuen, B.; Chor, C.H. Pedestrian Streets in Singapore. Transportation 1998, 25, 225–242. [Google Scholar] [CrossRef]
- Alfonzo, M.A. To Walk or Not to Walk? The Hierarchy of Walking Needs. Environ. Behav. 2005, 37, 808–836. [Google Scholar] [CrossRef]
- Hass-Klau, C. The Pedestrian and the City, 1st ed.; Routledge: New York, NY, USA, 2015; ISBN 978-41581439-3. [Google Scholar]
- Soni, N.; Soni, N. Benefits of Pedestrianization and Warrants to Pedestrianize an Area. Land Use Policy 2016, 57, 139–150. [Google Scholar] [CrossRef]
- Dičiunaite-Rauktiene, R.; Gurskiene, V.; Burinskiene, M.; Maliene, V. The Usage and Perception of Pedestrian Zones in Lithuanian Cities: Multiple Criteria and Comparative Analysis. Sustainability 2018, 10, 818. [Google Scholar] [CrossRef]
- Keserü, I.; Wuytens, N.; De Geus, B.; Macharis, C.; Hubert, M.; Ermans, T.; Brandeleer, C. Monitoring the Impact of Pedestrianisation Schemes on Mobility and Sustainability. Vrije Univ. Bruss. 2016, 1, 97–106. [Google Scholar]
- Bertolini, L. From “Streets for Traffic” to “Streets for People”: Can Street Experiments Transform Urban Mobility? Transp. Rev. 2020, 40, 734–753. [Google Scholar] [CrossRef]
- Boveldt, G.; De Wilde, L.; Keseru, I.; Macharis, C. Pedestrianisation as a Step in a Societal Transformation? An Analysis of Support and Opposition in Brussels. SSRN Electron. J. 2022, 143, 104577. [Google Scholar] [CrossRef]
- Shergold, I.; Melia, S. Pedestrianisation and Politics: A Case Study. Proc. Inst. Civ. Eng. Transp. 2018, 171, 30–41. [Google Scholar] [CrossRef]
- Castillo-Manzano, J.I.; Lopez-Valpuesta, L.; Asencio-Flores, J.P. Extending Pedestrianization Processes Outside the Old City Center; Conflict and Benefits in the Case of the City of Seville. Habitat Int. 2014, 44, 194–201. [Google Scholar] [CrossRef]
- Szarata, A.; Nosal, K.; Duda-Wiertel, U.; Franek, L. The Impact of the Car Restrictions Implemented in the City Centre on the Public Space Quality. Transp. Res. Procedia 2017, 27, 752–759. [Google Scholar] [CrossRef]
- Lydon, M.; Bartman, D.; Woudstra, R.; Khawarzad, A. Tactical Urbanism: Short Term Action, Long Term Change. Str. Plans 2012, 1, 25. [Google Scholar]
- Vecchio, G.; Tiznado-Aitken, I.; Mora-Vega, R. Pandemic-Related Streets Transformations: Accelerating Sustainable Mobility Transitions in Latin America. Case Stud. Transp. Policy 2021, 9, 1825–1835. [Google Scholar] [CrossRef]
- Oldenburg, R.; Brissett, D. The Third Place. Qual. Sociol. 1982, 5, 265–284. [Google Scholar] [CrossRef]
- Gössling, S.; Kees, J.; Litman, T. The Lifetime Cost of Driving a Car. Ecol. Econ. 2022, 194, 107335. [Google Scholar] [CrossRef]
- Porter, C.D.; Brown, A.; DeFlorio, J.; McKenzie, E.; Tao, W.; Vimmerstedt, L. Effects of Travel Reduction and Efficient Driving on Transportation: Energy Use and Greenhouse Gas Emissions. In Effects of Travel Reduction and Efficient Driving on Transportation: Energy Use and Greenhouse Gas Emissions; Department of Energy: Washington, DC, USA, 2013; Volume 98. [Google Scholar]
- Tolley, R. Sustainable Transport: Planning for Walking and Cycling in Urban Environments, 1st ed.; Woodhead Publishing Limited: Cambridge, UK, 2003; ISBN 9786021018187. [Google Scholar]
- López García de Léaniz, C. Cities at Human Speed: A Favorable Way to Reduce the Pace of Modern Life. Pull and Push Measures for Change. In Proceedings of the Congreso de Ingeniería del Transporte CIT 2021, R-Evolucionando el Transporte Burgos, Burgos, Spain, 6–8 July 2021. [Google Scholar]
- Montgomery, B.; Roberts, P.; World Bank Group Walk. Demands, Constraints and Measurement of the Urban Pedestrian Environment. Available online: https://documents.worldbank.org/curated/en/934421468141572686/pdf/449040NWPBox321IC10tp1181walk1urban.pdf (accessed on 6 October 2023).
- Forsyth, A. What Is a Walkable Place? The Walkability Debate in Urban Design. Urban Des. Int. 2015, 20, 274–292. [Google Scholar] [CrossRef]
- Ortega, E.; Martín, B.; De Isidro, Á.; Cuevas-Wizner, R. Street Walking Quality of the ‘Centro’ District, Madrid. J. Maps 2020, 16, 184–194. [Google Scholar] [CrossRef]
- D’Arcy, L. A Multidisciplinary Examination of Walkability: Its Concept, Measurement and Applicability. Ph.D. Thesis, Dublin City University, Dublin, Ireland, 2013. [Google Scholar]
- Pozueta, J.; Daudén, F.J.L.; Schettino, M.P. La Ciudad Paseable: Recomendaciones Para la Consideración de los Peatones en el Planeamiento, el Diseño Urbano y la Arquitectura; Centro de Estudios y Experimentación de Obras Públicas: Madrid, Spain, 2009; ISBN 9788477905394. [Google Scholar]
- García-Palomares, J.C. Urban Sprawl and Travel to Work: The Case of the Metropolitan Area of Madrid. J. Transp. Geogr. 2010, 18, 197–213. [Google Scholar] [CrossRef]
- Handy, S.L.; Boarnet, M.G.; Ewing, R.; Killingsworth, R.E. How the Built Environment Affects Physical Activity: Views from Urban Planning. Am. J. Prev. Med. 2002, 23, 64–73. [Google Scholar] [CrossRef] [PubMed]
- Appleyard, D.; Lintell, M. Journal of the American Institute of Planners The Environmental Quality of City Streets: The Residents’ Viewpoint. 1972. Available online: https://onlinepubs.trb.org/Onlinepubs/hrr/1971/356/356-008.pdf (accessed on 6 October 2023).
- Sastre, J.; Sastre, A.; Gamo, A.M.; Gaztelu, T. “Economic Impact of Pedestrianisation in Historic Urban Centre, the Valdemoro Case—Study (Spain). Procedia Soc. Behav. Sci. 2013, 104, 737–745. [Google Scholar] [CrossRef]
- Hass-Klau, C. A Review of the Evidence from Germany and the UK. Transp. Policy 1993, 1, 21–31. [Google Scholar] [CrossRef]
- Demir, H.H.; Cakiroglu, I.; Alyuz, U.; Demir, G. Evaluation Environmental and Social Impacts of Pedestrianization in Urban Historical Areas: Istanbul Historical Peninsula Case Study. J. Traffic Logist. Eng. 2016, 4, 83–87. [Google Scholar] [CrossRef]
- Yoshimura, Y.; Kumakoshi, Y.; Fan, Y.; Milardo, S.; Koizumi, H.; Santi, P.; Murillo Arias, J.; Zheng, S.; Ratti, C. Street Pedestrianization in Urban Districts: Economic Impacts in Spanish Cities. Cities 2022, 120, 103468. [Google Scholar] [CrossRef]
- Chung, J.H.; Yeon Hwang, K.; Kyung Bae, Y. The Loss of Road Capacity and Self-Compliance: Lessons from the Cheonggyecheon Stream Restoration. Transp. Policy 2012, 21, 165–178. [Google Scholar] [CrossRef]
- Civitas Caravel. Available online: https://civitas.eu/sites/default/files/CARAVEL%20-%20BURGOS%20MERT%2006.02.pdf (accessed on 6 October 2023).
- Civitas Modern. Available online: http://civitas.eu/sites/default/files/modern_vg_m05.01_0.pdf (accessed on 6 October 2023).
- Chiquetto, S. The Environmental Impacts from the Implementation of a Pedestrianization Scheme. Transp. Res. Part D Transp. Environ. 1997, 2, 133–146. [Google Scholar] [CrossRef]
- Forkenbrock, D.J. Assessing the Social and Economic Effects of Transportation Projects; Transportation Research Board: Washington, DC, USA, 2001; Volume 31. [Google Scholar]
- Monzon, A.; Julio, R.; Garcia-Martinez, A. Hybrid Methodology for Improving Response Rates and Data Quality in Mobility Surveys. Travel Behav. Soc. 2020, 20, 155–164. [Google Scholar] [CrossRef]
- Goodwin, P.; Hass-klau, C.; Cairns, S. Evidence on the Effects of Road Capacity Reduction on Traffic Levels. Traffic Eng. Control 1998, 39, 348–354. [Google Scholar]
- Gehl, J.; Svarre, B. How to Study Public Life, 1st ed.; Island Press: Washington, DC, USA, 2013; ISBN 9781610914239. [Google Scholar]
- Madrid City Council. LoCUS Public Space and Mobility. The Transformation of Madrid’s Centro. Available online: https://www.madrid.es/UnidadWeb/Contenidos/Ficheros2015/centerpdf.pdf (accessed on 6 October 2023).
- Gragera, A.; Albalate, D.; Bel, G.; Schaj, G.; Cañas, H.; Aquilué, I.; Helder, J.; Espindola, L.; Mósca, M.; Edelstam, M.; et al. Full Report: Urban Mobility Strategies during COVID-19; EIT Urban Mobility: Munich, Germany, 2021; pp. 17–18. [Google Scholar]
- Silva, P. Tactical Urbanism: Towards an Evolutionary Cities’ Approach? Environ. Plan. B Plan. Des. 2016, 43, 1040–1051. [Google Scholar] [CrossRef]
- Semple, T.; Fountas, G. Demographic and Behavioural Factors Affecting Public Support for Pedestrianisation in City Centres: The Case of Edinburgh, UK. Int. J. Transp. Sci. Technol. 2023, 12, 103–118. [Google Scholar] [CrossRef]
- Parajuli, A.; Pojani, D. Barriers to the Pedestrianization of City Centres: Perspectives from the Global North and the Global South. J. Urban Des. 2018, 23, 142–160. [Google Scholar] [CrossRef]
- Madrid Region, Sustainable Mobility Ordinance 2018. Available online: https://www.bocm.es/boletin/CM_Orden_BOCM/2021/09/21/BOCM-20210921-25.pdf (accessed on 6 October 2023).
- Madrid Regional Transport Consortium CRTM. Home Mobility Survey 2018. Available online: https://www.crtm.es/media/emxacg4d/edm18_sintesis.pdf (accessed on 6 October 2023).
- Strambi, O. Survey Methods for Transport Planning. Transportes 1997, 5, 272. [Google Scholar] [CrossRef]
- Richardson, A.J.; Ampt, E.S.; Meyburg, A.H. Survey Methods for Transport Planning; Eucalyptus Press: Melbourne, Australia, 1995; pp. 1–14. [Google Scholar]
- Hopkinson, P.G.; May, A.D.; Turvey, I.G. Pedestrian Amenity: On Street Survey Design. In Working Paper: Institute of Transport Studies; University of Leeds: Leeds, UK, 1987; Available online: https://eprints.whiterose.ac.uk/2315/1/ITS126_WP243_uploadable.pdf (accessed on 6 October 2023).
- Tarriño-Ortiz, J.; Soria-Lara, J.A.; Gómez, J.; Vassallo, J.M. Public Acceptability of Low Emission Zones: The Case of “Madrid Central”. Sustainability 2021, 13, 3251. [Google Scholar] [CrossRef]
- Livi, A.D.; Clifton, K.J. Issues and Methods in Capturing Pedestrian Behaviors, Attitudes and Perceptions: Experiences with a Community-Based Walkability Survey. In Transportation Research Board, Annual Meeting; Transportation Research Board: Washington, DC, USA, 2004; 17p. [Google Scholar]
- McIntosh, M.J.; Morse, J.M. Situating and Constructing Diversity in Semi-Structured Interviews. Glob. Qual. Nurs. Res. 2015, 2. [Google Scholar] [CrossRef]
- Cervero, R.; Radisch, C. Travel Choices in Pedestrian versus Automobile Oriented Neighborhoods. Transp. Policy 1996, 3, 127–141. [Google Scholar] [CrossRef]
- Gehl, J. Cities for People; Island Press: Washington, DC, USA, 2010; ISBN 9781597265737. [Google Scholar]
- Tarriño-Ortiz, J.; Soria-Lara, J.A.; Silveira-Santos, T.; Vassallo, J.M. The Impact of Low Emission Zones on Retail Activity: Madrid Central Lessons. Transp. Res. Part D Transp. Environ. 2023, 122, 103883. [Google Scholar] [CrossRef]
- Cairns, S.; Atkins, S.; Goodwin, P.; Bayliss, D. Disappearing Traffic? The Story so Far. Proc. Inst. Civ. Eng. Munic. Eng. 2002, 151, 13–22. [Google Scholar] [CrossRef]

| Pedestrianised Area (Name) | Pedestrianised Streets (m) | District Population (pers.) | District Area (km2) | District Density (pers./km2) | Average Annual Income |
|---|---|---|---|---|---|
| Puerta del Sol | 921 | 139,682 | 5.23 | 26,717 | 36,072 |
| Olavide | 631 | 137,280 | 4.68 | 29,340 | 54,372 |
| Variables | Categories | Sol | Olavide | ||
|---|---|---|---|---|---|
| Respondents (n = 369) | % Sample | Respondents (n = 386) | % Sample | ||
| Age | <18 * | 9 | 2 | 3 | 1 |
| 18–29 | 170 | 46 | 100 | 26 | |
| 30–44 | 85 | 23 | 131 | 34 | |
| 45–59 | 76 | 21 | 97 | 25 | |
| >60 | 29 | 8 | 55 | 14 | |
| Gender | Female | 202 | 55 | 202 | 52 |
| Male | 158 | 43 | 173 | 45 | |
| I prefer not to say | 9 | 2 | 11 | 3 | |
| Level of education | Primary/Secondary education | 26 | 7 | 15 | 4 |
| Higher secondary education/ Vocational training | 112 | 30 | 57 | 15 | |
| University degree | 151 | 41 | 151 | 39 | |
| Post-graduate degree | 80 | 22 | 163 | 42 | |
| Occupation | Student | 96 | 26 | 36 | 9 |
| Employed | 215 | 58 | 289 | 75 | |
| Unemployed/Not working | 33 | 9 | 26 | 7 | |
| Retired | 25 | 7 | 35 | 9 | |
| Mobility impairments | Yes | 19 | 5 | 9 | 2 |
| No | 350 | 95 | 377 | 98 | |
| Household structure | I live alone | 44 | 12 | 52 | 14 |
| I live with my parents | 100 | 27 | 40 | 10 | |
| I share a flat | 71 | 19 | 55 | 14 | |
| Couple, no children | 73 | 19.8 | 105 | 27 | |
| Household with children under 10 | 30 | 8 | 59 | 15 | |
| Household with all children over 10 years old | 50 | 13 | 71 | 18 | |
| Household with elderly people | 1 | 0.2 | 3 | 3.7 | |
| Household where someone is physically impaired | 0 | 0 | 1 | 0.3 | |
| Monthly income | Less than EUR 1000 | 128 | 35 | 62 | 16 |
| EUR 1000–2000 | 150 | 41 | 142 | 37 | |
| EUR 2000–3000 | 56 | 15 | 98 | 25 | |
| More than EUR 3000 | 35 | 9 | 84 | 22 | |
| Variables | Categories | Sol | Olavide | ||
|---|---|---|---|---|---|
| No. of Business | % Sample | No. of Business | % Sample | ||
| Annual turnover K EUR/year | 0–30 | 3 | 15 | 3 | 17 |
| 30–100 | 6 | 30 | 7 | 39 | |
| 100–500 | 5 | 25 | 6 | 34 | |
| 500–1000 | 2 | 10 | 1 | 5 | |
| 1000–3000 | 2 | 10 | 1 | 5 | |
| More than 3000 | 2 | 10 | 0 | 0 | |
| Number of employees | 0–5 | 10 | 38 | 17 | 85 |
| 5–10 | 9 | 36 | 1 | 5 | |
| 11–20 | 5 | 19 | 2 | 10 | |
| 21–50 | 2 | 7 | 0 | 0 | |
| Over 50 | 0 | 0 | 0 | 0 | |
| Age of the business | Less than a year | 6 | 24 | 2 | 10 |
| 1–3 years | 2 | 7 | 1 | 5 | |
| 3–5 years | 3 | 12 | 2 | 10 | |
| 5–10 years | 2 | 7 | 3 | 15 | |
| More than 10 years | 13 | 50 | 12 | 60 | |
| Walk | Cycle | PT | Car | |||||||||
|---|---|---|---|---|---|---|---|---|---|---|---|---|
| Income | More | Same | Less | More | Same | Less | More | Same | Less | More | Same | Less |
| Less than EUR 1000 | 51.6 | 39.5 | 8.9 | 12.6 | 75.8 | 11.6 | 33.2 | 51.6 | 15.3 | 6.8 | 50.5 | 42.6 |
| EUR 1000–2000 | 42.5 | 52.7 | 4.8 | 9.6 | 83.2 | 7.2 | 25.0 | 63.4 | 11.6 | 3.1 | 65.8 | 31.2 |
| EUR 2000–3000 | 42.9 | 53.9 | 3.2 | 8.4 | 89.6 | 1.9 | 22.7 | 70.1 | 7.1 | 1.3 | 68.8 | 29.9 |
| More than EUR 3000 | 47.1 | 50.4 | 2.5 | 0.0 | 100.0 | 0.0 | 20.2 | 71.4 | 8.4 | 4.2 | 70.6 | 25.2 |
| All | 45.6 | 49.3 | 5.2 | 8.6 | 83.0 | 6.1 | 25.8 | 63.0 | 11.1 | 3.8 | 63.3 | 32.8 |
| Sol | Olavide | |||||||||
|---|---|---|---|---|---|---|---|---|---|---|
| Age | Sample (Sol) | On Foot | PT | Car/Moped | Bicycle/ Scooter | Sample (Olavide) | On Foot | PT | Car/Moped | Bicycle/ Scooter |
| 18–29 | 170 | 7.4 | −3.3 | −9.3 | 3.0 | 100 | 6.3 | −8.0 | −2.5 | 4.4 |
| 30–44 | 85 | 5.9 | 2.8 | −6.3 | −0.9 | 131 | 7.1 | −5.4 | −1.8 | 1.3 |
| 45–59 | 76 | 2.5 | −1.7 | −3.8 | 0.5 | 97 | 2.6 | 0.1 | −1.8 | −1.5 |
| >60 | 29 | −15.4 | 26.2 | −5.7 | −5.8 | 55 | −26.5 | 16.4 | 13.5 | −2.7 |
| All | - | 4.8 | 0.9 | −7.1 | 1.1 | - | 3.3 | −3.9 | −0.7 | 1.7 |
| Sol | Olavide | |||||
|---|---|---|---|---|---|---|
| Income | Use Public Space | Eat Out | Shop | Use Public Space | Eat Out | Shop |
| Less than EUR 1000 | 50 | 31 | 32 | 44 | 23 | 18 |
| EUR 1000–2000 | 33 | 14 | 17 | 51 | 32 | 27 |
| EUR 2000–3000 | 44 | 29 | 33 | 44 | 32 | 27 |
| More than EUR 3000 | 34 | 26 | 37 | 57 | 30 | 26 |
| All | 40 | 22 | 26 | 50 | 29 | 25 |
| Sol | Olavide | |||||
|---|---|---|---|---|---|---|
| Frequency | It Makes the Area More Attractive to Live in, Work in or Visit | Neighbours Prefer to Shop in the Neighbourhood Instead of Other Areas | Has Caused Traffic Congestion in the Area | It Makes the Area More Attractive to Live in, Work in or Visit | Neighbours Prefer to Shop in the Neighbourhood Instead of Other Areas | Has Caused Traffic Congestion in the Area |
| Daily | 3.72 | 3.34 | 3.39 | 4.11 | 3.57 | 3.16 |
| Every 2 weeks | 3.77 | 3.30 | 3.37 | 4.30 | 3.88 | 2.70 |
| Monthly | 3.91 | 3.55 | 3.27 | 3.91 | 3.42 | 3.18 |
| Very rarely | 3.77 | 3.47 | 3.28 | 3.79 | 3.41 | 3.35 |
| All | 3.78 | 3.39 | 3.35 | 4.09 | 4.02 | 3.94 |
| Reason for Being in the Area | Sol | Olavide |
|---|---|---|
| Work | 3.76 | 4.06 |
| Leisure/Shopping | 3.89 | 4.17 |
| Place of residence | 3.86 | 4.01 |
| Passing by | 3.93 | 3.65 |
| All | 3.84 | 4.05 |
| Area | Not at All (1) | A Little (2) | Neutral (3) | Quite (4) | Very (5) |
|---|---|---|---|---|---|
| Olavide (%) | 5 | 6 | 16 | 27 | 46 |
| Sol (%) | 5 | 9 | 18 | 33 | 35 |
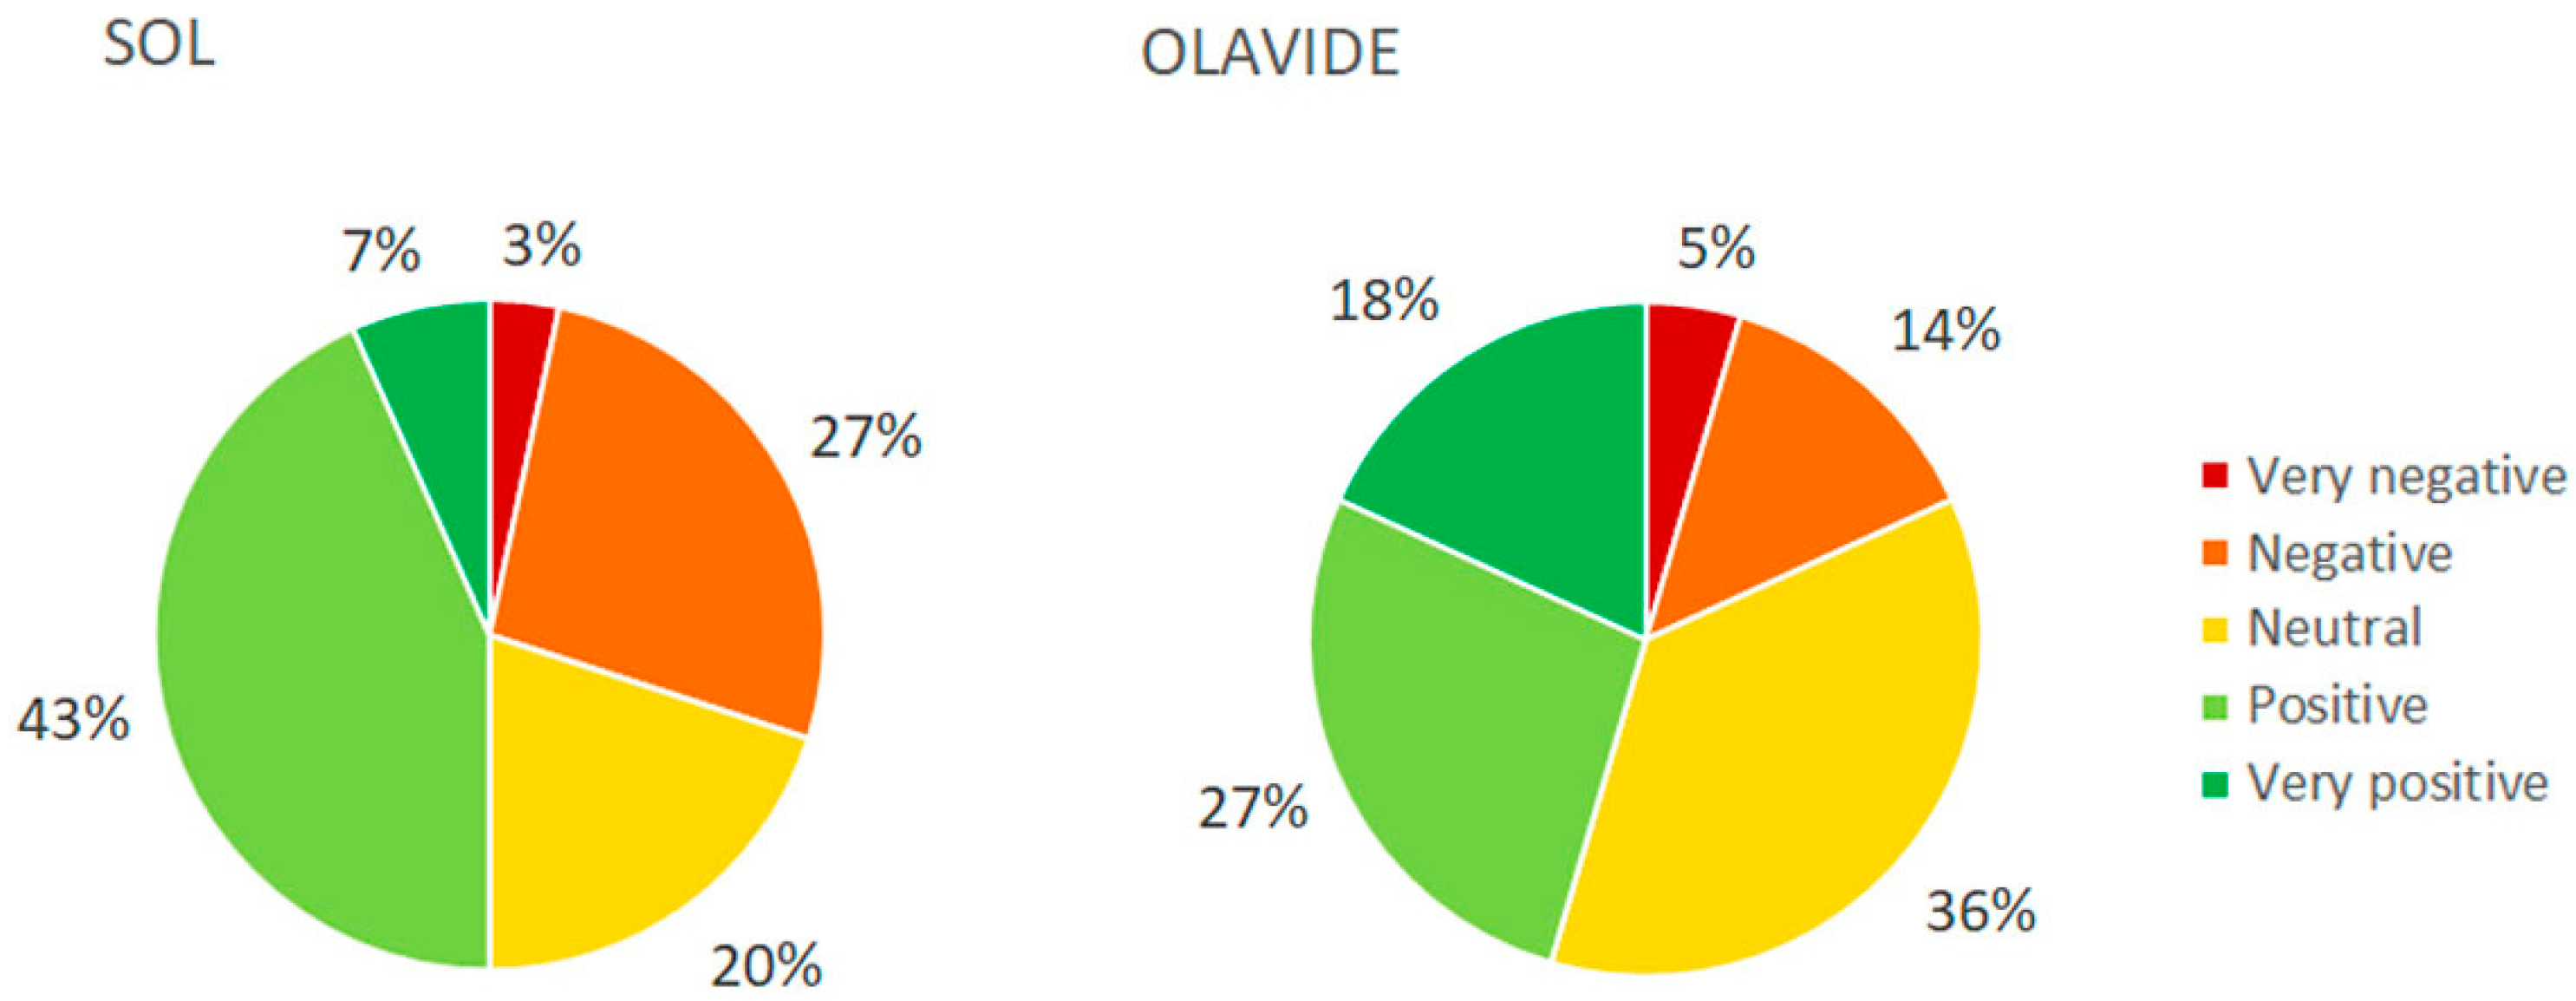
| Area | Very Negative (1) | Negative (2) | Neutral (3) | Positive (4) | Very Positive (5) |
|---|---|---|---|---|---|
| Sol (%) (n = 30) | 3 | 27 | 20 | 43 | 7 |
| Olavide (%) (n = 22) | 5 | 14 | 36 | 27 | 18 |
| Area | Decrease in the Number of Clients and Volume of Business | Will Not Be Affected | Increase in the Number of Clients and Volume of Business |
|---|---|---|---|
| Sol (%) (n = 28) | 25 | 36 | 39 |
| Olavide (%) (n = 22) | 0 | 73 | 27 |
| Topic | Description | Detail | Sol | Olavide |
|---|---|---|---|---|
| Mobility | Variation in intention to use modes due to pedestrianisation (Sol and Olavide aggregated). % of people who will increase (+) or decrease (−) use of each mode. | I walk | 45.6; −5.2 | |
| I cycle | 8.6; −6.1 | |||
| I use PT | 25.8; −11.1 | |||
| I go by car | 3.8; −32.8 | |||
| Increase (+)/reduction (−) in use of each mode to access the area before and after the pedestrianisation (%). | On foot | 5.2 | 3.4 | |
| Bicycle/Scooter | 1.0 | 2.0 | ||
| Public transport | 0.5 | −4.2 | ||
| Private car/Motorcycle | −7.6 | −1.0 | ||
| Liveability | Increase (+)/reduction (−) in the frequency of each habit before and after the pedestrianisation in both areas (%). Respondents were asked whether they did the activities more often than before, less than before or the same. | I use public spaces in the area | 40 | 50 |
| I go shopping in the area | 22 | 25 | ||
| I eat out/go for a drink in the area | 26 | 29 | ||
| Agreement with the statements on a scale from 1 to 5, with 1 being totally disagree and 5 totally agree. | They make the area more attractive to live, work in or visit | 3.78 | 4.09 | |
| Neighbours prefer to shop in the neighbourhood instead of going to other areas | 3.39 | 4.02 | ||
| Has caused traffic congestion in the area | 3.35 | 3.94 | ||
| Satisfaction | Respondents were asked to show the level of agreement from 1 to 5, with 1 being not at all satisfied and 5 very satisfied. | Citizen satisfaction level | 3.84 | 4.05 |
| Topic | Description | Detail | Sol | Olavide |
|---|---|---|---|---|
| Expectations | Effect of the pedestrianisation on business when works are fully finished | Increase in the number of clients and volume of business | 39 | 27 |
| Decrease in the number of clients and volume of business | 25 | 0 | ||
| Not affected | 36 | 73 | ||
| Impact on business | Retailers were asked to assess the impact of pedestrianisation from 1 to 5, with 1 being very negative and 5 very positive | Retail assessment of impact | 3.24 | 3.39 |
Disclaimer/Publisher’s Note: The statements, opinions and data contained in all publications are solely those of the individual author(s) and contributor(s) and not of MDPI and/or the editor(s). MDPI and/or the editor(s) disclaim responsibility for any injury to people or property resulting from any ideas, methods, instructions or products referred to in the content. |
© 2023 by the authors. Licensee MDPI, Basel, Switzerland. This article is an open access article distributed under the terms and conditions of the Creative Commons Attribution (CC BY) license (https://creativecommons.org/licenses/by/4.0/).
Share and Cite
Brownrigg-Gleeson, M.L.; Monzon, A.; Cortez, A. Reasons to Pedestrianise Urban Centres: Impact Analysis on Mobility Habits, Liveability and Economic Activities. Sustainability 2023, 15, 16472. https://doi.org/10.3390/su152316472
Brownrigg-Gleeson ML, Monzon A, Cortez A. Reasons to Pedestrianise Urban Centres: Impact Analysis on Mobility Habits, Liveability and Economic Activities. Sustainability. 2023; 15(23):16472. https://doi.org/10.3390/su152316472
Chicago/Turabian StyleBrownrigg-Gleeson, Mari Luz, Andres Monzon, and Adriana Cortez. 2023. "Reasons to Pedestrianise Urban Centres: Impact Analysis on Mobility Habits, Liveability and Economic Activities" Sustainability 15, no. 23: 16472. https://doi.org/10.3390/su152316472
APA StyleBrownrigg-Gleeson, M. L., Monzon, A., & Cortez, A. (2023). Reasons to Pedestrianise Urban Centres: Impact Analysis on Mobility Habits, Liveability and Economic Activities. Sustainability, 15(23), 16472. https://doi.org/10.3390/su152316472