Article

Exploring Modal Choices for Sustainable Urban Mobility: Insights from the Porto Metropolitan Area in Portugal

CITTA—Centro de Investigação do Território, Transportes e Ambiente, Faculdade de Engenharia da Universidade do Porto, Rua Dr. Roberto Frias s/n, 4200-465 Porto, Portugal
*
Author to whom correspondence should be addressed.
Sustainability 2023, 15(20), 14765; https://doi.org/10.3390/su152014765
Submission received: 8 September 2023 / Revised: 5 October 2023 / Accepted: 9 October 2023 / Published: 11 October 2023
(This article belongs to the Special Issue Urban Mobility and Active Transport Transition)

Abstract

:
Efficient and sustainable urban mobility is critical for contemporary cities, and understanding the factors influencing modal choices is essential for addressing transportation challenges in metropolitan areas. This study focuses on the Porto Metropolitan Area (AMP) in Portugal and aims to gain insights into these factors. Using data from the last mobility survey (IMob) conducted in 2017, a multinomial logit (MNL) model is used to analyze individual modal choices amongst private motorized vehicles (PMVs), public transport (PT), and active modes (AMs). The findings unveiled that demographic, socioeconomic, and travel-related characteristics substantially influence individual modal choices within the studied area. Moreover, probability scenarios highlight the importance of financial considerations, environmental consciousness, and accessibility to public transport in promoting sustainable transportation options. These insights have significant implications for policymakers and stakeholders involved in urban planning and transportation management. This study contributes to the literature by providing valuable insights into individuals’ transportation preferences and behaviors, facilitating decision-making based on evidence for infrastructure improvements and targeted interventions. By promoting sustainable transportation alternatives and reducing reliance on PMVs, this study aims to enhance the livability and sustainability of the AMP, aligning with long-term sustainability goals.

1. Introduction

Efficient and sustainable urban mobility is crucial in contemporary cities, demanding a comprehensive understanding of the factors influencing individuals’ modal choices [1,2,3]. Like many urban regions, the Porto Metropolitan Area (AMP) in Portugal faces numerous transport-related challenges, including traffic congestion, air pollution, and the health implications of sedentary lifestyles [4,5,6].
According to the latest mobility survey conducted in Portugal [7], the AMP is currently facing escalating levels of traffic congestion. It is noteworthy that private motorized vehicles (PMVs) account for nearly 70% of all regional trips, as Rocha et al. highlighted [8]. This congestion not only leads to time delays but also contributes to increased fuel consumption and greenhouse gas emissions [4,6,9,10].
Despite a temporary reduction in traffic and road accidents during the COVID-19 pandemic, the number of vehicles in circulation within the AMP has shown a persistent upward trend [11]. In 2021, it reached the highest recorded value of the decade, with a total of 5.6 million PMVs on the roads. This corresponds to approximately 541 PMVs per thousand inhabitants, indicating that the average number of PMVs per household exceeds one (1.3) [12,13].
An imperative inquiry into the factors driving individuals’ modal choices is warranted to address these pressing concerns associated with transportation and sustainability [14,15]. Understanding why individuals prefer PMVs over public transport (PT) or active modes (AMs) like walking and cycling is essential for developing effective interventions and policies that promote sustainable transport practices [6,16].
These insights have important implications for policymakers and stakeholders involved in urban planning and transportation management. A study’s results can report the development of evidence-based interventions and strategies that aim to enhance the utilization of PT and promote AMs. Policymakers can leverage these findings to guide resource allocation and policy formulation in the AMP, developing targeted strategies and interventions that promote sustainable transport practices in the region to ensure the alignment of transportation planning initiatives with long-term sustainability goals. By reducing reliance on PMVs and fostering sustainable transport alternatives, the overall livability and sustainability of the AMP can be improved in line with the region’s vision for a greener and more efficient transportation system.
Through the analysis of the latest mobility survey dataset (IMob), this study initiates an exploration of the factors that underlie individuals’ daily modal choices within the AMP. Specifically, our research aims to investigate the influence of distinct demographic, socioeconomic, and travel-related characteristics on residents’ choices of PMVs, AMs, and PT.
To achieve this objective, we have used the multinomial logit (MNL) model, a well-known statistical technique renowned for its proficiency in addressing the discrete nature of choice processes, allowing for considering multiple alternatives in travel modal choice analysis [17,18,19]. Furthermore, by understanding how these variables converge and incorporating probability scenarios, this study seeks to provide insights into the development of sustainable transport policies within the region.
The outcomes of this research provide substantial contributions to the academic literature regarding modal choice, offering valuable insights into individuals’ transport preferences and behaviors. The incorporation of probability scenarios introduces novel perspectives on region-specific mobility patterns, enriching both the subject matter and the used methodology.
The sections of this paper are structured into eight parts. In Section 2, we present a review of the existing literature on modal choices, addressing methods and limitations of previous research. Additionally, we highlight research gaps our study aims to fill concerning these methods. Section 3 provides an overview of the study area, offering valuable context and background information. Section 4 presents a detailed data description and explains the variables used in the analysis. Section 5 introduces the model formulation and methodology used in the study, outlining the analytical approach adopted for the analysis.
Moving forward, Section 6 presents the results derived from applying the statistical model, providing the probabilities associated with the generated scenarios for individuals choosing sustainable mobility options and exploring the likelihood of different outcomes. Section 7 discusses the findings presented in Section 6, elucidating the various factors influencing modal choices within the AMP. Finally, Section 8 delivers the concluding remarks derived from the research findings and provides recommendations for future research directions, offering potential ways for further exploration and investigation.

2. Literature Review

Previous studies have extensively underscored the importance of examining the multifaceted factors influencing individuals’ modal choices, including travel time, cost, convenience, accessibility, and socio-demographic characteristics [20,21,22,23,24]. Notably, Redman et al., Anderson, Tyrinopoulos et al., and Morton et al. [25,26,27,28] highlighted that PT users consider several factors, such as reliability, fare affordability, personal safety, and ease of access to stations or stops in diverse areas of the city, to encourage their utilization. Moreover, Saelens et al. and Humpel et al. [29,30] found that the availability and quality of infrastructures, such as dedicated cycling lanes and pedestrian walkways, significantly influence individuals’ modal choices regarding AM. These findings further emphasize the need to consider and prioritize the development of well-designed and accessible infrastructure when promoting sustainable transport practices [25,26,27,28,29,30].
Rasca & Saeed, López & Wong, and Saelens et al. [23,31,32] also uncovered the complex interaction between psychological and social factors, including attitudes toward different transport modes, social norms, and cultural practices, which significantly impact individuals’ preferences and behaviors when it comes to choosing a transport mode.
In line with this, studies conducted by Maldonado-Hinarejos et al., de Oña & de Oña, and Guerra et al. [33,34,35] emphasized the importance of enhancing the quality and accessibility of PT as a means to facilitate modal shifts toward sustainable transport options. Such improvements can considerably improve the likelihood of individuals choosing PT over PMVs for their travel needs. Furthermore, Idris et al. and Chandra & Chalumuri [36,37] underscore the significance of integrated and multimodal transport options that align with individual preferences and needs. This approach not only enhances the convenience and accessibility of transportation but also plays a crucial role in promoting sustainable mobility practices.
In previous research, conventional methods like field surveys, interviews, and travel data analysis have been extensively used to gain valuable insights into modal choices [38]. These studies often rely on traditional four-step models, including the binary logit (BL) model [39], MNL model, nested logit (NL) model [40], and mixed multinomial logit model [18]. However, it is important to note the limitations of these conventional models, as they often assume the independence of irrelevant alternatives (e.g., MNL), which may not always accurately reflect natural human behavior, as pointed out by Minal & Sekhar [41]. Furthermore, these models may struggle to capture the complex interactions among the various factors influencing modal choices. While these models may not provide exact predictions of the chosen mode for each individual, they can offer insights into the probabilities associated with each choice [42,43].
To overcome the MNL limitations, this study adopts a multifaceted approach. Firstly, it seeks to address these research gaps, including the need for a more inclusive methodological strategy to explore the likelihood of factors influencing modal choices. This involves applying extensive data from the IMob survey and using the MNL model to facilitate a more nuanced investigation of these factors. Furthermore, recognizing the inherent constraints of traditional models, this study introduces the integration of probabilistic scenarios as a fundamental tool. This approach is motivated by the critical importance of addressing uncertainties that are an integral part of decision-making processes, especially in the context of modal choices and, more specifically, in the advancement of sustainable mobility.
This methodology entails considering different scenarios, each with an assigned probability, to evaluate how these scenarios would affect sustainable mobility [15,44,45]. By integrating these probabilities into long-term planning, decision-makers can assess different scenarios’ effects, risks, and opportunities. This approach enables researchers and policymakers to make evidence-based decisions regarding infrastructure improvements, resource allocation, and service quality enhancements based on specific characteristics. The objective is to attract more individuals to embrace sustainable transportation options, including public transport, walking, and cycling [45,46,47,48,49].

3. Studied Area

In 2017, Statistics Portugal (INE), in collaboration with the Statistical Office of the European Union (Eurostat), conducted the IMob survey to examine travel patterns in Portugal. This survey provided a valuable dataset for exploring mobility patterns and modal preferences among Portuguese residents aged between 6 and 84 years old. It collected data on several variables, including household characteristics, trip purposes, transport modes, and travel distances. This dataset allowed for a comprehensive evaluation of urban mobility within the AMP, offering valuable insights into the diverse travel behaviors of its residents.
To provide context, the AMP holds significant importance in Portugal’s population and urban landscape background. It is situated in northern Portugal, encompasses 17 municipalities, and spans about 2041 km2. With approximately 1.7 million residents, the AMP represents a substantial portion of Portugal’s total population, accounting for roughly 17% of the country’s inhabitants [50].
Nevertheless, the AMP faces substantial urban planning challenges, including traffic congestion, air quality concerns, and the reliance on PMVs, accounting for nearly 70% of all regional trips [16]. The environmental implications of these challenges underscore the AMP’s significance as a compelling case study, with broader implications for global urban development and sustainability efforts. Transitioning from these challenges, attempts to enhance urban mobility practices in the AMP encompass key aspects, including addressing accessibility challenges, effectively managing pollutant emissions, and integrating land use with transport planning. Such measures are essential for overcoming the mobility challenges in rapidly growing metropolitan areas [1,3,9,16].
Considering the AMP’s dense population and extensive geographic reach within Portugal, studying transport behaviors and preferences is fundamental for the country. This research aims to contribute to developing sustainable transport initiatives that can profoundly influence many individuals in Portugal. Moreover, the insights gained can be instrumental in fostering more efficient and sustainable urban mobility practices within the AMP and other cities facing similar mobility challenges.
According to the IMob report published by INE [7], the number of daily trips within the AMP exceeds 3.4 million, accounting for a substantial portion of the moving population, precisely 78.9%, as illustrated in Figure 1. This statistic underscores the high level of mobility and transportation activity within the region, highlighting the need to develop effective transportation policies and interventions that cater to the needs of the AMP residents.

4. Data Collection

The data obtained from the 2017 IMob survey includes a substantial sample size of 18,169 valid household responses. Within this dataset, participants reported a total of 80,314 trips within the AMP region. Notably, the survey’s sample size represents approximately 2.5% of the total daily trips documented by the INE [7]. This sample size is considered significant for conducting analyses and drawing meaningful conclusions about transport behaviors within the AMP [51].
The IMob survey collected a comprehensive range of data related to travel behavior in the AMP. The household and individual characteristics data help understand the socio-demographic factors influencing travel behavior [52,53]. Information about trip purpose enables the identification of patterns and preferences for various transport modes. By exploring the motivations behind individuals’ trips, whether related to work, leisure, or school, we can gain insights into the most suitable transport modes for each specific trip purpose [54]. The recorded transport modes also yield valuable information about individuals’ specific transport choices, encompassing PMV, PT, or AM options. The distances traveled, and data on personal preferences, attitudes, education, occupation, and per capita income provide a comprehensive understanding of how socio-demographic and trip variables influence modal selection, offering a holistic view of their overall perception of sustainable transport options [55,56,57].
A preliminary examination of the collected data was conducted to ensure the robustness and validity of the model. The primary goal was to identify the most suitable variables for inclusion in the model. Several criteria were used to assess the appropriateness of the variables, including their relevance to the research question, potential impact on modal choices, and the availability and quality of the associated data. By carefully evaluating the variables based on these criteria, we selected the most meaningful factors that can effectively capture the determinants of modal choices in the AMP.
Precautions were taken during the variable selection process to ensure data confidentiality and adherence to General Data Protection Regulations in Europe. Variables that could compromise participants’ data privacy were excluded from the analysis. Within the context of the AMP, we systematically eliminated variables deemed irrelevant or had a negligible influence on individuals’ daily modal choices. Variables that had a representation of less than 1% in the dataset were considered inconsequential and removed. This decision was made to prioritize variables that had a more substantial impact on the analysis and to avoid potential biases resulting from the inclusion of variables with limited representation.
During the analysis of the collected data, some inconsistencies were identified in the reported travel time variable. As highlighted by Sammer et al. [58], it is essential to acknowledge that household travel surveys often suffer from systematic errors due to underreporting of travel behavior. This underreporting can occur for various reasons, such as memory limitations, survey respondent bias, or omission of certain types of trips [59]. Consequently, excluding the travel time variable from the analysis was considered appropriate to ensure the integrity of the findings. Instead, the focus was directed toward the variable of trip distance, which remained reliable and consistent within the dataset. Previous studies, such as the research conducted by Golob [60], emphasize the significance of distance in influencing modal choices due to its direct correlation with the perception of convenience and efficiency of transport modes. Furthermore, the availability and reliability of distance data are also cited as an advantage over travel time data by Rietveld et al. [61].
The selection of variables significantly influencing modal choices was a critical aspect of this study. Aligning with the recommendations of Ortuzar & Willumsen [62], a thorough examination of each variable selected was conducted to identify any correlations between variables and assess the explanatory power of different categories within each variable. While there is no definitive method for determining the optimal number of variables or classes, this analysis was essential for understanding the relationships and ensuring the model’s accuracy [62].
After completing the data cleaning process, a dataset consisting of 75,680 trips was selected for analysis in this research, and a total of 13 relevant variables were chosen to be included in the model. These variables were chosen to accurately capture the crucial factors influencing modal choices in the AMP, contributing to a comprehensive understanding of the decision-making process. Table 1 provides an overview of the selected variables and their corresponding categories.
The statistical description of the variables presented in Table 1 provides further evidence of the dominance of PMVs in the AMP. The data reveal that PMVs accounted for 68.3% of the total trips in the sample. This finding is consistent with the conclusions from the IMob survey [7], which also indicated that private vehicles were the predominant transport mode in the AMP, constituting 67.6% of all trips made during the week. Additionally, the data show that AM was chosen for 20.4% of the trips, while public transport accounted for 11.3%. These results indicate a significant reliance on motorized transport options in the region, underscoring the urgent need for targeted strategies to promote sustainable alternatives and reduce dependency on PMVs.

5. Model Formulation and Methodology

As highlighted by Zhang et al. [63], transport mode choice is a complex decision-making process influenced by an individual’s travel behaviors and the surrounding environment. Travelers incorporate their personal preferences, opinions, and fundamental needs when planning and scheduling trips, considering various factors such as timing and routes [64,65]. These considerations shape their travel plans, underscoring the significance of comprehending these factors for developing effective transportation plans and targeted policy interventions [6,16,64].
In the context of modal choices, Ortuzar & Willumsen [62] describe how mathematical models play a crucial role in understanding and simulating the decision-making process. Among these models, the multinomial logit model, widely acknowledged in transportation research, captures the intricate interactions among a diverse set of factors influencing modal choice [16,18,41,64].
Our choice of the MNL model is motivated by the intention to establish a robust framework for examining the interrelationships among socio-demographic variables, trip characteristics, and individual preferences [18,41]. The MNL model presents advantages in our specific research context due to its ability to handle multiple choices, a crucial feature given our study’s focus on analyzing different transport options. Furthermore, the MNL model’s well-established structure facilitates identifying critical factors influencing modal choice and forecasting future travel behavior in different situations to assess the potential impacts of policy changes or modifications to transportation infrastructure [18,41].
In this study, we applied the MNL model using Equation (1) to estimate individual modal choice probabilities based on the selected variables and their coefficients [62].
l n L = n = 1 N j = 1 J y n j l n exp β j X n j e x p β J X n
where y n j   are dummy variables indicating whether the individual n chooses jth alternative, i.e., y n j = 1 if category j is selected by citizen n and y n j = 0 otherwise. βj are parameters to be estimated, and X n are categorical independent variables.
The dependent variable in this study represents the choice of transport mode, categorized into three distinct groups: private motorized transport (cars and motorcycles), active modes (cycling and walking), and public transport (buses, metros, urban rail, and regular trains). These categories are essential for understanding the process of modal selection.
The independent variables incorporated into the model were thoughtfully selected to encompass several factors that can significantly influence modal choice in the AMP, as presented in Table 1. The model was executed with these variables to account for individual characteristics and preferences that may influence their daily trips.
Table 2 provides information on the likelihood ratio tests used to assess the model’s performance. These calculations were performed using the IBM SPSS Statistics 27 software, which provides statistical analysis tools to evaluate the significance of the MNL model.
This table displays the likelihood ratio test results for the model features. This statistical method compares the fit of a full model (with all predictor variables) to a reduced model (with specific predictor variables omitted) to determine if including a particular variable significantly enhances the model’s fit. The chi-square statistic measures the difference between the full and reduced models, with a higher value indicating a more substantial improvement when adding the predictor variable.
Significance values (Sig.) below a chosen alpha level (typically 0.05) indicate that the predictor variable significantly impacts the model’s improvement. Smaller p-values reflect a stronger influence of the predictor variable on the model.
Furthermore, we can consider the highest pseudo-R-square value for model selection criteria, which may indicate a superior model fit to the data. In this case, the Nagelkerke pseudo-R-square, with a value of 0.607, indicates the best fit among the provided measures [16].

6. Results

In this section, we present the outcomes of our analysis, shedding light on the statistical significance of each variable within our model. This information is crucial for understanding the factors that influence modal choice among travelers in the study area. In our analysis, with a significance threshold of 0.05 (95%), it is observed that all variables in the model exhibit significance.
We further delve into these findings using separate analyses in three distinct tables, comprehensively exploring the variables.

6.1. Statistical Analysis for PMV vs. AM

In Table 3, we provide the results of the MNL model for the comparison between AMs and PMVs. The table includes the independent variables, their coefficients (β), exponential values (Exp(β)), standard errors, and significance levels (p-values).
The distance is associated with a 42% increase in preference for PMV over AM. Women tend to choose PMVs more than AMs compared with men. The 45–64 age group has the highest preference for AM tips. Preference for an AM is lowest for school trips and highest for leisure activities. On non-working days, there is a decrease in the use of AMs and a 16.3% increase in the use of PMVs. People with higher education tend to prefer AM over PMV trips. Non-workers are more likely to choose an AM over motorized transport. High per capita income is related to a greater tendency to use PMVs. Non-possession of a monthly public transport ticket is associated with a higher preference for PMV trips. People without their own PMV use AMs more often. Those who do not drive or drive sporadically also prefer AMs for their trips.

6.2. Statistical Analysis for PMVs vs. PT

Similarly, Table 4 presents the results of the MNL model for comparing PT and PMVs.
The results showed that individuals between 25 and 44 years old prefer PMV trips, while people over 65 tend to use PT. On non-working days, the use of PT decreases by 71.1%. The preference for PT is higher for going to work and lower for leisure activities. Retirees and people with domestic services tend to choose PT more than employed people; also, unemployed people travel by PT. Higher-income individuals prefer to use PMV, and possessing a monthly public transport ticket increases the likelihood of using this mode. The lack of a PMV increases the possibility of using PT during daily trips. People who do not drive and those who drive sporadically prefer PT, and finally, people with reduced mobility like traveling by PMV.

6.3. Probability Scenarios for PT and AM

The MNL model was used to analyze the data, resulting in estimated coefficients for each independent variable. These coefficients quantify the impact of the independent variables on the log odds of selecting a particular transport mode. By exponentiating these coefficients, odds ratios were derived, providing insights into the relative likelihood of choosing different transport modes. This transformation from log odds to probabilities allows for predicting the likelihood of choosing a specific transport mode for each scenario.
To categorize the continuous distance variable, this study applied specific values for the scenarios, namely, 2 km, 5 km, and 10 km. This approach aimed to differentiate and classify trips into distinct types based on these distance thresholds. Trips with distances below 2 km were assigned a value of 2, while trips with medium distances between 2 km and 5 km were assigned a value of 5. For longer distances exceeding 5 km, a value of 10 was assigned.
This categorization method allows for a clear distinction between trip lengths and facilitates a more comprehensive analysis of the relationship between distance and modal choice [66,67]. Considering these distances, this study aligns with the principles of the 15-min city concept, aiming to prioritize active mobility options, such as walking and cycling, for shorter trips within the urban environment [68,69,70,71]. This approach recognizes the potential benefits of active transportation in promoting health, reducing traffic congestion, and enhancing the livability of cities [4,5,6].
Different scenarios were created to identify individual and trip patterns associated with the highest probabilities of choosing sustainable transport modes over PMVs in the AMP. These scenarios are outlined in detail in Table 5.
By applying the MNL model results to each specific scenario, we could compare the likelihood of choosing sustainable transport modes over PMVs based on individual and trip characteristics. However, it is essential to acknowledge that the MNL model has some limitations and assumptions that can impact its applicability.
The MNL model assumes the independence of observations and the absence of significant multicollinearity among independent variables [41,72,73]. It also assumes linearity in the relationships between independent variables and the probabilities of choosing transport modes [41,42,43,73]. In other words, the MNL model assumes that the impact of changes in each independent variable on the choice probabilities is constant across the entire spectrum of possible values for these variables. This simplifying assumption may not accurately capture more complex, nonlinear relationships between certain socio-demographic factors, trip characteristics, and modal choices, potentially limiting the model’s ability to represent real-world decision-making processes.
Furthermore, our study relied on self-reported survey data, which may be prone to potential response biases. Nevertheless, we tried to mitigate such limitations by thoroughly selecting the variables, as outlined in the data selection section. Even so, the application of the MNL in this study provides a robust framework for comprehending modal choice patterns and their implications for urban planning and mobility strategies in the AMP.

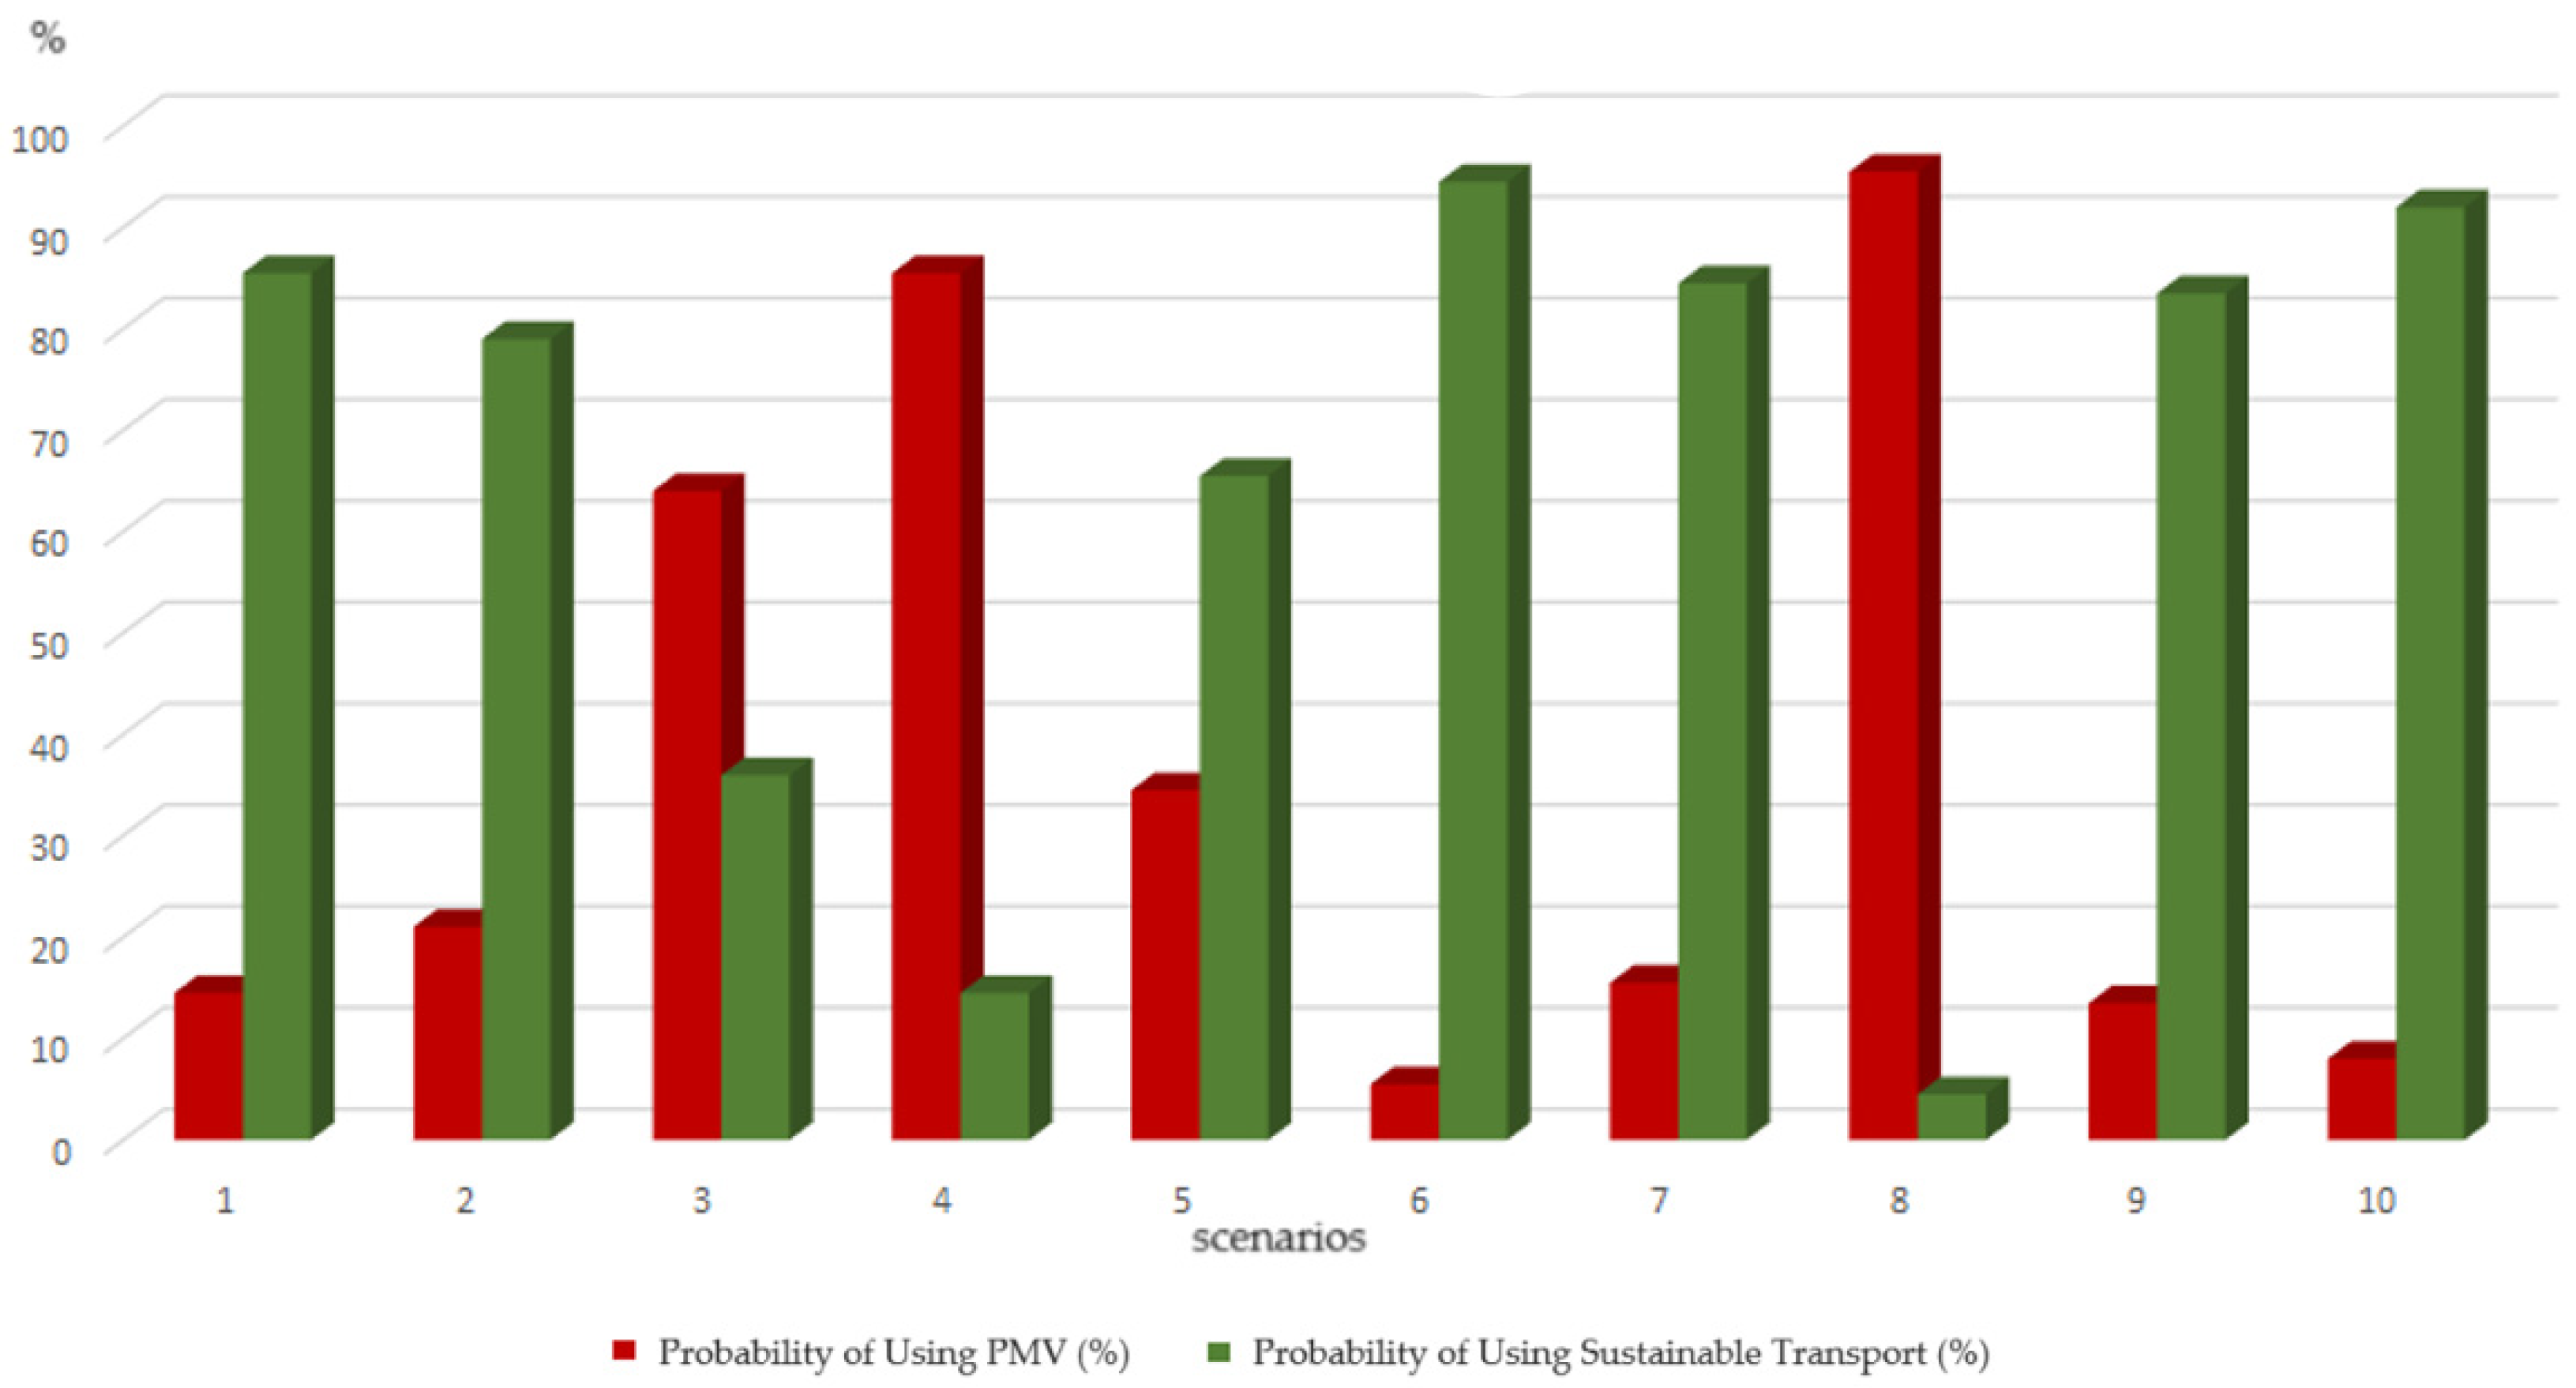
6.4. Exploring the Scenarios for Sustainable Mobility Choices

The selected scenarios, namely, 1, 2, 5, 6, 7, 9, and 10, provide insights into the factors influencing modal choices, particularly in favor of PT and AMs. These scenarios were chosen based on their characteristics that indicate a higher likelihood of individuals selecting sustainable transport options, which is the combined sum of the percentages of using AMs and PT in their trips.
Figure 2 displays the likelihood of using sustainable transport versus PMVs across these scenarios. The analysis of these scenarios allows us to explore the underlying factors that motivate individuals to choose sustainable transport modes in their daily commutes and leisure activities.
Scenario 1 portrays a female between 25 to 44 years old who has completed higher education, and her per capita income surpasses EUR 2000 per month. The combination of a high income and higher education suggests a greater awareness and understanding of sustainable transport alternatives, which can be associated with a conscious decision to reduce carbon emissions and alleviate traffic congestion [16,23,52]. Furthermore, it is important to recognize that having a PMV, even if not used regularly, serves as a backup option and offers flexibility for occasional travel needs. This scenario highlights a deliberate choice to prioritize sustainable commuting options, with an approximate probability of 85%, among individuals with access to private vehicles.
In Scenario 2, we have a woman with a physical limitation who needs to travel on a non-working day. The absence of personal vehicle ownership suggests her reliance on public transport or alternative modes, with an estimated probability of approximately 80%. Additionally, her retirement status and lower income level may impose financial constraints that discourage using PMVs. The lack of a monthly public transport ticket further indicates limited access to regular public transport services, which may hinder her ability to choose sustainable transport modes, even if she desires to do so.
In Scenario 5, a young female who is not physically limited is engaged in her daily commute. She is a student and does not possess a monthly public transport pass or a personal vehicle. These factors suggest that the woman, being a student, may not have a fixed daily trip routine and has limited transport options. However, her occasional use of a PMV indicates that there may be certain situations where she prefers the flexibility of using a private vehicle over relying solely on other alternatives. Notably, in this scenario, the woman can choose any transport mode up to 30% of the time. This additional information highlights her freedom to explore various transport modes and make conscious decisions based on convenience, efficiency, and sustainability [15].
Considering her secondary-level education and student occupation, it is plausible that her current circumstances enable her to access sustainable transport modes at a lower financial cost than owning and maintaining a private vehicle [15]. Given that her trip for educational purposes is between 2 and 5 km, she likely finds it easier to navigate through traffic using sustainable transport options [15,16].
In Scenario 6, we observe a woman who faces limitations in terms of transport options due to her lack of a monthly public transport ticket and not owning a PMV. This suggests that she relies on other forms of transportation, such as rides from others or alternative transport services; the absence of a PMV may constitute a substantial factor motivating her inclination toward sustainable transport options, with an estimated likelihood of approximately 90%. Furthermore, she is retired and lacks formal education, which may contribute to limited financial resources, impacting her ability to access private transportation. It is essential to consider her physical limitations and the distance she needs to travel, exceeding 5 km. It may pose challenges for her in commuting comfortably and efficiently. Depending on the availability and accessibility of PT or support services for individuals with physical limitations in her area, she may face additional difficulties finding suitable transport solutions.
Understanding the specific challenges and limitations faced by individuals in this scenario provides valuable insights into the complexities of their transport needs. It highlights the importance of considering factors such as financial constraints, physical limitations, and the availability of transportation options when developing policies and interventions to improve transport equity and accessibility for vulnerable populations [8,24,25,74]. This may include improving the accessibility of public transportation, enhancing support services for individuals with physical limitations, and exploring innovative transportation solutions to ensure equitable and efficient mobility options for all [3,10,14,16,27,32].
Moving on to Scenario 7, the possession of a monthly public ticket and a PMV indicates that the individual in this scenario has multiple transport options at his disposal. While he occasionally drives, possessing a monthly public transport ticket represents a commitment to utilizing PT, which is considered a more sustainable mode of travel than PMVs. This choice suggests a willingness to contribute to reducing carbon emissions and road congestion. Additionally, the individual’s higher education level may influence his inclination toward sustainable transportation, indicating an awareness of the environmental impact of car usage and a desire to explore alternative transport modes. Research has shown that individuals with higher education levels tend to understand the environmental benefits of sustainable commuting better and are more likely to adopt sustainable mobility practices [16,23,52].
This scenario highlights the interaction between financial considerations and environmental consciousness in transport mode choices. It underlines the importance of promoting sustainable transport alternatives to individuals from different socioeconomic backgrounds. By providing accessible and affordable PT options, policymakers have the potential to encourage a larger proportion of individuals to prioritize sustainable commuting. With an estimated likelihood of approximately 80% of choosing this mode, this approach can potentially lead to positive environmental and societal outcomes [24,26,29,52,53].
In Scenario 9, a man frequently relies on driving for his trips despite possessing a monthly public transport ticket, which may be associated with specific job requirements. In this case, the individual’s modal choice is influenced by two main factors: financial considerations and environmental consciousness. While moderate income suggests the financial capacity to afford PMV ownership and associated expenses, the individual’s higher education level may have fostered an understanding of the benefits of sustainable transportation, resulting in an approximate 80% probability of choosing this mode [16,23,52,75].
In Scenario 10, the individual’s transport choices are influenced by not owning a PMV and possessing a monthly public transport ticket. Interestingly, despite the trip being for leisure activities and the distance being less than 5 km, the individual primarily relies on PT. This suggests that the adoption of sustainable transport modes in this scenario, at approximately 90%, might be predominantly influenced by the constraint of not owning a PMV rather than the distance traveled or the purpose of the trip.
This scenario highlights the complex nature of transport mode choices involving vehicle ownership, access to PT, trip purpose, and personal preferences. It emphasizes the importance of comprehensively understanding individuals’ circumstances and motivations to formulate effective strategies for promoting sustainable transport options [1,5,16,25,57,69].
It is worth noting that we have refrained from delving into particular scenarios, precisely scenarios 3, 4, and 8. This decision is attributable to the observation that these scenarios exhibit a similar propensity toward using PMVs for transportation. Our choice not to analyze these scenarios arises from prioritizing those scenarios that offer a more prominent illustration of the dynamics associated with sustainable transport choices.

7. Discussion

In this section, we examine the results obtained from the applied models. The analysis of the MNL model, combined with the probabilities derived from the scenarios presented in Table 4, provided valuable insights into the various factors that influence individuals’ choices between PMV and sustainable transport modes. The estimated probabilities for each scenario highlight the likelihood of individuals choosing specific transport modes based on their characteristics and observed relationships. Through this analysis, we gained a deeper understanding of the determinants that shape individuals’ preferences and decisions regarding their daily commuting in the AMP.
The outcomes from the MNL model revealed a complex correlation of factors that play significant roles in transport mode choices. Key determinants included individual characteristics such as age, gender, occupation, and education level, which were found to be associated with distinct preferences for different transport options. Moreover, factors related to financial constraints, possession of a monthly public transport ticket, and vehicle ownership also proved influential in shaping travel behavior.
Our findings highlighted the importance of promoting sustainable transport options in the AMP, mainly AMs and PT. Individuals with access to public transport tickets or without personal vehicles demonstrate a higher inclination toward using PT or engaging in active trips by walking and cycling. This underscores the significance of improving access to public transport services and promoting infrastructure for AMs, as these factors strongly influence modal choices in favor of sustainable options [6,10,20,25,27].
Furthermore, this study emphasized the relevance of trip purposes in shaping transport preferences. The results showed that the preference for PMVs increases with longer travel distances, likely due to their convenience and comfort [22,55]. Additionally, women tended to choose PMVs over AMs more often. AMs were favored for leisure activities, while PMVs were more common for school or work commutes.
Individuals with higher education levels preferred AMs, highlighting the importance of education about the benefits of sustainable transport [16,23,52]. Moreover, higher per capita income was correlated with a greater inclination toward PMVs, possibly due to higher financial resources [2,3]. Those without PMVs or who drove infrequently also preferred AMs.
Comparing PMV and PT usage, individuals between 25 and 44 years old preferred PMVs, while those over 65 tended to use public transportation. Owning a monthly public transport ticket increased the likelihood of choosing PT, and possessing a monthly public transport ticket was a significant factor in increasing the probability of choosing PT. It was also observed that PT usage decreased significantly on non-working days, indicating a preference for PMVs for leisure or personal activities.
The analysis also has highlighted the significant impact of private vehicle ownership on individuals’ decisions regarding their choice between PMVs and sustainable transport modes. This highlights the need for effective policies encouraging individuals to rely less on their cars and adopt more environmentally friendly means of traveling within the AMP.
While our findings highlight the importance of endorsing sustainable transport options, it is crucial to acknowledge the challenges associated with implementing these strategies. For example, financial constraints may pose a significant obstacle to developing and maintaining extensive PT infrastructure and AM options. Allocating resources for such initiatives may require substantial financial investments, potentially facing resistance due to budgetary constraints or competing priorities in urban development [48,76].
Another obstacle arises from the deep-rooted car-centric culture in many metropolitan areas [77]. Additionally, understanding the psychological and social factors influencing modal choices is imperative, as exemplified by Rocha et al. [8]. This study, conducted in the AMP, has shed light on the preferences of households to favor PMV trips over sustainable transport modes. Their preference is often attributed to trip speed, comfort, and the perception that PT options are limited when reaching their destinations. In contrast, those who choose PT frequently mention reasons for the absence of PMV ownership and concerns about trip costs. Consequently, encouraging individuals to transition from PMVs to sustainable transport modes could face resistance due to the deeply rooted convenience and comfort associated with PMVs.
Moreover, addressing the concerns of individuals with reduced mobility is critical. Ensuring equitable access to sustainable transport options for all community members is essential. This may involve significantly modifying existing infrastructure and services to accommodate individuals with disabilities [24,74].
Overcoming these cultural resistances would require infrastructural changes and effective communication using awareness campaigns to change public perceptions and behaviors to attract commuters to sustainable transport modes [78].

8. Conclusions and Future Recommendations

In conclusion, the results of this study provide valuable insights for urban planners and policymakers in the AMP regarding promoting sustainable transportation and creating greener, healthier, and socially connected urban environments. The findings emphasize the importance of considering individual characteristics, socioeconomic context, accessibility, and personal preferences when developing effective strategies to reduce reliance on PMVs and encourage the adoption of PT and AMs.
Several recommendations emerge from this study to foster sustainable mobility in the AMP. Firstly, prioritizing enhancements in PT is crucial. This requires substantial investments aimed at elevating accessibility, bolstering reliability, and ensuring affordability [8,10,14,28]. This can be achieved by strategically introducing PT network expansions and fostering efficient intermodal connections. The significance of such improvements in the AMP can transcend regional boundaries, thereby enabling more sustainable and efficient urban transportation systems serving as a model for urban planners in other metropolitan areas with the same issues.
Secondly, the development and expansion of AM infrastructure can offer benefits that reach far beyond the limits of the AMP. The creation of secure and interconnected networks comprising pedestrian and cycling pathways holds the potential to develop urban mobility [15,30,47,49]. By fostering the implementation of bike-sharing programs and enhancing traffic calming measures, cities worldwide can draw inspiration from these findings to create healthier, more sustainable urban environments [45]. These initiatives can reduce traffic congestion and pollution while promoting physical activity and community engagement, making cities more livable and resilient [30,32,46]. Policy interventions play a significant role in shaping transport behavior. Measures such as congestion pricing, parking management strategies, and incentives for sustainable transport modes can encourage individuals to choose more sustainable options over PMVs [1,14,16,25,27]. Additionally, education and awareness campaigns can raise awareness about the benefits of sustainable transport and engage communities, schools, and workplaces to promote sustainable commuting practices [5,6].
Furthermore, we emphasize the ongoing importance of data collection and evidence-based decision-making for sustainable urban development, including monitoring transport patterns and choices within the AMP [7]. Regularly updating modal choice data enables policymakers and urban planners to tailor their strategies to address current sustainability challenges precisely. This, in turn, ensures that transportation policies remain aligned with evolving goals, ultimately contributing to a more sustainable future.
Regularly evaluating the implemented policies and interventions provides valuable insights for continuous evidence-based decision-making. Policymakers, urban planners, and transport agencies are encouraged to consider the implications of this study when formulating and implementing measures to promote sustainable transport modes and reduce reliance on private vehicles.
By implementing these recommendations, the AMP can create a greener urban environment, reduce dependence on motor vehicles, and improve the quality of life for its communities. This requires a comprehensive and multifaceted approach that addresses the complexities of sustainable transport while considering the unique characteristics and needs of the region.
However, it is essential to recognize the limitations of this study. The results are based on a specific analysis using available data and a limited set of variables. Future studies should explore additional relevant variables and consider different geographical and cultural contexts to understand modal choice comprehensively. Adopting multidisciplinary approaches involving experts in urban planning, psychology, and economics can contribute to the formulation of more effective and sustainable transport policies.
Overall, this study contributes to the knowledge of sustainable transportation and provides practical recommendations for urban planners and policymakers in the AMP. By prioritizing sustainable transport options and implementing effective strategies, the region can work toward a more sustainable future, benefiting both the environment and its residents. Through collaboration and a steadfast commitment to data acquisition and informed analysis, policymakers and urban planners can shape the future of mobility in the AMP and other urban areas, creating more accessible, efficient, and sustainable cities, enriching the lives of their residents, and benefiting the environment.

Author Contributions

The authors confirm their contribution to this paper as follows: study conception and design: H.R. and S.F.; data collection: J.P.T., A.L. and S.F.; analysis and interpretation of results: S.F., A.L. and H.R.; draft manuscript preparation: H.R. and S.F. All authors have read and agreed to the published version of the manuscript.

Funding

This work is a result of project DynamiCITY: Fostering Dynamic Adaptation of Smart Cities to Cope with Crises and Disruptions, with reference NORTE-01-0145- FEDER000073, supported by Norte Portugal Regional Operational Programme (NORTE 2020), under the PORTUGAL 2020 Partnership Agreement, through the European Regional Development Fund (ERDF).

Institutional Review Board Statement

Not applicable.

Informed Consent Statement

Not applicable.

Data Availability Statement

The study participants did not give written consent for their data to be shared publicly, so the supporting data are unavailable due to the sensitive nature of this research.

Acknowledgments

We would like to acknowledge Statistics Portugal (INE) for providing us with the data used in this study. In all cases, their commitment reflected a genuine desire to improve the mobility services in the Porto Metropolitan Area (AMP) for all people.

Conflicts of Interest

The authors declare no conflict of interest.

References

  1. Hickman, R.; Hall, P.; Banister, D. Planning more for sustainable mobility. J. Transp. Geogr. 2013, 33, 210–219. [Google Scholar] [CrossRef]
  2. Tyrinopoulos, Y.; Antoniou, C. Factors affecting modal choice in urban mobility. Eur. Transp. Res. Rev. 2013, 5, 27–39. [Google Scholar] [CrossRef]
  3. Le, J.; Teng, J. Understanding Influencing Factors of Travel Mode Choice in Urban-Suburban Travel: A Case Study in Shanghai. Urban Rail Transit 2023, 9, 127–146. [Google Scholar] [CrossRef]
  4. Boogaard, H.; Patton, A.P.; Atkinson, R.W.; Brook, J.R.; Chang, H.H.; Crouse, D.L.; Fussell, J.C.; Hoek, G.; Hoffmann, B.; Kappeler, R.; et al. Long-term exposure to traffic-related air pollution and selected health outcomes: A systematic review and meta-analysis. Environ. Int. 2022, 164, 107262. [Google Scholar] [CrossRef]
  5. Foltýnová, H.B.; Vejchodská, E.; Rybová, K.; Květoň, V. Sustainable urban mobility: One definition, different stakeholders’ opinions. Transp. Res. Part D Transp. Environ. 2020, 87, 102465. [Google Scholar] [CrossRef]
  6. Jordová, R.; Brůhová-Foltýnová, H. Rise of a New Sustainable Urban Mobility Planning Paradigm in Local Governance: Does the SUMP Make a Difference? Sustainability 2021, 13, 5950. [Google Scholar] [CrossRef]
  7. INE—Instituto Nacional de Estatística. Mobilidade e Funcionalidade do Território nas Áreas Metropolitanas do Porto e de Lisboa: 2017; INE: Lisboa, Portugal, 2018; ISBN 978-989-25-0478-0. Available online: https://www.ine.pt/xurl/pub/349495406 (accessed on 10 May 2023).
  8. Rocha, H.; Filgueiras, M.; Tavares, J.P.; Ferreira, S. Public Transport Usage and Perceived Service Quality in a Large Metropolitan Area: The Case of Porto. Sustainability 2023, 15, 6287. [Google Scholar] [CrossRef]
  9. Massar, M.; Reza, I.; Rahman, S.M.; Abdullah, S.M.H.; Jamal, A.; Al-Ismail, F.S. Impacts of Autonomous Vehicles on Greenhouse Gas Emissions—Positive or Negative? Int. J. Environ. Res. Public Health 2021, 18, 5567. [Google Scholar] [CrossRef]
  10. Nieuwenhuijsen, M.J.; Khreis, H. Car free cities: Pathway to healthy urban living. Environ. Int. 2016, 94, 251–262. [Google Scholar] [CrossRef]
  11. ANSR—National Authority for Road Safety. Statistics and Accident Reports Page. Available online: http://www.ansr.pt/Estatisticas/RelatoriosDeSinistralidade/Pages/default.aspx (accessed on 11 May 2023).
  12. IMT—Institute for Mobility and Transport. Sector Reports Page. Available online: https://www.imt-ip.pt/sites/IMTT/Portugues/IMTT/relatoriosectoriais/Paginas/RelatoriosSetoriais.aspx (accessed on 11 May 2023).
  13. INE—Instituto Nacional de Estatística (National Institute of Statistics). Estatísticas dos Transportes e Comunicações: 2021; INE: Lisboa, Portugal, 2022; ISBN 978-989-25-0616-6. ISSN 0377-2292. Available online: https://www.ine.pt/xurl/pub/16909661 (accessed on 12 May 2023).
  14. Youssef, Z.; Alshuwaikhat, H.; Reza, I. Modeling the Modal Shift towards a More Sustainable Transport by Stated Preference in Riyadh, Saudi Arabia. Sustainability 2021, 13, 337. [Google Scholar] [CrossRef]
  15. Schubert, T.F.; Henning, E.; Lopes, S.B. Analysis of the Possibility of Transport Mode Switch: A Case Study for Joinville Students. Sustainability 2020, 12, 5232. [Google Scholar] [CrossRef]
  16. Rocha, H.; Lobo, A.; Tavares, J.P.; Ferreira, S. What Is Leading the Choice Between Motorized and Non-motorized Transport Modes? The Case of Porto Metropolitan Area. In Smart Energy for Smart Transport. CSUM 2022. Lecture Notes in Intelligent Transportation and Infrastructure; Nathanail, E.G., Gavanas, N., Adamos, G., Eds.; Springer: Cham, Switzerland, 2023; pp. 882–901. [Google Scholar] [CrossRef]
  17. McFadden, D. Conditional logit analysis of qualitative choice behavior. In Frontiers in Econometrics; Zarembka, P., Ed.; Academic Press: New York, NY, USA, 1973; pp. 105–142. [Google Scholar]
  18. McFadden, D.; Train, K.E. Mixed MNL Models for Discrete Response. J. Appl. Econom. 2000, 15, 447–470. [Google Scholar] [CrossRef]
  19. Zhao, X.; Yan, X.; Yu, A.; Van Hentenryck, P. Prediction and behavioral analysis of travel mode choice: A comparison of machine learning and logit models. Travel Behav. Soc. 2020, 20, 22–35. [Google Scholar] [CrossRef]
  20. Mwale, M.; Luke, R.; Pisa, N. Factors that affect travel behaviour in developing cities: A methodological review. Transp. Res. Interdiscip. Perspect. 2022, 16, 100683. [Google Scholar] [CrossRef]
  21. Goulias, K.G.; Davis, A.W.; McBride, E.C. Chapter 1—Introduction and the genome of travel behavior. In Mapping the Travel Behavior Genome; Elsevier: Amsterdam, The Netherlands, 2020; pp. 1–14. ISBN 9780128173404. [Google Scholar] [CrossRef]
  22. Malichová, E.; Cornet, Y.; Hudák, M. Travellers’ use and perception of travel time in long-distance trips in Europe. Travel Behav. Soc. 2022, 27, 95–106. [Google Scholar] [CrossRef]
  23. Rasca, S.; Saeed, N. Exploring the factors influencing the use of public transport by commuters living in networks of small cities and towns. Travel Behav. Soc. 2022, 28, 249–263. [Google Scholar] [CrossRef]
  24. Rachele, J.N.; Kavanagh, A.M.; Badland, H.; Giles-Corti, B.; Washington, S.; Turrell, G. Associations between individual socioeconomic position, neighbourhood disadvantage and transport mode: Baseline results from the HABITAT multilevel study. J. Epidemiol. Community Health 2015, 69, 1217–1223. [Google Scholar] [CrossRef]
  25. Redman, L.; Friman, M.; Gärling, T.; Hartig, T. Quality attributes of public transport that attract car users: A research review. Transp. Policy 2013, 25, 119–127. [Google Scholar] [CrossRef]
  26. Anderson, M.K. Characteristics of Trips and Travellers in Private and Public Transportation in the Danish Travel Survey data. Dan. J. Transp. Res. Dan. Tidskr. Transp. 2010, 16, 1–16. Available online: https://orbit.dtu.dk/en/publications/eff6183c-b09d-4eb1-9a2f-cf6da6393599 (accessed on 13 June 2023).
  27. Tyrinopoulos, Y.; Antoniou, C. Public Transit User Satisfaction: Variability and Policy Implications. Transp. Policy 2008, 15, 260–272. [Google Scholar] [CrossRef]
  28. Morton, C.; Caulfield, B.; Anable, J. Customer perceptions of quality of service in public transport: Evidence for bus transit in Scotland. Case Stud. Transp. Policy 2016, 4, 199–207. [Google Scholar] [CrossRef]
  29. Saelens, B.E.; Sallis, J.F.; Black, J.B.; Chen, D. Neighborhood-Based Differences in Physical Activity: An Environment Scale Evaluation. Am. J. Public Health 2003, 93, 1552–1558. [Google Scholar] [CrossRef]
  30. Humpel, N.; Owen, N.; Iverson, D.; Leslie, E.; Bauman, A. Perceived environment attributes, residential location, and walking for particular purposes. Am. J. Prev. Med. 2004, 26, 119–125. [Google Scholar] [CrossRef]
  31. López, M.C.R.; Wong, Y.D. Process and determinants of mobility decisions—A holistic and dynamic travel behaviour framework. Travel Behav. Soc. 2019, 17, 120–129. [Google Scholar] [CrossRef]
  32. Saelens, B.E.; Sallis, J.F.; Frank, L.D. Environmental correlates of walking and cycling: Findings from the transportation, urban design, and planning literatures. Ann. Behav. Med. 2003, 25, 80–91. [Google Scholar] [CrossRef]
  33. Maldonado-Hinarejos, R.; Sivakumar, A.; Polak, J.W. Exploring the role of individual attitudes and perceptions in predicting the demand for cycling: A hybrid choice modelling approach. Transportation 2014, 41, 1287–1304. [Google Scholar] [CrossRef]
  34. De Oña, J.; de Oña, R. Quality of Service in Public Transport Based on Customer Satisfaction Surveys: A Review and Assessment of Methodological Approaches. Transp. Sci. 2014, 49, 605–622. [Google Scholar] [CrossRef]
  35. Guerra, E.; Caudillo, C.; Monkkonen, P.; Montejano, J. Urban form, transit supply, and travel behavior in Latin America: Evidence from Mexico’s 100 largest urban areas. Transp. Policy 2018, 69, 98–105. [Google Scholar] [CrossRef]
  36. Idris, A.O.; Habib, K.M.N.; Shalaby, A. An investigation on the performances of mode shift models in transit ridership forecasting. Transp. Res. Part A Policy Pract. 2015, 78, 551–565. [Google Scholar] [CrossRef]
  37. Chandra, M.; Chalumuri, R.S. Commuter’s sensitivity in mode choice: An empirical study of New Delhi. J. Transp. Geogr. 2016, 57, 207–217. [Google Scholar] [CrossRef]
  38. Haghani, M.; Bliemer, M.C.J. Structure and temporal evolution of transportation literature. Digital Libraries: Physics and Society. arXiv 2021, arXiv:2107.12639. [Google Scholar] [CrossRef]
  39. Weng, J.; Tu, Q.; Yuan, R.; Lin, P.; Chen, Z.T. Modeling Mode Choice Behaviors for Public Transport Commuters in Beijing. J. Urban Plan. Dev. 2018, 144, 05018013. [Google Scholar] [CrossRef]
  40. Lu, X.S.; Liu, T.L.; Huang, H.J. Pricing and mode choice based on nested logit model with trip-chain costs. Transp. Policy 2015, 44, 76–88. [Google Scholar] [CrossRef]
  41. Minal, C.; Sekhar, C.R. Mode choice analysis: The data, the models and future ahead. Int. J. Traffic Transp. Eng. 2014, 4, 269–285. [Google Scholar] [CrossRef]
  42. Salas, P.; Fuente, R.D.L.; Astroza, S.; Carrasco, J.A. A systematic comparative evaluation of machine learning classifiers and discrete choice models for travel mode choice in the presence of response heterogeneity. Expert Syst. Appl. 2022, 193, 116253. [Google Scholar] [CrossRef]
  43. Zhang, H.; Zhang, L.; Liu, Y.; Zhang, L. Understanding Travel Mode Choice Behavior: Influencing Factors Analysis and Prediction with Machine Learning Method. Sustainability 2023, 15, 11414. [Google Scholar] [CrossRef]
  44. Ferreira, S.; Amorim, M.; Lobo, A.; Kern, M.; Fanderl, N.; Couto, A. Travel mode preferences among German commuters over the course of COVID-19 pandemic. Transp. Policy 2022, 126, 55–64. [Google Scholar] [CrossRef]
  45. Li, W.; Kamargianni, M. Providing quantified evidence to policy makers for promoting bike-sharing in heavily air-polluted cities: A mode choice model and policy simulation for Taiyuan-China. Transp. Res. Part A Policy Pract. 2018, 111, 277–291. [Google Scholar] [CrossRef]
  46. Kamargianni, M. Investigating next generation’s cycling ridership to promote sustainable mobility in different types of cities. Res. Transp. Econ. 2015, 53, 45–55. [Google Scholar] [CrossRef]
  47. Akar, G.; Clifton, K. Influence of Individual Perceptions and Bicycle Infrastructure on Decision to Bike. Transp. Res. Rec. 2009, 2140, 165–172. [Google Scholar] [CrossRef]
  48. Kong, J.; Zhang, C.; Simonovic, S.P. A Two-Stage Restoration Resource Allocation Model for Enhancing the Resilience of Interdependent Infrastructure Systems. Sustainability 2019, 11, 5143. [Google Scholar] [CrossRef]
  49. Sun, J.; Balakrishnan, S.; Zhang, Z. A resource allocation framework for predisaster resilience management of interdependent infrastructure networks. Built Environ. Proj. Asset Manag. 2021, 11, 284–303. [Google Scholar] [CrossRef]
  50. INE. Annual Estimates of the Resident Population; MA–DGT, Official Administrative Map of Portugal. 2016. Available online: https://www.ine.pt/xportal/xmain?xpid=INE&xpgid=ine_cont_inst&INST=395986936 (accessed on 29 May 2023).
  51. Wellek, S.; Lackner, K.; Jennen-Steinmetz, C.; Reinhard, I.; Hoffmann, I.; Blettner, M. Determination of reference limits: Statistical concepts and tools for sample size calculation. Clin. Chem. Lab. Med. 2014, 52, 1685–1694. [Google Scholar] [CrossRef]
  52. Amirnazmiafshar, E.; Diana, M. A review of the socio-demographic characteristics affecting the demand for different car-sharing operational schemes. Transp. Res. Interdiscip. Perspect. 2022, 14, 100616. [Google Scholar] [CrossRef]
  53. Prieto, M.; Baltas, G.; Stan, V. Car sharing adoption intention in urban areas: What are the key socio-demographic drivers? Transp. Res. Part A Policy Pract. 2017, 101, 218–227. [Google Scholar] [CrossRef]
  54. Alexander, L.; Jiang, S.; Murga, M.; González, M.C. Origin–destination trips by purpose and time of day inferred from mobile phone data. Transp. Res. Part C Emerg. Technol. 2015, 58, 240–250. [Google Scholar] [CrossRef]
  55. He, M.; Li, J.; Shi, Z.; Liu, Y.; Shuai, C.; Liu, J. Exploring the Nonlinear and Threshold Effects of Travel Distance on the Travel Mode Choice across Different Groups: An Empirical Study of Guiyang, China. Int. J. Environ. Res. Public Health 2022, 19, 16045. [Google Scholar] [CrossRef] [PubMed]
  56. De Vos, J.; Mokhtarian, P.L.; Schwanen, T.; Van Acker, V.; Witlox, F. Travel mode choice and travel satisfaction: Bridging the gap between decision utility and experienced utility. Transportation 2016, 43, 771–796. [Google Scholar] [CrossRef]
  57. Mouratidis, K.; De Vos, J.; Yiannakou, A.; Politis, I. Sustainable transport modes, travel satisfaction, and emotions: Evidence from car-dependent compact cities. Travel Behav. Soc. 2023, 33, 100613. [Google Scholar] [CrossRef]
  58. Sammer, G.; Gruber, C.; Roeschel, G.; Tomschy, R.; Herry, M. The dilemma of systematic underreporting of travel behavior when conducting travel diary surveys—A meta-analysis and methodological considerations to solve the problem. Transp. Res. Procedia 2018, 32, 649–658. [Google Scholar] [CrossRef]
  59. Richardson, A.J. Behavioral Mechanisms of Nonresponse in Mail-Back Travel Surveys. Transp. Res. Rec. 2003, 1855, 191–199. [Google Scholar] [CrossRef]
  60. Golob, F.T. Structural Equation Modeling for Travel Behavior Research. Transp. Res. Part B Methodol. 2003, 37, 1–25. [Google Scholar] [CrossRef]
  61. Rietveld, P.; Zwart, B.; van Wee, B.; van den Hoorn, T. On the relationship between travel time and travel distance of commuters. Ann. Reg. Sci. 1997, 33, 269–287. [Google Scholar] [CrossRef]
  62. Ortúzar, J.D.; Willumsen, L.G. Modelling Transport, 4th ed.; John Wiley and Sons Ltd.: Chichester, UK, 2011. [Google Scholar] [CrossRef]
  63. Zhang, J.; Timmermans, H.; Borgers, A.; Wang, D. Modeling traveler choice behavior using the concepts of relative utility and relative interest. Transp. Res. Part B Methodol. 2004, 38, 215–234. [Google Scholar] [CrossRef]
  64. Madhuwanthi, R.A.M.; Marasinghe, A.; Rajapakse, R.P.C.J.; Dharmawansa, A.D.; Nomura, S. Factors Influencing to Travel Behavior on Transport Mode Choice. Int. J. Affect. Eng. 2016, 15, 63–72. [Google Scholar] [CrossRef]
  65. Gutiérrez, A.; Miravet, D.; Saladié, Ò.; Anton Clavé, S. Transport Mode Choice by Tourists Transferring from a Peripheral High-Speed Rail Station to Their Destinations: Empirical Evidence from Costa Daurada. Sustainability 2019, 11, 3200. [Google Scholar] [CrossRef]
  66. Cervero, R.; Sarmiento, O.L.; Jacoby, E.; Gomez, L.F.; Neiman, A. Influences of Built Environments on Walking and Cycling: Lessons from Bogotá. Int. J. Sustain. Transp. 2009, 3, 203–226. [Google Scholar] [CrossRef]
  67. Heinen, E.; Maat, K.; van Wee, B. The role of attitudes toward characteristics of bicycle commuting on the choice to cycle to work over various distances. Transp. Res. Part D Transp. Environ. 2011, 16, 102–109. [Google Scholar] [CrossRef]
  68. Abdelfattah, L.; Deponte, D.; Fossa, G. The 15-minute city: Interpreting the model to bring out urban resiliencies. Transp. Res. Procedia 2022, 60, 330–337. [Google Scholar] [CrossRef]
  69. Pozoukidou, G.; Angelidou, M. Urban Planning in the 15-Minute City: Revisited under Sustainable and Smart City Developments until 2030. Smart Cities 2022, 5, 1356–1375. [Google Scholar] [CrossRef]
  70. Moreno, C.; Allam, Z.; Chabaud, D.; Gall, C.; Pratlong, F. Introducing the “15-Minute City”: Sustainability, Resilience and Place Identity in Future Post-Pandemic Cities. Smart Cities 2021, 4, 93–111. [Google Scholar] [CrossRef]
  71. Manifesty, O.D.; Park, J.P. A Case Study of a 15-Minute City Concept in Singapore’s 2040 Land Transport Master Plan: 20-Minute Towns and a 45-Minute City. Int. J. Sustain. Transp. Technol. 2022, 5, 1–11. [Google Scholar] [CrossRef]
  72. Train, K. Logit. In Discrete Choice Methods with Simulation; Cambridge University Press: New York, NY, USA, 2009; pp. 34–75. [Google Scholar] [CrossRef]
  73. Loh, V.H.Y.; Rachele, J.N.; Brown, W.J.; Washington, S.; Turrell, G. Neighborhood disadvantage, individual-level socioeconomic position and physical function: A cross-sectional multilevel analysis. Prev. Med. 2016, 89, 112–120. [Google Scholar] [CrossRef]
  74. Li, S.; Zhao, P. Exploring car ownership and car use in neighborhoods near metro stations in Beijing: Does the neighborhood built environment matter? Transp. Res. Part D Transp. Environ. 2017, 56, 1–17. [Google Scholar] [CrossRef]
  75. Bhat, C.R.; Guo, J. A Mixed Spatially Correlated Logit Model: Formulation and Application to Residential Choice Modelling. Transp. Res. B 2004, 38, 147–168. [Google Scholar] [CrossRef]
  76. Litman, T. Evaluating Public Transportation Local Funding Options. J. Public Transp. 2014, 17, 43–74. [Google Scholar] [CrossRef]
  77. Pritchard, J. MaaS to pull us out of a car-centric orbit: Principles for sustainable Mobility-as-a-Service in the context of unsustainable car dependency. Case Stud. Transp. Policy 2022, 10, 1483–1493. [Google Scholar] [CrossRef]
  78. Išoraitė, M.; Jarašūnienė, A.; Samašonok, K. Assessment of the Impact of Advertising in Promoting Sustainable Mobility and Multimodality in the Urban Transport System. Future Transp. 2023, 3, 210–235. [Google Scholar] [CrossRef]
Figure 1. Moving population in the municipalities of the AMP.
Sustainability 15 14765 g001
Figure 2. Probabilities of sustainable transport adoption.
Sustainability 15 14765 g002
Table 1. Statistical description of the variables.
Continuous VariableMeanStd. DeviationNMarginal Percentage
Distance8.99808314.884751
Individual categorical variables
Age<2514,95519.80%
≥6512,30716.30%
25–4421,26728.10%
45–6427,15135.90%
GenderFemale38,14350.40%
Male37,53749.60%
Existence of physical limitationPrefer not to answer24023.20%
Yes22953.00%
No70,98393.80%
Education levelHigher education (Bachelor’s, Master’s, Doctor’s, higher professional technical course)23,97631.70%
None or completed first or second or third year24573.20%
Prefer not to answer25513.40%
Secondary education (12th year of complete schooling) or post-secondary (non-higher technological specialization course)15,16520.00%
Basic Education (first cycle, second cycle, or third cycle completed)31,53141.70%
OccupationPrefer not to answer71819.50%
Student, retired (mainly engaged in household chores; permanently disabled) 22,17529.30%
Unemployed49426.50%
Employed41,38254.70%
Monthly incomeAbove EUR 2000 43915.80%
From EUR 1500 to less than EUR 2000 982813.00%
From EUR 1000 to less than EUR 150028313.70%
From EUR 651 to less than EUR 1000 16,77922.20%
Prefer not to answer37254.90%
Up to EUR 650 38,12650.40%
Monthly public transport ticketNo63,90184.40%
Yes11,77915.60%
Own vehicleNo795210.50%
Yes67,72889.50%
Trip categorical variables
Transport modeActive modes15,47620.40%
(Walking and cycling)
Public transport850711.30%
(Bus, urban rail, regular trains, and metro)
Motorized private vehicle51,69768.30%
(Car and motorcycle)
Reason for the tripGo to work13,76318.20%
Going to school or school activities10,94014.50%
Leisure activities61698.20%
Other activities18352.40%
Taking care of personal matters954212.60%
Return home33,43144.20%
WorkdayNo20,01226.40%
Yes55,66873.60%
Driving frequencyDoes not drive22,41929.60%
Drives sporadically48116.40%
Drives frequently48,45064.00%
N = number of observations.
Table 2. Likelihood ratio tests.
EffectModel Fitting CriteriaLikelihood Ratio Tests
−2 Log Likelihood of Reduced ModelChi-SquaredfSig.
Intercept74,300.210 0.0000
Distance (Km)93,284.94918,984.73820.000
Reason for Displacement75,110.488810.278100.000
Workday75,226.688926.47820.000
Sex74,348.33848.12720.000
Age74,461.144160.93360.000
Level of schooling74,391.91891.70880.000
Condition toward employment74,766.360466.14960.000
Existence of physical limitation74,369.31469.10440.000
Driving frequency76,689.0412388.83140.000
Transport ticket84,647.34210,347.13120.000
Per capita income74,347.34947.139100.000
Own vehicle76,309.9072009.69620.000
Table 3. Results of the MNL model for AM.
Transport Mode aIndependent VariablesβExp(β)Std. ErrorSig.
p-Value
Active modeIntercept0.566 0.0550.000
Individual variables
(Gender = Female)−0.1710.9610.0250.000
(Gender = Male)0 b
[Age = <25]−0.5131.0790.0510.000
[Age = ≥65]−0.0651.1410.0430.135
[Age = 25–44]−0.2350.8960.0330.000
[Age = 45–64]0 b
(Existenceofphysicallimitation = Prefer not to answer)−0.6060.6980.1430.000
(Existenceofphysicallimitation = Yes)−0.4700.7820.0660.000
(Existenceofphysicallimitation = No)0 b - -
(Educationlevel = Higher education (Bachelor’s, Master’s, Doctor’s, higher professional technical course))0.2601.1260.0360.000
(Educationlevel = None or completed first or second or third year_−0.2111.1690.0630.001
(Educationlevel = Prefer not to answer)0.2291.7880.1380.098
(Educationlevel = Secondary education (12th year of complete schooling) or post-secondary (non-higher technological specialization course))0.1281.1540.0360.000
(Educationlevel = Basic education (first cycle, second cycle, or third cycle completed))0 b
(Occupation = Prefer not to answer)−0.2980.7020.0670.000
(Occupation = Student, retired, mainly engaged in household chores)0.5081.3510.0420.000
(Occupation = Unemployed)0.5951.6770.0480.000
(Occupation = Employee)0 b
[Income = Above EUR 2000]0.0210.8330.0560.704
[Income = From EUR 1500 to less than EUR 2000]−0.1750.7470.0670.009
[Income = From EUR 1000 to less than EUR 1500]−0.0500.9300.0400.204
[Income = From EUR 650 to less than EUR 1000]−0.0770.8270.0310.012
(Income = Prefer not to answer)0.0571.1140.0550.297
[Income = Up to EUR 650]0 b
(Monthlypublictransportticket/Pass = No)−0.4890.0380.0380.000
(Monthlypublictransportticket = Yes)0 b
(Own Vehicle = No)1.5865.7900.0440.000
(OwnVehicle = Yes)0 b
Trip variables
Distance (Km)−0.5341.0070.0060.000
(Reasonfortrip = Go to work)−0.0471.4330.0380.220
(Reasonfortrip = Going to school or school activities)−0.6670.8340.0390.000
(Reasonfortrip = Leisure activities)0.4410.5410.0390.000
(Reasonfortrip = Other activities)0.3561.2910.0780.000
(Reasonfortrip = Taking care of personal matters)−0.1690.7800.0370.000
(Reasonfortrip = Return home)0 b - -
(Workday = No)−0.1240.2890.0280.000
(Workday = Yes)0 b - -
(DrivingFrequency = Does not drive)1.3453.3100.0380.000
(DrivingFrequency = Drives sporadically)1.5554.2170.0480.000
(DrivingFrequency = Drives frequently)0 b
a. The reference category of the dependent variable is the use of private motorized transport; b. Category of reference.
Table 4. Results of the MNL model for PT.
Transport Mode aIndependent VariablesβExp(β)Std. ErrorSig.
p-Value
Public transportIntercept−0.380 0.0580.000
Individual variables
(Gender = Female)−0.0400.9610.0320.223
(Gender = Male)0 b
[Age = <25]0.0761.0790.0610.212
[Age = ≥65]0.1321.1410.0650.041
[Age = 25–44]−0.1100.8960.0440.013
[Age = 45–64]0 b
(Existenceofphysicallimitation = Prefer not to answer)−0.3600.6980.1780.043
(Existenceofphysicallimitation = Yes)−0.2460.7820.0890.006
(Existenceofphysicallimitation = No)0 b
(Educationlevel = Higher education (Bachelor’s, Master’s, Doctor’s, higher professional technical course))0.1191.1260.0480.014
(Educationlevel = None or completed first or second or third year)0.1561.1690.0850.066
(Educationlevel = Prefer not to answer)0.5811.7880.1720.001
(Educationlevel = Secondary education (12th year of complete schooling) or post-secondary (non-higher technological specialization course))0.1431.1540.0450.001
(Educationlevel = Basic education (first cycle, second cycle, or third cycle completed))0 b
(Occupation = Prefer not to answer)−0.3540.7020.0860.000
(Occupation = Student, retired, mainly engaged in household chores, permanently disabled or other inactivity situation)0.3011.3510.0580.000
(Occupation = Unemployed)0.5171.6770.0690.000
(Occupation = Employee)0 b
[Income = Above EUR 2000]−0.1830.8330.0800.023
[Income = From EUR 1500 to less than EUR 2000]−0.2920.7470.1000.004
[Income = From EUR 1000 to less than EUR 1500]−0.0720.9300.0530.171
[Income = From EUR 650 to less than EUR 1000]−0.1900.8270.0410.000
(Income = Prefer not to answer)0.1081.1140.0720.131
[Income = Up to EUR 650]0 b
(Monthlypublictransportticket/Pass = No)−3.2580.0380.0350.000
(Monthlypublictransportticket = Yes)0 b
(Own Vehicle = No)1.7565.7900.0490.000
(OwnVehicle = Yes)0 b
Trip variables
Distance (Km)0.0071.0070.0010.000
(Reasonfortrip = Go to work)0.3601.4330.0450.000
(Reasonfortrip = Going to school or school activities)−0.1820.8340.0470.000
(Reasonfortrip = Leisure activities)−0.6140.5410.0770.000
(Reasonfortrip = Other activities)0.2561.2910.0990.010
(Reasonfortrip = Taking care of personal matters)−0.2480.7800.0530.000
(Reasonfortrip = Return home)0 b
(Workday = No)−1.2410.2890.0440.000
(Workday = Yes)0 b
(DrivingFrequency = Does not drive)1.1973.3100.0470.000
(DrivingFrequency = Drives sporadically)1.4394.2170.0570.000
(DrivingFrequency = Drives frequently)0 b
a. The reference category of the dependent variable is the use of private motorized transport; b. Category of reference.
Table 5. Probability of transport mode usage in different scenarios.
Probability ScenariosProbability of Using PT (%)Probability of Using
AM (%)
Probability of Using PMV (%)
1In the first scenario, a woman travels on a workday without physical limitations. She has a monthly public transport ticket and owns a vehicle; she drives occasionally. Regarding her education, she has a completed higher education degree and is currently employed. The purpose of her trip is to go to work. Additionally, her per capita income is above EUR 2000 per month. Her age range is between 25 and 44 years, and the distance of her trip is less than 2 km.5035.514.5
2In the second scenario, we have a woman with a physical limitation who needs to travel on a non-working day. She does not have a monthly public transport ticket, does not own a vehicle, and does not drive. In terms of education, she has completed basic education, and she is retired. Her trip is due to personal matters, and her per capita income is up to EUR 650 monthly. Her age range is 65 years or older, and the distance traveled on this trip is more than 5 km.77221
3In the third scenario, a man without physical limitations travels on a non-working day. He does not have a monthly public transport pass but owns a vehicle and drives frequently. He has a complete secondary education level, and his occupation is employed. The purpose of his trip is for leisure activities, and his per capita income falls within the range of EUR 1000 to EUR 1500. The age range for this man is between 45 and 64 years, and the distance traveled in the trip is less than 2 km.0.535.564
4In the fourth scenario, a man without physical limitations travels on a workday. He does not have a monthly public transportation pass but owns a vehicle and drives sporadically. His education level is basic education, and he is currently unemployed. The reason for his trip is personal matters. His per capita income is up to EUR 650, and his age range is between 25 and 44 years. The distance traveled in the trip is more than 5 km.122.585.5
5In the fifth scenario, a woman without physical limitations travels on a workday. She does not have a monthly public transport ticket or a private vehicle but drives sporadically. Her education level is secondary, and her occupation is classified as a student. The reason for her trip is going to school or engaging in school activities, and the information about her per capita income was not specified. Her age range is under 25 years, and the distance for this trip is between 2 km and 5 km.34.53134.5
6In the sixth scenario, a woman with physical limitations travels on a workday. She does not have a monthly public transport ticket, does not own a vehicle, and, therefore, does not drive. Her education level is none, and her occupation is classified as retired. The reason for her trip is personal matters. Her per capita income is up to EUR 650, and her age range is between 45 and 64 years. The distance traveled on this trip is more than 5 km.940.55.5
7In the seventh scenario, we have a man without physical limitations on a workday. He has a monthly public transport ticket, owns a vehicle, and drives sporadically. He has a completed higher education degree, and he is currently employed. The reason for his trip is to go to work. His per capita income falls within the range of EUR 1500 to EUR 2000. The age range for this man is between 25 and 44 years, and the distance traveled on this trip is less than 2 km.48.53615.5
8In the eighth scenario, we have a woman without physical limitations on a workday. She does not have a monthly public transportation pass but owns a vehicle and drives frequently. Her education level is basic, and she is currently unemployed. The reason for her trip is to return home. Her per capita income is EUR 650 to EUR 1000, and her age range is between 45 and 64 years. The distance traveled on this trip is more than 5 km.3.5195.5
9In the ninth scenario, a man without physical limitations travels on a workday. He has a monthly public transportation pass but does not own a vehicle and frequently drives. He has a higher education degree, and he is employed. The reason for his trip is commuting to work; his per capita income is EUR 1500 to EUR 2000 per month. The age range for this man is between 45 and 64 years, and the distance traveled on this trip is more than 5 km.830.513.5
10In the tenth scenario, we have a man without physical limitations on a non-working day. He has a monthly public transport ticket but does not own a vehicle; nevertheless, he drives sporadically. He has a completed secondary education level, and his occupation is employed. The reason for his trip is to engage in leisure activities. The per capita income was not provided, and his age range is under 25 years. The distance traveled in this trip is between 2 km and 5 km.51418
Disclaimer/Publisher’s Note: The statements, opinions and data contained in all publications are solely those of the individual author(s) and contributor(s) and not of MDPI and/or the editor(s). MDPI and/or the editor(s) disclaim responsibility for any injury to people or property resulting from any ideas, methods, instructions or products referred to in the content.

