Article

Application of the Q-Slope Empirical Approach for Slope Stability Assessment of Spanish Mountain Roads in Winter—Combining Remote Techniques with Virtual Reality

by
Cesar Patricio Borja Bernal
1,2 and
Luis Jordá Bordehore
3,*
1
E.T.S. Ingenieros de Minas y Energía, Universidad Politécnica de Madrid, Ríos Rosas, 21, 28003 Madrid, Spain
2
Facultad de Ciencias Naturales, Universidad de Guayaquil, Av. Raúl Gómez Lince s/n y Av. Juan Tanca Marengo, Guayaquil 090514, Ecuador
3
Departamento de Ingeniería y Morfología del Terreno, Universidad Politécnica de Madrid, 28040 Madrid, Spain
*
Author to whom correspondence should be addressed.
Sustainability 2023, 15(22), 15744; https://doi.org/10.3390/su152215744
Submission received: 15 August 2023 / Revised: 21 October 2023 / Accepted: 24 October 2023 / Published: 8 November 2023

Abstract

:
The Q-slope (2015) geomechanical classification is the only empirical methodology for slope stability analysis that considers the effect of ice. This article shows the results of its application for icy slopes in Spain. Despite its sunny image, Spain is a mountainous country with cold winters. Slopes alongside a mountain road and a ski resort carpark have been studied in Puerto de Navacerrada (Madrid region) and Benasque (Pyrenees). This work combines the manual collection of geomechanical data on slope characteristics with an empirical analysis of slope stability and remote data acquisition techniques (Structure from Motion, SfM). The results of the field data collection are shown in a metaverse with two approaches: a 360° image virtual tour and a 3D image repository. One of the novelties of this work is that researchers who wish to replicate these analyses can access a table of input parameters and make a virtual field trip to see the parameters included in this study. The results show that the Q-slope methodology is useful for stability analysis and is conservative in terms of recommendations: All the slopes that are seen as unstable appear as such, but some slopes that do not present problems are shown as “transitional” slopes. The data and observations taken are useful for increasing the methodology database and for completing existing graphs of stable vertical slopes with good quality, as well as slopes with little slope and low quality.

1. Introduction and Scope

1.1. Spanish Slopes in Winter

This work analyses the application of the Q-slope index to frozen slopes in Spain. For this, two mountainous areas with roads to ski resorts have been chosen: a small area in the center of Spain, near Madrid, and a larger area in the Pyrenees.
Spain is not a country known for its mountains and winter conditions but rather for its artistic culture, folklore, and beaches. However, it is worth highlighting some little-known aspects about the country: Its average altitude (average elevation) is 660 m.a.s.l. (meters above sea level), making it the eleventh most mountainous nation in Europe. For example, Austria’s average altitude is 910 m.a.s.l, and France’s is 375 m.a.s.l. [1]. Spain is crossed by a large number of mountain ranges, including the Pyrenees with 217 peaks over 3000 m.a.s.l. [2] (some of which have small glaciers). The Sierra Nevada is a mountain range in southern Spain and includes the Mulhacén summit, which at 3479 m.a.s.l., is the highest mountain in Europe outside the Caucasus and the Alps [3]. Although much of Spain has a Mediterranean climate with hot summers and relatively mild winters, the north has an Atlantic climate that is influenced by storms from northern Europe, which often leave significant snowfall in the mountains. The interior of the peninsula has a non-extreme continental climate; low temperatures can be reached with significant frosts for several months of the year. The lowest temperature recorded in Spain in a non-mountainous and inhabited area was −30 °C (recorded in December 1963 in Calamocha in Teruel) [4]. The coldest measurement made at an official weather station was −32 °C as recorded at Estany Gento in the Lleida Pyrenees in February 1956. The Philomena storm in January 2021 set the record for a non-official weather station measurement with −34 °C measured at the Baqueira Beret ski resort in the Pyrenees [4]. There are 30 Spanish alpine ski resorts [5] (15 in the Pyrenees, 7 in the Cantabrian Mountains, 4 in the Iberian System, and 4 in the Central System and the Sierra Nevada). This final range is the southernmost range in Europe and the highest in Spain—and from whose peaks the Strait of Gibraltar and Africa are visible.
Given the significant frosts and snowfalls, there are many problems linked to unstable slopes in mountainous areas, with ice and snow causing potential avalanches on some roads. Spain has many tourists, and winter sports and mountain activities (hiking and climbing) are popular. Mountain massifs are usually accessed by car or train in severe winter conditions. The study of rock slope stability in winter is clearly an important challenge. For this reason, it is necessary to establish simple and effective methodologies for preliminary evaluations—and the Q-slope in alpine or arctic conditions [6] seems a priori a good methodology. As will be seen later, these empirical methodologies have their limitations; they are designed for a first evaluation: Later analyses will be carried out in detail considering other variables, such as the piezometric level, different geotechnical units, and stresses.

1.2. Empirical Assessment of Rock Slopes and Virtual Reality Visualization

Empirical methods have been used to analyze the stability of underground mines and tunnels since the 1970s. However, it was not until 1985 that the first geomechanical index for slopes was developed by Romana [7,8]. However, neither the rock mass rating (RMR) water factor, nor the slope mass rating (SMR), has any reference or weighting for the effect of ice. Barton and Bar [9] published in 2015 the first works of a new geomechanical index for slopes based on the well-known Q-index: This new method is termed Q-slope and incorporates a correction factor for the effect of ice [9]. It is important to point out that the only work to date on the Q-slope index in icy or high mountain environments is that of Bar and Barton [6], and as the authors point out: “the complex and time dependent mechanical processes involving ice wedging experienced in artic and alpine environments are currently near impossible to replicate in numerical simulations on a slope scale, the use of empirical or observational approaches remains practicable”. Bar and Barton analyzed 90 case studies involving rock slopes in arctic and alpine environments, and the results show a good approach and simulation of real situations with a rapid and effective visual and field methodology. These authors concluded that for future work regarding the Q-slope method, researchers and practitioners should contribute with case studies and more data [6]. It is worth highlighting that their work includes a figure [6] in which there are no references to slopes with inclinations under 50 degrees or Q-slope qualities below 0.2. The scope of this work is to increase the database and check the applicability of the method in other mountainous areas. Some of the case studies in this research are in the lower left corner of Bar and Barton’s 2020 graph, and this is one of the main contributions of this research.
Manual data collection with compass orientations cannot always be carried out in inaccessible or dangerous areas. Remote techniques are a perfect complement for data collection at geomechanical stations. Remote methodologies such as digital photogrammetry and the Structure from Motion technique are very effective and easy to implement [10,11]. In this work, the manual acquisition of geotechnical parameters is complemented with remote techniques.
In addition to obtaining data remotely and analyzing slopes and discontinuities with point cloud programs, the results can be viewed using virtual reality techniques. During the pandemic, many engineering and rock mechanics lessons at the Universidad Politécnica de Madrid were delivered online with the help of virtual environments [12]. These virtual techniques are useful for teaching and showing the results of work to authorities and clients and also to enable other researchers to replicate results. We propose a new approach in which any researcher can virtually visit our data collection point (virtual study site) and corroborate or disagree. This is a new and important contribution to the research.
The significance of this work lies in the fact that it is a simple methodology for addressing serious problems on winter slopes, and although it is very effective, we believe that it still needs to be validated (the Q-slope was first proposed relatively recently in 2015 and is producing excellent results). The research validating the methodology has progressed from relatively simple mid-mountain slopes to much more complex slopes in high mountains.

2. Materials and Methods
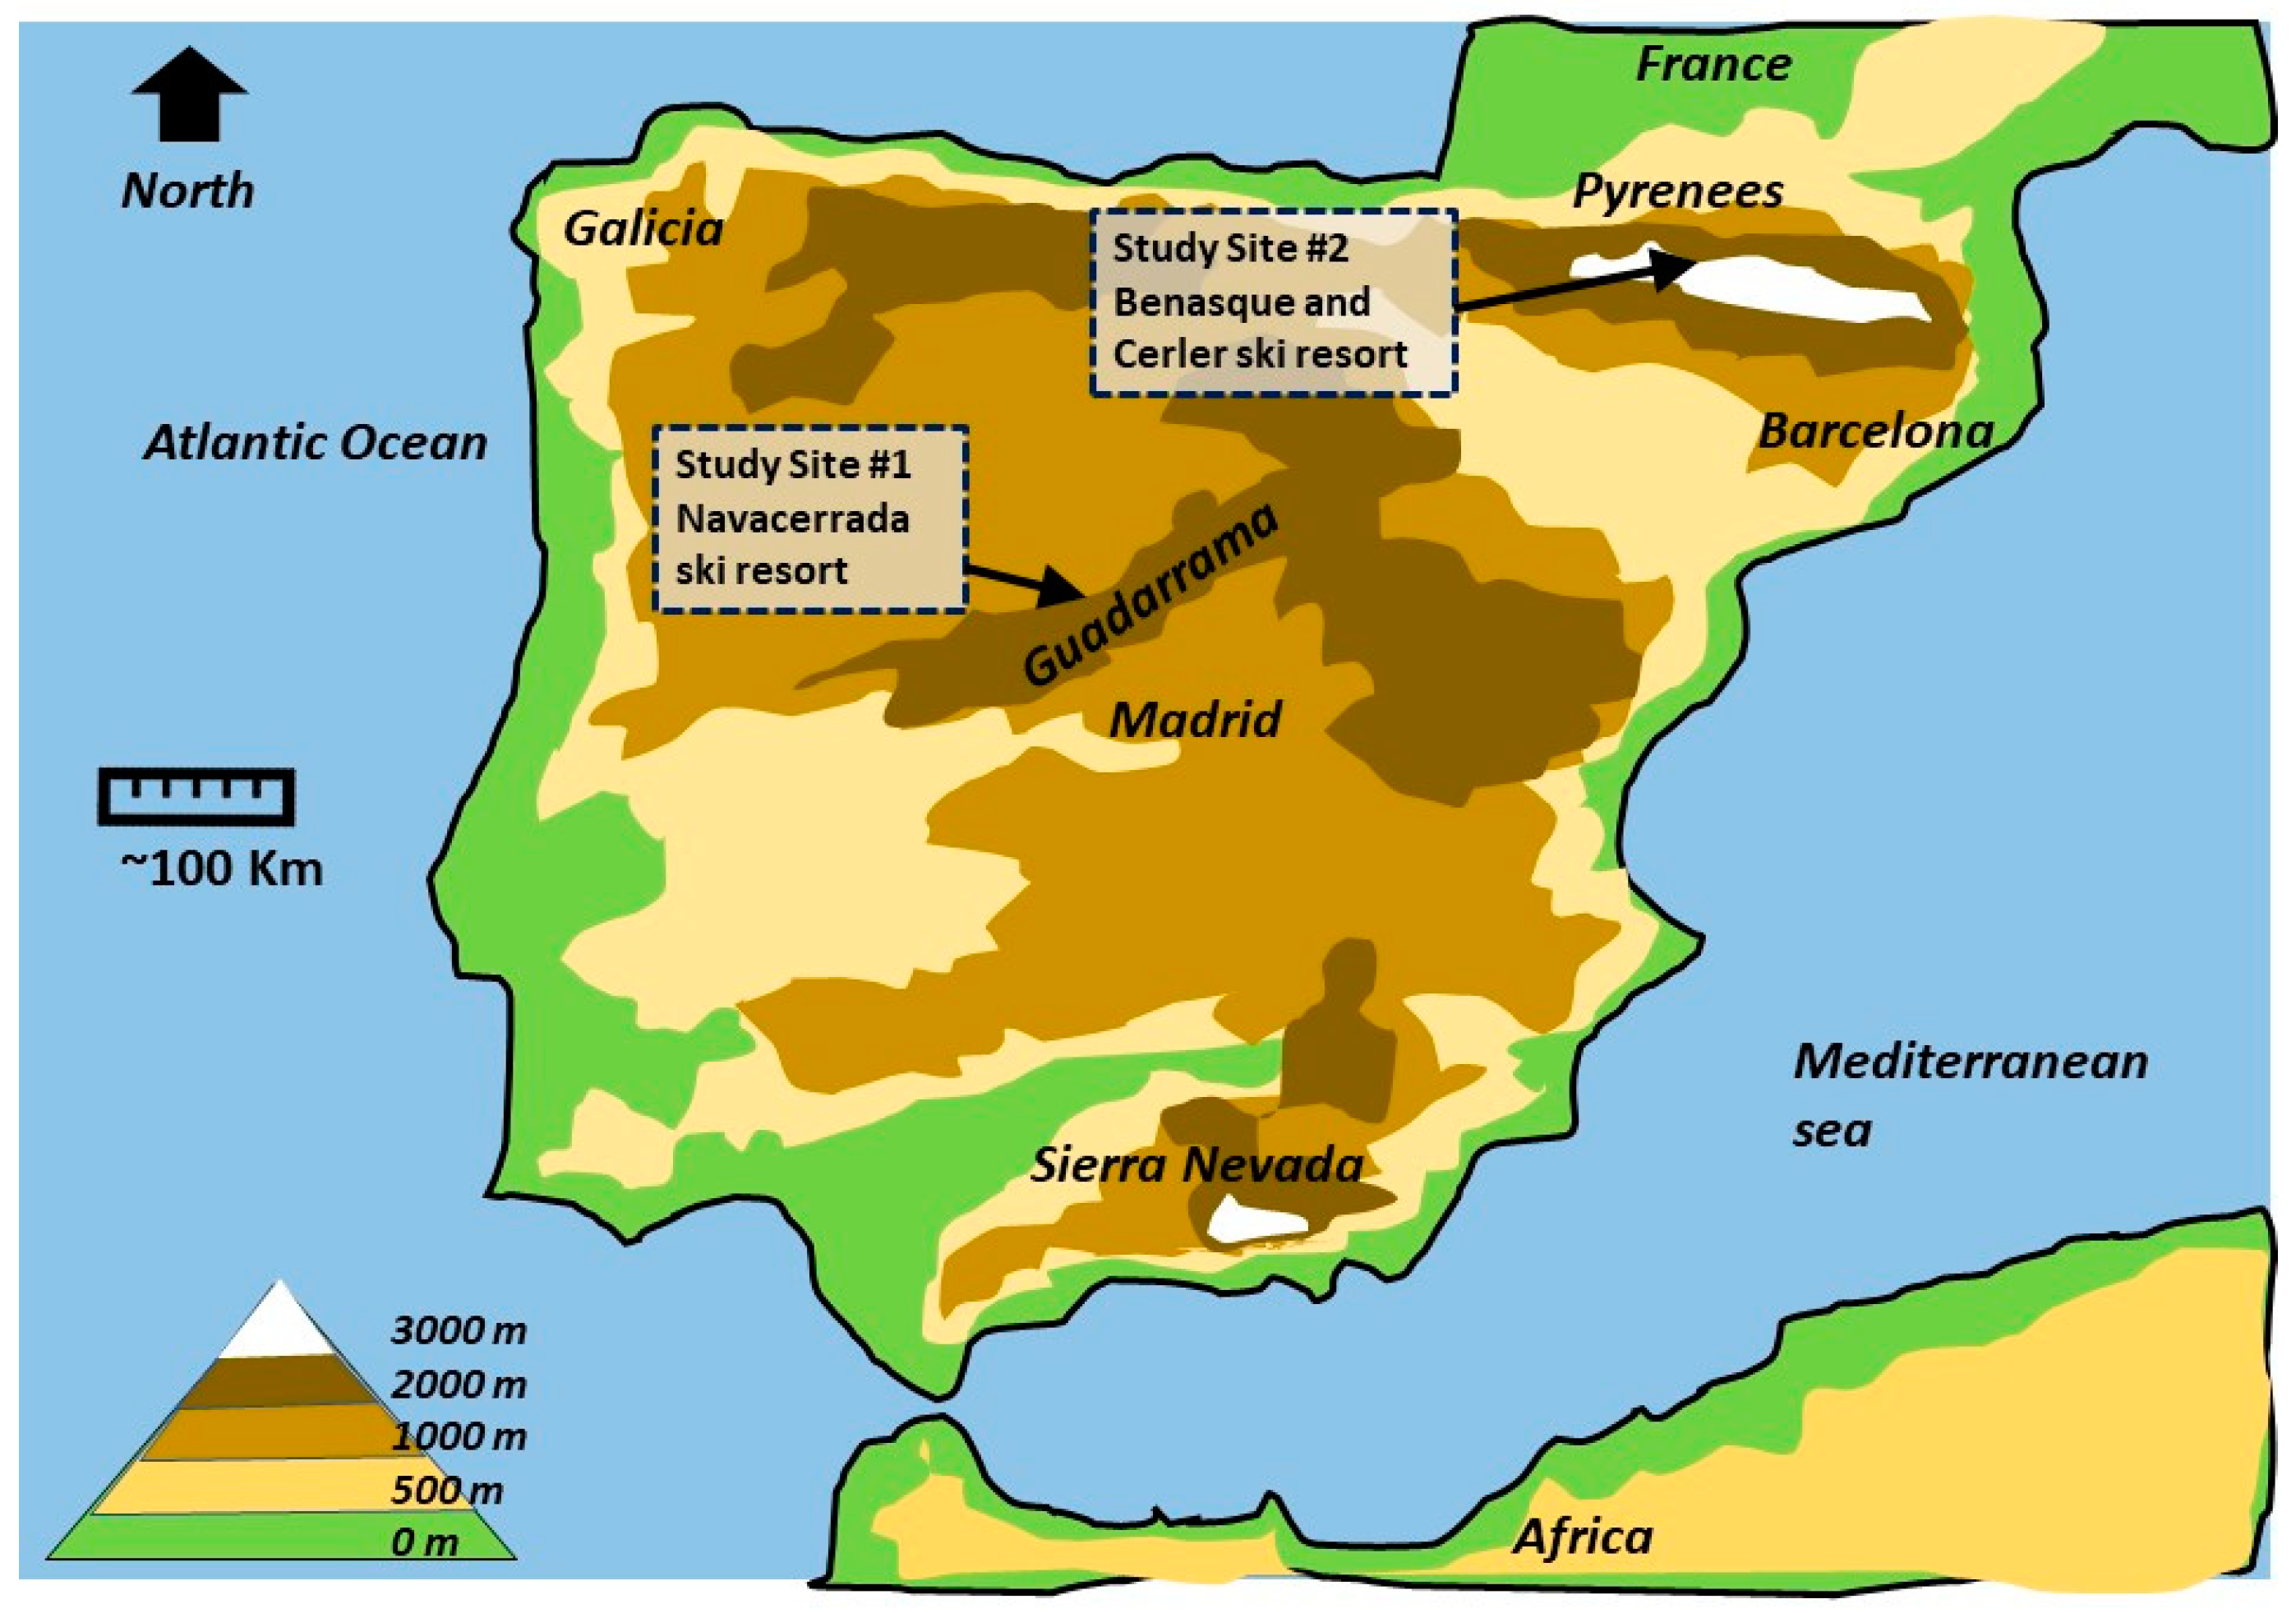
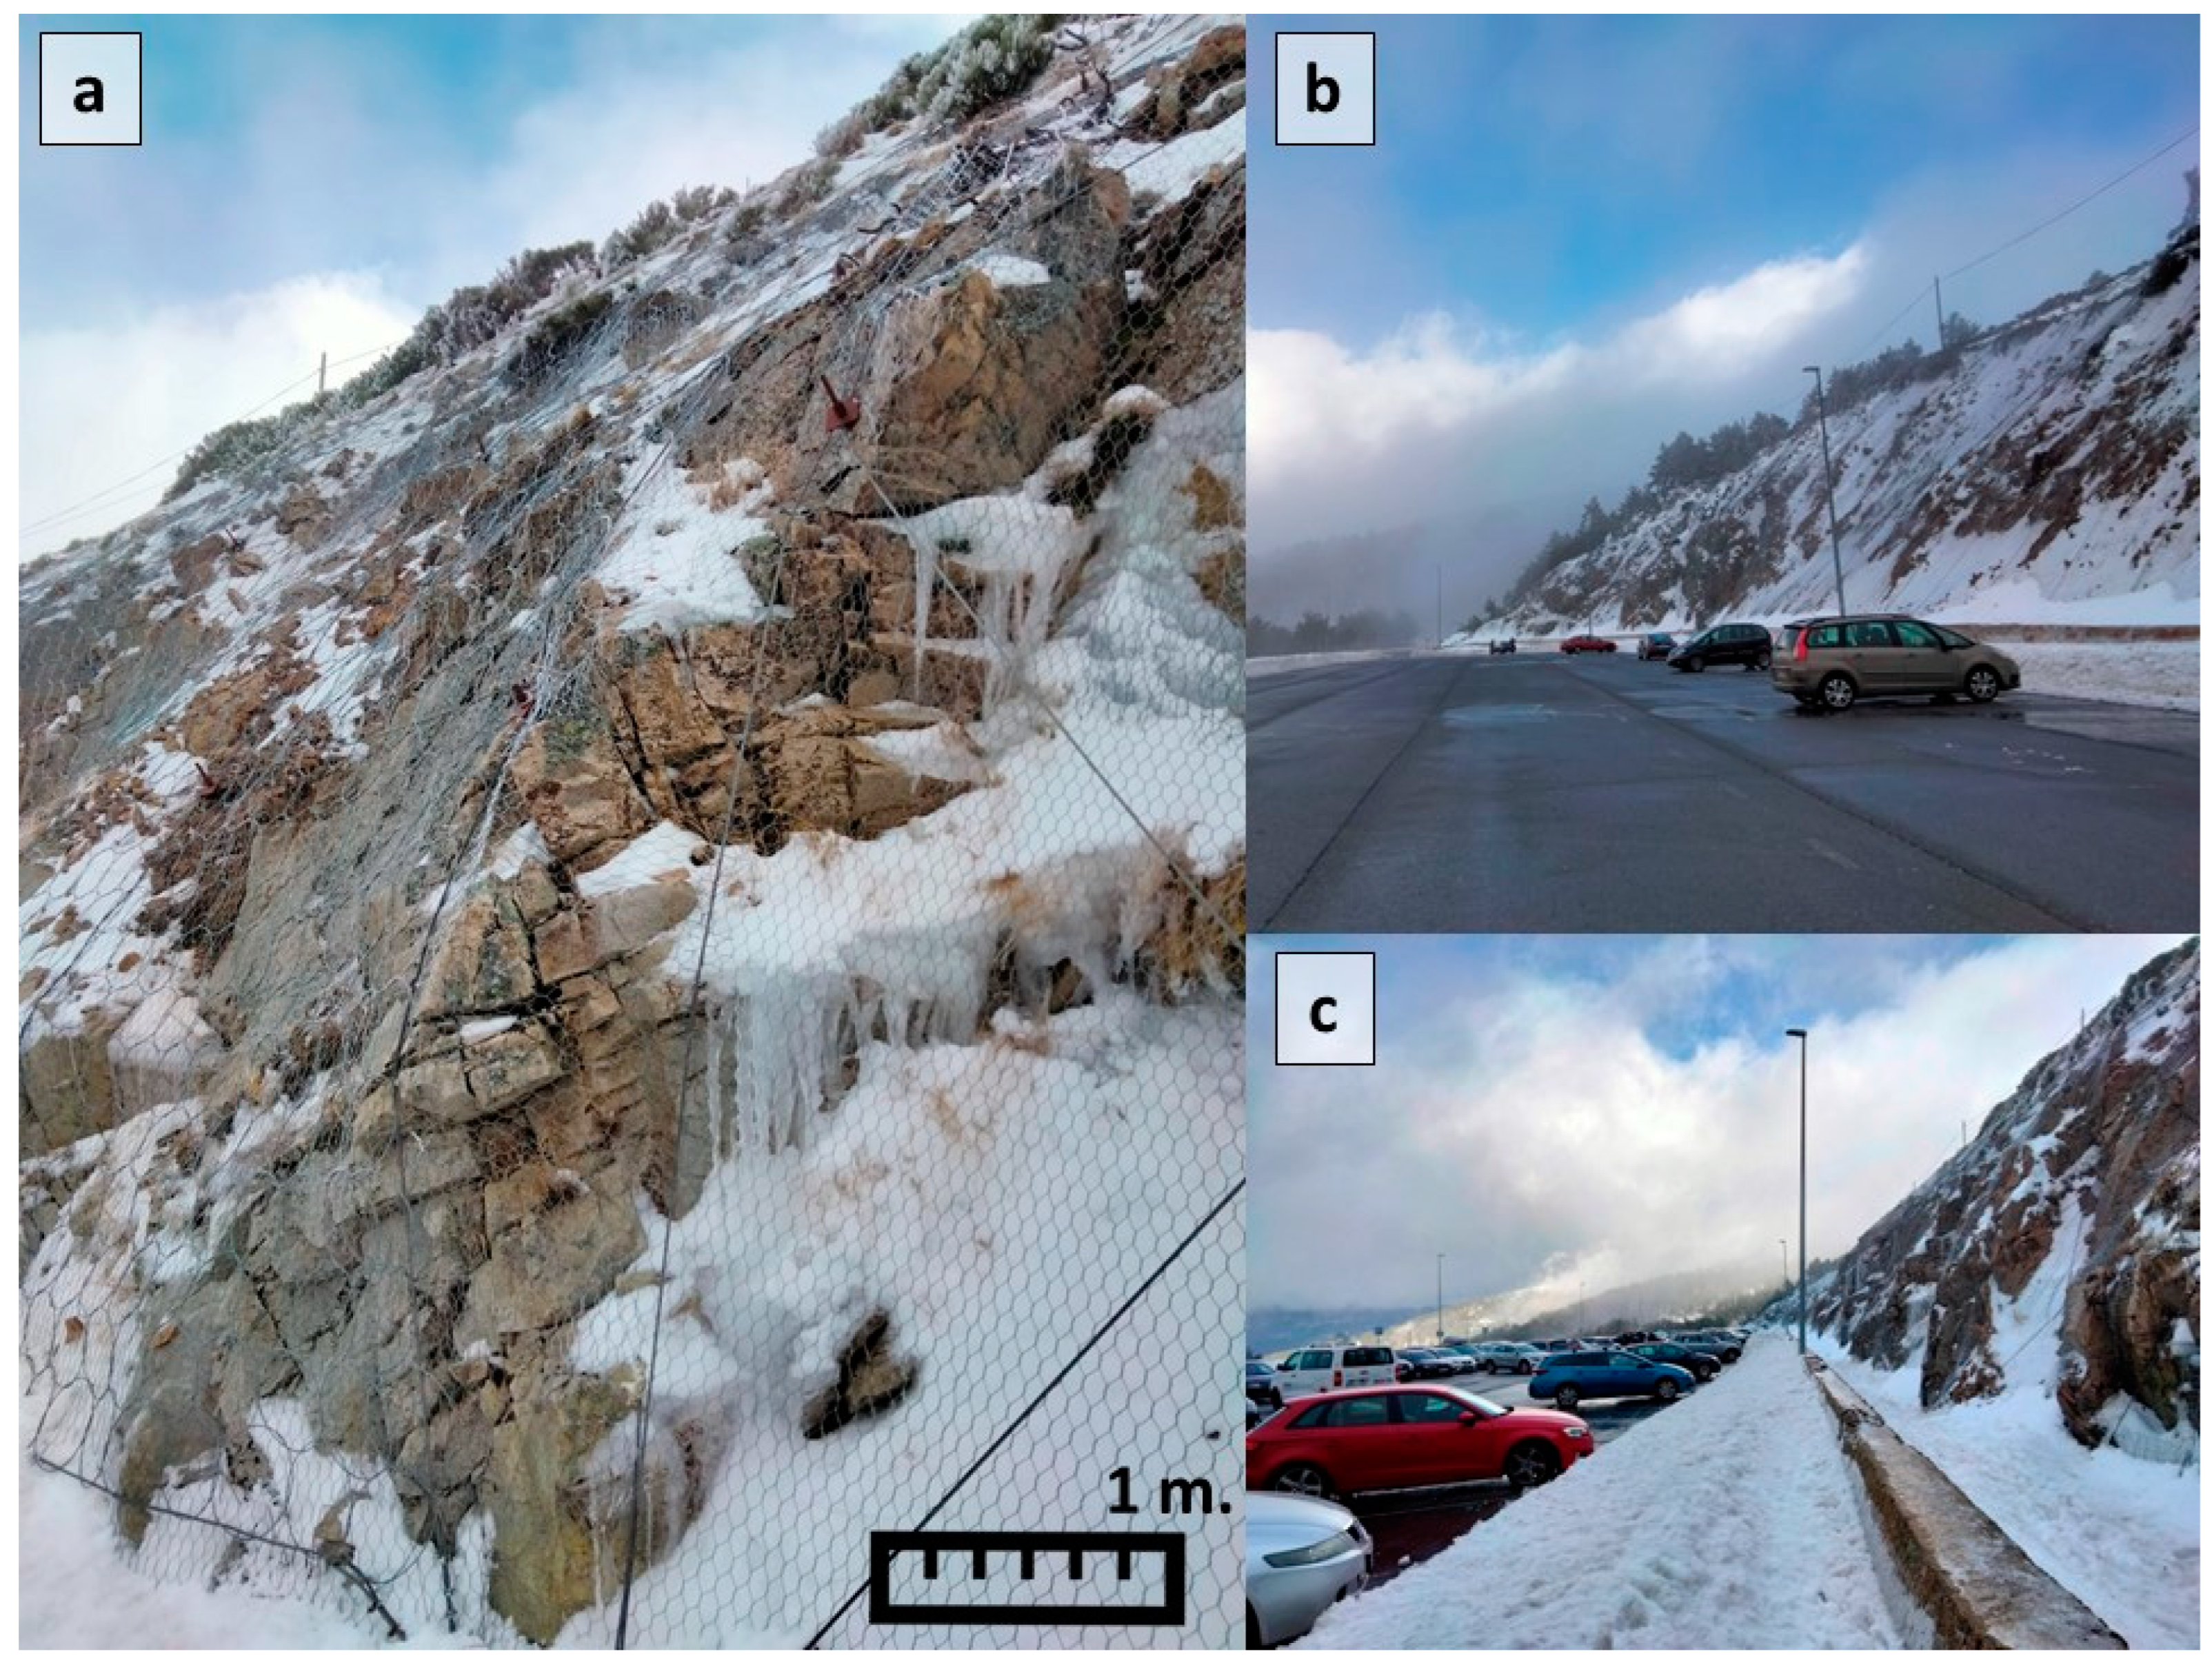
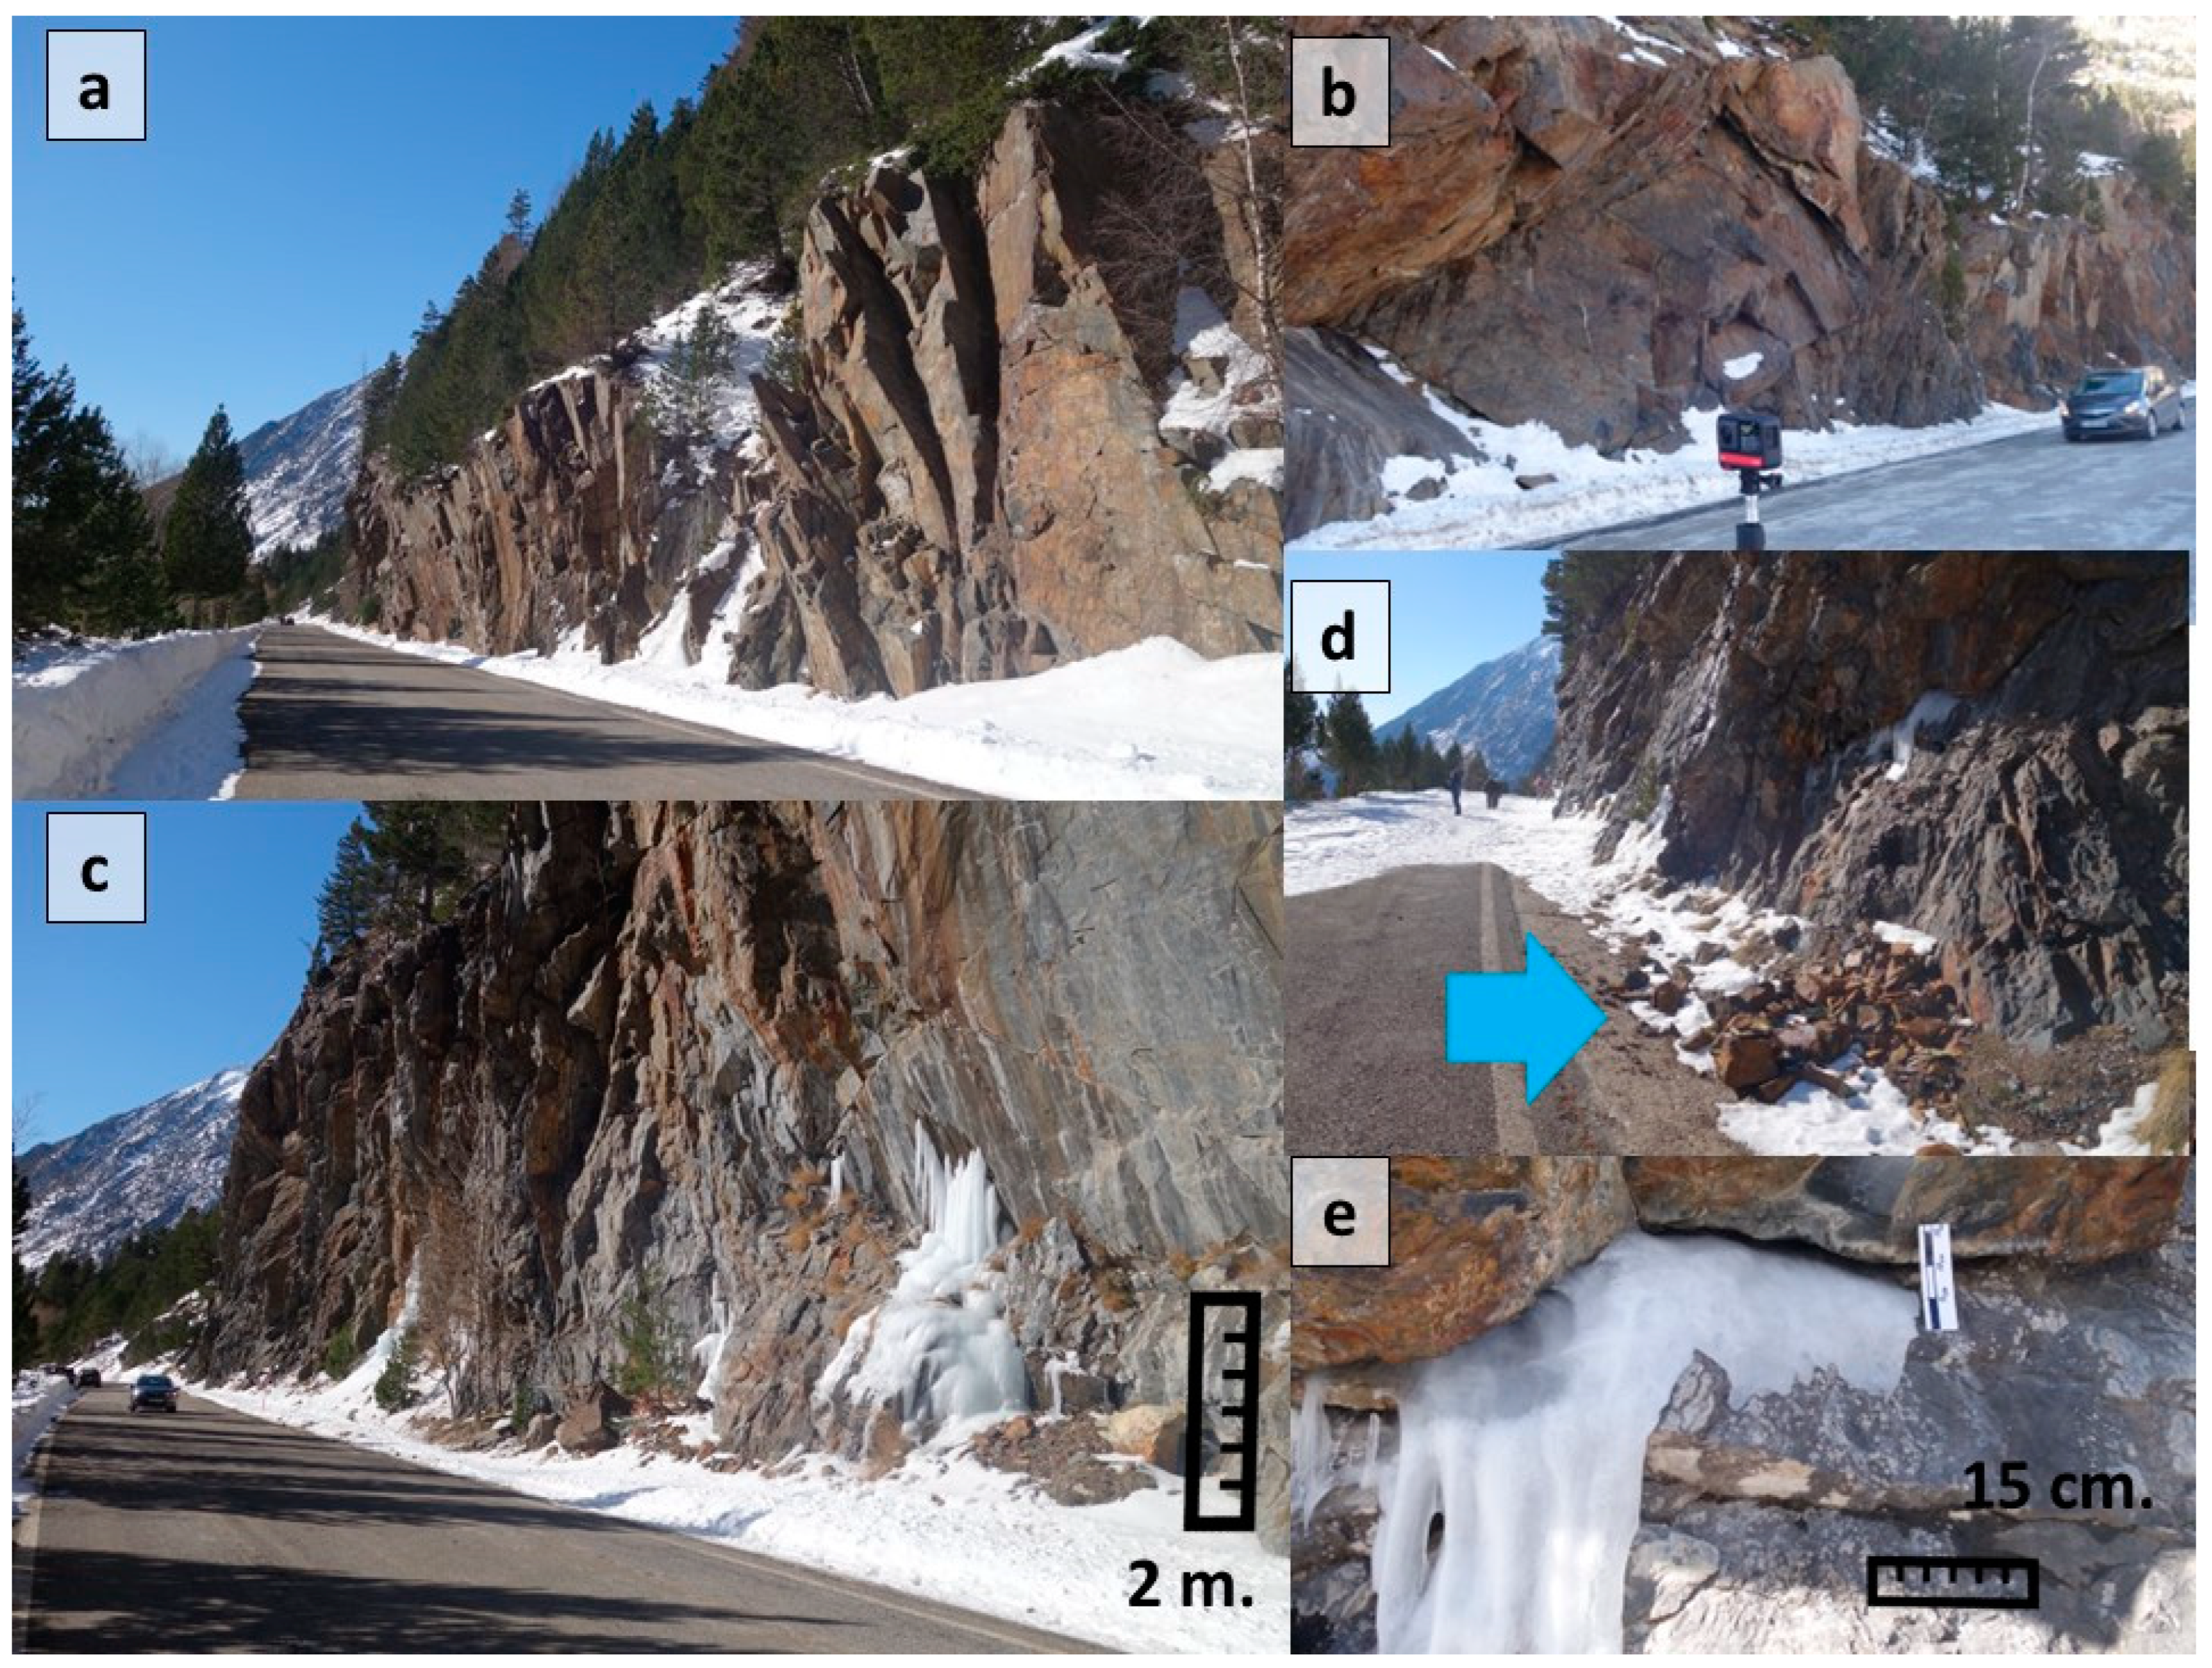
2.1. Study Sites

These comments and references have been incorporated at the beginning of the “study site” section: The study of permafrost and the conditions of mountain slopes with ice has already been studied in the area of the Pyrenees and the Spanish high mountains but with a more geographical focus than a slope engineering one [13,14]. The contribution of the empirical analysis is novel, and that is why ski resorts have been chosen due to the obvious impact of winter on society.
Two differing study areas have been chosen within the Spanish high mountains (Figure 1). The first area is the winter alpine ski resort of Navacerrada in the Sierra de Guadarrama at an altitude of 1858 m.a.s.l. (located just 60 km from Madrid). And the second area is Llanos del Hospital-Benasque in the Pyrenees in the province of Huesca and near the French border. It is an area with a great tradition of alpine sports, Nordic skiing, and mountaineering. Figure 2 shows histograms of average monthly maximum and minimum temperatures for the two study locations.
Study site 1: Navacerrada ski resort carpark (Guadarrama mountain range in Madrid).
The small ski resort at Puerto de Navacerrada is 60 km from the city of Madrid on the border with the province of Segovia. It is located at an altitude of 1858 m.a.s.l. and has its own railway station. It is popular among Madrid skiers and mountaineers. Despite its smallness, two Spanish Olympic ski champions were raised locally. Skiing began in Navacerrada in 1903, and a ski resort was built at the end of the 1940s. The first chairlift was installed in 1955. It reached its peak of popularity in the 1960s and 1970s.
Slopes 1, 2, 3, and 4 are located near the resort carpark, and the measurements were made on 20 January 2023 after a nighttime temperature of around −7 °C and several weeks of below-zero temperatures. The excavated slopes are made of jointed and weathered granite that suffers a freeze–thaw effect. There are abundant “blue” icefalls and frozen joints (Figure 3 and Table 1). The slopes show minor instabilities. The need to protect the carpark below has made it necessary to install wire mesh and cables with intensive bolting. Slope 5 is in the nearby Morcuera mountain pass. The rock is highly weathered gneiss and grade IV (almost converted into residual soil) in some areas. The slope angle is less steep than Navacerrada and contains no reinforcements.
Benasque is a town in the Aragonese Pyrenees embedded in a trough-shaped glacial valley. The area has a tradition of mountain sports: rock climbing; mountaineering; ice climbing; skiing; and recently, trail running and races. The town of Benasque is located at an altitude of 1140 m and is near the French border. In the direction of France is the Llanos del Hospital cross-country ski resort (altitude of 1758 m.a.s.l.) and the peak of Aneto (the highest in the Pyrenees at 3404 m.a.s.l. and partially covered with small glaciers). Near Benasque is the alpine ski resort of Cerler, which from 1500 m, reaches the Gallinero peak at 2630 m.a.s.l. It is important to note that access to Benasque is through a gorge in the Congosto with many tunnels and geotechnical construction difficulties, whose excavation in 1916 was a challenge for Spanish engineering.
Slopes 6 to 12 are in the Llanos del Hospital valley near the French border. It is a mountain road along a valley that registers the lowest temperatures in the Spanish Pyrenees. These are slopes excavated in vertical slates and greywackes with instabilities. Significant block falls occur during excavations, road widening, and extensions. The slopes reveal many filtrations of frozen water and ice cascades in winter. Figure 4a,c shows the risk of toppling and icefalls on slopes 6, 7, and 8. Figure 4d shows some recent winter rockfalls at the end of the road. Figure 4e shows an ice-filled fissure. Slopes 13, 14, and 15 are located close to the previous slopes but at a lower altitude and next to a bridge over the Esera river in the direction of Benasque. These slopes are characterized by significant ice cascades above the slope that do not affect stability except in a specific area of seepage and wedges in the middle of the slope that have caused a block to fall. Finally, slopes 16, 17, and 18 are excavated in alternating competent sandstones and carbonaceous black soft marls, which degrade and leave dangerous overhanging strata. These slopes have significant water seepage and suffer ice-thawing effects with abundant ice falls. These slopes are located about 30 km south of Benasque, beyond the Congosto Gorges.

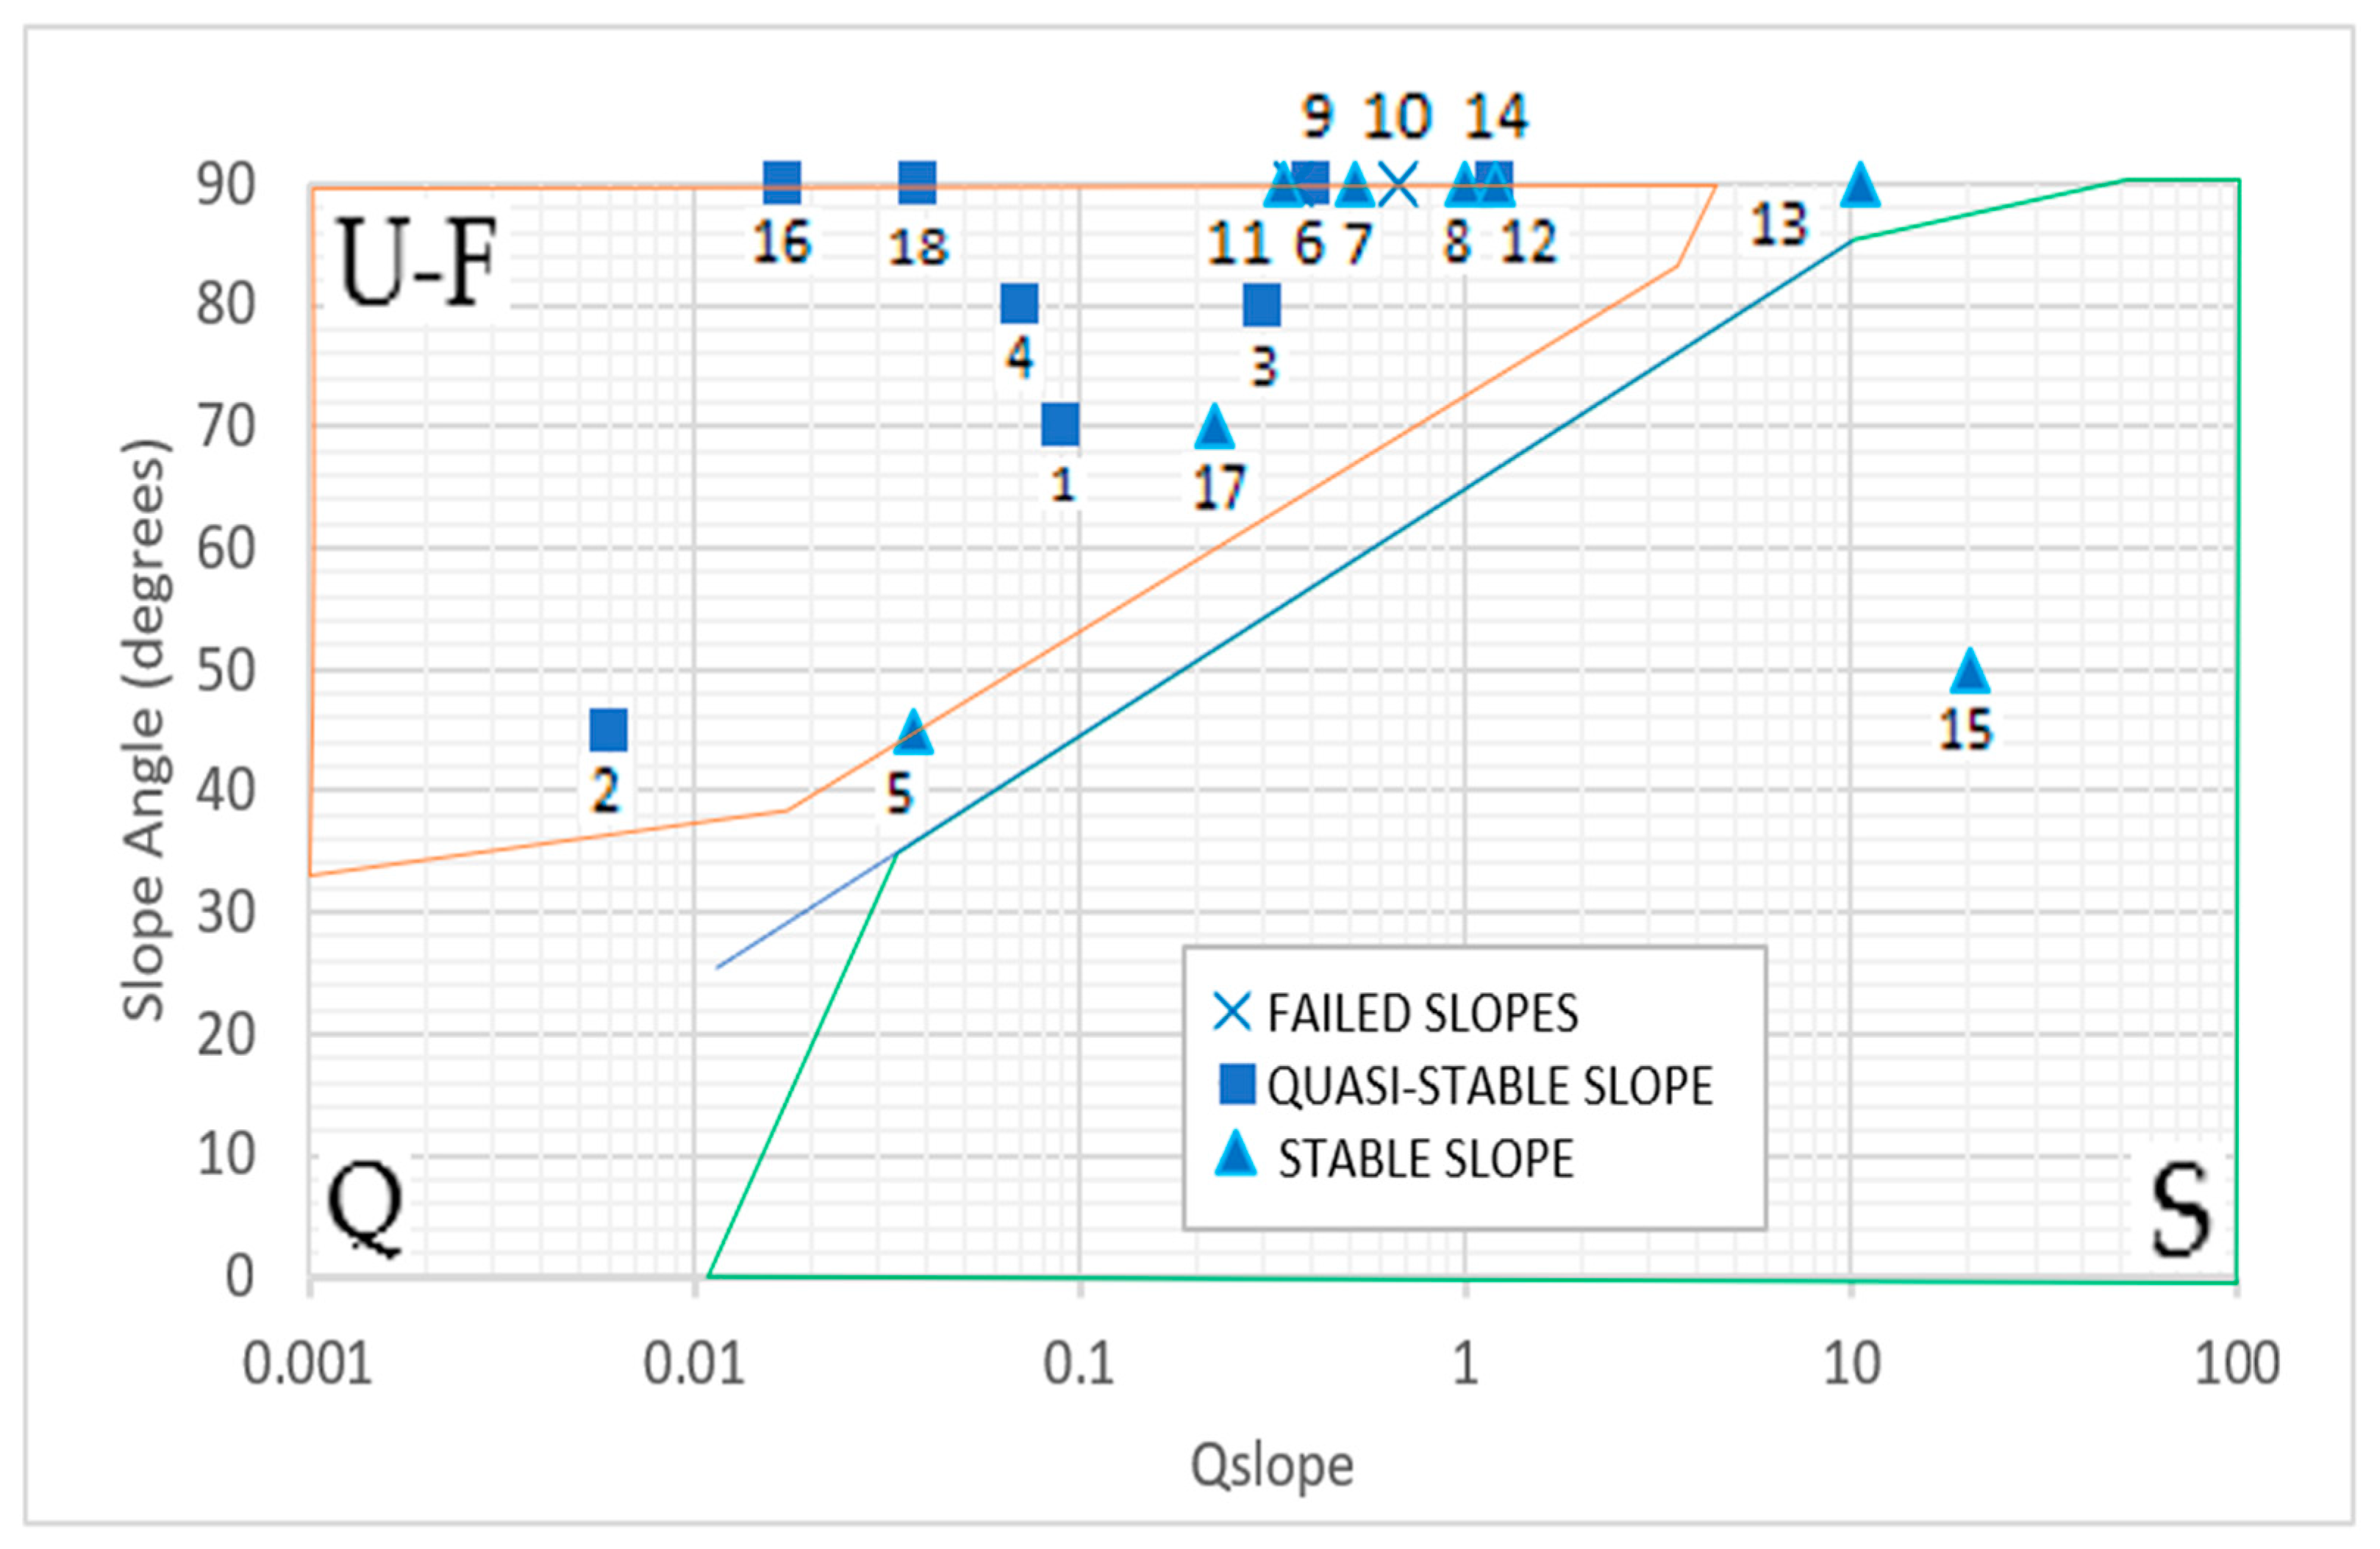
2.2. Q-Slope Addressing Ice Wedging

The Q-slope is a recently developed rock mass classification that is specific to rock slopes [9,18]. Like the Q-system [19]—from which it is derived—Q-slope uses six parameters. RQD, Jn, Jr, Ja are the same as the Q-system, and a correcting factor (named the O-factor) is introduced that depends on the apparent stability of the slope. The Jw and SRF of the Q-system are renamed as the Jwice—which includes other aspects—and the SRF is obtained in three different ways, with the least favorable result retained.
Q s l o p e = R Q D J n × J r J a o × J w i c e S R F s l o p e
where:
  • RQD is the rock quality designation, which varies between 0 and 100, and if the value is less than 10, then the minimal value of 10 is used [9].
  • Jn is the joint set number.
  • Jr and Ja are the joint roughness numbers and the joint alteration numbers, respectively.
  • The (Jr/Ja) factor considers the favorable or unfavorable orientation of the joints compared with the slope, and “O” is an adjustment factor referred to as the “O-factor”.
  • SRF slope is the stress reduction factor for the slope.
We refer the reader to the references [9,18,19] regarding parameters, rating tables, weighting, and a description of each of the aforementioned parameters—as well as the flowchart in Figure 5 where the traditional application method for Q-slope is shown. To apply the Q-index, an auxiliary graph that is divided into stable slopes, uncertain slope stability, and unstable slopes is used (see [9] and more recently, [20]). The graph was built on an extensive database that is in permanent evolution and increasing in size.
Among the parameters that build the Q-slope, we highlighted and focused on Jwice, which is termed the “environmental and geological condition number” [6,9,19,20,21]. Q-slope is the only rock mass classification that considers the effect of ice on the strength and stability of rock masses.

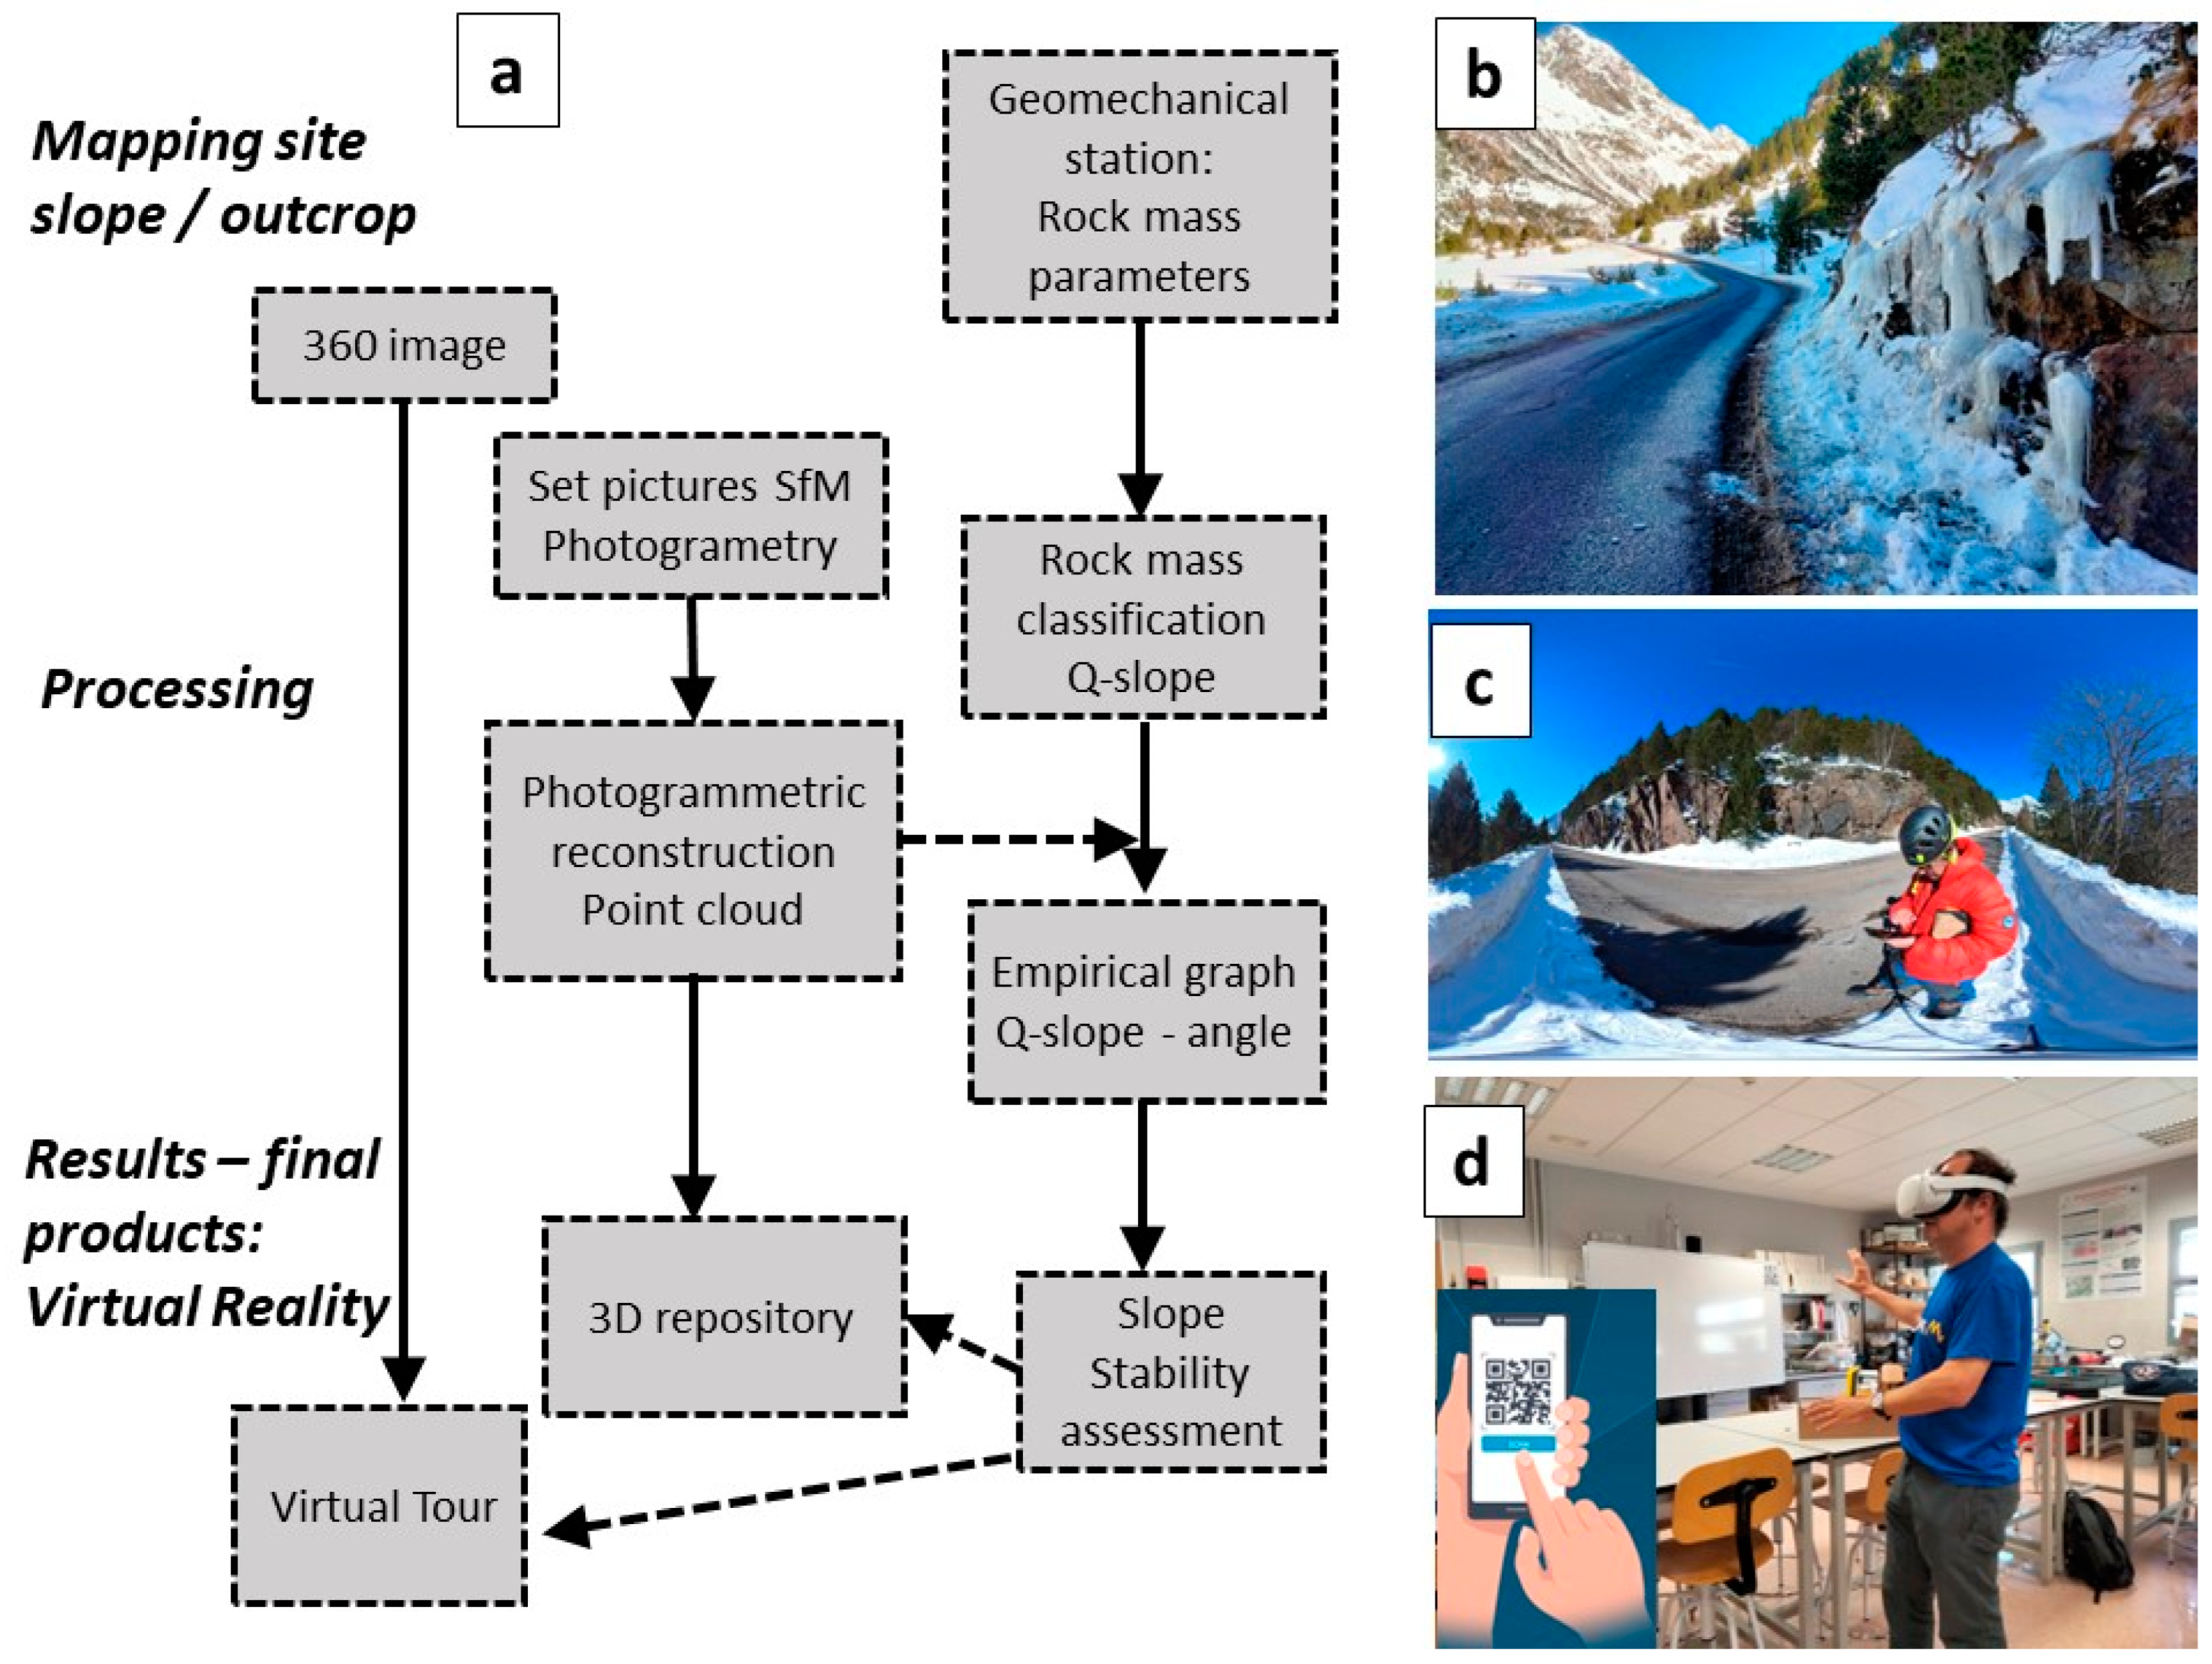
2.3. Field Data Acquisition and Interpretation

(1) Structure from Motion photogrammetry [11] is used to build up a digital model of the slope and point cloud [22]. With this model, we can measure the joints virtually in places we have not been able to access with the compass [23,24]. We used a low-cost methodology with a standard digital camera and a portable four-target reference system.
Considering that the photographs influence the quality of our digital model, it is recommended that users taking photographs (stage 1, Figure 6) control the quality of the objective, the image sensor, focal aperture, sensor sensitivity, and shutter speed. For this control, the aperture should be set to f/8–f/9, and the shutter speed should be set to 1/60–1/125 or faster. To avoid image distortions and noise, it is best to use intermediate focal lengths (35–80 mm), reduced ISO sensitivity (100 or less), and if flash is activated, then care should be taken to avoid creating shadows.
At the field site, structural data were recorded, and at the same time, a scale reference was placed that oriented the photogrammetry with respect to magnetic north and local coordinates. From the photographs, the photogrammetric model was built, which is the basis of the 3D model or point cloud. The 3D model served to complete the structural data in inaccessible areas. The process of constructing 3D images from SfM photogrammetry is described below (see Figure 6).
The SfM technique for slope analysis (Figure 6) can be divided into three methodological stages: Stage 1 is field information gathering; Stage 2 is the generation of a dense point cloud; and Stage 3 is 3D model generation and structural data collection. To process the photographs, the technique uses collinearity equations that require many similar points in superimposed images that are acquired in a structured way at different levels and positions with respect to the study object. The technique produces a dense cloud of points without orientation, which must be taken to an absolute coordinate system, which is achieved with control points that enable scaling and orienting the point clouds [25]. With the dense 3D point cloud, a high-resolution digital model was generated that provides structural data of slopes in inaccessible or high-risk areas [26].
Figure 6. SfM technique for slopes that can be used for multiple applications in slope stability analysis [27,28,29,30,31,32,33,34,35].
Sustainability 15 15744 g006
Figure 7 shows the work process in field and office. This procedure is valid for practical engineering applications, as well as research and teaching. A small area of about 5 m was initially chosen on each slope or in each relevant area, which we term a geomechanical station. Using normalized templates, we gathered in situ data on matrix, joint, and rock mass parameters (such as the joint roughness coefficient, simple compression, joint spacing, and joint orientation). This template and data should be an ambitious gathering of data and not focus, as sometimes happens, only on RMR geomechanical classifications and Q. With the data from a field template, we then determined the following parameters: shear joint strengths; matrix strengths; slope geometries; and of course, the input parameters of geomechanical classifications—usually RMR and Q [36,37] if it is an underground work, and SMR (Roman) and Q-slope [9,38,39,40] if it is a slope. Collecting this data usually takes one hour. It is important to have templates ready so that we do not forget anything, and data collection must be simplified as much as possible if conditions in the field are adverse.
We scanned the slope at the same time that the geomechanical data was being gathered. This type of scan has two purposes: to collect data in inaccessible areas and to obtain a digital VR model for more detailed analysis and for sharing with clients or researchers. VR does not help with data collection in the field, but rather it is a tool for visualizing results. In the academic field, the metaverse facilitates virtual field trips for training.
In this case, we implemented two imaging or scanning methodologies:
(2) We used a camera (Insta360 ONE) to obtain a 360-degree view of the study area. Once the data were captured and processed, they were uploaded to a repository or website where they could be viewed using virtual reality with varying degrees of immersion and development. We have opted for scanned 3D scenarios or 360° images that can be easily viewed with VR goggles. However, these scenarios can also be viewed with less interactive capacity from any smartphone or laptop device: It is important that the scenarios are user-friendly and that the images load quickly. These visualizations in the metaverse can have several objectives: They can enable researchers to access the place of study and replicate our research, clients see the work carried out, and virtual excursions or field trips can be generated for students to practice with real data and places. To aid this process, we provided a Q-slope data collection template. The photogrammetries were uploaded to the repository and are freely accessible as 3D models that can be zoomed and rotated and include pop-up menus with the geometric and geotechnical slope information. This information enables the entire study to be replicated. Some 360 images have been taken that are linked through a virtual reality scenario viewable using VR goggles.
In this research, we used a fast and low-cost methodology, classic tools such as the compass, and simple remote techniques. For the photogrammetry, we used medium–low range digital camera that produced adequate results. The 360° camera is good quality but not expensive. Figure 8 shows the template used for Q-slope data gathering. Virtual reality is in this case a mere visualization system. The most complex part was the data collection and the scanning of the slopes. These scanners are used to determine the stability conditions of the slopes. What happens is that we have used commercial 3D model repositories to visualize the results, and these repositories include a VR visualization mode.

3. Results

Table 2 summarizes the geotechnical parameters and calculation of the Q-slope index for each of the slopes and geomechanical stations. The table has been divided into two parts: the slopes of Navacerrada and those of the Pyrenees. The Jwice value obtained (related to that of the ice) and the Q-slope and slope angle (β°) have been highlighted. The last column corresponds to the visual stability analysis (subjectively) and the stability results shown in Figure 9 according to the Q-slope in icy conditions. Figure 8 was produced by the author for the slopes analyzed in this study but incorporates the Barton and Bar stability limit lines [9].
In the present research, 18 rocky slopes were studied, of which 83.34% were classified by the empirical Q-slope method as unstable, 11.11% were classified as quasi-stable, and 5.55% as stable. The slopes that were placed in the same category by the visual method and the empirical method were slopes 9, 10, and 15 (Figure 9).
Almost all the slopes are found in competent rocks with greater or lesser degrees of fracturing. The RQD values vary between 10 and 100, the best being those of the Benasque greywackes. The index for the number of Jn joint sets varies between 4 and 15. The roughness indices Jr and the alteration Ja are generally quite favorable, with Jr from 1 to 3 and Ja from 1 to 4 (see Table 2). The O-factor varies from 0.5 to 1. The Jwice ice effect correction was applied to all slopes. For the Navacerrada ski resort, we multiplied Jwice by 1.3 because it is an undrained but reinforced slope. The final columns in Table 2 correspond to the evaluation of slope stability both visually and by applying the results in Figure 8.
The slopes were scanned when the geomechanical data were collected. Scanners using the Structure from Motion (SfM) photogrammetric technique were uploaded to the Sketchfab repository. Below these lines are the links showing the results of each scan with pop-up menus that report the properties of the massif and some geometric data of the slopes. The 360° images were uploaded to the virtual and augmented reality platform, where indications, clues, and pop-up menus with geotechnical data were also posted. Using these virtual tours, students or researchers can replicate the results of this research from the field data collection stage. Table 3 indicates the links to these VR and 3D repository results.

4. Discussion

For field data collection, the empirical techniques and geomechanical classifications satisfactorily complement remote techniques. Using the Q-slope geomechanical classification, we can collect data in accessible and non-hazardous areas. Photogrammetric scans enable us to reach inaccessible points by adding information to the geomechanical station.
Table 2 and Figure 9 show the results of the stability analysis. It is interesting to see that the Q-slope index is conservative and prudent regarding stability: All slopes seen as highly unstable or fallen appear as “unstable” according to the Q-slope graph (Figure 9): namely, slopes 9 and 10. The slopes that are seen as having minor or quasi-stable instabilities appear in the Q-slope graph in the “unstable” zones, namely, slopes 1–4, 6, 14, 16, and 18. But it is striking that visually stable slopes, such as slopes 7, 8, 11–13, and 17, appear as unstable. This is because the Q-slope angle stability graph [9,20] indicates any 90° slope with Q-slope qualities below 4 as unstable and Q-slope qualities greater than 4 as “transitional”.
We consider that slopes with good Q-slope geomechanical qualities and moderate heights can be perfectly vertically stable. Part of the graph could be modified as in the case indicated in Jordá 2017 [18]. Visually stable slopes 5 and 15 appear as stable in Figure 9 given the angle of the Q-slope. In the present work, we provide new data for the Barton and Bar Q-slope criterion [6]. Figure 9 shows many slopes with a few instabilities positioned in the part of the graph that corresponds to “unstable–failed” (namely, slopes 16, 18, 4, 1, and 17). Slope 5 is on the boundary line. These new data “collaborate” in fixing the limits or boundaries between the stable and unstable slopes. Slope 2 has an inclination of 45° and is stable, but it is located in the unstable zone. It is important to notice that the lower left area of the graph has very little data, and the limit line in this sector should be reviewed or analyzed more carefully. We also recommend evaluating the boundary between unstable and transitional for vertical slopes (90°) with Q-slope qualities greater than 1.
We believe that the methodology we propose, although it has limitations, is extremely effective and fills many gaps in the type of studies carried out on slope stability. The main benefit is that the field data are readily available in a user-friendly repository, and anyone can replicate the study or assess its rigor. The Q-slope methodology in winter has only one reference, so we believe that our work contributes more references to the database; again, the original authors of the criterion can judge if we have taken the data correctly and incorporated it or not to your line of work. Regarding limitations and future lines of work, it is necessary to unify databases with a lot of information in easy-to-view 3D environments. The repositories and environments that we use can become saturated, so a possible line of work would be the use of BIM (Building Information Modeling)-type technologies.
We therefore believe that the empirical Q-slope methodology is generally conservative and can also be applied to icy rock slopes in winter. Remote techniques, and especially the SfM technique used here, serve for gathering structural and geotechnical data in areas that are difficult to access and enable us to infer parameters of the Q-index, such as the joint set number and SRF. Once the slope has been scanned using this technique, or a 360° photo has been taken, we can upload it to a digital repository where anyone can reinterpret our calculations and perform quality control. This repository can be considered a metaverse since we see a partially immersive reality. In the academic field, these models are visible with virtual reality goggles.

5. Conclusions

The Q-slope is currently the only geomechanical analysis method that evaluates the action of ice on rocky slope stability. This research shows the importance of new data, which enables improving the method and demonstrating that it is conservative in its stability classification of rock slopes. It is necessary to continue feeding the Q-slope winter database to correctly delimit the stable–unstable boundary line.
New digital remote techniques enable technicians in charge of field investigations to carry out their work quickly and with less risk. New methods of presenting field information, such as virtual reality, enable a greater number of users to use the data obtained in an evaluation and replicate research efficiently in controlled environments. With this premise, we can conclude that the use of the metaverse enables a significant advance in the process of opening technical and scientific information.
If we analyze the results obtained from a bibliometric analysis on 8 August 2023 of the SCOPUS scientific article database on the “metaverse” search criteria for a period of 28 years counting from 1995, we see that it is not until 2008 that publications on the subject begin to increase—with a takeoff in 2021 with 53 scientific publications. The peak is reached in 2022 with 1135 publications. So far, in 2023, there have been 1166 publications. With these results, we can conclude that any type of publication that discusses this topic is current, novel, and of importance for the development of new technologies worldwide.

Author Contributions

Conceptualization, L.J.B.; methodology, L.J.B.; software, L.J.B.; validation, L.J.B. and C.P.B.B.; formal analysis, L.J.B. and C.P.B.B.; investigation, L.J.B. and C.P.B.B.; writing—original draft preparation, L.J.B. and C.P.B.B.; writing—review and editing, L.J.B. and C.P.B.B.; supervision, L.J.B. All authors have read and agreed to the published version of the manuscript.

Funding

This research received no funding.

Institutional Review Board Statement

Not applicable.

Informed Consent Statement

Not applicable.

Data Availability Statement

Data are contained within the article.

Conflicts of Interest

The authors declare no conflict of interest.

References

  1. AtlasBig.com. Available online: https://www.atlasbig.com/en-us/countries-average-elevation (accessed on 25 January 2022).
  2. Escarpe, L.A. Pirineos Guía de Los 3000 m, 1st ed.; Sua Edizioak: Bilbo, Spanish, 2015. [Google Scholar]
  3. Martínez, M.T. Sierra Nevada: Una Gran Historia, 1st ed.; Editorial Universidad de Granada: Granada, Spanish, 1997. [Google Scholar]
  4. Tiempo.com. Available online: https://www.tiempo.com/ram/38719/aniversario-de-un-record-frio-en-espana/#:~:text=El17dediciembrede,Españaenunlugarhabitado (accessed on 25 January 2022).
  5. Infonieves.es. Available online: https://www.infonieve.es/estaciones-esqui/pais/espana/ (accessed on 25 January 2022).
  6. Bar, N.; Barton, N. Q-Slope Addressing Ice Wedging and Freeze-Thaw Effects in Arctic and Alpine Environments. In Proceedings of the ISRM International Symposium-EUROCK 2020, Trondheim, Norway, 12–14 October 2020. [Google Scholar]
  7. Romana. New Adjustment Ratings for Application of Bieniawski Classification to Slopes. In Proceedings of the International Symposium on Role of Rock Mechanics, Zacatecas, Mexico, 2–4 September 1985; pp. 49–53. Available online: https://www.scirp.org/(S(351jmbntvnsjt1aadkposzje))/reference/ReferencesPapers.aspx?ReferenceID=253061 (accessed on 25 January 2022).
  8. Romana, M.; Tomás, R.; Serón, J.B. Slope Mass Rating (SMR) geomechanics classification: Thirty years review. In Proceedings of the 13th ISRM International Congress of Rock Mechanics, Montreal, Canada, 10–13 May 2015; Volume 2015, pp. 1–10. [Google Scholar]
  9. Barton, N.; Bar, N. Introducing the Q-slope method and its intended use within civil and mining engineering projects. In Proceedings of the ISRM Regional Symposium, EUROCK 2015, Salzburg, Austria, 7–10 October 2015; pp. 157–162. [Google Scholar]
  10. Bordehore, L.J.; Riquelme, A.; Cano, M.; Tomás, R. Comparing manual and remote sensing field discontinuity collection used in kinematic stability assessment of failed rock slopes. Int. J. Rock Mech. Min. Sci. 2017, 97, 24–32. [Google Scholar] [CrossRef]
  11. Delgado-Reivan, X.; Paredes-Miranda, C.; Loaiza, S.; Echeverria, M.D.P.V.; Mulas, M.; Jordá-Bordehore, L. Stability Analysis of Rocky Slopes on the Cuenca–Girón–Pasaje Road, Combining Limit Equilibrium Methods, Kinematics, Empirical Methods, and Photogrammetry. Remote Sens. 2023, 15, 862. [Google Scholar] [CrossRef]
  12. García-Vela, M.T.; Borja-Bernal, C.P.; Jordá-Bordehore, L.; Medinaceli-Torrez, R.; Loaiza, S.; Falquez, D.A. Teaching rock mechanics using Virtual Reality: Laboratory practices and field trips during the confinement of the Coronavirus COVID-19 in Ecuador, Bolivia, and Spain. In Proceedings of the IOP Conference Series: Earth and Environmental Science, Turin, Italy, 20–25 September 2021; Volume 833. [Google Scholar] [CrossRef]
  13. Serrano, E.; Pisabarro, A.; Rico, I. Mapping the potential distribution of frozen ground in tucarroya (monte perdido massif, the pyrenees). Cuad. Investig. Geográfica Geogr. Res. Lett. 2020, 46, 395–411. [Google Scholar] [CrossRef]
  14. Remondo, J.; Soto, J.; González-Díez, A.; de Terán, J.R.D.; Cendrero, A. Human impact on geomorphic processes and hazards in mountain areas in northern Spain. Geomorphology 2005, 66, 69–84. [Google Scholar] [CrossRef]
  15. Available online: https://www.climasyviajes.com/clima/espa%C3%B1a/puerto-navacerrada (accessed on 16 March 2023).
  16. Available online: https://es.climate-data.org/europe/espana/aragon/benasque-729631/#temperature-graph (accessed on 16 March 2023).
  17. Available online: https://es.weatherspark.com/y/35440/Clima-promedio-en-Navacerrada-Espa%C3%B1a-durante-todo-el-a%C3%B1o-graph (accessed on 10 April 2023).
  18. Jordá-Bordehore, L. Application of Q slope to Assess the Stability of Rock Slopes in Madrid Province, Spain. Rock Mech. Rock Eng. 2017, 50, 1947–1957. [Google Scholar] [CrossRef]
  19. Barton, J.; Lien; Lunde, R. Engineering Classification of Rock Masses for the Design of Tunnel Support. Rock Mech. 1974, 6, 189–236. [Google Scholar] [CrossRef]
  20. Bar, N.; Barton, N. The Q-Slope Method for Rock Slope Engineering. Rock Mech. Rock Eng. 2017, 50, 3307–3322. [Google Scholar] [CrossRef]
  21. Bar, N.; Barton, N.R. Empirical slope design for hard and soft rocks using Q-slope. In Proceedings of the 50th US Rock Mechanics/Geomechanics Symposium 2016, Houston, TX, USA, 26–29 June 2016; Volume 2, pp. 1301–1308. [Google Scholar]
  22. Chen, J.; Zhu, H.; Li, X. Automatic extraction of discontinuity orientation from rock mass surface 3D point cloud. Comput. Geosci. 2016, 95, 18–31. [Google Scholar] [CrossRef]
  23. Nagendran, S.K.; Ismail, M.A.M.; Tung, W.Y. Photogrammetry approach on geological plane extraction using cloudcompare FACET plugin and scanline survey. Bull. Geol. Soc. Malays. 2019, 68, 151–158. [Google Scholar] [CrossRef]
  24. Tung, W.Y.; Nagendran, S.K.; Ismail, M.A.M. 3D rock slope data acquisition by photogrammetry approach and extraction of geological planes using FACET plugin in CloudCompare. In IOP Conference Series: Earth and Environmental Science; IOP Publishing: Bristol, UK, 2018; Volume 169. [Google Scholar] [CrossRef]
  25. Tomás, R.; Riquelme, A.; Cano, M.; Abellán, A. Structure from Motion (SfM): Una Técnica Fotogramétrica de Bajo Coste Para la Caracterización y Monitoreo de Macizos Rocosos. 10° Simp. Nac. Ing. Geotécnica A Coruña España 2016, 1, 209–216. Available online: https://www.researchgate.net/publication/309611177_Structure_from_Motion_SfM_una_tecnica_fotogrametrica_de_bajo_coste_para_la_caracterizacion_y_monitoreo_de_macizos_rocosos (accessed on 14 August 2023).
  26. Riquelme, A.J.; Tomás, R.; Abellán, A. Characterization of rock slopes through slope mass rating using 3D point clouds. Int. J. Rock Mech. Min. Sci. 2016, 84, 165–176. [Google Scholar] [CrossRef]
  27. Robiati, C.; Eyre, M.; Vanneschi, C.; Francioni, M.; Venn, A.; Coggan, J. Application of remote sensing data for evaluation of rockfall potential within a quarry slope. ISPRS Int. J. Geo-Inf. 2019, 8, 367. [Google Scholar] [CrossRef]
  28. Shao, Y.; Ji, Y.; Fujii, H.; Nagatani, K.; Yamashita, A.; Asama, H. Estimation of scale and slope information for structure from motion-based 3D map. In Proceedings of the SII 2017–2017 IEEE/SICE International Symposium on System Integration, Taipei, Taiwan, 11–14 December 2017; Volume 2018, pp. 208–213. [Google Scholar] [CrossRef]
  29. Gómez-Gutiérrez, A.; Schnabel, S.; Conoscenti, C.; Caraballo-Arias, N.A.; Ferro, V.; Di Stefano, C.; Sanjose, J.J.; Angileri, S.E.; De Matías, J.; Berenguer-Sempere, F. Production of 3D models for different morphologies and scales using structure from motion techniques and terrestrial pictures|Elaboración de modelos 3D de diferentes morfologías y escalas utilizando técnicas Structure-from-Motion y fotografías Terrestre. Cuaternario Geomorfol. 2016, 30, 23–35. [Google Scholar] [CrossRef]
  30. Westoby, M.J.; Brasington, J.; Glasser, N.F.; Hambrey, M.J.; Reynolds, J.M. Structure-from-Motion’ photogrammetry: A low-cost, effective tool for geoscience applications. Geomorphology 2012, 179, 300–314. [Google Scholar] [CrossRef]
  31. Karantanellis, E.; Marinos, V.; Vassilakis, E. 3D hazard analysis and object-based characterization of landslide motion mechanism using uav imagery. Int. Arch. Photogramm. Remote Sens. Spat. Inf. Sci. ISPRS Arch. 2019, 42, 425–430. [Google Scholar] [CrossRef]
  32. Wei, Z.-Y.; Ramon, A.; He, H.-L.; Gao, W. Accuracy analysis of terrain point cloud acquired by ‘structure from motion’ using aerial photos. Dizhen Dizhi 2015, 37, 636–648. [Google Scholar] [CrossRef]
  33. García-Luna, R.; Senent, S.; Jurado-Piña, R.; Jimenez, R. Characterization of underground rock masses employing structure from motion: Application to a real case. In Proceedings of the Tunnels and Underground Cities: Engineering and Innovation meet Archaeology, Architecture and Art-Proceedings of the WTC 2019 ITA-AITES World Tunnel Congress, Naples, Italy, 3–9 May 2019; pp. 826–834. [Google Scholar] [CrossRef]
  34. Obanawa, H.; Hayakawa, Y.S.; Gomez, C. 3D modelling of inaccessible areas using uav-based aerial photography and structure from motion. Chikei/Trans. Jpn. Geomorphol. Union 2014, 35, 283–294. [Google Scholar]
  35. Tomás, R.; Riquelme, A.; Cano, M.; Pastor, J.L.; Pagán, J.I.; Asensio, J.L.; Ruffo, M. Evaluation of the stability of rocky slopes using 3D point clouds obtained from an unmanned aerial vehicle|Evaluación de la estabilidad de taludes rocosos a partir de nubes de puntos 3D obtenidas con un vehículo aéreo no tripulado. Rev. Teledetec. 2020, 2020, 1–15. [Google Scholar] [CrossRef]
  36. Bieniawski, Z.T. Classification of Rock Masses for Engineering: The RMR System and Future Trends; Elsevier Ltd.: Amsterdam, The Netherlands, 1993. [Google Scholar]
  37. Barton, N.; Bieniawski, Z.T. RMR and Q-Setting Records straight. Tunnels Tunn. Int. 2008, 26–29. Available online: https://www.scopus.com/inward/record.uri?eid=2-s2.0-40749094891&partnerID=40&md5=f1e100f52a75d14309204bc8539c5e01 (accessed on 14 August 2023).
  38. Romana, M. Practice of SMR classification for slope appraisal. In Proceedings of the Fifth International Symposium on Landslides, Lausanne, Switzerland, 10–15 July 1988; Volume 2. [Google Scholar] [CrossRef]
  39. Romana, M. SMR classification. In Proceedings of the 7th ISRM Congress, Aachen, Germany, 16–20 September 1991; pp. 955–960. [Google Scholar]
  40. Bar, N.; Barton, N.R.; Ryan, C.A. Application of the Q-slope method to highly weathered and saprolitic rocks in Far North Queensland. Rock Mech. Rock Eng. Past Future 2016, 1, 585–590. [Google Scholar] [CrossRef]
Figure 1. Study sites and relief in the Iberian Peninsula.
Sustainability 15 15744 g001
Figure 2. Histogram of Navacerrada and Benasque temperatures [15,16,17].
Sustainability 15 15744 g002
Figure 3. Slopes at study site Puerto de Navacerrada 1: (a) slope 1; (b) slope 2; (c) slope 4 pictures and data taken Altitude 1885 is m.a.s.l. Typical day temperatures are −3 °C, and nighttime temperatures −8 °C.
Sustainability 15 15744 g003
Figure 4. Study site 2: Llanos del Hospital (Benasque, Pyrenees) cross-country ski resort and road to the French border. Temperature during the field trip day (maximum) +4 °C, night −12 °C. (a) Toppling problems at slope 6; (b) wedge failure at slope 9; (c) toppling and ice falls at slope 8; (d) fallen blocks; (e) frozen joints and ice cracking.
Sustainability 15 15744 g004
Figure 5. Conventional methodology for the application of the empirical Q-slope method.
Sustainability 15 15744 g005
Figure 7. Flowchart of the field and processing progress to obtain the geomechanical parameters (and stability assessment), as well as the VR and 3D results; (a) shows research progression from field data acquisition to results. (b) shows some icefalls where the field campaign is developed. (c) is the 360° spheric view seen when operating the camera through an app. (d) shows the virtual reality platform.
Sustainability 15 15744 g007
Figure 8. Blank template to obtain the Q-slope index used in this research.
Sustainability 15 15744 g008
Figure 9. Q-slope stability assessment chart in ice wedging conditions. The line represents the Barton–Bar stability equation for slopes: U = unstable–failed zone; Q = quasi-stable–uncertain zone; S = stable zone.
Sustainability 15 15744 g009
Table 1. Brief description of the study sites and visits.
SlopeLocationAltitude Meters
a.s.l
LithologySlope Heigh
(m)
Slope Angle °Field Work Date/hTemperature °CSlope Reinforcement (Mesh, Bolts…)Ice Wedging–Ice Falls
Minimum NightDuring Measures
1Navacerrada carpark (Madrid)1849 Granite15 m60–70°01/20/2023
15:00
−7 °C2 °Cyesyes
21849 Granite10 m45°01/20/2023
15:10
−7 °C2 °Cyesyes
31849 Granite6 m80°01/20/2023
15:30
−7 °C2 °Cyesyes
41849 Granite4–8 m70–80°01/20/2023
15:52
−7 °C1 °Cyesyes
5Morcuera (Madrid)1761 Gneiss4–10 m20–45°01/20/2023
17:20
−7 °C2 °CNoYes
6Llanos del Hospital (Benasque)1778 Slate8 m90–100°01/29/2023
12:20
−12 °C0 °CNoYes
71778 Slate10 m90°01/29/2023
12:30
−12 °C0 °CNoYes
81778.Slate12 m90–100°01/29/2023
12:45
−12 °C0 °CNoYes
91619 Greywacke10 m90°01/29/2023
16:00
−12 °C0 °CNoYes
101619 Greywacke10 m90°01/29/2023
16:15
−12 °C0 °CNoYes
111464 Greywacke6 m90°01/29/2023
17:00
−12 °C0 °CNoYes
121658 Slate8 m.90°01/29/2023
10:00
−7 °C0 °CNoYes
13Esera river bridge (Benasque)1246 Slate6 m.90°01/31/2023
11:00
−5 °C11 °CNoYes
141246 Slate8 m.90°01/31/2023
11:20
−5 °C11 °CNoYes
151246 Slate4 m.50°01/31/2023
11:35
−5 °C11 °CNoYes
16La Piedad hermitage (Navarri) A139 road1005 Marls and sandstones15 m.90–100°01/31/2023
12:30
−5 °C6 °CNoYes
171005 Marls and sandstones15 m.70°01/31/2023
12:35
−5 °C6 °CNoYes
181005 Marls and sandstones15 m.90°01/31/2023
12:40
−5 °C6 °CNoYes
Table 2. Calculation of the average parameters to identify the Q-slope of the slopes studied: U = unstable–failed; support needed for global stability; Q uncertain–quasi-stable (minor bock and slabs detachments and failures, open cracks, minor reinforcements for unraveling of rocks); S = stable (* wedges apply set A and (set B)) Jwice × 1.3 when reinforcements applied (bolts, etc.).
Study SiteSlopeLithologyQ-Slope Calculation FactorsQ-Slope
Ice
β (°)Height
(m)
Stability
RQDJnJrJaO-FactorJwiceSRF SlopeVisual Perception (*)Q-Slope Graph
Puerto Navacerrada
Guadarrama
1Granite5591.540.50.3 × 1.350.0960–7015QU
210151.540.50.3 × 1.380.0064510QU
340–70121.5410.9 × 1.350.3–0.5806QU
410–50121.5410.9 × 1.350.07–0.3670–804QU
5Gneiss2091.5310.5150.037308SQ
Benasque–Pyrenees6Slates and greywackes80121110.350.490–1008QU
770121210.950.529010SU
810091210.95190–10012SU
9100151(1) *1(1)0.5 × 0.90.32.50.369010UU
101009110.50.32.50.679010UU
1190121.530.750.32.50.338906SU
1280121.5310.92.51.2908SU
13slates7093210.9110.5906SQ
14809320.750.32.51.2908QU
15804320.750.9120.25504SS
16marls10–5091410.350.01790–10015QU
1710–5041410.92.50.2257015SU
1810–5041410.350.0389015QU
Table 3. Links to virtual reality and 3D image repository from the current research.
Web Link or/and QR CodeType of PlatformNumber of Images–ScenesSites CoveredVirtual Data Gathering–Pop-Ups Menus
https://edu.cospaces.io/GYJ-RVVTour–virtual reality field trip4Navacerrada and Benasqueyes
https://sketchfab.com/3d-models/slope-9-benasque-cfa3fe8a2d534b9ebdc6fe093d8901df
Sustainability 15 15744 i001
Repository 3D image1BenasqueNot yet
https://sketchfab.com/3d-models/slope-6-and-7-benasque-d779f38842864224b3a4d56ed43f7324
Sustainability 15 15744 i002
Repository 3D image1BenasqueNot yet
Disclaimer/Publisher’s Note: The statements, opinions and data contained in all publications are solely those of the individual author(s) and contributor(s) and not of MDPI and/or the editor(s). MDPI and/or the editor(s) disclaim responsibility for any injury to people or property resulting from any ideas, methods, instructions or products referred to in the content.

