Article

Co-evolution of Smart Small Vehicles and Human Spatial Experiences: Case Study on Battery-Sharing Electric Two-Wheelers Experiment

Department of Civil Engineering, Division of Global Architecture, Graduate School of Engineering, Osaka University, Osaka 5650871, Japan
*
Author to whom correspondence should be addressed.
Sustainability 2023, 15(20), 15171; https://doi.org/10.3390/su152015171
Submission received: 24 September 2023 / Revised: 14 October 2023 / Accepted: 18 October 2023 / Published: 23 October 2023
(This article belongs to the Special Issue Integrating Sustainable Transport and Urban Design for Smart Cities)

Abstract

:
Small-format mobility services have been introduced in many cities to promote sustainable urban development. In some cities, these services are primarily seen as entertainment rather than significant transport modes. Research has studied the roles of experiential/hedonic and functional/instrumental motivations in users’ adoption intent for such services. However, there is still a limited understanding of how actual spatial experiences of mobility travels shape travel behaviors. This study explores the role of spatial experience in mobility travels. Specifically, the research question revolves around whether better spatial knowledge leads to better spatial experiences, thereby satisfying users’ functional/instrumental and experiential/hedonic values for mobility trips. Additionally, we examine how spatial knowledge affects travel behaviors regarding trip chaining and vehicle charging. To assess road users’ spatial knowledge, we use sketch maps to examine changes after three months of using battery-sharing two-wheelers. A mixed-methods approach and multiple data sources are employed to provide deeper insights, including sketch maps, questionnaire surveys on attitudes, and a panel data analysis on activity-travel patterns. The results indicate that spatial experience significantly influences perceived values and, consequently, travel behaviors. Improved knowledge leads to greater satisfaction with mobility travel. Furthermore, an interaction effect is found between cognitive distance and cognitive direction concerning users’ satisfaction with the driving range and charging issues of electric vehicles.

1. Introduction

Spatial cognition plays a crucial role in travel behaviors, encompassing aspects such as wayfinding, navigation, and route selection [1,2]. Individuals’ spatial cognition both influences and is influenced by their spatial experiences, collectively shaping how they perceive and interact with their environment. The majority of research in transportation studies has focused on car drivers, given the dominant role of automobiles in cities [3]. Comprehending the role of spatial cognition is vital for predicting urban traffic flow. Despite some attempts to integrate human cognitive factors into transportation modeling, the understanding of the impact of spatial experience and varying levels of spatial knowledge remains limited [4,5,6]. It is regarded that a more thorough comprehension of how mode experiences shape individual spatial cognition could improve transport modeling significantly by creating fundamentally different matrices of activity opportunities [3]. Moreover, studies have examined the impact of different transport modes on travelers’ spatial knowledge [7]. Integrating a comprehensive understanding of how mode experiences shape individuals’ “cognitive maps” can enhance transport modeling by generating distinct matrices of activity opportunities [3]. Cognitive maps, as mental representations of experienced external environments, shape how people interact with and navigate through their surroundings, making them essential in studying spatial cognition in travel behavior.
In recent years, the emergence of small electric vehicles (SEVs) has been facilitated by advancements in energy-charging services. An SEV offers an affordable and sustainable transport alternative that can contribute to urban sustainability, ecofriendly landscapes, and the mitigation of traffic congestion. It bridges the flexibility gap between private and public transportation modes, adapting to dynamic changes in demand and mobility preferences [8]. Urban administrators have encouraged the use of SEVs as an effective and a sustainable means of transport, providing a viable substitute for personal car trips [9].
SEV serves a role akin to active modes, fostering connectivity between travelers and their environment while promoting social and cultural cohesion [10]. Meanwhile, it offers the flexibility of a motorized vehicle for spatial exploration. Studies on user intentions toward new mobility services have explored functional/instrumental and experiential/hedonic values [11,12]. In certain developed urban contexts, an SEV is viewed more as entertainment than a significant transportation mode [13]. Although experiential/hedonic values are known to influence user adoption [14], the impact of spatial experiences on urban travel remains unclear.
Spatial abilities for navigation and wayfinding are particularly important for SEV users, especially with the emergence of battery-swapping solutions to address charging concerns and limited EV range [15,16]. The mechanism of battery sharing is expected to reshape EV users’ urban travel patterns, which are closely tied to their cognitive urban form and charging demand. Users’ spatial cognition affects their behaviors, including knowledge acquisition, route planning, and their perception of distance to manage residual power before reaching the next charging spot. Consequently, concerns about residual power may restrict users’ travel range despite the increased mobility provided by SEVs. It is worth noting that while technologies like GPS have improved city navigation, cognitive maps play a role in predicting access to potential opportunities when making travel decisions [2]. In other words, individuals’ decisions to travel or stay are influenced by their perception of distances to destinations [17].
Despite few discussions in the current literature, this study argues that SEV users may perceive the environment and behave differently compared to conventional private transport users, such as car drivers, cyclists, and walkers. Active-mode travelers, which commonly refer to cyclists and pedestrians, have a distinct perception of the environment due to their exposure to it, unlike car drivers, whose sensory inputs are blocked. This study attempts to conduct empirical research to explore the role of spatial experience in SEV users’ urban travels. Specifically, this paper aims to examine how the experiences of traveling by SEV affect users’ spatial knowledge, how different levels of spatial knowledge affect users’ satisfaction with their mobility travels, and how spatial knowledge shapes their urban travel behaviors.
To address the research gap, this study provides a theoretical background on spatial knowledge development, focusing on (1) theories related to spatial knowledge acquisition in large-scale environments, (2) the role of spatial experience in urban travels, and (3) techniques for investigating cognitive maps. The insights gained from the literature review inform the methodology, which includes analyzing roads users’ spatial knowledge, exploring user attitudes, and examining travel patterns. The data for this study were collected from participants involved in a pilot project of battery-sharing electric two-wheelers (BSET) in Osaka, Japan.

2. Theorical Background

2.1. Spatial Knowledge Acquisition

Cognitive mapping is closely intertwined with spatial knowledge acquisition. It refers to the mental process through which individuals acquire, store, recall, and manipulate information about the attributes and relative locations of their spatial environment [18]. As individuals interact with and receive information from their surroundings, they develop spatial knowledge by understanding the relationships and features of the environment [19]. There has been extensive research on spatial knowledge acquisition, including several review articles [20,21,22].
Previous research has focused on how people remember and represent medium-scale and large-scale environments (i.e., neighborhood and city scales) [19,23,24,25,26,27]. Lynch’s influential work identified five elements—nodes, paths, districts, landmarks, and edges—that shape individuals’ mental representation of a city [19], providing a framework for understanding the structure of cognitive maps. Appleyard examined the influence of social meanings on the cognitive representations of neighborhoods and cities, finding that visibility, personal use, and the significance of physical characteristics affect inhabitants’ perceptions [24,25]. He also addressed the role of symbolism in the environment, emphasizing the importance of environmental meaning and symbolism in human experience [28,29]. According to Moore (1979), developmental changes occur in perceiving large-scale environments, shifting from social and physical conceptions to symbolic ones [27]. Building on Appleyard’s communications model of environmental action [28], this study introduces the concept of cognitive affordance and cognitive mapping to explore dynamic cognitive processes in situated environments.

2.1.1. Affordance and Cognitive Mapping

Physical environments exert a profound influence on human behavior through the concept of affordance, originally introduced by perception psychologist James J. Gibson [30,31]. Affordance refers to the opportunities and possibilities that the environment offers to individuals. Lazarus (1991) explored the link between an animal’s needs and the environment, highlighting the preconscious appraisal of affordance [32]. In the domain of architecture, affordance is a framework for understanding the relationship between environment and its occupants, particularly in terms of form and function [33]. Cognitive affordance plays a starring role in interaction design, particularly for users with limited experience, by supporting thinking and learning processes [34].
Marcus, Giusti, and Barthel (2016) extended the concept to urban design, suggesting its relevance to sustainable urbanism and emphasizing the constant interaction between individuals and their situated cognition [35]. The everyday environment was regarded as playing the role of the interface in which a person learns when personal abilities are enabled by situational opportunities (i.e., affordances). In the dynamic interaction between a person and the built environment, the designed features may have varying social meanings for different users. In the context of road environments, road users progressively develop spatial abilities to actualize the potential affordances of the environment through their everyday experiences. These potential affordances can be obtained from road space (e.g., traffic conditions, infrastructure design), surrounding architectural features, natural sights, etc.

2.1.2. Spatial Learning

The acquisition of spatial knowledge, named spatial learning, involves three stages: landmark, route, and survey [26,36]. Landmarks are prominent features of cognitive maps, providing basic location information. Route knowledge allows individuals to link locations during travel but lacks an overall understanding of spatial organization. At the survey level, individuals acquire a comprehensive understanding of the environment, recognizing relative directions and distances among multiple locations. Individual spatial experiences, particularly within their activity space, influence spatial knowledge. The anchor-point theory suggests that people have the most extensive knowledge of areas around their homes and workplaces [37]. To obtain comprehensive knowledge, the anchor points have active roles in organizing spatial relations in cognitive maps [38]. Spatial learning leads to the development of a survey map that recognizes relative directions and distances among multiple locations, resulting in both quantitative and qualitative improvements in spatial knowledge [22,39].

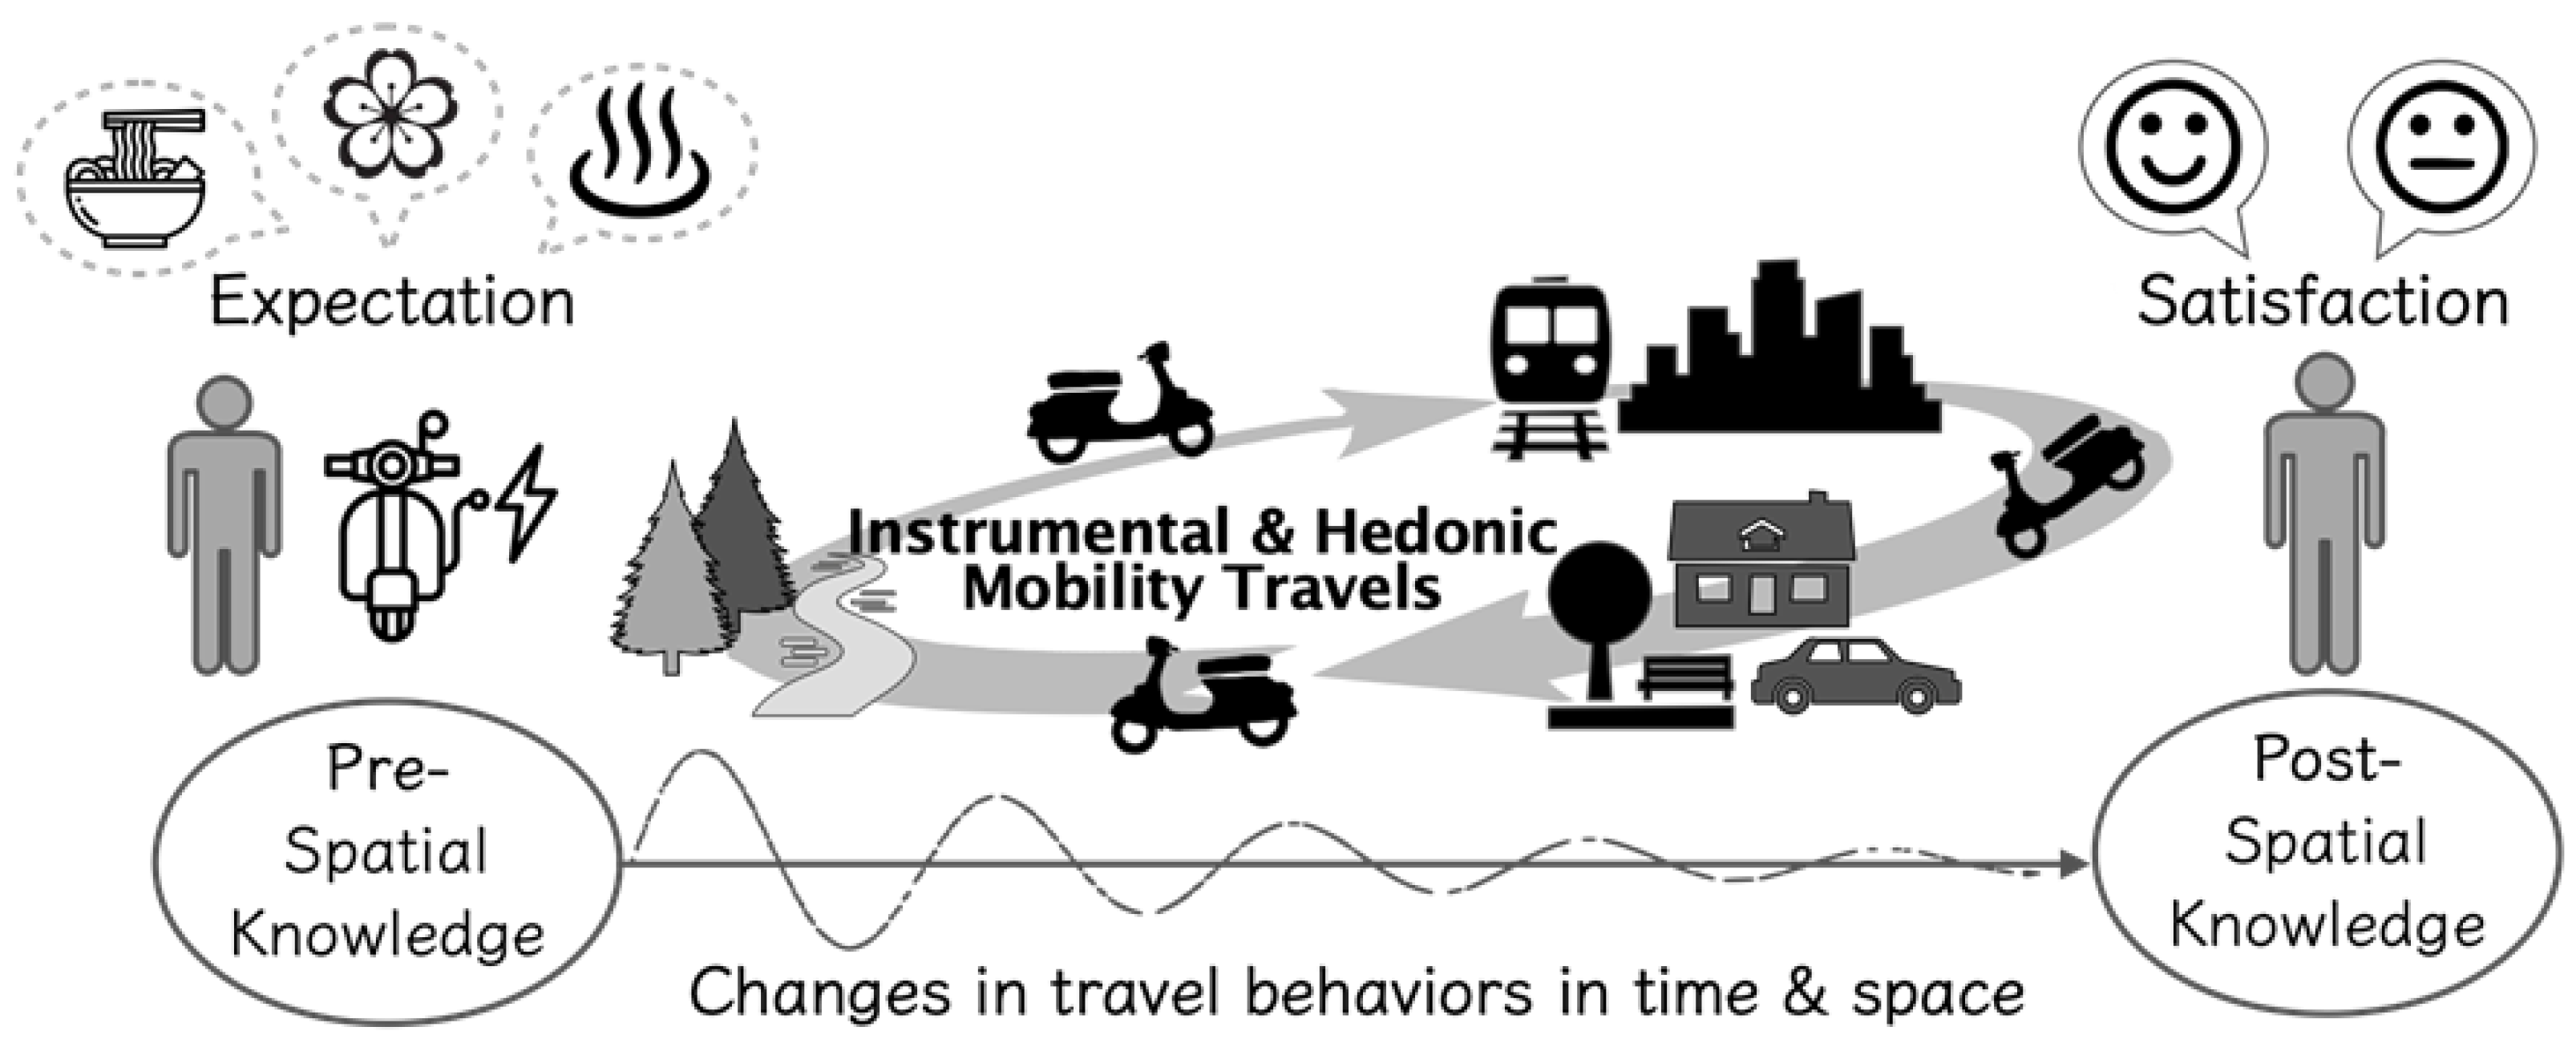
2.2. Spatial Experience and Urban Travels

The relationship between spatial experience and transport users’ attitudes has received limited attention in the literature. However, insights from architectural research suggest that the design of space, particularly in small-scale environments, conveys different social symbols and influences spatial behaviors [40,41]. For large-scale environments, studies have explored the effects of visual design and the presence of vegetation on spatial memory [42]. Furthermore, research has highlighted the connection between road users’ perception of the built environment and their travel motivations. Mirzaei et al. (2018) found that the characteristics of the built environment influenced utilitarian and hedonic walking, with pedestrians’ perceived value impacting their walking behaviors [43]. In the context of SEVs, which share similarities with active transport modes, understanding the hedonic motivations underlying mobility trips is crucial, as they may differ significantly from motivations associated with car driving. Additionally, in terms of travelers’ instrumental attitudes, having better spatial knowledge can support EV users in navigating charging spots and effectively managing battery power by accurately perceiving distances.
Planning a trip involves consulting cognitive maps of large-scale environments to facilitate movement and navigation, leading to trip plans that minimize travel time or utilize shortcuts and alternative routes [1,44]. Previous research has examined the influence of spatial knowledge on various aspects of trip planning, including trip purposes, routes’ complexity, and destination diversity. Spatial knowledge assists in considering route and activity choices, shaping the activity-travel level. Studies on cyclists have indicated the stabilization of spatial learning after multiple trips, which is related to activity patterns and route dynamics [45]. Comparative studies among car drivers, cyclists, and walkers have revealed differences in trip-chaining behaviors and daily activity patterns, highlighting the role of higher mobility and spatial knowledge in enabling individuals to plan and execute complex trips involving multiple destinations [46,47]. However, the specific trip-chaining behavior with SEVs is understudied. Investigating how SEV users engage in trip chaining, considering the sequence and purpose of multiple stops, is crucial for understanding their travel behaviors. Moreover, the trip-chaining behavior is influenced by the residual power of EVs, which imposes constraints on the duration and sequence of stops. Therefore, understanding the interaction between users’ spatial cognition and the constraints posed by EVs in trip chaining is vital for comprehending users’ activity-travel patterns.

2.3. Techniques for Investigating Cognitive Maps

Various methods have been employed to study human spatial knowledge, including traditional approaches such as sketch maps, route descriptions, and distance estimates [48,49]. In the field of cognitive psychology, multidimensional scaling (MDS) and Pathfinder networks have been widely applied to quantify similarity judgements [50,51], with MDS being particularly prevalent for distance or direction judgements [52,53,54].
Previous studies have evaluated the accuracy of MDS-derived maps compared to sketch maps [55,56,57], demonstrating that sketch maps can generate accurate representations of spatial relations similar to MDS in familiar environments. Sketch maps provide a flexible means for respondents to express their unique perspectives and knowledge of specific environments, encompassing landmarks, routes, and points of interest. In contrast, as a technique for generating coordinate spaces from distance data, MDS must assign a set of landmarks (i.e., reference points) to compare the accuracy of MDS-derived maps among individuals. However, as previously discussed, the assigned landmarks could have different social meanings among individuals, potentially influencing map accuracy [24,25]. Considering these points, this study utilizes sketch maps for examining cognitive maps, acknowledging the need for innovative methods to access and analyze them.

Relevant Methods to Analyze Sketch Maps

Lynch’s (1960) key elements have been widely used when studying cognitive maps for structuring large-scale spaces [58,59,60]. Techniques have been developed to aid in accurately representing spatial properties in mental maps and enhancing the recall of spatial layouts [61,62]. Sketch maps can be analyzed qualitatively or quantitatively. A qualitative analysis involves identifying clusters of features or paths, interpreting the meanings of depicted features, and considering context to investigate whether there are shared meanings of symbols among the participants. Recent qualitative research has examined the relationship between socioeconomic status and the scale of sketch maps [63], the effects of transport modes and GPS usage on city images [64], and the utilization of location-based media (LBM) for spatial experience [65]. On the other hand, a quantitative analysis often employs statistical methods to examine spatial patterns and relationships, such as measuring distances between landmarks, calculating the landmark density, or identifying clusters of similar features [66,67,68]. However, a potential limitation arises in terms of the amount of information that respondents intend to present, making quantitative information incomparable between different periods and among individuals.
To address this restriction, this study attempts to enhance the developed quantitative indicators to adapt to the evaluation of sketch maps. Previous research has assessed individuals’ distance and direction knowledge as a means to interpret their spatial ability [69], mainly in small-scale environments. Commonly used indicators include the accuracy of the route distance and absolute angular errors between objects [70,71]. Previous studies have utilized in-person surveys [3] or conducted indoor spatial tasks [71] to access and evaluate spatial knowledge using distance and direction indicators.
The absence of quantitative indicators in understanding individual spatial experiences in large-scale environments represents a significant research gap. This limitation hinders broader applications and impedes the development of knowledge regarding the influence of spatial cognition on travelers’ activity-travel patterns. To address this gap, the present study investigates individual changes in spatial knowledge using a quantitative evaluation of sketch maps depicting respondents’ everyday road environment. By applying the developed quantitative indicators to sketch maps of urban images, this study seeks to examine the role of spatial experience in shaping the attitudes and urban travels of micromobility users, specifically in relation to activity-travel patterns and battery-swapping behaviors. This research seeks to fill a critical void and contribute to a deeper understanding of the interplay between spatial experience, travel behavior, and SEV usage.

3. Materials and Methods

3.1. Research Questions

From the perspective of environmental affordances, individuals with improved spatial knowledge possess a greater understanding of the available environment, enabling them to identify ways to fulfill their needs. Therefore, the research question revolves around whether a deeper understanding of the environment leads to a more satisfying user experience, meeting their expectations and ultimately enhancing their satisfaction with mobility travel. To investigate this, the study aims to address the following questions:
(1)
To what extent does spatial experience enhance spatial knowledge?
(2)
To what extent does an improved spatial knowledge of distance and direction correlate with increased travel satisfaction?
(3)
To what extent does an improved spatial knowledge of distance and direction correlate with efficient battery-swapping behaviors and complex travel patterns?
Figure 1 depicts the conceptual framework of this study. Prior to engaging with a new mobility service, users possess existing knowledge of the road space and urban environment. Both spatial knowledge and travel activity patterns are expected to change throughout their spatial and temporal mobility experiences.

3.2. Analytical Framework

Figure 2 presents an overview of the analytical framework employed in this study, addressing specific research questions. The study employed a mixed-methods approach, incorporating spatial knowledge analysis, user attitude exploration, and travel pattern analysis within the context of a new mobility service. Data were sourced from three main channels: sketch maps for spatial knowledge investigation, questionnaire surveys for user attitude exploration, and vehicle tracking data for travel pattern analysis, with a particular focus on mobility users’ trip-chaining behaviors.
To address the first research question, an evaluation method was developed to quantify road users’ spatial knowledge by measuring their accuracy in perceiving relative distance and direction between landmarks. Changes in users’ sketch maps before and after participating in the pilot service were analyzed. Spatial learning in this study encompassed considerations of on-road experiences prior to the pilot project, travel distance, number of trips, and the diverse trip-chaining behaviors during mobility travels within the pilot project.
To tackle the second research question, a correlation analysis was initially applied to explore the relationships between user expectations, satisfaction with the electric mobility system, and users’ levels of spatial knowledge. Additionally, a two-way ANOVA was employed to compare group performance and investigate the interaction effect between cognitive distance and cognitive direction on user attitudes.
To address the third research question, an initial correlation analysis was used to examine the relationship between spatial knowledge and travel patterns, utilizing indicators such as the total number of trip chains, travel distances, number of battery swaps, and residual power. Trip-chaining behaviors were further analyzed, defining a trip chain as a sequence of trips starting and ending at home. A principal component analysis (PCA) and cluster analysis were employed to extract meaningful insights from the complex dataset. In particular, a cluster analysis was conducted using a finite mixture model [72], a robust statistical framework that determines the number of clusters and their validity [73].
Drawing upon the insights garnered from the analyses of correlation, a two-way ANOVA, and travel patterns, a comprehensive analysis was undertaken using structural equation modeling (SEM). The purpose of this analysis was to investigate the direct and indirect effects of cognitive direction and cognitive distance on user attitudes and behaviors pertaining to service adoption. SEM allows for the examination of intricate relationships and provides evidence beyond what a simple correlation analysis can offer, thereby contributing additional insights into all three research questions.
Statistical analyses employed standardized values to account for measurement scale differences. Levene’s test [74] was performed to assess the homogeneity of variances, ensuring data suitability for further analysis. Statistical analyses were conducted using SPSS version 25.0.0.2 and R version 4.0.3 (R Foundation, Vienna, Austria). Section 3.3 provides further details on the data collection method, while Section 3.4, Section 3.5 and Section 3.6 elaborate on the specific methods employed for the three data sources.

3.3. Data Collection

3.3.1. Study Site and Context

Osaka Prefecture, located on the main island of Japan, has a population of approximately 8790 thousand (as of 1 August 2022) and covers an area of 1905 square kilometers. It serves as the central hub of the Keihanshin metropolitan area, the second most populated urban region in Japan after Greater Tokyo. The public transportation system in Osaka Prefecture is extensive, comprising an advanced urban rail network, buses, monorails, and trams. In terms of modal share, public transportation accounts for 26.3% (24.2% railways, 2.1% buses), while motor vehicles make up 26.9% (23.5% cars, 3.4% powered two-wheelers). Walking and cycling are more prevalent in Osaka compared to many other cities, with cycling at 22.5% and walking at 23.9% [75].
The “e-Yan Osaka” pilot project aimed to demonstrate how BSET could transform urban transportation by addressing concerns related to EV range, charge time, and recharging infrastructure. The project was a collaboration between the Japan Automobile Manufacturers Association, four leading Japanese motorcycle companies, Osaka Prefecture, and Osaka University. The pilot project consisted of 6 phases, each lasting 3 months, and ran from 27 September 2020 until the end of March 2022. The authors, as core members of the project, were responsible for the data collection, analysis, and evaluation.
The pilot service was designed as a community-based mobility system. Electric two-wheelers were provided to Osaka University students with shared batteries set up on the 2 university campuses and at 10 convenience stores. Participants were able to swap batteries free of charge at the 12 designated locations. The service area primarily covered 7 cities in the Hokusetsu region, located on the northern edge of Osaka Prefecture. This region is characterized by hilly terrain and has a relatively lower public transportation modal share of 23.4%, with cycling accounting for 20.6% and walking for 26.5% [76]. The higher modal share for powered two-wheelers (4.5%) indicates a relatively higher awareness of such mobility.

3.3.2. Participants

The pilot project was conducted over a long period, divided into six phases with new participants recruited for each phase. A total of 53 participants joined from early July 2021 to the end of March 2022. Data collection included pre- and postsurveys, as well as vehicle tracking. The pre- and postsurveys consisted of online questionnaires to assess user attitudes and sketch map surveys using A3 map sheets. The questionnaires were sent to participants via university emails, while the map sheets were handed in person. The surveys were conducted on the first and final days of each phase. For the participants who participated in several phases, only data from the initial phase were used for the analysis to prevent biases.
Pretest surveys and interviews were conducted twice to assess the validity of the questionnaires and to ensure that participants correctly understood the survey items and map instructions. None of the participants had prior experience riding BSET before joining the pilot project, as it was the first system of its kind in Japan. Online seminars were held to introduce the purposes of the pilot project, show how to use the battery swapping system, and explain the data collection process. The valid sample size for analysis and discussion was 41 participants. Despite the limited sample size, a mixed-methods approach, along with multiple data sources, was employed to provide deeper insights.
Table 1 summarizes the participant profiles, indicating that 34.1% held a driving license for two-wheelers, while others obtained a car license for moped riding permission. A significant portion of participants had limited riding experience, with 29.3% having no experience and 31.7% riding less than once a month. Mandatory training for safe riding was provided to all participants before using the vehicles.

3.4. Sketch Map Survey

3.4.1. Survey Design

The map sheet was a white landscape A3 paper with the following instructions:
Suppose a friend asks you about the ways from your home to the station you often use and the university campus you belong to. Please draw the following (1) and (2) paths on one map. Please read carefully and follow instructions (i) to (iv).
(1)
The road from your home to the station you use most (either a railway or monorail station).
(2)
The road to the university campus, assuming you are heading from your home by a motorcycle or a car.
(i)
Please draw without looking at a map such as Google Maps.
(ii)
Please mark (you may draw or write) the intersections and landmarks (e.g., buildings and facilities) on the route as much as possible.
(iii)
It is recommended that you first fill in the origin (i.e., your home) and destinations (i.e., the campus and station) so that they can fit within the paper sheet.
(iv)
The response time is about 25 min.
To aid respondents in understanding the instructions, an example of a painted map was provided on the map sheet (Figure 3). To ensure comparability, the instructions on the map sheets remained consistent in both the pre- and postsurveys.

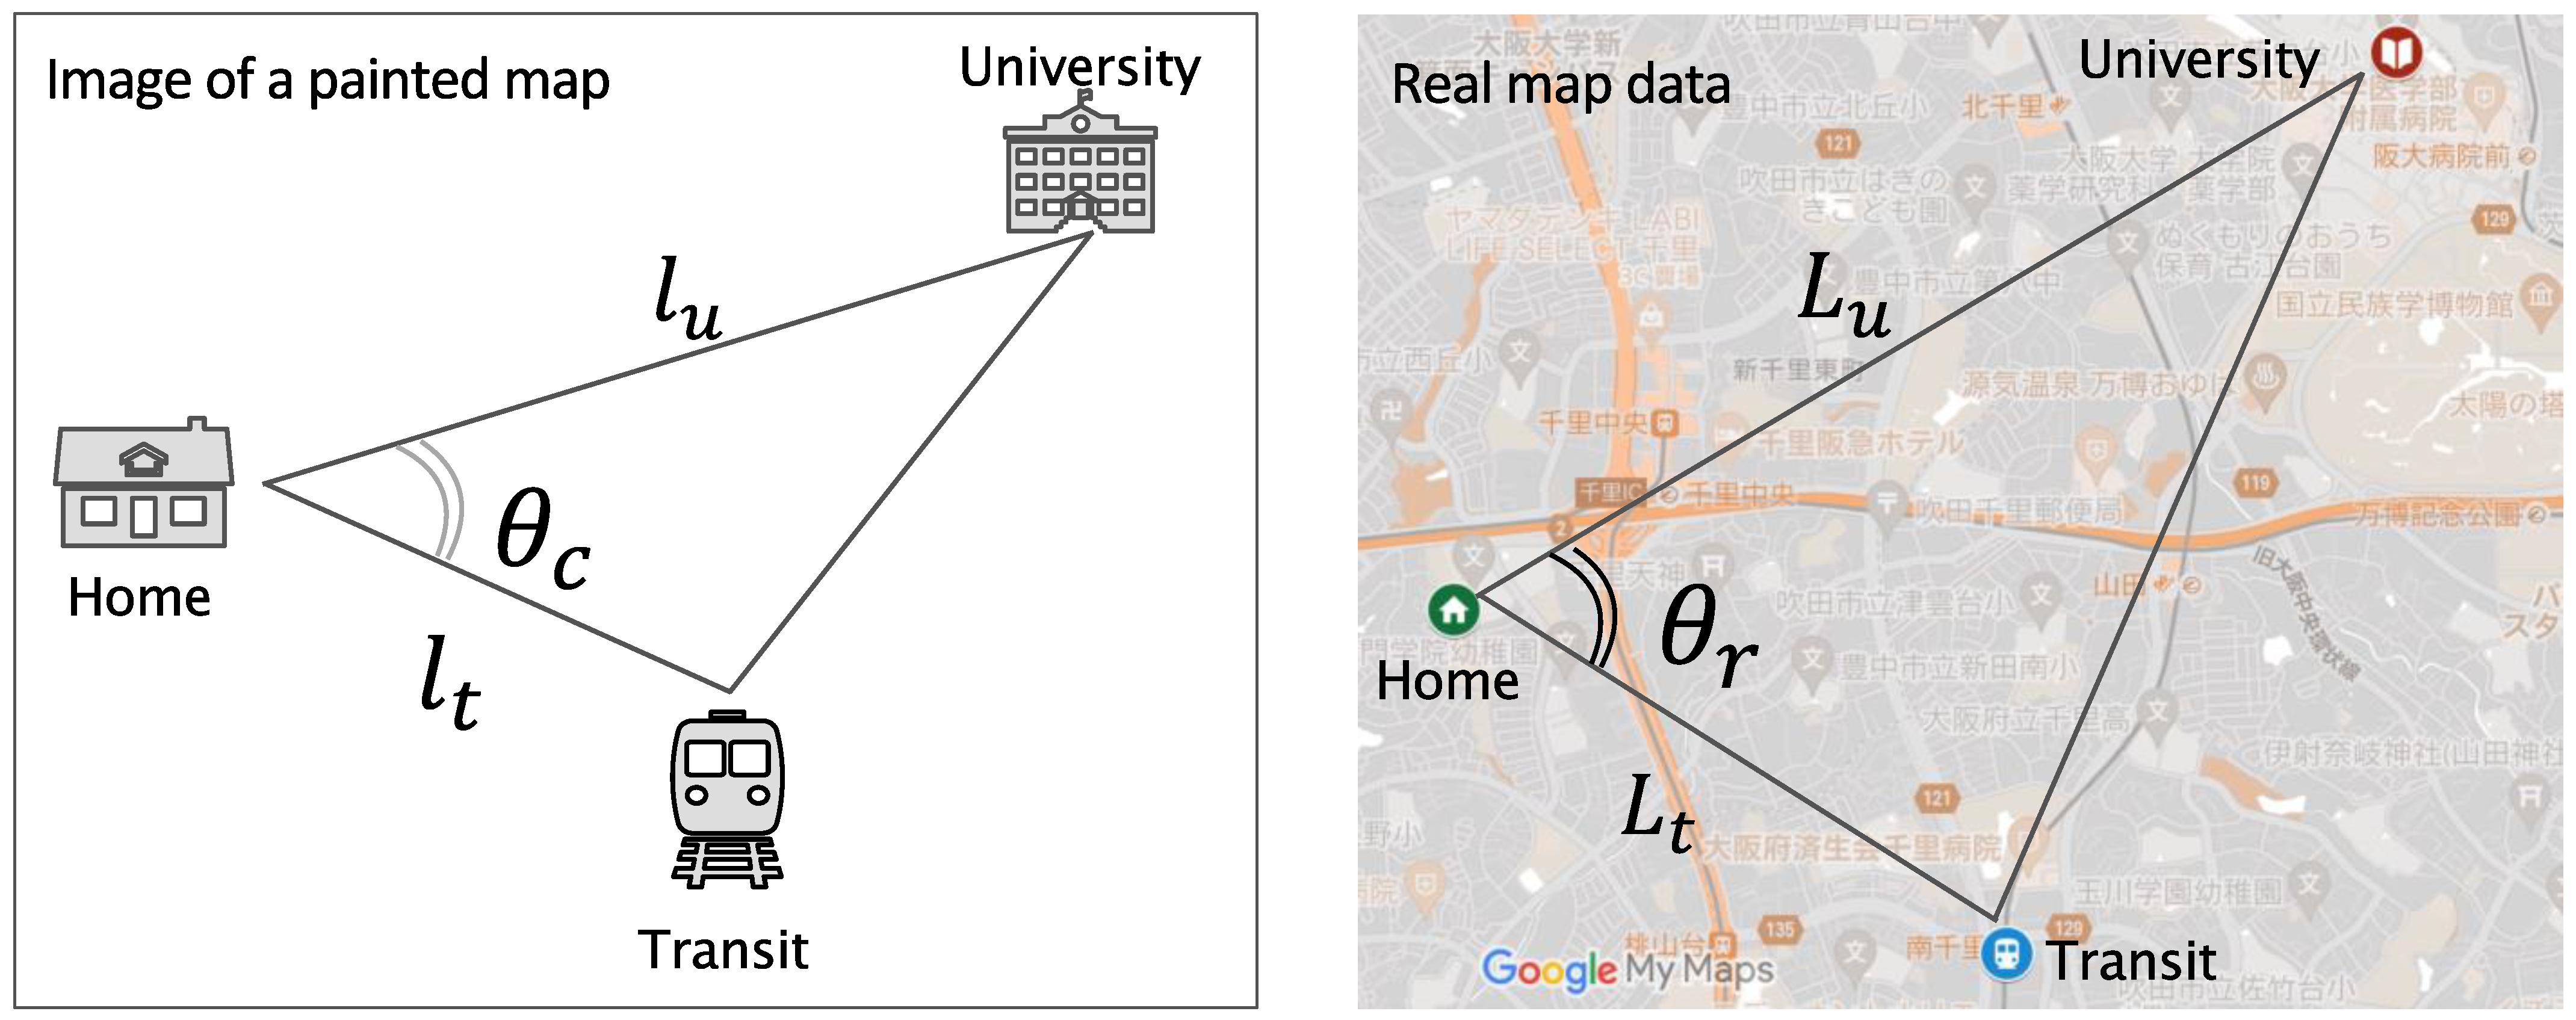
3.4.2. Evaluation of Sketch Maps

To objectively quantify road users’ sense of distance and direction, the key step is to set common landmarks for individuals to draw their map. This study adopted the anchor-point theory [37] and designated the home and work locations (i.e., the university campus in this study) as reference points in the sketch maps. To start the illustration of the map data analysis, Figure 4 presents the painted map images and corresponding real map data.
Setting the home, university, and transit station as the common reference points, the accuracy of cognitive distance ( ρ d i s t ) was presented as:
ρ d i s t = 1 ( l u / l t L u / L t ) L u / L t
where L u is the actual linear distance between a respondent’s home and the university, while L t is the linear distance from home to the transit station. The variables l u and l t present the length of lines that link home–university and home–transit, respectively, and are measured from a drawn map. The l u / l t ratio indicates the relative cognitive distance presented in the respondents’ sketch maps.
Next, the accuracy of cognitive direction ( θ d i r ) was evaluated based on angular error, which expresses the difference between the cognitive and actual relative directions among set reference points.
θ d i r = 1 θ c θ r θ r . θ r 180 = 1 θ c θ r 180 ,
Here, θ r was set up as the angle (in degrees) between the two intersecting lines, which linked the respondent’s home to the university and home to the transit station. The data were based on Google Maps. θ c presents the painted angle on a sketch map. A correction factor θ r / 180 multiplied by the angular error ratio was applied to correct the systematic errors caused by a small value of θ r . Thereby, the accuracy of the cognitive direction described the correctness of the painted interior angle. The division by 180 normalized the angular error and scaled it proportionally to the reference angle. Considering that the maximum value of the angle between the three reference points (campus–home–transit) was 180 degrees, this normalization reflected the accuracy of the cognitive direction relative to the actual direction. The quantified measures enabled a comparison between participants’ changes in spatial abilities, as well as a further analysis of the relationships among user attitudes and travel patterns.

3.5. Questionnaire Surveys

The surveys were conducted in Japanese, using everyday language to ensure clarity and avoid ambiguity. Rating scales, either 4-point Likert scales or 5-point Likert scales, were employed to measure the questions. Constructs capturing different aspects of user values were defined based on the concept of value creation in marketing [77]. Functional/instrumental value assessed the extent to which the new mobility fulfilled travelers’ desired goals, such as travel efficiency. Experiential/hedonic value focused on the creation of positive emotional experiences, such as increased interest and pleasure when driving.
The presurvey investigated participants’ motivations for joining the BSET pilot project. It consisted of 8 questions, including functional/instrumental (4 items) and experiential/hedonic (4 items) motivations. The rating scale statements corresponded to the item descriptions. For example, the questions asked functional/instrumental motivations by “In terms of convenience and comfort for battery-swappable two-wheelers, please select the option for each question that best applies to your expectations”. The items typically used phrases like “Through riding E2W, I can…” (1 = “no expect” to 4 = “strongly expect”). On the other hand, the experiential/hedonic motivations were asked as follows: “Please tell us your motivations for participating in this experiment. Select the option most closely matches your thoughts in the following questions”. The item descriptions were typically set as “I join in this experiment because it offers me opportunities to…” (1 = “disagree” to 4 = “strongly agree”).
The postquestionnaire had two parts. The first part evaluated users’ functional/instrumental and experiential/hedonic satisfaction, incorporating corresponding items from the prequestionnaire. The second part assessed satisfaction with the BSET (4 items), lifestyle changes (3 items), and concerns about road safety (1 item) and battery charging issues (1 item). Detailed item descriptions and measurements are provided in Section 4.2.1 descriptive statistics.

3.6. Vehicle Tracking Data

GPS trackers were installed in each vehicle to track participants’ routes and record their positions. A dataset was generated, including information on origin and destination locations, travel time, travel distance, residual power, and battery identification numbers for each trip. The descriptive statistics in Table 2 provide an overview of these features across individuals. To capture the diverse activity-travel patterns, this study analyzed users’ trip-chaining behaviors. A total of 2422 trip chains were generated from 40 participants, with an average of 62 home-to-home trip chains per participant over a 3-month period. The total travel distance amounted to 800.20 km, and the maximum number of trip chains by a single user was 361, indicating more than 4 home-to-home journeys per day. The average travel distance per trip chain was 12.91 km. Participants swapped batteries an average of 22 times, with a residual power of approximately 47%. The range of residual power (from 22.7% to 77.3%) indicated variations in swapping behaviors and charging concerns among EV users.

Analysis of Trip-Chaining Behaviors

Trip-chaining behaviors were investigated, defining a trip chain as a sequence of trips that start and end at home. Eleven estimated indicators, derived from the geometric and temporal information of each trip, were generated. These indicators were adapted from Ohba and Kishimoto [78]. To illustrate the indicators, Figure 5 presents a convex hull formed by a home-to-home trip chain. (1) The number of vertices within the convex hull indicates the number of destinations, while (2) the area represents the range of travel. Additionally, (3) the total travel distance of a chain is determined by summing the travel distances of each trip.
The straight distance from home to the stop with the longest stay is defined as (4) the distance to the main destination. As shown in Figure 6, (5) the width based on the main destination, represented by the cross line with the largest length from the straight line connecting home and the main destination, indicates the degree of freedom for stopovers. Similarly, using the indicator of (6) distance to the farthest destination, we can obtain the width based on the farthest destination, which reflects the extended range of activity patterns.
Furthermore, we calculated (8) the ratio of the width to the distance of the main destination and (9) the ratio of the width to the distance of the farthest destination. These ratios illustrate the “slenderness” of trip chaining. A small ratio suggests that the locations of stops are likely to be close to the routes from home to the main/farthest destination, indicating a tendency to travel along the same axis and lower freedom of movement. Conversely, a larger ratio indicates a higher tendency to travel across the city. In addition to spatial indicators, the remaining indicators captured the temporal features of a trip chain, including (10) the staying duration at the main destination and (11) the subdestination.

4. Results

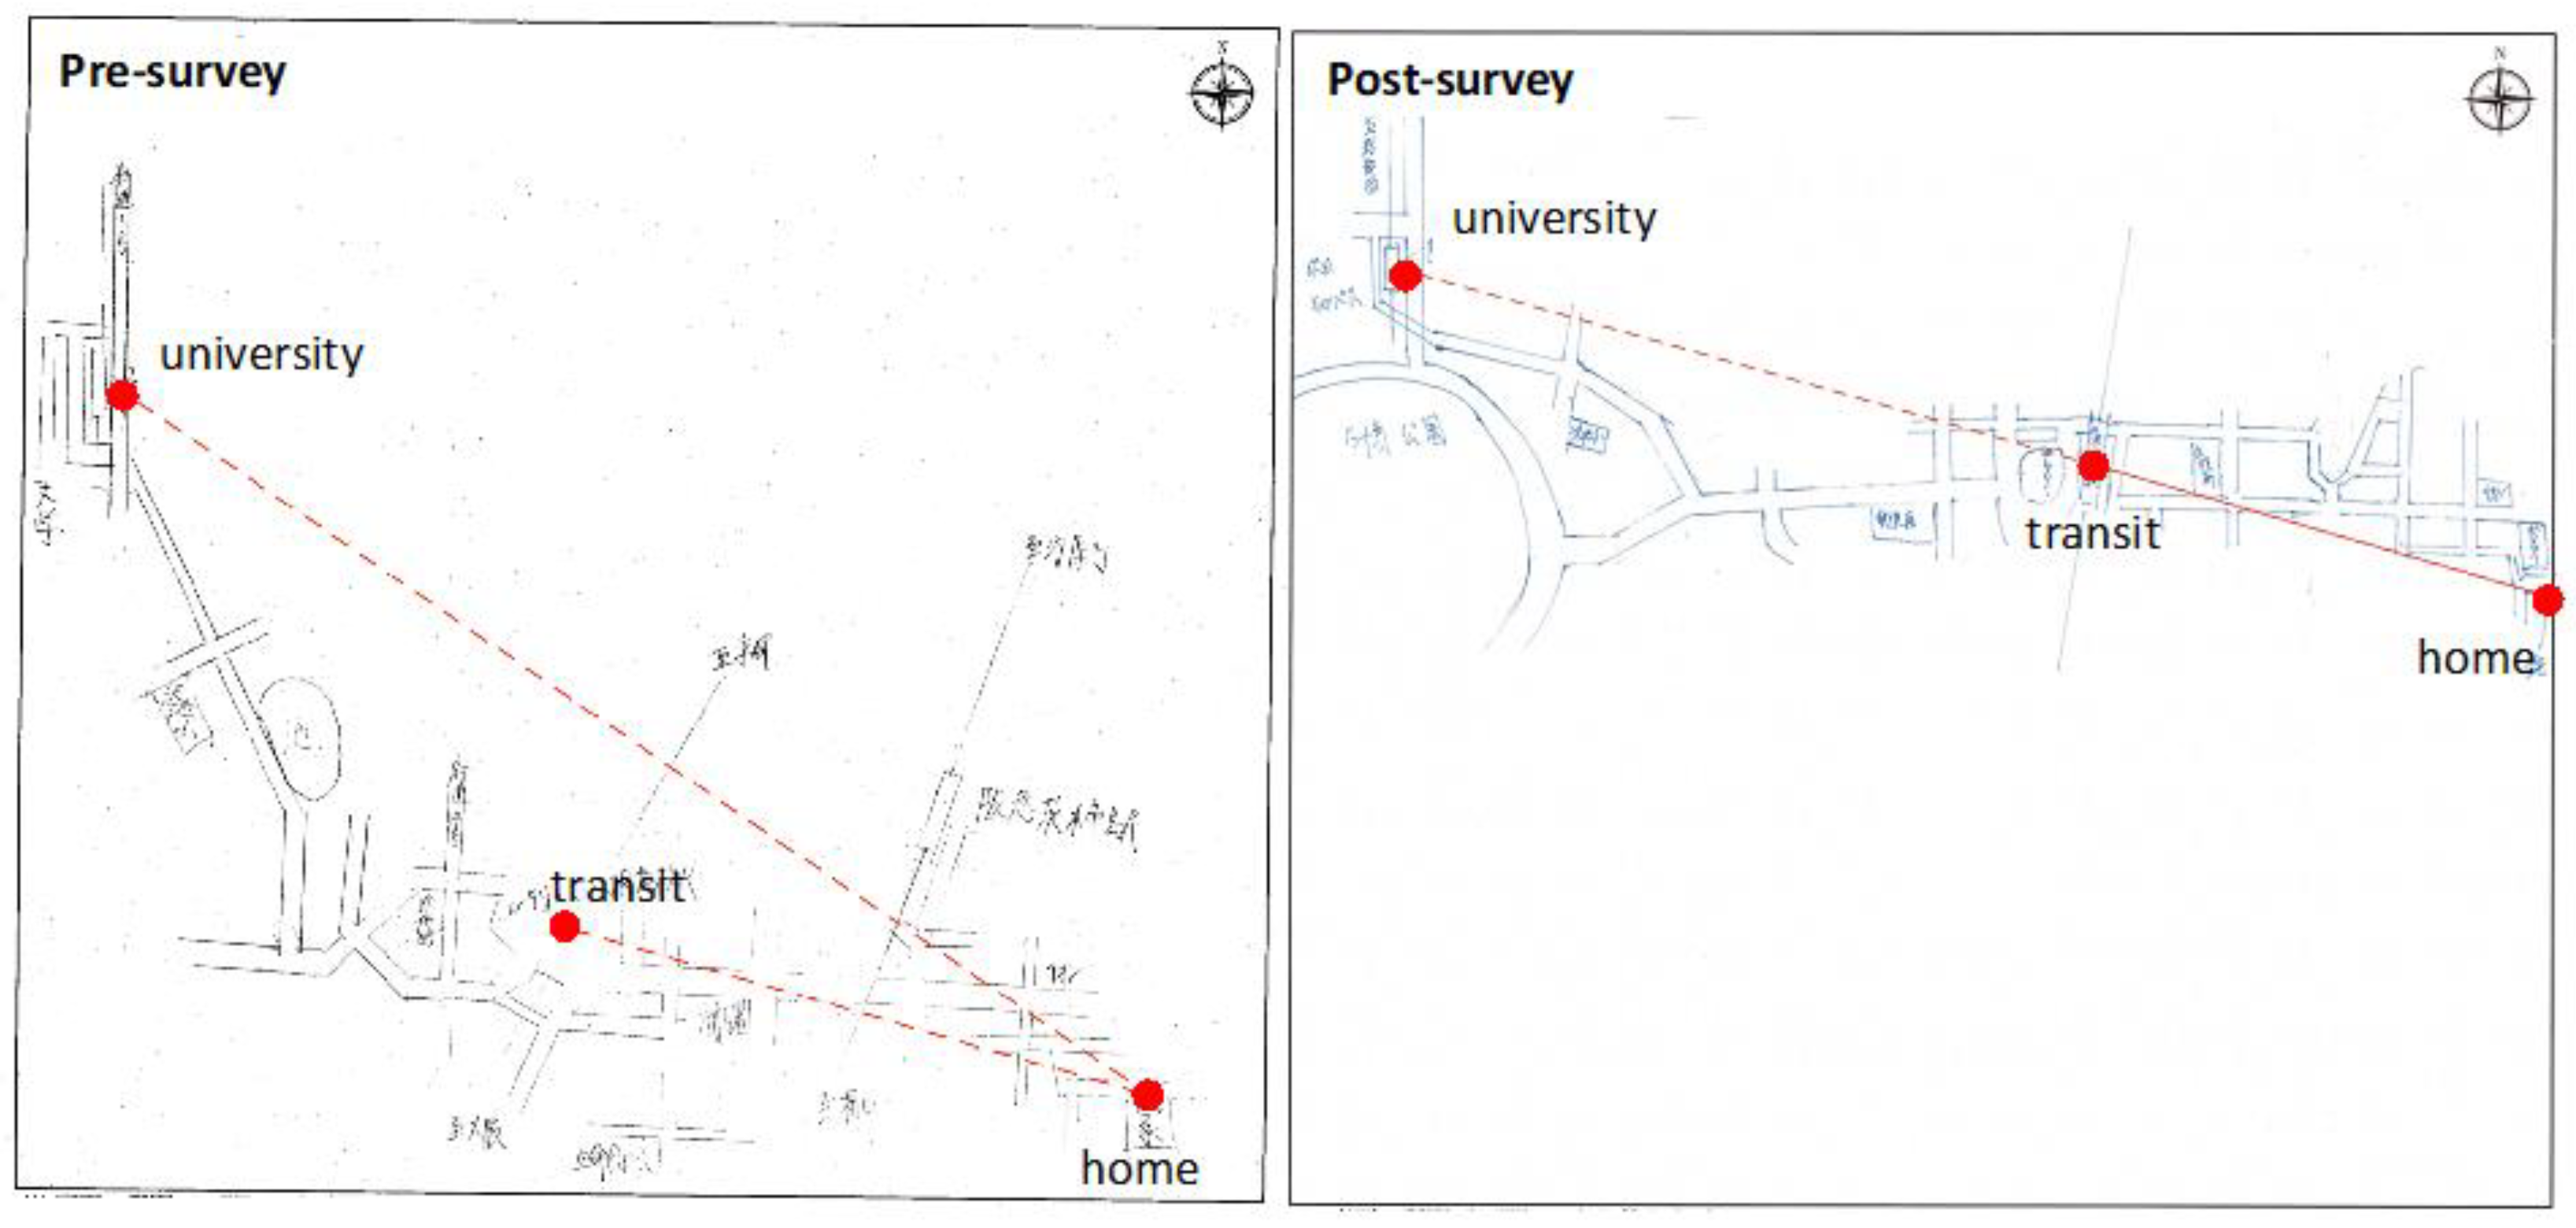
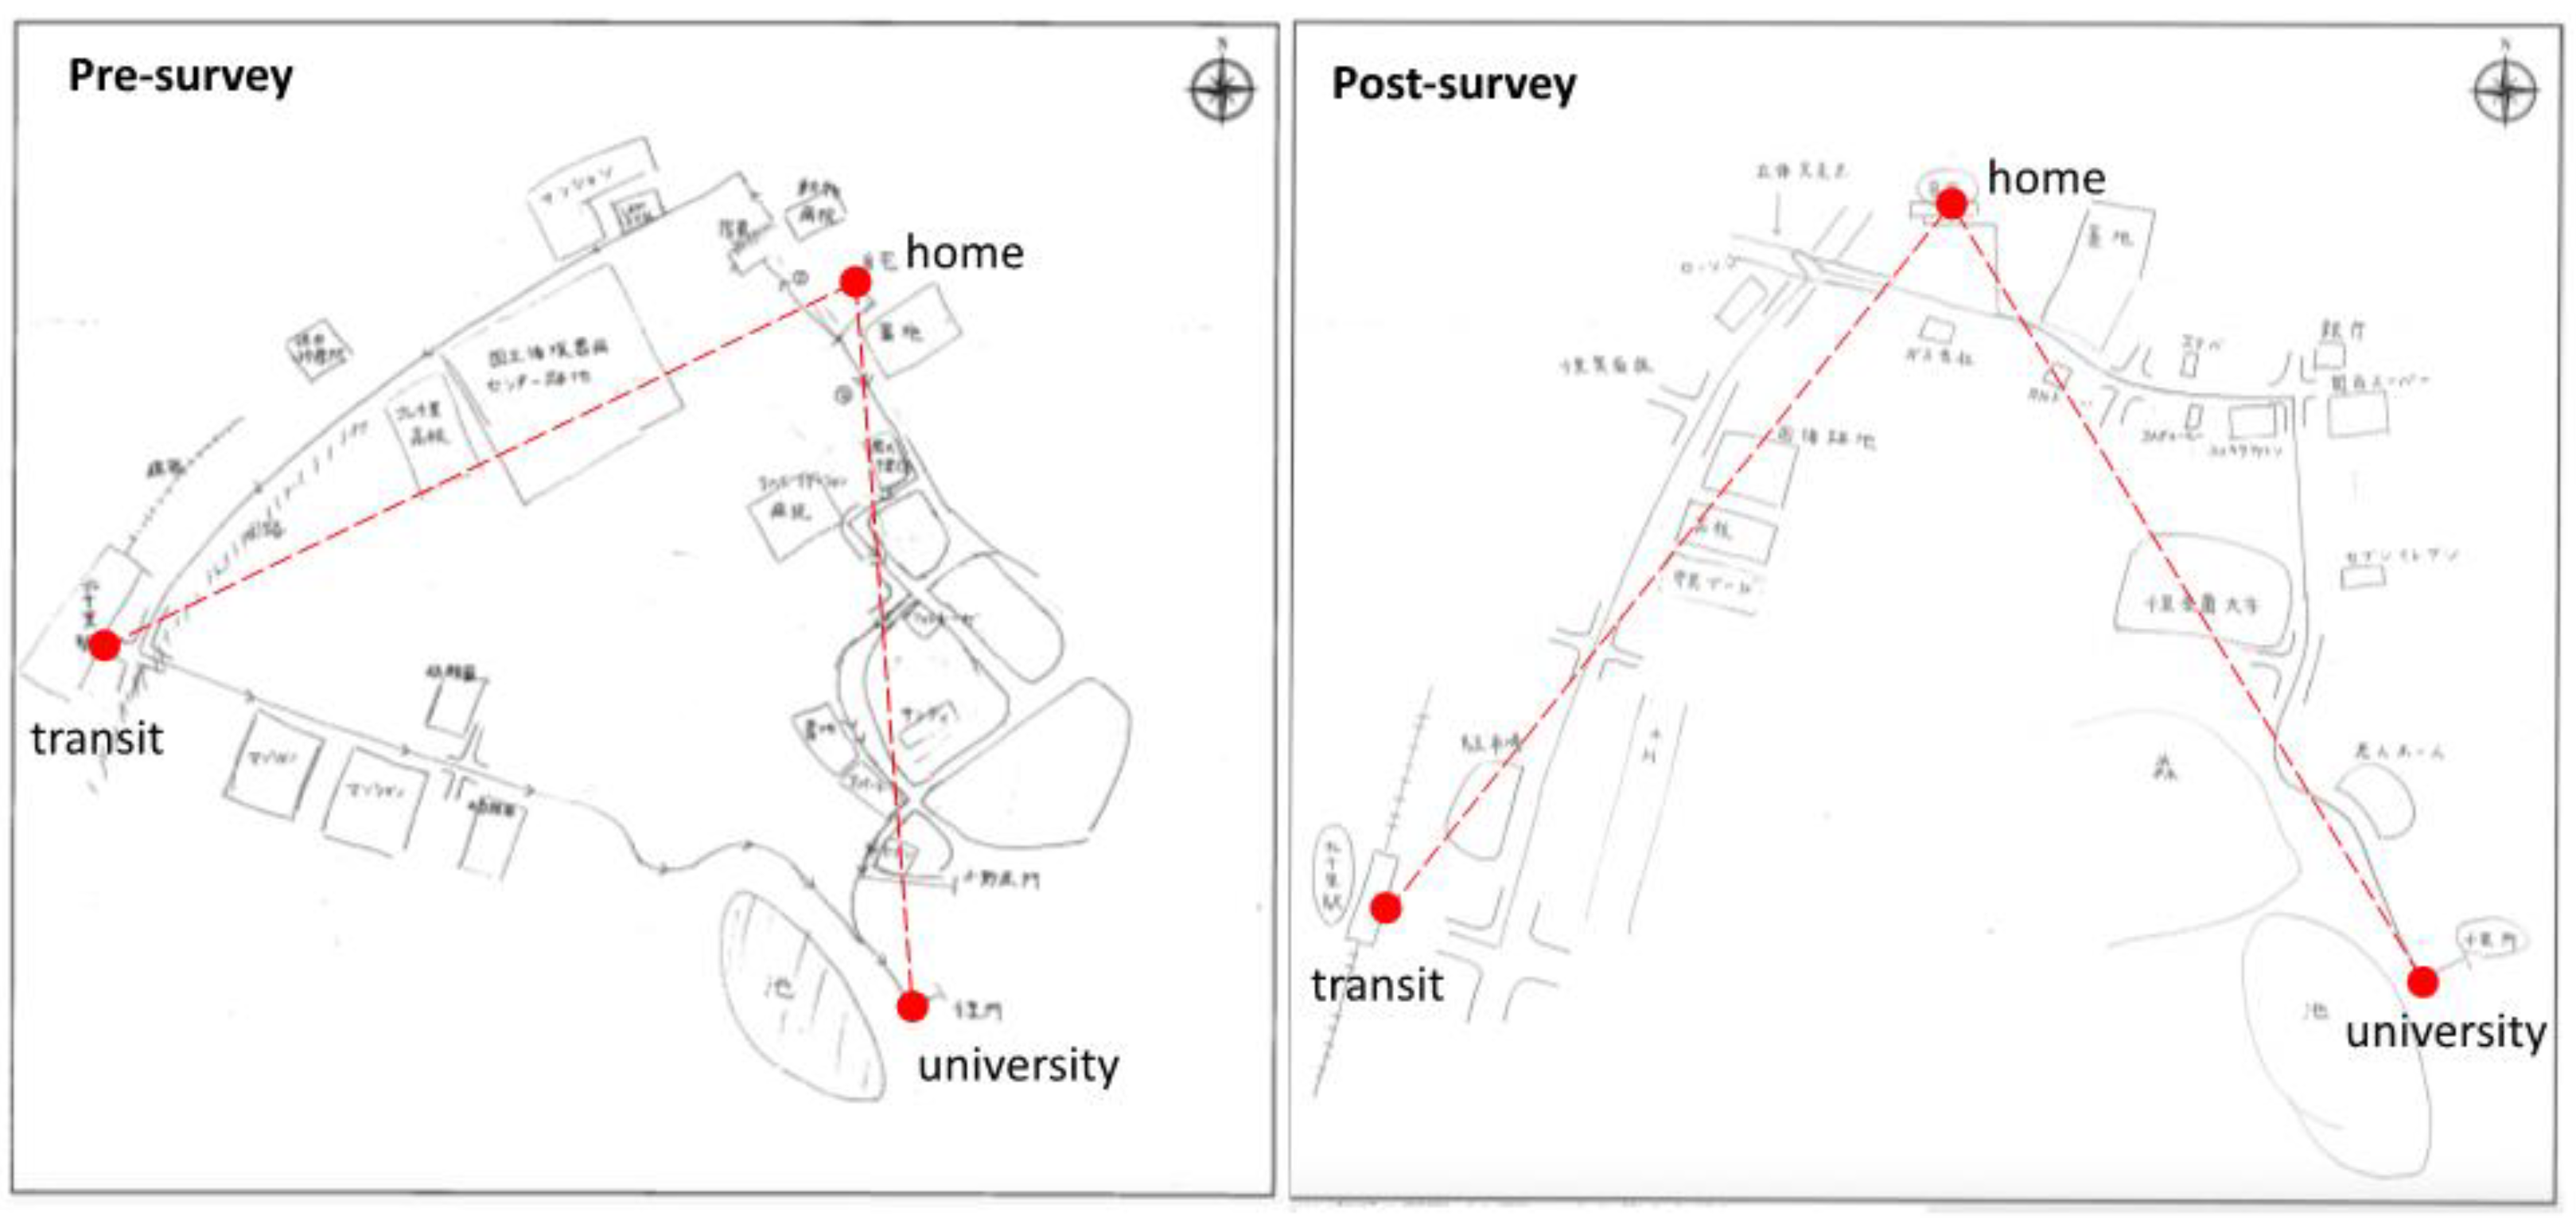
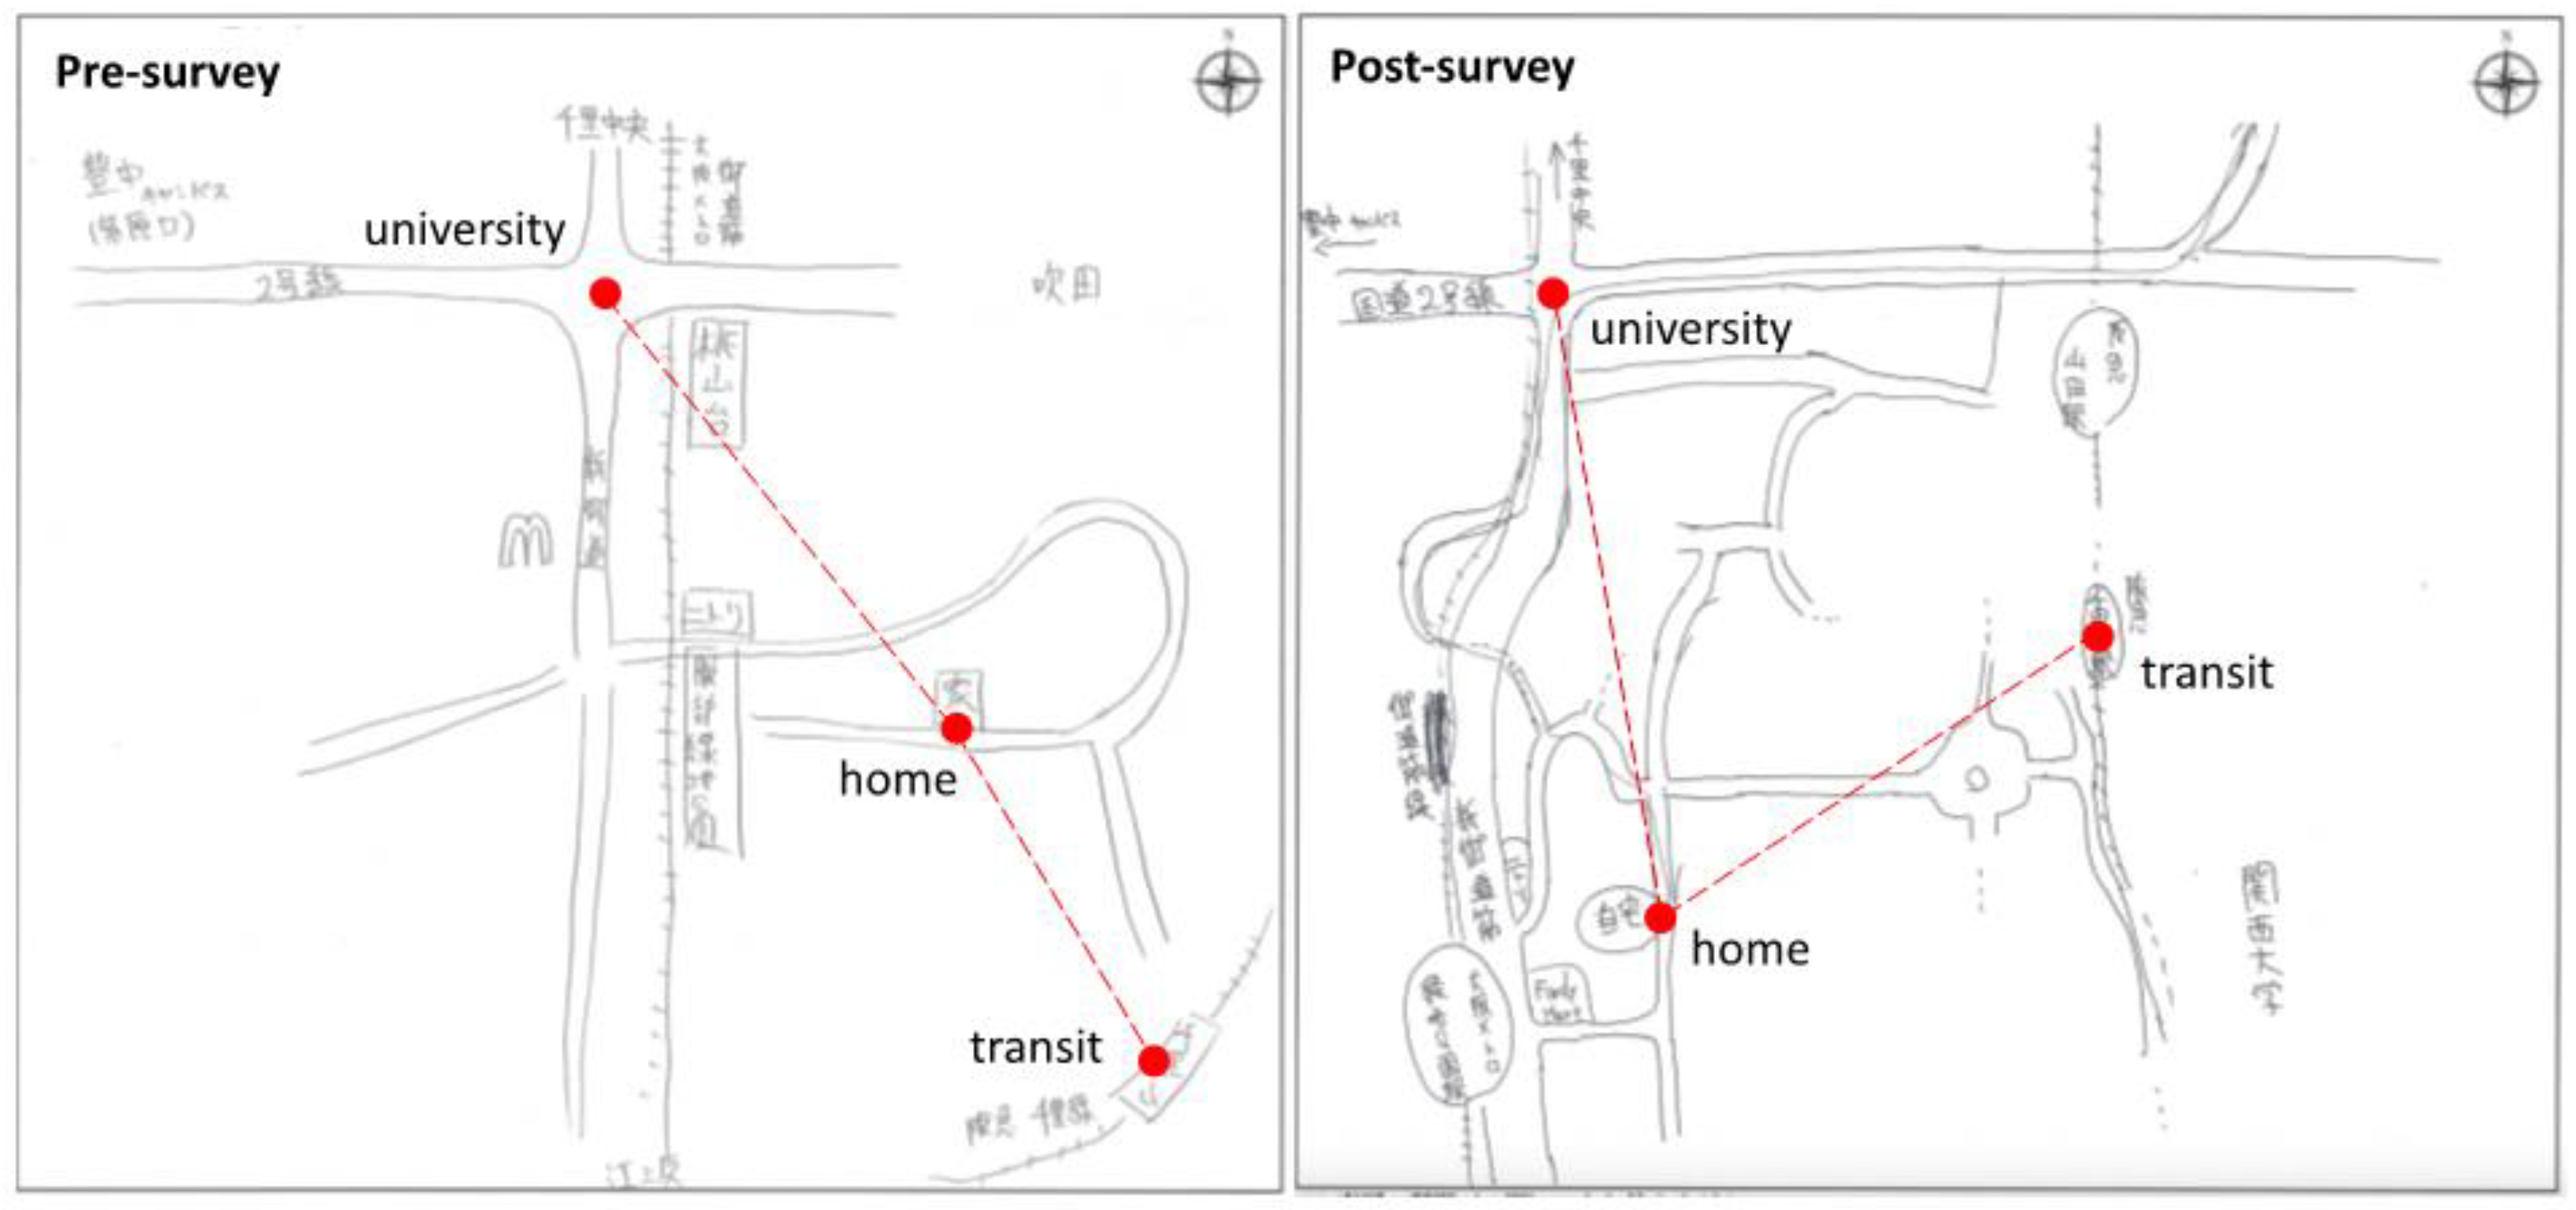
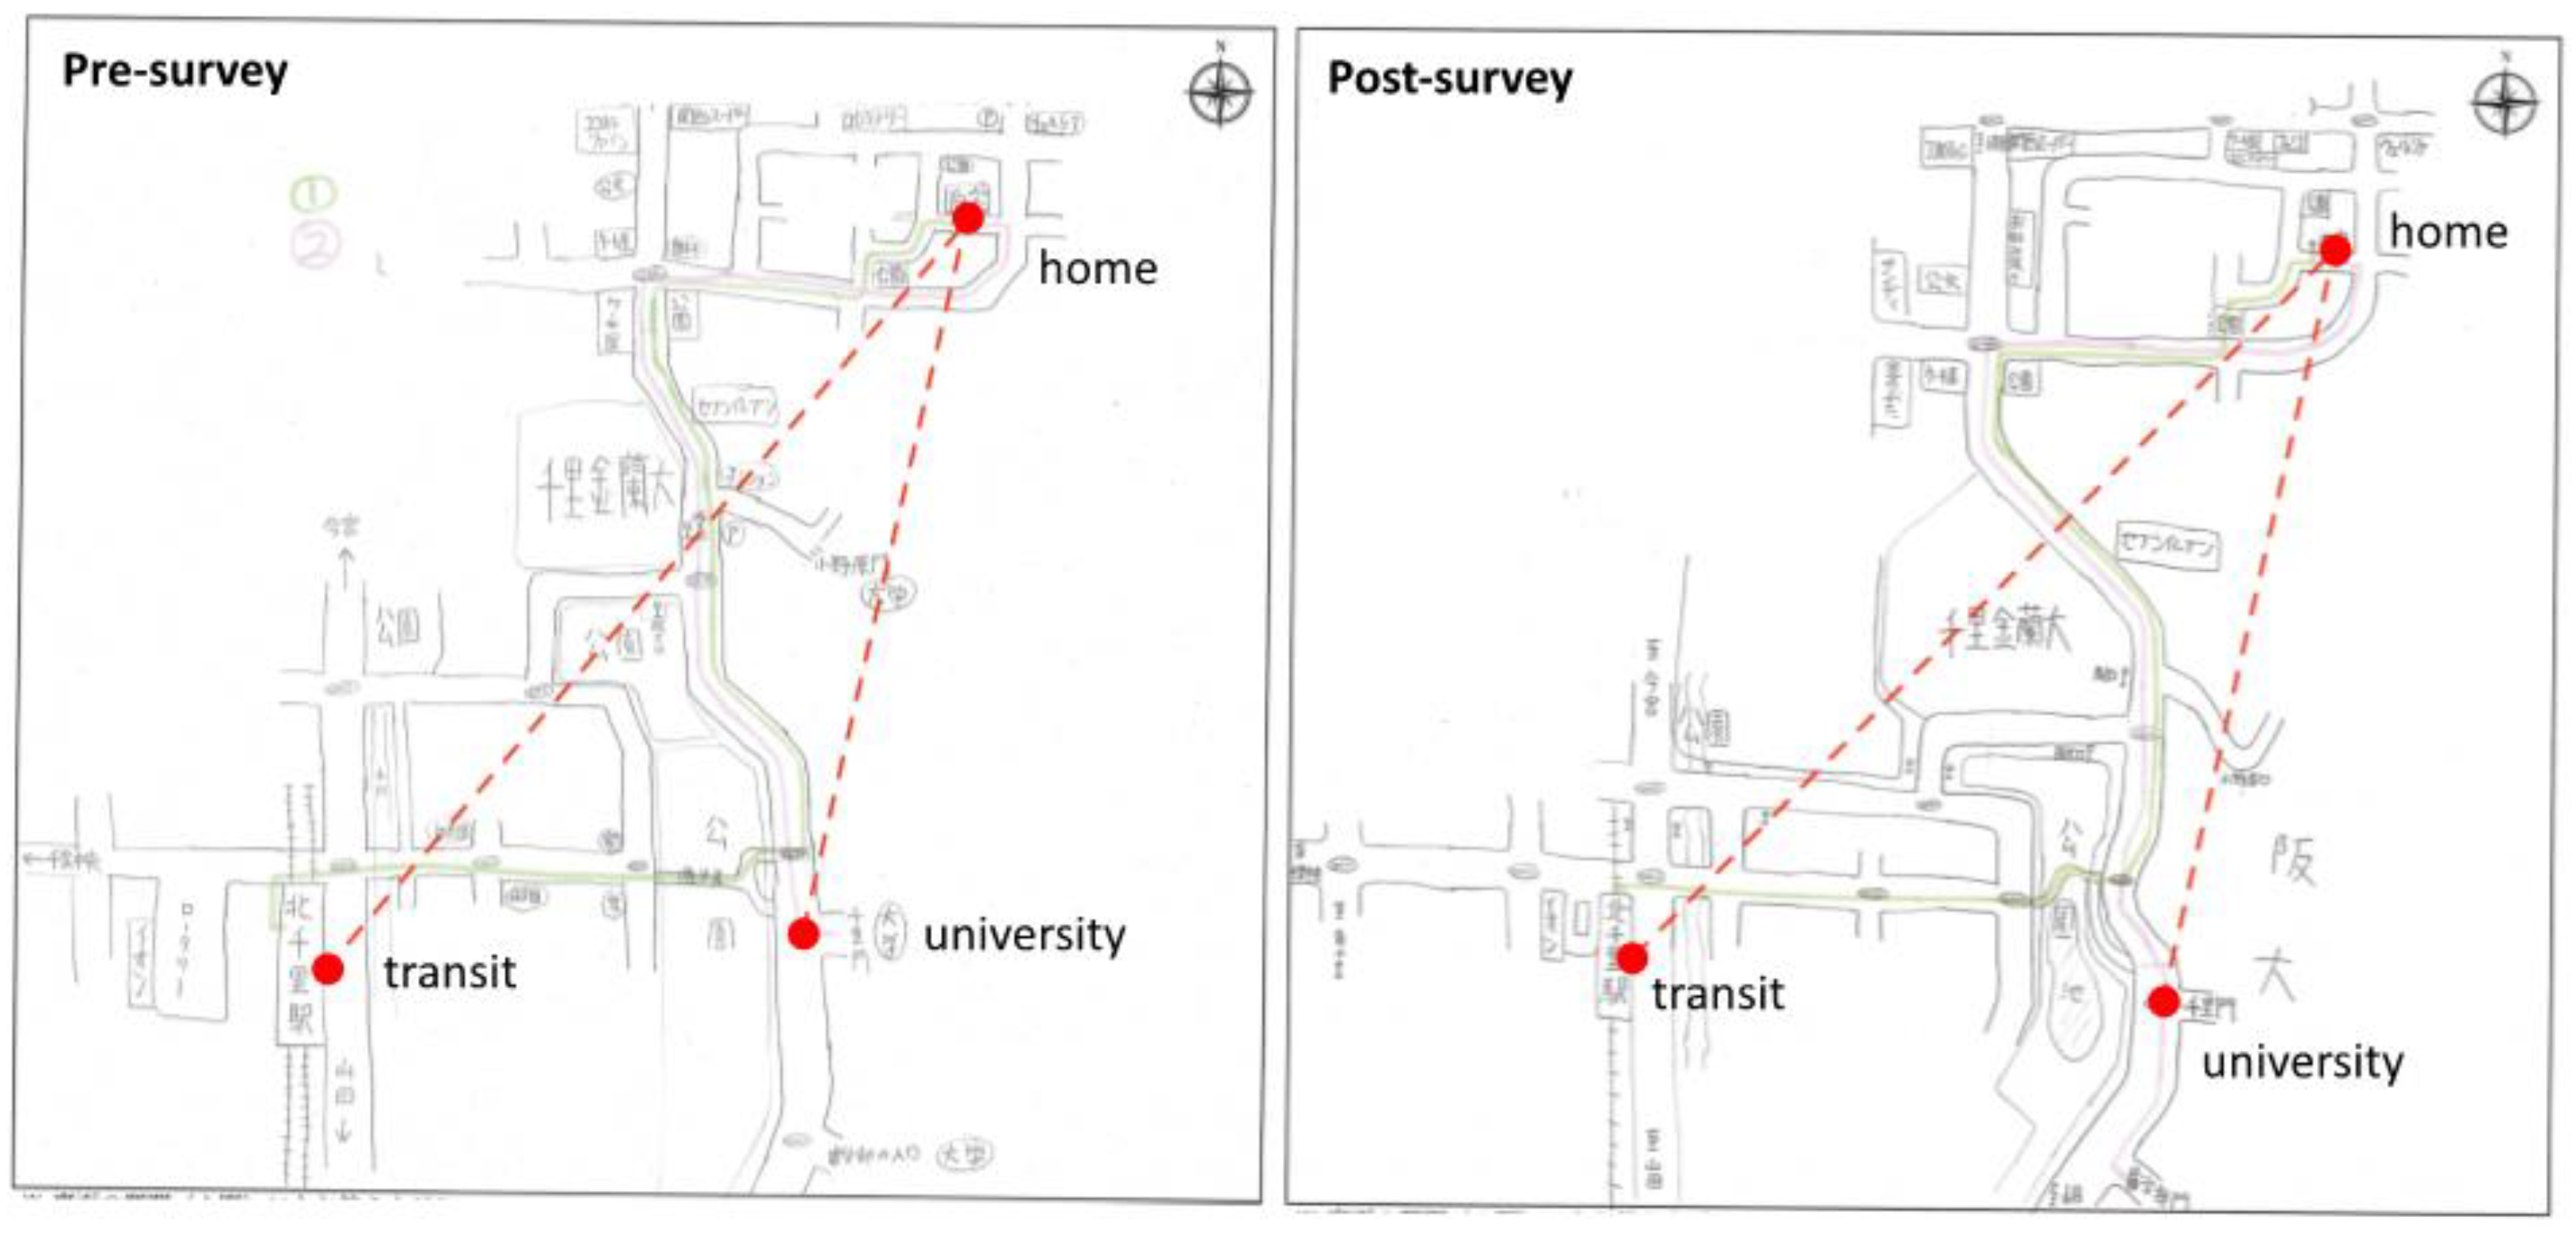
4.1. Changes in Sketch Maps

Figure 7, Figure 8, Figure 9 and Figure 10 provides examples of pre- and post-sketch-maps, illustrating the designed measures with auxiliary lines connecting the reference points (i.e., home, university, and transit). The examples compare the pre- and postmaps, while the designed measures evaluate the accuracy of the drawn maps compared to the actual map data according to the cognitive distance and direction. Specific spatial information in the examples was blurred to prevent privacy concerns, including the exact location of respondents’ homes.
The examples show participants with different trends of changes concerning distance and direction knowledge. Figure 7 demonstrates improvements in both aspects, with a presurvey accuracy of cognitive distance of ρ d i s t = 0.751 and cognitive direction of θ d i r = 0.894, which increased to ρ d i s t = 0.921 and θ d i r = 1.000 in the postsurvey. In Figure 8, there is an improvement in cognitive distance (pre- ρ d i s t = 0.699 , post- ρ d i s t = 0.847 ), while cognitive direction remains almost unchanged (pre- θ d i r = 0.750 , post- θ d i r = 0.739 ). In contrast, Figure 9 shows no improvement in cognitive distance (pre- ρ d i s t = 0.190 , post- ρ d i s t = 0.166 ) but a noticeable change in direction (pre- θ d i r = 0.371 , post- θ d i r = 0.961 ). There were also some participants showing no improvement in either cognitive distance or direction (see an example in Figure 10). However, it is worth noting that these participants had excellent prior performance in cognitive direction (pre- ρ d i s t = 0.717 , post- ρ d i s t = 0.643 ; pre- θ d i r = 1.000 , post- θ d i r = 0.983 ).
These given examples highlight four different trends of changes based on the combination of “improve in cognitive distance or not” and “improve in cognitive direction or not”. The subsequent sections focus on the different interaction effects of these two indicators.
Table 3 present the results of Spearman correlations between variables obtained from sketch maps. Significant positive correlations were found between the pre- and postsurvey results, indicating consistent performance among respondents. However, there were no significant relationships between a respondent’s level of spatial ability in perceiving distance and direction.
Participants who lived farther from the university or transit drew maps with smaller scales. To examine whether spatial knowledge varied among users drawing different map scales, Spearman correlations were conducted. The results, shown in Table 3, revealed insights into the spatial distribution of participants’ homes, transits, and the university, as indicated by the linear distances in reality (measured in meters). The maximum distance from the participants’ home to university was about 10 km, while the nearest one was just 50 m. The average distance between home to transit was 925.2 m, with a maximum value of 2740 m. The significant negative relationships showed that participants who lived farther from the university tended to draw maps with smaller scales, resulting in a lower accuracy in perceiving relative distances. Conversely, there were significant positive relationships between the accuracy of relative distances and the distance from home to transit.

Spatial Knowledge and On-Road Experience

Tests were conducted to examine whether there were group differences based on socio-demographic factors prior to participating in the project. Specifically, the study investigated whether the level of spatial knowledge varied depending on participants’ prior on-road experiences. An independent sample t-test was conducted between participants who drove cars more than once a month (n = 24) and participants with no or infrequent driving experience (n = 17). While the results did not reach statistical significance, there was a noticeable trend for group differences, as depicted in Figure 11. In the presurvey, the group with more on-road experience exhibited a higher accuracy in both cognitive distance ( t 39 = 1.149 , p = 0.257 )   and cognitive direction ( t 39 = 1.886 , p = 0.067 ). In the postsurvey, both groups showed an increase in cognitive distance accuracy, with the group having more on-road experience showing better performance. The t-test results for the accuracy of cognitive distance were t 39 = 0.667 , p = 0.508 and for the accuracy of cognitive direction were t 39 = 1.588 , p = 0.120 .

4.2. Relationships between User Attitudes and Spatial Knowledge

4.2.1. Descriptive Statistics

Table 4 presents the descriptive statistics, including mean and standard deviation for the items regarding user motivations. Table 5 presents the results for postsurvey items regarding users’ satisfaction, lifestyle changes, and concerns.

4.2.2. Correlations between Presurvey Items and Spatial Knowledge

Table 6 presents the Spearman correlations for each item in the prequestionnaire. The results indicated significant relationships between users’ functional/instrumental motivations and their prior spatial knowledge. Participants with a higher accuracy in cognitive distance exhibited higher expectations of traveling over a larger area (IM2: r = 0.316 , p < 0.05 ). Furthermore, a correlation analysis was conducted to investigate whether users’ prior attitudes influenced their perception of the environment, as reflected in the postmaps. The analysis revealed significant relationships between the accuracy of cognitive direction and the item related to experiential/hedonic motivation. This suggests that participants with a greater personal interest in electric two-wheelers prior to joining the pilot project tended to develop a higher level of cognitive direction after using the mobility (HM2: r = 0.373 , p < 0.05 ).

4.2.3. Correlations between Postsurvey Items and Spatial Knowledge

Table 7 presents the correlations between user attitudes and respondents’ postsurvey and changes in spatial knowledge. The variable “changes in spatial knowledge” was the differences between the values of pre- and postsurveys, quantifying the number of changes in participants’ cognitive distance and direction. The higher positive values of changes indicated more improvements after the mobility travels.
Significant relationships were found between cognitive distance and user satisfaction with the charging service. A better cognitive distance was associated with a higher satisfaction regarding battery-swapping time (BS3: r = 0.344 , p < 0.05 ) and a lower concern about battery charge running out while driving (CN2: r = 0.414 , p < 0.01 ). Regarding cognitive direction, participants with better direction knowledge reported higher experiential/hedonic satisfactions. They showed increased interests in the electric two-wheelers (HS2: r = 0.456 , p < 0.01 ), the battery-swapping mechanism (HS3: r = 0.341 , p < 0.05 ), and other electric mobility options (LS3: r = 0.423 , p < 0.05 ). Additionally, participants with more improvements in cognitive direction experienced positive changes in daily activity patterns, including an expanded range of daily activities (LS1: r = 0.452 , p < 0.01 ) and increased visits to nearby café and commercial facilities (LS2: r = 0.359 , p < 0.05 ). However, they expressed lower satisfaction with the charging time of the battery-swapping system (BS3: r = 0.430 , p < 0.01 ).
These findings highlight the impact of spatial knowledge on user attitudes toward the electric mobility system. Participants with different cognitive abilities displayed variations in satisfaction levels and concerns, specifically regarding the driving range and charging issues.

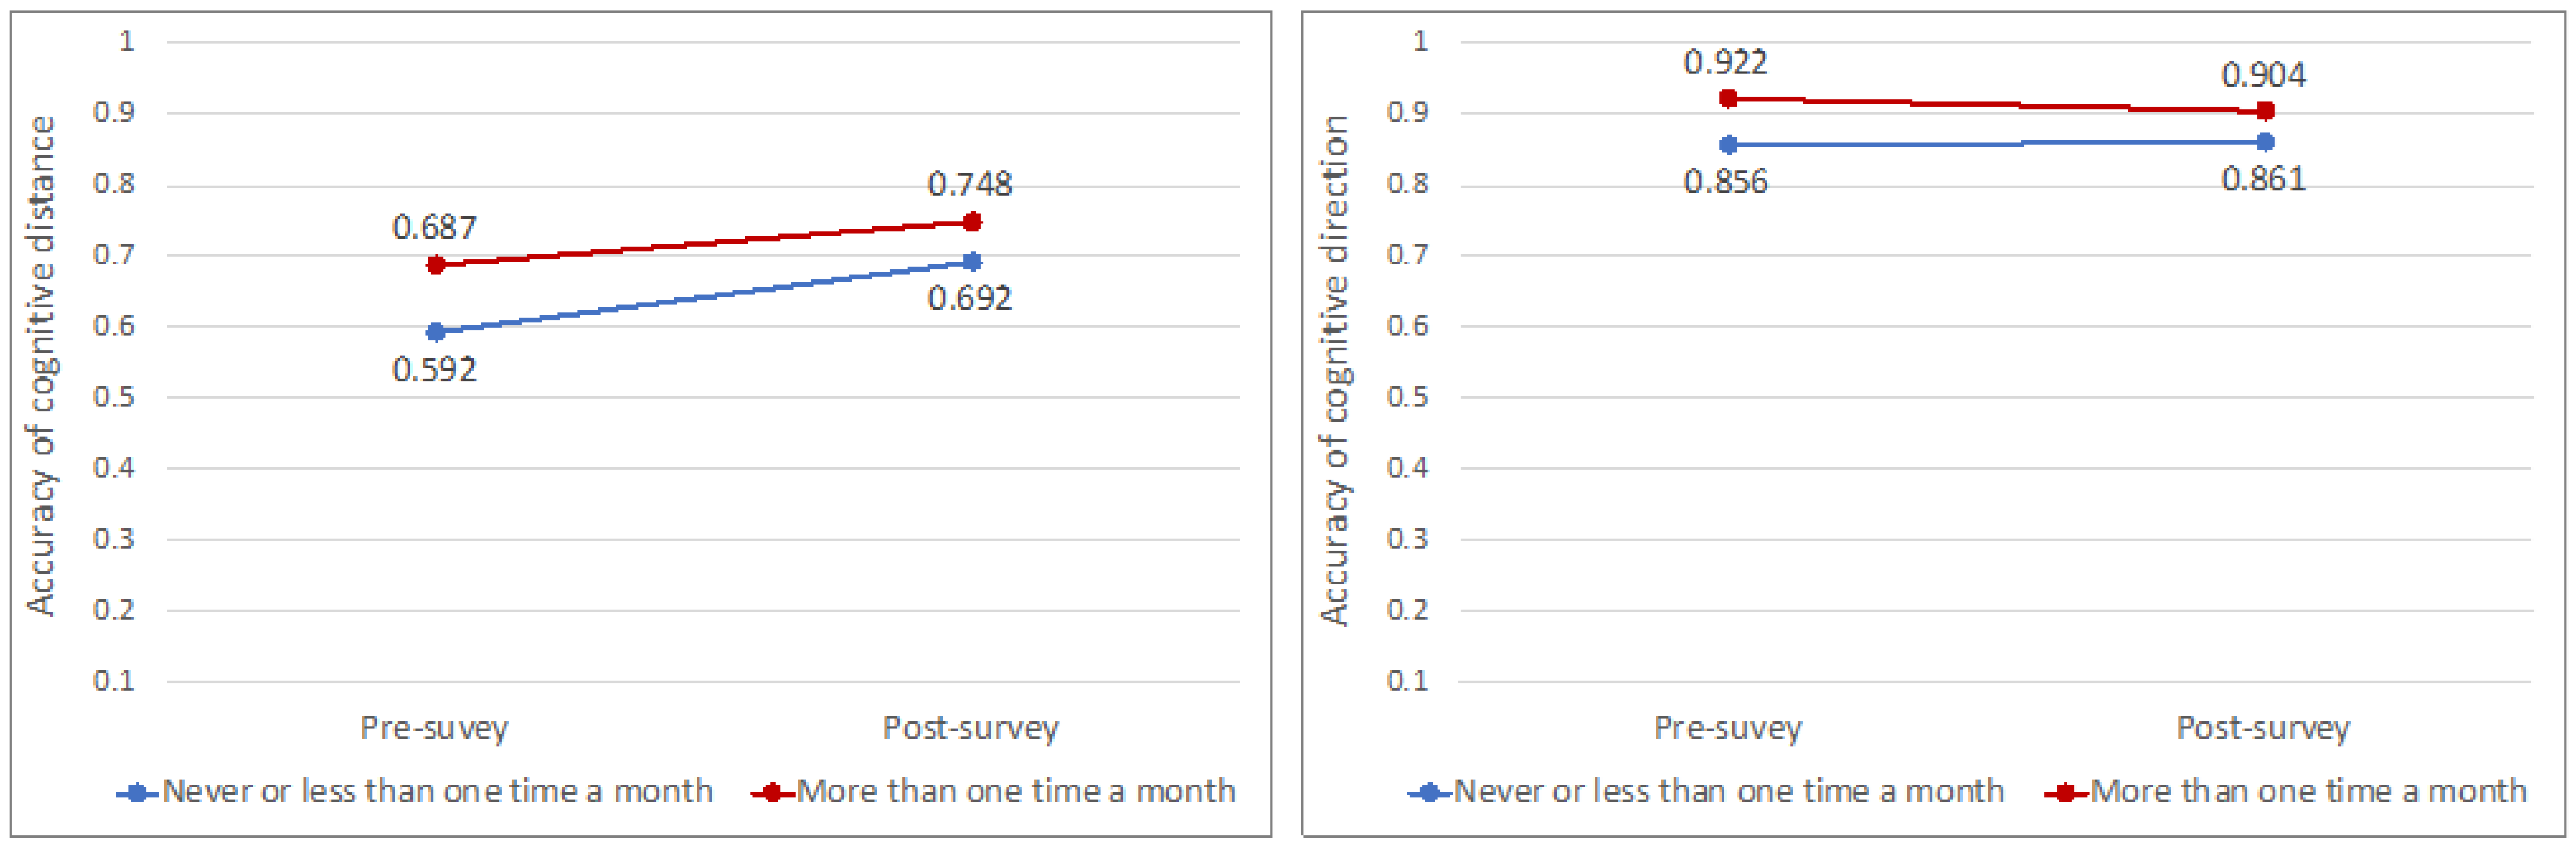
4.2.4. Two-Way ANOVA Results

A two-way ANOVA was conducted to examine the interaction effect between cognitive distance and cognitive direction on user attitudes. The dependent variables were satisfaction with the driving range of fully charged electric two-wheelers (BS1) and the driving range when considering battery-swapping services (BS2). Participants were categorized based on their improvement in cognitive distance and cognitive direction in the postsurvey.
Figure 12 plots the mean satisfaction scores for each combination of groups. A significant interaction effect was found for satisfaction with the driving range of a fully charged vehicle with F ( 1 ,   36 ) = 4.973 and p < 0.05 . The results suggested that the participants with an improved cognitive distance had a lower satisfaction with the driving range in case they had improved in cognitive direction. This finding aligned with the correlation results, where participants with better cognitive distance had higher expectations of traveling over a larger area and were less concerned about battery charge running out while driving. In contrast, participants with a better cognitive direction expressed a higher interest in the mobility options and reported positive lifestyle changes, including an expanded travel area and increased activity frequency. This suggests that the effects of cognitive distance may vary depending on a user’s desire for mobility trips, which is strongly correlated with cognitive direction.
Regarding satisfaction with the driving range when considering battery-swapping services, there was no significant interaction effect ( F ( 1 ,   36 ) = 1.339 , p = 0.255 ). However, the simple main-effects analysis indicated that cognitive direction had a significant effect on satisfaction with the driving range ( p < 0.05 ). It is worth noting that the battery-sharing mechanism could enhance users’ satisfaction by fulfilling their desire to travel over a larger area, particularly for those who had improved in both cognitive distance and direction. The average satisfaction score increased from 1.64 to 2.64 when considering the shared batteries.

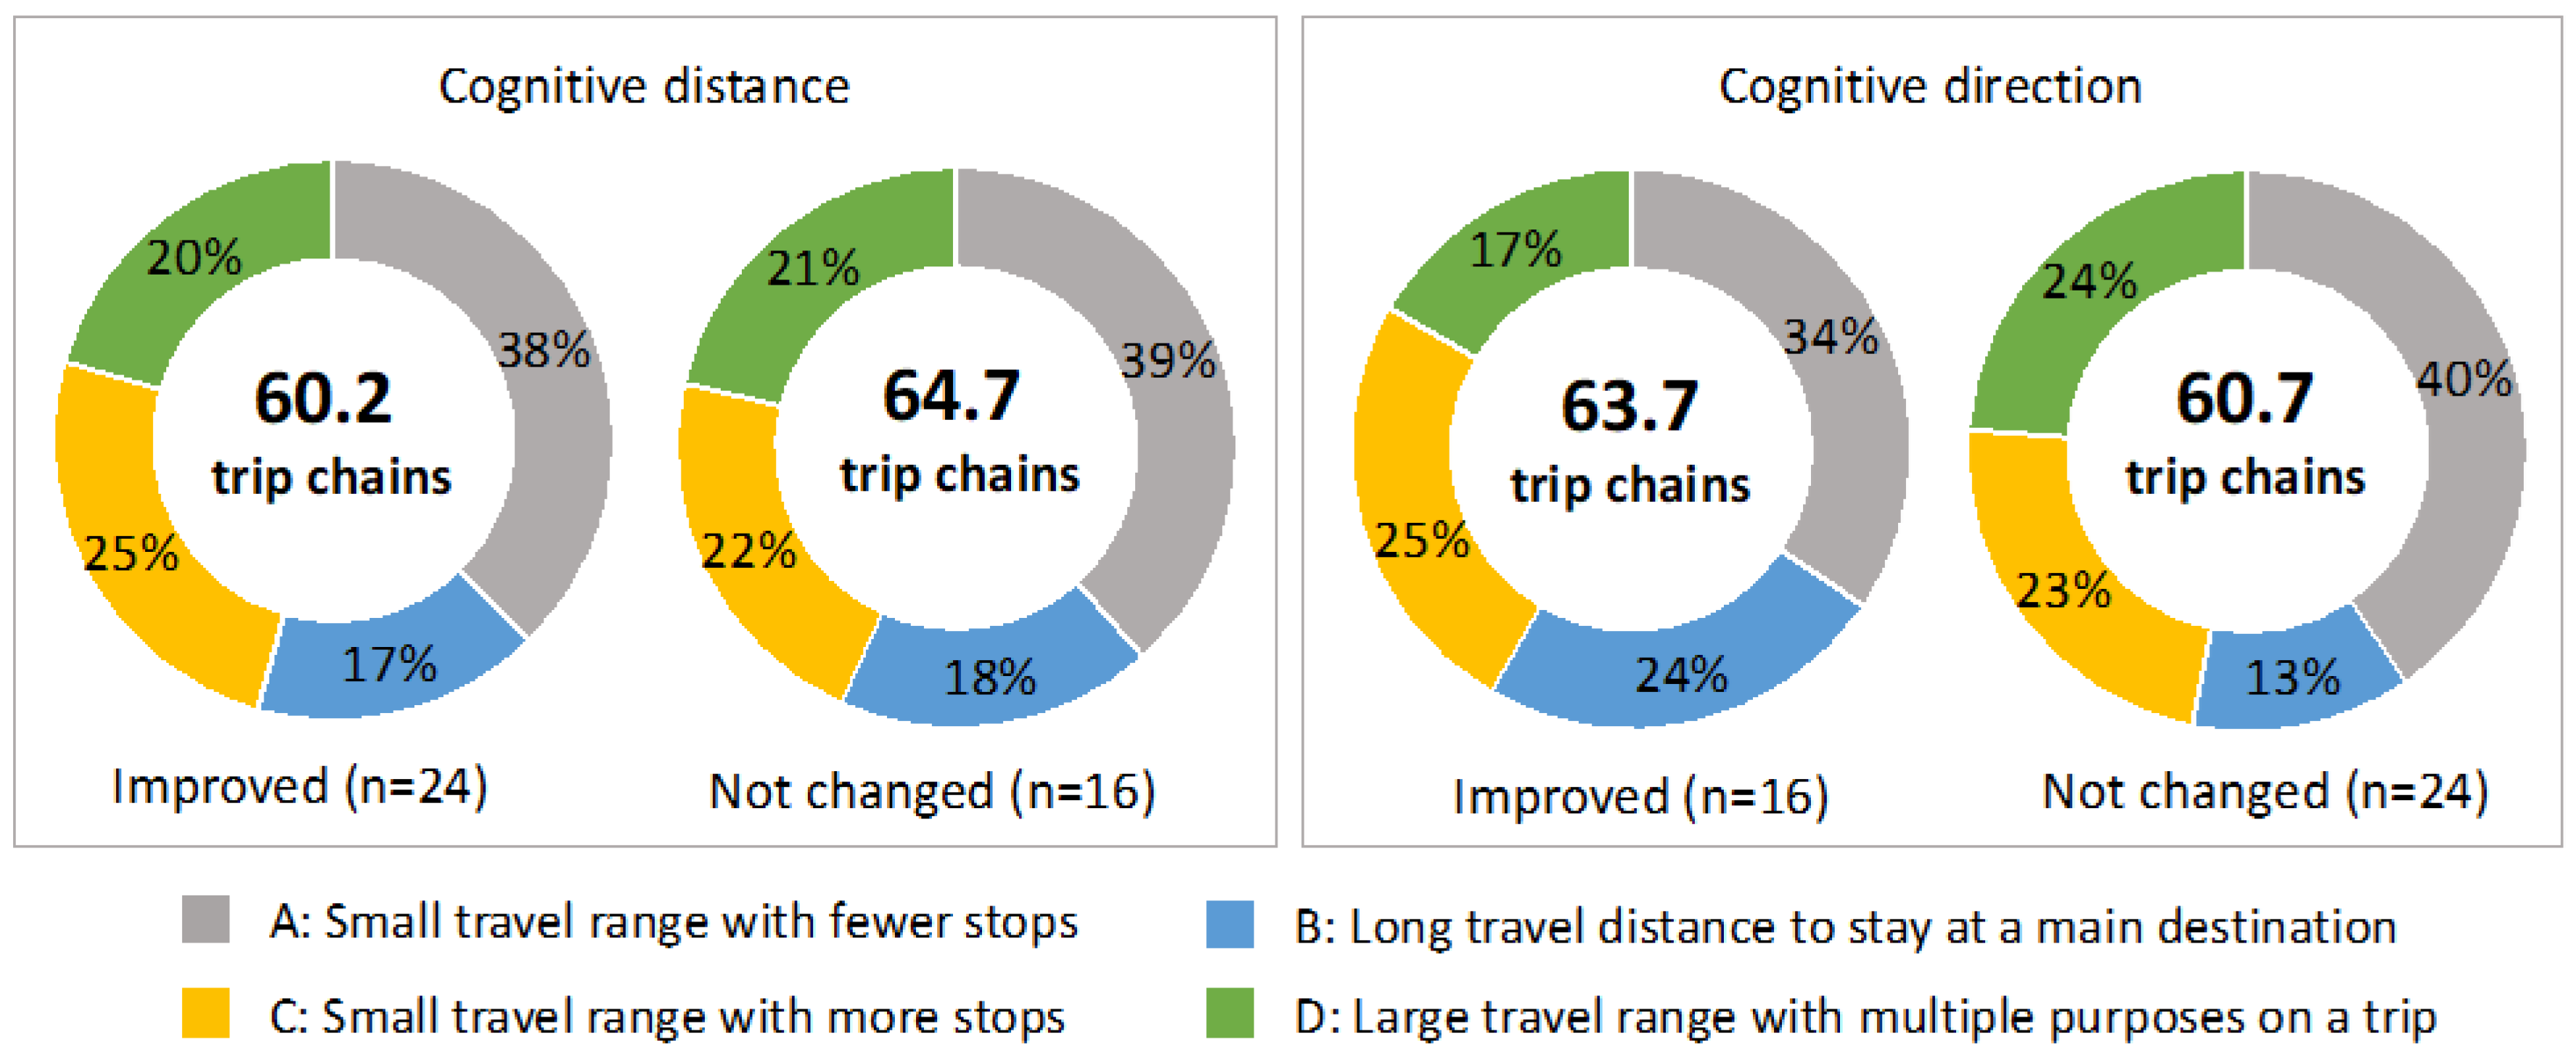
4.3. Relationships between Spatial Knowledge and Urban Travel Behaviors

This study examined participants’ travel patterns with vehicle tracking data. Table 8 summarizes the results of correlation tests. Significant negative relationships were found between the accuracy of cognitive direction and residual power, indicating that participants with either a better postcognitive direction ( r = 0.356 , p < 0.05 ) or who gained more improvements in direction knowledge ( r = 0.340 , p < 0.05 ) swapped the batteries at a lower level of residual power.

Trip-Chaining Behaviors

During the 3-month study period, a total of 2422 trip chains were analyzed from 40 participants. A principal component analysis (PCA) was conducted to capture the key features of users’ activity-travel patterns, resulting in three principal components that explained 72.8% of the variance. These components met established criteria, including eigenvalues greater than 1.0, factor loadings larger than 5%, and a cumulative proportion exceeding 60% [79] (Table 9). Following the PCA, a cluster analysis was performed on the principal component scores, leading to the identification of four clusters (A to D) consisting of 955, 369, 549, and 549 trip chains, respectively. Table 10 presents the cluster means of the three principal components and the mean values of travel pattern indicators, providing insights into the characteristics of each cluster.
Clusters A and C represented trip chains with smaller travel ranges (i.e., a shorter travel distance and smaller convex hull). Cluster A featured fewer destinations, a short travel distance, and a shorter stay time at destinations, presenting users’ need to make a quick and short trip. In contrast, cluster C had a higher tendency for making stops. With an average value of 2.7 stops and 82 min staying at a subdestination, cluster C demonstrated a flexible usage of BSET for various purposes within a short trip.
On the other hand, clusters B and D involved longer travel distances. Cluster B was associated with commuting patterns, featuring a limited number of destinations and shorter stay times at subdestinations. Cluster D, despite potential concerns about driving range, encompassed longer trips with multiple stops and longer stay times at both main and subdestinations, highlighting the potential of BSET for fulfilling diverse purposes during extended journeys.
The distribution of trip chains across clusters confirmed the ability of SEVs to support users’ daily travel needs, providing a greater freedom of movement. Specifically, 62.1% of trip chains (clusters A and C) were categorized as shorter journeys, while 45.3% (clusters C and D) represented trips with multiple purposes. Overall, the analysis of trip-chaining behaviors revealed distinct patterns in users’ travel preferences, shedding light on the potential of battery-sharing system to accommodate various travel needs.
The descriptive statistics in Figure 13 explore whether participants’ changes in spatial knowledge varied based on their trip-chaining behaviors. Participants were divided into groups based on improvements in cognitive distance and cognitive direction. Independent sample t-tests revealed no significant differences in participants’ trip-chaining behaviors between the two groups for both independent variables.

4.4. Results of Structural Relationship Analysis

The SEM analysis aimed to explore the different roles of cognitive direction and cognitive distance, and their direct and indirect effects in mobility adoption concerning travel range and EV charge issues. Figure 14 shows the estimated model with the standardized path coefficients and significant levels. The estimated model showed an acceptable fit on the sample data according to X2/df = 1.37, CFI = 0.94, TLI = 0.91, GFI = 0.86, and RMSEA = 0.06 [80].
Both cognitive direction and distance positively affected the satisfaction of users’ functional/instrumental purposes. The postlevels of accuracy in perceiving direction (β = 0.40, p < 0.01) and distance (β = 0.38, p < 0.01) positively affected user satisfaction concerning the time spent on battery swapping. Satisfaction with time spent on charging had a significant positive effect on traveling over a larger area with the mobility options (β = 0.56, p < 0.001) and further affected the overall satisfaction, including stating that the BSET fitted their lifestyle (β = 0.66, p < 0.001) and an expanded range of daily activity patterns (β = 0.41, p < 0.01).
In addition to the positive correlation with users’ functional/instrumental value, the cognitive direction strongly affected users’ hedonic experiences. The postlevel accuracy in perceiving direction significantly affected the interest in riding two-wheelers (β = 0.68, p < 0.001) and further increased the interest in other electric mobility services (β = 0.40, p < 0.01). The results corroborated and verified the hypotheses discussed in the two-way ANOVA section that cognitive distance and direction could have an interaction effect on satisfying urban users’ desire to make more trips and traveling across broader areas.
There was a significant positive correlation between a survey item concerning lifestyle change of an expanded range of daily activity and the number of total trip chains obtained from the vehicle tracking data. It is noted that the total number of trip chains positively affected changes in the accuracy of perceiving direction (β = 0.58, p < 0.001) and a higher level of knowledge in the postsurvey (β = 0.31, p < 0.05). Users who experienced more significant improvements in cognitive direction through their spatial experiences demonstrated a significant negative effect on their satisfaction with the time spent on charging (β = −0.33, p < 0.01). This result aligns with the two-way ANOVA results, highlighting an issue related to user satisfaction with the battery-swapping system, as spatial cognition improved through accumulating spatial experiences.

5. Discussion and Conclusions

This study assessed spatial knowledge by quantifying sketch maps, providing a flexible approach for measuring spatial knowledge in large-scale environments. The proposed indicators enabled a quantitative analysis, including hypothesis testing, group comparisons, and the evaluation of travel patterns. Addressing the challenge of connecting spatial cognition to spatial behavior, this study empirically evaluated the impact of spatial experiences on user intention and the adoption of a battery-sharing mobility system. The study strived to provide valuable insights for service providers and urban designers through research findings. The key findings of this study can be summarized as follows in relation to each research question.
Firstly, the results confirm that the accumulation of spatial experience enhances spatial knowledge, thereby supporting the first research question. The group with more driving experiences prior to participating in the pilot project had a better spatial ability to recognize distances and directions correctly. After traveling with the BSET for three months, a significant improvement was shown in participants’ accuracy of cognitive distance. The findings from the analysis of vehicle tracking data further support this research question. It was verified that participants who made more trips showed significant improvements and a higher accuracy in perceiving direction.
Secondly, the study reveals distinct effects of cognitive distance and cognitive direction on user motivation and satisfaction, addressing the second research question. Users with a better cognitive distance had higher expectations of traveling over larger areas and expressed fewer concerns about charging issues, resulting in a greater satisfaction. Previous research has shown that psychological distance can influence perceived control, with people perceiving higher control for psychological proximity [81]. Users with a better understanding of cognitive distance may have a more accurate perception of the proximity and availability of charging stations, reducing concerns about battery depletion and increasing satisfaction.
Another noteworthy finding suggests that improved cognitive direction enhances the enjoyment of mobility travels. Users with better cognitive direction had a stronger spatial orientation and navigational ability, making them more open to exploring different mobility options and places. Previous research has shown a connection between increased regional mobility, which is characterized by frequent trips and extensive travel areas, and improved navigational performance [82]. However, the impact of personality, emotions, and cognitive differences on spatial exploration tendencies remains relatively unexplored [83]. The findings of this study provide empirical clues that enhanced navigational abilities in a city-scale environment increase users’ interests in mobility and spatial exploration. From the perspective of environmental affordance, a better understanding of the environment enables travelers to perceive ways that fulfill their needs. This study shows that users with a better spatial knowledge reported a higher satisfaction with the battery-sharing system, positive changes in daily activity patterns, and a greater interest in mobility travels. Additionally, users with enhanced directional knowledge engaged in more efficient swapping behaviors.
The two-way ANOVA analysis revealed an interaction effect between distance and direction knowledge. The results suggest that participants with an improved cognitive distance show a lower satisfaction with the driving range of the vehicle when their cognitive direction also improves. This tendency indicates a treadmill effect in which heightened user aspirations lead to reduced satisfaction [84,85], highlighting the need for more flexible support to accommodate diverse travel needs. The analysis further confirms the efficacy of the battery-sharing mechanism in mitigating concerns about long charging times and limited EV range.
To address the third research question, this study analyzed users’ travel patterns by home-based trip chains. The results of the correlation analysis indicate that users with a better direction knowledge exhibit a greater control over the battery residual power. However, no significant difference was found in participants’ trip-chaining behaviors based on their improvements in spatial knowledge. The analysis applied in this study is useful for understanding users’ daily activity-travel patterns, whereas it is lacking any consideration of users’ battery swapping behaviors. Without obtaining significant results from the point of view of home-to-home trip chains, future research can study users’ diverse activity-travel patterns based on a recharge cycle.
This study offers practical insights by highlighting the need to support SEV users in developing a comprehensive urban image for better urban navigation, efficient activities, and enjoyable travel experiences. Service providers and vehicle designers can address user concerns about battery depletion by enhancing distance knowledge. This could involve integrating information on residual power and remaining travel distance into vehicle dashboards or mobile applications. Additionally, for urban planners and public administrators, this study underscores the importance of improving the spatial legibility of urban environments to enhance urban navigation (i.e., cognitive direction), especially with regard to available resources such as recharging sites and popular destinations like commercial and leisure facilities.
A limitation of this study is the absence of a control group and a large sample size due to the study context, which limits definitive conclusions about the impact of mobility travel on spatial knowledge. However, the mode choices of our respondents, such as only 5 out of 41 having access to motorized vehicles for longer distances before using the pilot mobility service, provide some partial insights. Future research could address this by including a control group, expanding sample sizes to control variables, and investigating intervention mechanisms and generalizability to other populations or settings. This study contributes valuable evidence regarding the different roles and interaction effects between road users’ cognitive distance and cognitive direction, which are highly relevant to the perceived control abilities of using a BEV and urban navigation. Subsequent studies could further expand this research by examining the effects of information provision on user experiences and the travel performance of BEVs.

Conclusions

In recent years, the evolution of virtual power plants, coupled with clean energy sources, has significantly elevated the role of EVs. The concept of vehicle–grid integration (VGI) presents a pragmatic and cost-effective approach to enhance energy sustainability while catering to end-users [86]. While technical advancements in this field have demonstrated the capacity of EVs for stationary applications, the vehicle-to-vehicle (V2V) wireless charging system introduces a versatile and rapid energy exchange method for EV charging, eliminating the necessity for a dense coverage of traditional charging stations [87]. In typical V2V charging systems, energy transfer is provided from a battery electric vehicle (BEV) to charge the energy storage unit of another BEV [88]. The ongoing development and innovation of battery-sharing EVs play a crucial role in addressing the charging infrastructure challenges and further advancing the adoption of electric mobility.
In this study, university students involved in the pilot mobility service assumed a dual role as both service users and engaged community members within the community-based BEV service framework. The study’s findings highlight a coevolutionary link between the transition from SEVs to battery-sharing EVs and the enrichment of users’ spatial experiences and cognitive knowledge. At an individual level, heightened spatial knowledge and experiences contribute to the enjoyment of urban travels, fostering increased interest and intentions for mobility usage. This supports social acceptance and user adoption when introducing new mobility services to promote BEV as a sustainable mobility option. For sustainable community and neighborhood development, this research underscores the importance of nurturing a virtuous cycle. With their enriched spatial experiences and improved spatial knowledge, community members, who are also service users, are inspired to actively contribute to the improvement of local streets, roads, and urban spaces. This collaborative effort, in turn, yields manifold benefits for road users and fosters sustainable enhancements within the local neighborhood.

Author Contributions

Conceptualization, K.D. and C.-C.C.; methodology, C.-C.C. and S.H.; validation, K.D. and K.Y.; formal analysis, C.-C.C. and S.H.; investigation, C.-C.C. and K.Y.; data curation, K.Y.; writing—original draft preparation, C.-C.C.; writing—review and editing, K.D.; visualization, C.-C.C.; supervision, K.D.; project administration, K.D. and K.Y.; funding acquisition, K.Y. All authors have read and agreed to the published version of the manuscript.

Funding

This work was supported by the JSPS KAKENHI grant numbers JP22K14338 and JP20H00584.

Institutional Review Board Statement

Not applicable.

Informed Consent Statement

Informed consent was obtained from all subjects involved in the study.

Data Availability Statement

Not applicable.

Conflicts of Interest

The authors declare no conflict of interest.

References

  1. Golledge, R.G.; Gärling, T. Cognitive maps and urban travel. In Handbook of Transport Geography and Spatial Systems; Emerald Group Publishing Limited: Bradford, UK, 2004; Volume 5, pp. 501–512. [Google Scholar]
  2. Mondschein, A.; Blumenberg, E.; Taylor, B.D. Cognitive mapping, travel behavior, and access to opportunity. Transp. Res. Rec. 2006, 1985, 266–272. [Google Scholar] [CrossRef]
  3. Mondschein, A.; Blumenberg, E.; Taylor, B. Accessibility and cognition: The effect of transport mode on spatial knowledge. Urban Stud. 2010, 47, 845–866. [Google Scholar] [CrossRef]
  4. Arentze, T.A.; Timmermans, H.J.P. Representing mental maps and cognitive learning in micro-simulation models of activity-travel choice dynamics. Transportation 2005, 32, 321–340. [Google Scholar] [CrossRef]
  5. Arentze, T.A.; Timmermans, H.J.P. Information gain, novelty seeking and travel: A model of dynamic activity-travel behavior under conditions of uncertainty. Transp. Res. Part A Policy Pract. 2005, 39, 125–145. [Google Scholar] [CrossRef]
  6. Manley, E.; Cheng, T. Exploring the role of spatial cognition in predicting urban traffic flow through agent-based modelling. Transp. Res. Part A Policy Pract. 2018, 109, 14–23. [Google Scholar] [CrossRef]
  7. Afrooz, A.; White, D.; Parolin, B. Effects of active and passive exploration of the built environment on memory during wayfinding. Appl. Geogr. 2018, 101, 68–74. [Google Scholar] [CrossRef]
  8. Schwinger, F.; Tanriverdi, B.; Jarke, M. Comparing Micromobility with Public Transportation Trips in a Data-Driven Spatio-Temporal Analysis. Sustainability 2022, 14, 8247. [Google Scholar] [CrossRef]
  9. Aman, J.J.; Zakhem, M.; Smith-Colin, J. Towards Equity in Micromobility: Spatial Analysis of Access to Bikes and Scooters amongst Disadvantaged Populations. Sustainability 2021, 13, 11856. [Google Scholar] [CrossRef]
  10. City of Lincoln. “Active Transportation and Micromobility”. City of Lincoln Nebraska. 2023. Available online: https://www.lincoln.ne.gov/City/Departments/LTU/Transportation/Traffic-Engineering/Active-Transportation (accessed on 5 April 2023).
  11. Schuitema, G.; Anable, J.; Skippon, S.; Kinnear, N. The role of instrumental, hedonic and symbolic attributes in the intention to adopt electric vehicles. Transp. Res. Part A Policy Pract. 2013, 48, 39–49. [Google Scholar] [CrossRef]
  12. Putri, B.A.I.; Atha, F.; Rizka, F.; Amalia, R.; Husna, S. Factors Affecting E-Scooter Sharing Purchase Intention: An Analysis Using Unified Theory of Acceptance and Use of Technology 2 (UTAUT2). Int. J. Creat. Bus. Manag. 2021, 1, 58–73. [Google Scholar] [CrossRef]
  13. Kopplin, C.S.; Brand, B.M.; Reichenberger, Y. Consumer acceptance of shared e-scooters for urban and short-distance mobility. Transp. Res. Part D Transp. Environ. 2021, 91, 102680. [Google Scholar] [CrossRef]
  14. Curtale, R.; Liao, F. User Acceptance and Preferences of Sharing Mobility Services. 2020. Available online: https://research.tue.nl/en/publications/user-acceptance-and-preferences-of-sharing-mobility-services (accessed on 12 September 2022).
  15. Finke, S.; Schelte, N.; Severengiz, S.; Fortkort, M.; Kähler, F. Can battery swapping stations make micro-mobility more environmentally sustainable? E3S Web Conf. 2022, 349, 02007. [Google Scholar] [CrossRef]
  16. Saur Energy. Here’s How Taiwan’s Gogoro Leads with Innovation in Electric Two-Wheeler Industry. 2022. Available online: https://www.saurenergy.com/ev-storage/heres-how-taiwans-gogoro-leads-with-innovation-in-electric-two-wheeler-industry (accessed on 23 September 2022).
  17. Cadwallader, M.T. Cognitive Distance in Intraurban Space. In Environmental Knowing; Moore, G.T., Golledge, R.G., Eds.; Dowden, Hutchinson & Ross: Stroudsburg, PA, USA, 1976; pp. 316–324. [Google Scholar]
  18. Downs, R.M.; Stea, D. (Eds.) Image and Environment: Cognitive Mapping and Spatial Behavior; Transaction Publishers: Piscataway, NJ, USA, 2017. [Google Scholar]
  19. Lynch, K. The Image of the City; MIT Press: Cambridge, MA, USA, 1960. [Google Scholar]
  20. Hart, R.A.; Moore, G.T. The Development of Spatial Cognition: A Review. In Image & Environment: Cognitive Mapping and Spatial Behavior; Downs, R.M., Stea, D., Eds.; AldineTransaction: Piscataway, NJ, USA, 1973; pp. 246–288. [Google Scholar]
  21. Evans, G.W. Environmental cognition. Psychol. Bull. 1980, 88, 259. [Google Scholar] [CrossRef]
  22. Ahmadpoor, N.; Shahab, S. Spatial knowledge acquisition in the process of navigation: A review. Curr. Urban Stud. 2019, 7, 1–19. [Google Scholar] [CrossRef]
  23. Palmer, S. Fundamental aspects of cognitive representation. In Cognition and Categorization; Rosch, E., Lloyd, B.B., Eds.; Erlbaum: Hilldale, NJ, USA, 1978. [Google Scholar]
  24. Appleyard, D. Why buildings are known: A predictive tool for architects and planners. Environ. Behav. 1969, 1, 131–156. [Google Scholar] [CrossRef]
  25. Appleyard, D. Styles and methods of structuring a city. Environ. Behav. 1970, 2, 100–117. [Google Scholar] [CrossRef]
  26. Siegel, A.W.; White, S.H. The development of spatial representations of large-scale environments. Adv. Child Dev. Behav. 1975, 10, 9–55. [Google Scholar]
  27. Moore, G.T. Knowing about environmental knowing: The current state of theory and research on environmental cognition. Environ. Behav. 1979, 11, 33–70. [Google Scholar] [CrossRef]
  28. Appleyard, D. The environment as a social symbol: Within a theory of environmental action and perception. J. Am. Plan. Assoc. 1979, 45, 143–153. [Google Scholar] [CrossRef]
  29. Appleyard, D. Urban trees, urban forests: What do they mean. In Proceedings of the National Urban Forestry Conference, Washington, DC, USA, 13–16 November 1979; pp. 138–155. [Google Scholar]
  30. Gibson, J.J. The senses considered as perceptual systems. J. Mind Behav. 1966, 79, 145. [Google Scholar]
  31. Gibson, J.J. The Ecological Approach to Visual Perception: Classic Edition; Psychology Press: London, UK, 1979. [Google Scholar]
  32. Lazarus, R.S. Cognition and motivation in emotion. Am. Psychol. 1991, 46, 352. [Google Scholar] [CrossRef] [PubMed]
  33. Maier, J.R.; Fadel, G.M.; Battisto, D.G. An affordance-based approach to architectural theory, design, and practice. Des. Stud. 2009, 30, 393–414. [Google Scholar] [CrossRef]
  34. Hartson, R. Cognitive, physical, sensory, and functional affordances in interaction design. Behav. Inf. Technol. 2003, 22, 315–338. [Google Scholar] [CrossRef]
  35. Marcus, L.; Giusti, M.; Barthel, S. Cognitive affordances in sustainable urbanism: Contributions of space syntax and spatial cognition. J. Urban Des. 2016, 21, 439–452. [Google Scholar] [CrossRef]
  36. Stern, E.; Leiser, D. Levels of spatial knowledge and urban travel modeling. Geogr. Anal. 1988, 20, 140–155. [Google Scholar] [CrossRef]
  37. Golledge, R.G. Learning about urban environment. In Timing Space and Spacing Time, Making Sense of Time; Edward Arnold: London, UK, 1978; Volume 1, pp. 76–98. [Google Scholar]
  38. Couclelis, H.; Golledge, R.G.; Gale, N.; Tobler, W. Exploring the anchor-point hypothesis of spatial cognition. J. Environ. Psychol. 1987, 7, 99–122. [Google Scholar] [CrossRef]
  39. Hazen, N.L. Spatial exploration and spatial knowledge: Individual and developmental differences in very young children. Child Dev. 1982, 53, 826–833. [Google Scholar] [CrossRef]
  40. Vilnai-Yavetz, I.; Rafaeli, A. Workspace Integration and Sustainability: Linking the Symbolic and Social Affordances of the Workspace to Employee Wellbeing. Sustainability 2021, 13, 11985. [Google Scholar] [CrossRef]
  41. Wineman, J.D.; Peponis, J. Constructing spatial meaning: Spatial affordances in museum design. Environ. Behav. 2010, 42, 86–109. [Google Scholar] [CrossRef]
  42. Samarasekara, G.N.; Fukahori, K.; Kubota, Y. Effect of street trees on spatial cognition in residential areas: An investigation based on development perspective. J. Archit. Infrastruct. Environ. 2009, 7, 75–86. Available online: http://library.jsce.or.jp/jsce/open/00911/2009/07/07-0075.pdf (accessed on 12 September 2022).
  43. Mirzaei, E.; Kheyroddin, R.; Behzadfar, M.; Mignot, D. Utilitarian and hedonic walking: Examining the impact of the built environment on walking behavior. Eur. Transp. Res. Rev. 2018, 10, 20. [Google Scholar] [CrossRef]
  44. Garling, T.; Book, A.; Lindberg, E. Cognitive mapping of large-scale environments: The interrelationship of action plans, acquisition, and orientation. Environ. Behav. 1984, 16, 3–34. [Google Scholar] [CrossRef]
  45. Zomer, L.B. Unravelling Urban Wayfinding: Studies on the Development of Spatial Knowledge, Activity Patterns, and Route Dynamics of Cyclists. Ph.D. Thesis, Delft University of Technology, Delft, The Netherlands, 2021. [Google Scholar]
  46. Schneider, F.; Ton, D.; Zomer, L.B.; Daamen, W.; Duives, D.; Hoogendoorn-Lanser, S.; Hoogendoorn, S. Trip chain complexity: A comparison among latent classes of daily mobility patterns. Transportation 2021, 48, 953–975. [Google Scholar] [CrossRef]
  47. Schneider, F.; Daamen, W.; Hoogendoorn, S. Trip chaining of bicycle and car commuters: An empirical analysis of detours to secondary activities. Transp. A Transp. Sci. 2022, 18, 855–878. [Google Scholar] [CrossRef]
  48. Foreman, N.; Gillett, R. (Eds.) A Handbook of Spatial Research Paradigms and Methodologies; Psychology Press: Hove, UK, 1997; Volume 2. [Google Scholar]
  49. Els, H.; Janssens, D.; Wets, G. Proximity is a state of mind: Exploring mental maps in daily activity travel behaviour. In Proceedings of the 11th International Conference on Travel Behaviour Research, Kyoto, Japan, 16–20 August 2006. [Google Scholar]
  50. Kruskal, J.B.; Wish, M. Multidimensional Scaling; Sage: Newcastle upon Tyne, UK, 1978; Volume 11. [Google Scholar]
  51. Shoben, E.J. Applications of multidimensional scaling in cognitive psychology. Appl. Psychol. Meas. 1983, 7, 473–490. [Google Scholar] [CrossRef]
  52. Allen, G.L.; Siegel, A.W.; Rosinski, R.R. The role of perceptual context in structuring spatial knowledge. J. Exp. Psychol. Hum. Learn. Mem. 1978, 4, 617. [Google Scholar] [CrossRef]
  53. Regian, J.W.; Yadrick, R.M. Assessment of configurational knowledge of naturally-and artificially-acquired large-scale space. J. Environ. Psychol. 1994, 14, 211–223. [Google Scholar] [CrossRef]
  54. Waller, D.; Haun, D.B. Scaling techniques for modeling directional knowledge. Behav. Res. Methods Instrum. Comput. 2003, 35, 285–293. [Google Scholar] [CrossRef]
  55. MacKay, D.B. The effect of spatial stimuli on the estimation of cognitive maps. Geogr. Anal. 1976, 8, 439–452. [Google Scholar] [CrossRef]
  56. Baird, J.C.; Merrill, A.A.; Tannenbaum, J. Studies of the cognitive representation of spatial relations: II. A familiar environment. J. Exp. Psychol. Gen. 1979, 108, 92. [Google Scholar] [CrossRef]
  57. Furlough, C.; Gillan, D.J. Assessing the Ability of Multidimensional Scaling and Pathfinder Networks to Measure Spatial Knowledge. In Proceedings of the Human Factors and Ergonomics Society Annual Meeting, Baltimore, MA, USA, 3–8 October 2021; Sage Publications: Los Angeles, CA, USA; Volume 64, pp. 303–307. [Google Scholar]
  58. De Jonge, D. Images of urban areas their structure and psychological foundations. J. Am. Inst. Plan. 1962, 28, 266–276. [Google Scholar] [CrossRef]
  59. Gulick, J. Images of an Arab city. J. Am. Inst. Plan. 1963, 29, 179–198. [Google Scholar] [CrossRef]
  60. Matthews, M.H. The mental maps of children: Images of Coventry’s city centre. Geography 1980, 65, 169–179. [Google Scholar]
  61. Golledge, R.G. Multidimensional analysis in the study of environmental behavior and environmental design. In Human Behavior and Environment; Springer: Boston, MA, USA, 1977; Volume 2, pp. 1–42. [Google Scholar]
  62. Moore, G.T.; Golledge, R.G. Environmental Knowing: Theories, Research and Methods; Dowden: Stroudsburg, PA, USA, 1976. [Google Scholar]
  63. Banerjee, T.; Baer, W.C. Beyond the Neighborhood Unit: Residential Environments and Public Policy; Springer Science Business Media: Berlin/Heidelberg, Germany, 2013. [Google Scholar]
  64. Minaei, N. Do modes of transportation and GPS affect cognitive maps of Londoners? Transp. Res. Part A Policy Pract. 2014, 70, 162–180. [Google Scholar] [CrossRef]
  65. Iavarone, A.H.; Hasgül, E. The City Experience with Location-Based Media: An Examination through Cognitive Maps. ICONARP Int. J. Archit. Plan. 2021, 9, 363–380. [Google Scholar] [CrossRef]
  66. Evans, G.W.; Marrero, D.G.; Butler, P.A. Environmental learning and cognitive mapping. Environ. Behav. 1981, 13, 83–104. [Google Scholar] [CrossRef]
  67. Siegel, A.W.; Schadler, M. Young children’s cognitive maps of their classroom. Child Dev. 1977, 48, 88–94. [Google Scholar]
  68. Moore, G.T. Developmental differences in environmental cognition. In Environmental Design Research; Preisser, W., Ed.; Dowden, Hutchinson Ross: Stroudsburg, PA, USA, 1973. [Google Scholar]
  69. Thorndyke, P.W.; Hayes-Roth, B. Differences in spatial knowledge acquired from maps and navigation. Cogn. Psychol. 1982, 14, 560–589. [Google Scholar] [CrossRef]
  70. Waller, D.; Hunt, E.; Knapp, D. Measuring spatial knowledge in a virtual environment: Distances and angles. In Proceedings of the 39th Annual Meeting of the Psychonomics Society, Dallas, TX, USA, 19–22 November 1998; Volume 21. [Google Scholar]
  71. Ishikawa, T.; Zhou, Y. Improving cognitive mapping by training for people with a poor sense of direction. Cogn. Res. Princ. Implic. 2020, 5, 39. [Google Scholar] [CrossRef]
  72. Melnykov, V.; Maitra, R. Finite mixture models and model-based clustering. Stat. Surv. 2010, 4, 80–116. [Google Scholar] [CrossRef]
  73. McLachlan, G.J. Model-based clustering. In Comprehensive Chemometrics: Chemical and Biochemical Data Analysis; Elsevier: Oxford, UK, 2009; pp. 655–681. [Google Scholar] [CrossRef]
  74. Levene, H. Robust tests for equality of variances. In Contributions to Probability and Statistics; Essays in honor of Harold Hotelling; Stanford University Press: Redwood City, CA, USA, 1961; pp. 279–292. [Google Scholar]
  75. Osaka Prefectural Government. The 5th Nationwide Person Trip Survey in Kansai Region. 2012. Available online: https://www.pref.osaka.lg.jp/toshikotsu/kinki-pt/index.html (accessed on 12 September 2022).
  76. Toyonaka City. Public Transport Improvement Plan. 2019. Available online: https://www.city.toyonaka.osaka.jp/machi/kotsuanzen/keikaku/koutuukeikaku.files/koukyoukoutuukaizennkneikaku.pdf (accessed on 12 September 2022).
  77. Smith, J.B.; Colgate, M. Customer value creation: A practical framework. J. Mark. Theory Pract. 2007, 15, 7–23. [Google Scholar] [CrossRef]
  78. Ohba, H.; Kishimoto, T. Analysis of Trip Chains’ Shapes and Regional Differences Using the People Flow Data. In Proceedings of the International Symposium on City Planning 2013, Hanoi, Vietnam, 22–24 August 2013; Available online: http://wwwnew.cpij.or.jp/com/iac/sympo/13/ISCP2013-98.pdf (accessed on 12 September 2022).
  79. Maskey, R.; Fei, J.; Nguyen, H.O. Use of exploratory factor analysis in maritime research. Asian J. Shipp. Logist. 2018, 34, 91–111. [Google Scholar] [CrossRef]
  80. Hair, J.F. Multivariate Data Analysis; Kennesaw State University: Kennesaw, GA, USA, 2009. [Google Scholar]
  81. Huang, H.-D.; Zhang, Q. Distance-construal relationship: Mediating role of perceived control and moderating role of locus of control. Front. Psychol. 2023, 13, 975417. [Google Scholar] [CrossRef] [PubMed]
  82. Davis, H.E.; Gurven, M.; Cashdan, E. Navigational Experience and the Preservation of Spatial Abilities into Old Age among a Tropical Forager-Farmer Population. Top. Cogn. Sci. 2023, 15, 187–212. [Google Scholar] [CrossRef]
  83. Davis, H.E.; Stack, J.; Cashdan, E. Cultural change reduces gender differences in mobility and spatial ability among seminomadic pastoralist-forager children in northern Namibia. Hum. Nat. 2021, 32, 178–206. [Google Scholar] [CrossRef]
  84. Kahneman, D.; Kahneman, D.; Tversky, A. Experienced utility and objective happiness: A moment-based approach. Psychol. Econ. Decis. 2003, 1, 187–208. [Google Scholar]
  85. Binswanger, M. Why does income growth fail to make us happier? Searching for the treadmills behind the paradox of happiness. J. Socio-Econ. 2006, 35, 366–381. [Google Scholar] [CrossRef]
  86. Inci, M.; Savrun, M.M.; Çelik, Ö. Integrating electric vehicles as virtual power plants: A comprehensive review on vehicle-to-grid (V2G) concepts, interface topologies, marketing and future prospects. J. Energy Storage 2022, 55, 105579. [Google Scholar] [CrossRef]
  87. Mou, X.; Zhao, R.; Gladwin, D.T. Vehicle to vehicle charging (V2V) bases on wireless power transfer technology. In Proceedings of the IECON 2018—44th Annual Conference of the IEEE Industrial Electronics Society (IEEE), Washington, DC, USA, 21–23 October 2018; pp. 4862–4867. [Google Scholar]
  88. İnci, M.; Büyük, M.; Özbek, N.S. Sliding mode control for fuel cell supported battery charger in vehicle-to-vehicle interaction. Fuel Cells 2022, 22, 212–226. [Google Scholar] [CrossRef]
Figure 1. Conceptual idea of this study.
Sustainability 15 15171 g001
Figure 2. Analytical framework of this study.
Sustainability 15 15171 g002
Figure 3. The given example on the survey sheet. The provided information was intentionally blurred to avoid including additional spatial details that might bias respondents.
Sustainability 15 15171 g003
Figure 4. Illustration of the measures used to evaluate spatial abilities related to the sense of distances and directions between landmarks.
Sustainability 15 15171 g004
Figure 5. Illustration of a convex full formed by a home-to-home trip chain.
Sustainability 15 15171 g005
Figure 6. Illustration to give the definitions of the proposed indicators for the main destination (left side) and the farthest destination (right side).
Sustainability 15 15171 g006
Figure 7. An example of sketch map with improvements in both cognitive distance and direction.
Sustainability 15 15171 g007
Figure 8. An example of sketch map with an improvement in cognitive distance with no change in cognitive direction.
Sustainability 15 15171 g008
Figure 9. An example of sketch map with an improvement in cognitive direction with no improvement in cognitive distance.
Sustainability 15 15171 g009
Figure 10. An example showing almost no change between the pre- and postmaps.
Sustainability 15 15171 g010
Figure 11. The performance of participants’ accuracy of cognitive distance and cognitive direction depending on prior on-road experiences.
Sustainability 15 15171 g011
Figure 12. Interaction effects of cognitive distance and direction on satisfaction with the driving range of BSET.
Sustainability 15 15171 g012
Figure 13. The proportion of trip chains in each category based on users’ changes in spatial knowledge.
Sustainability 15 15171 g013
Figure 14. SEM analysis results. Factors colored in yellow are regarding experiential/hedonic values, and factors in blue are related to functional/instrumental satisfaction.
Sustainability 15 15171 g014
Table 1. Description of participants.
CharacteristicsCategorySample SizePercentage (%)
GenderMale3687.8
Female512.2
EducationUndergraduate2561.0
Master’s student1229.3
Doctoral student49.8
Car driving licenseYes3892.7
No37.3
Driving frequency3–5 times a week37.3
1–2 times a week512.2
1–4 times a month1741.5
Less than 1 time a month1331.7
License for two-wheelers *Moped (≤50 cc)922.0
Small (≤125 cc)12.4
General (≤400 cc)512.2
Large (>400)37.3
No2765.9
Riding frequency6–7 times a week512.2
3–5 times a week512.2
1–2 times a week37.3
1–4 time a month37.3
Less than 1 time a month1331.7
No experience1229.3
Main way to commute toRail transit49.8
school *Bus24.9
Two-wheelers512.2
Electric bicycle512.2
Bicycle3073.2
Walk819.5
* Participants were asked multiple-choice questions.
Table 2. Descriptive statistics of individual travel patterns with the BSET.
Total Distances (km)Trip ChainsSwapping TimesResidual Power (%)
Mean800.2062.022.947.23
Min63.47322.7
Max5512.03617077.3
S.D.1065.1672.0315.3011.39
Table 3. Descriptive statistics and correlation matrix of spatial knowledge indicators and the linear distances between participants’ home, university, and transit station.
pre- ρ d i s t post- ρ d i s t pre- θ d i r post- θ d i r Home–Uni. (m)Home–Trans. (m)
Descriptive statistics (N = 41)
Mean0.6480.7250.8940.8862264.1925.2
Min0.1300.1660.3720.58950113
Max1.0000.9981.0001.00010,1002740
S.D.0.2600.2600.1140.0872012.42708.89
Correlation matrix
pre- ρ d i s t 1.000
post- ρ d i s t 0.525 **1.000
pre- θ d i r 0.153−0.0071.000
post- θ d i r 0.1210.0780.324 *1.000
home–uni.−0.563 **−0.322 *−0.198−0.1411.000
home–trans.0.364 *0.418 **−0.188−0.0130.0491.000
** Correlation is significant at the 0.01 level. * Correlation is significant at the 0.05 level.
Table 4. Presurvey on motivations to adopt to an electric mobility vehicle.
Items (N = 41)MeanS.D.
Functional/instrumental motivations (1 = no expect to 4 = strongly expect)
IM1Through riding an E2W, I can move freely and smoothly on the roads3.390.628
IM2I am able to travel over a larger area than before using an E2W3.071.058
IM3Through riding an E2W, I am able to move faster2.981.151
IM4Because the batteries are swappable, there is no need to wait for recharge3.150.910
Experiential/hedonic motivations (1 = disagree to 4 = strongly agree)
HM1I join in this project because I am interested in powered two-wheelers3.410.774
HM2I join in this project because I am interested in electric two-wheelers3.170.803
HM3I join in this project because I am interested in the battery-swapping mechanism3.000.866
HM4I join in this project because I like riding two-wheelers3.270.923
Table 5. Post-survey on satisfactions, changes in lifestyles, and concerns.
Items (N = 40)MeanS.D.
Functional/instrumental satisfaction (1 = dissatisfied to 5 = satisfied)
IS1Through riding an E2W, I have been able to move freely and smoothly on the roads4.680.694
IS2I have been able to travel over a larger area than before using an E2W4.400.928
IS3Through riding an E2W, I have been able to move faster4.431.035
IS4Because the batteries are swappable, there is no need to wait for recharge4.580.813
Experiential/Hedonic satisfaction (1 = decreased to 5 = increased)
HS1Interests in powered two-wheelers4.500.784
HS2Interests in electric two-wheelers4.330.859
HS3Interests in battery swapping mechanism4.350.700
HS4Interests in riding two-wheelers4.470.877
Satisfactions regarding the battery-swappable mobility (1 = dissatisfied to 5 = satisfied)
BS1Driving range of a fully charged E2W2.251.104
BS2Driving range when considering battery-swapping services2.951.085
BS3Time spent on swapping the batteries4.550.815
BS4Battery-swappable E2W fits to my lifestyle4.051.085
Lifestyle changes (1 = disagree to 4 = strongly agree)
LS1Expanded range of daily activities 2.831.010
LS2Increased visits to nearby café and commercial facilities2.421.059
LS3Increased interests in electric mobility in addition to E2W3.001.013
Concerns (1 = not concerned to 4 = strongly concerned)
CN1Increased likelihood of being involved in a traffic accident2.500.987
CN2Battery charge runs out while driving2.931.095
Note: E2W refers to electric two-wheelers.
Table 6. Spearman correlations between motivations and spatial knowledge.
ItemsPresurveyPostsurvey
pre- ρ d i s t pre- θ d i r post- ρ d i s t post- θ d i r
IM1Move freely and smoothly0.0730.052−0.0290.262
IM2Travel a larger area0.316 *0.0910.1680.249
IM3Move faster0.2170.1060.1810.207
IM4No need to wait for recharge−0.0330.2240.0390.071
HM1Interest in powered two-wheelers0.1730.0300.1110.262
HM2Interest in electric two-wheelers0.0610.283−0.1850.373 *
HM3Interest in battery swapping−0.1720.238−0.2720.012
HM4Like riding two-wheelers0.1440.029−0.0830.281
* Correlation is significant at the 0.05 level.
Table 7. Spearman correlations between satisfactions and changes in spatial knowledge.
ItemsPostsurveyChanges in Spatial Knowledge
post- ρ d i s t post- θ d i r ρ d i s t _change θ d i r _change
IS1Move freely and smoothly−0.210−0.064−0.193−0.095
IS2Travel a larger area0.1620.1220.0040.134
IS3Move faster0.0520.122−0.1270.108
IS4No need to wait for recharge−0.079−0.034−0.217−0.258
HS1Interest in powered two-wheelers−0.0020.181−0.0350.115
HS2Interest in electric two-wheelers−0.0330.456 **0.0790.271
HS3Interest in battery swapping−0.0310.341 *0.0570.188
HS4Like riding two-wheelers−0.0630.167−0.2120.260
BS1Driving range of a fully charged EV−0.1050.099−0.258−0.044
BS2Driving range with battery swapping−0.0450.302−0.1960.171
BS3Time spent on battery swapping0.344 *−0.2590.109−0.430 **
BS4E2W fits lifestyle0.2300.2660.0540.036
LS1Expanded daily activity range0.0000.2180.0000.452 **
LS2Increased leisure trips (e.g., café, shops)0.0110.2510.0260.359 *
LS3Increased interests in other mobility options −0.0840.423 **0.0940.225
CN1Concerns about traffic accidents0.0080.2580.1060.205
CN2Concerns about battery depletion−0.414 **0.009−0.1730.083
** Correlation is significant at the 0.01 level. * Correlation is significant at the 0.05 level.
Table 8. Spearman correlations between spatial knowledge measures and travel patterns.
Indicators PostsurveyChanges in Spatial Knowledge
post- ρ d i s t post- θ d i r ρ d i s t _change θ d i r _change
Trip chains−0.0320.301−0.0250.157
Total distances−0.1870.202−0.0090.088
Battery-swapping times−0.0910.1140.121−0.017
Residual power−0.063−0.356 *−0.274−0.340 *
* Correlation is significant at the 0.05 level.
Table 9. PCA results using 11 indicators of trip-chaining behaviors.
PC 1PC 2PC 3
Eigenvalues4.88721.76091.3544
Proportion of variance0.44430.16010.1231
Cumulative proportion0.44430.60440.7275
variables
Number of destinations−0.7560.2370.157
Distance to the main destination−0.434−0.8090.093
Width on the basis of main destination−0.8250.205−0.179
Ratio of width to distance of main destination−0.1640.2500.360
Distance to the farthest destination−0.737−0.6130.140
Width on the basis of farthest destination−0.8760.205−0.337
Ratio of width to distance of farthest destination−0.5740.507−0.373
Convex hull (m2)−0.862−0.013−0.245
Total travel distance−0.875−0.3030.143
Staying duration at the main destination−0.2200.2480.696
Staying duration at the subdestination−0.4720.3450.568
Table 10. Mean values of principle component scores of each cluster and travel pattern indicators.
ClusterABCD
Number of chains
(Proportion)
955
(39.4%)
369
(15.2%)
549
(22.7%)
549
(22.7%)
PC 11.5600.0800.200−2.968
PC 20.159−1.3580.967−0.332
PC 3−0.0620.354−0.4210.292
Mean value
Number of destinations1.32.02.74.4
Distance to the main destination (km)1.715.591.745.40
Distance to the farthest destination (km)1.655.592.137.22
Total travel distance (km)5.6016.739.0626.91
Staying duration at main destination (hour)4.55.86.814.3
Staying duration at subdestination (min)64182298
Disclaimer/Publisher’s Note: The statements, opinions and data contained in all publications are solely those of the individual author(s) and contributor(s) and not of MDPI and/or the editor(s). MDPI and/or the editor(s) disclaim responsibility for any injury to people or property resulting from any ideas, methods, instructions or products referred to in the content.

