
The Impact of the Digital Economy on Regional Carbon Emissions: Evidence from China

School of Statistics, Beijing Normal University, Beijing 100875, China
*
Author to whom correspondence should be addressed.
Sustainability 2023, 15(20), 14863; https://doi.org/10.3390/su152014863
Submission received: 22 August 2023
/
Revised: 24 September 2023
/
Accepted: 11 October 2023
/
Published: 13 October 2023
(This article belongs to the Section Environmental Sustainability and Applications)
Abstract
:As a high-tech, energy-efficient mode of economic development, the digital economy has a strong impact on regional carbon emissions and sustainable development. With a sample of panel data from 30 provinces in China ranging from 2011 to 2021, this study employs an expanded STIRPAT model to examine the impact of the digital economy on regional carbon emissions. The results reveal that the digital economy significantly inhibits regional carbon emissions, and specifically, a 1% increase in the level of digital economy development leads to a decline of approximately 1.09% in total carbon emissions. The heterogeneity analysis indicates that the digital economy has a more significant inhibitory effect on carbon emissions in the eastern region and areas with a higher level of development of the digital economy. The mechanism analysis shows that the digital economy can inhibit regional carbon emissions by affecting energy efficiency and changing the energy structure. A further study shows that the digital economy has a spatial spillover effect on the reduction in carbon emissions. Therefore, the government should fully leverage the potential of the digital economy to promote carbon emission reduction, promote the development and innovation of carbon emission reduction technology, continuously improve energy utilization efficiency, and achieve the mutually beneficial goal of economic benefits and emission reduction.
1. Introduction
Recently, as the global economy has developed, carbon emissions have reached the highest level in history. According to a report from the International Energy Agency (IEA), global carbon emissions will reach 321 million tons in 2022, with a growth rate of approximately 0.9%, and as early as 2019, the concentration of atmospheric carbon dioxide will reach 410 ppm, becoming the highest value in two million years. Excessive carbon emissions may cause serious global environmental problems, e.g., extreme climate disasters, land desertification, and global warming. According to the data from the International Energy Agency (IEA), the total carbon emissions of China in 2021 were 11.9 billion tons, and the country’s contribution rate was the highest in the world. Therefore, China’s active solution to the problem of carbon emission reduction is very important to global sustainable development. The Chinese government put forward the goal of “carbon peaking and carbon neutrality” in 2020, that is, China aims to achieve carbon peaking by 2030 and carbon neutrality by 2060. However, under the influence of multiple factors, such as the current slowdown in global economic growth and increased economic uncertainty, the realization of the dual carbon target requires not only strong policy support but also strong technological innovation incentives. At present, China’s digital economy is developing rapidly and has a significant role in stimulating the growth of the national economy. As a new economic form derived from digital technology, the digital economy can affect the energy and ecological industries by reducing production costs, promoting enterprise innovation, and improving energy utilization efficiency. This may reduce regional carbon emission intensity and contribute to realizing dual carbon goals (Li and Wang, 2022) [1].
Previous studies have mainly focused on the impact of the digital economy on factors including economic structure, employment, and population income, and there have been relatively few studies of the impact of regional carbon emissions and other environmental factors. At the same time, the research into the factors affecting carbon emissions mainly focuses on energy and other aspects, lacking new elements such as the digital economy. In particular, there is currently a lack of mechanism analysis on the impact of the digital economy on carbon emissions. Therefore, this study aims to actively find new endogenous driving forces for digital economy development to promote regional carbon emission reductions, further enrich intermediary factors, and provide optimal paths and policy suggestions for the development of the digital economy to achieve carbon emission reduction. The contributions of this study are mainly as follows. Firstly, a theoretical framework is established to analyze the impact of the digital economy on carbon emissions. The framework considers direct and indirect effects, spatial spillover effects, and heterogeneity. Secondly, considering the influence mechanism of the digital economy on carbon emissions, we establish an index system that emphasizes digital output. And it takes into account various types of energy to measure carbon emissions. Thirdly, this paper explores the impact on carbon emissions of various dimensions of the digital economy in more detail. At the same time, this paper discusses the action mechanism of the digital economy affecting regional carbon emissions from two aspects of energy efficiency and energy consumption structure in depth.
The remainder of this paper is structured as follows. Section 2 reviews the relevant literature and provides a theoretical analysis of how the digital economy affects carbon emissions. Section 3 introduces the methodology. Section 4 presents the research design, including a sample selection and variable description. Section 5 analyzes the empirical results. Section 6 is a test of the spatial spillover effect. Section 7 presents the conclusion and policy implications.
2. Literature Review and Theoretical Analysis
2.1. Digital Economy and Its Impact on the Economy and Society
Since the beginning of the 21st century, the digital economy has emerged as a significant factor in economic development, serving as a crucial driver of national growth. Undoubtedly, the digital economy is the core area of the current world’s attention and development. At present, the academic research into the digital economy mainly focuses on the concept of the digital economy, the measurement of the digital economy, and the impact of the digital economy.
The concept of the digital economy was first proposed by Don Tapscott in 1996 (Tapscott, 1996) [2]. Given the continuous development of the digital technology, the connotation of the digital economy is constantly expanding. Currently, the digital economy includes not only the development of information and communication technology (ICT) but also all economic activities that promote the adjustment of the entire social and economic structure, the improvement of production efficiency, and the integration and innovation of traditional industries through ICT (UNCTAD, 2019) [3]. Due to the strong industrial integration characteristics of the digital economy and its involvement in a wide range of industries, measuring the scale of the digital economy presents significant challenges. Traditional economic measurement methods have low applicability, and there is no general measurement system for the scale of the digital economy, which, to a certain extent, restricts the current status evaluation and further development of the digital economy. In China, the practice of measuring the digital economy can be divided into two categories. The first is the calculation of the total added value. The added value of the digital economy in different sectors is summed to obtain the total scale of the digital economy (Xu et al., 2020) [4]. The second is the measurement of the level of development, which involves constructing a comprehensive evaluation system for the digital economy, assigning weights to the indicators through different statistical methods, and then measuring the regional digital economy index (Liu et al., 2020) [5]. In terms of constructing measurement indicators of digital economy, most scholars take the broad connotation of the digital economy as the guiding principle and establish second- or third-level indicators from different dimensions to measure the development level of the digital economy. In the primary indicators, digital infrastructure implementation [6,7,8,9], digital industrialization, industrial digitalization [6,7,10,11,12], digital convergence [8], digital innovation, digital governance [13], digital development environment [14], etc., are selected. The secondary indicators are subdivided on the basis of the primary indicators to establish dimensions such as input, output [8,11], scale, and impact [5,8]. The tertiary indicators are specific measurement indicators, and on the basis of the secondary indicators, appropriate variables are selected for measurement. In addition, different institutions, such as the China Academy of Information and Communications Technology, Caixin Think Tank, Tencent Enterprise, CCID Consulting, etc., have also built their own unique digital economy measurement systems. In terms of evaluation methods, most scholars have adopted objective weighting methods, such as principal component analysis [10], the entropy method [6,8,11], and the vertical and horizontal pull-off method [15]. A few scholars have adopted the combination of the subjective and objective weighting methods or improved the measurement method of a certain level index in the calculation process [5,13].
Current research into the impact of the digital economy mainly focuses on its economic and social aspects. At the economic level, firstly, the digital economy can significantly increase total factor productivity by promoting the upgrading of industrial structure (Yang et al., 2021) [10]. Secondly, the development of the digital economy can promote technological progress and further facilitate the transformation and upgrading of the industrial structure (Bai et al., 2021) [16]. Thirdly, the digital economy has an impact on the level of corporate governance, as the higher the degree of digitalization within an enterprise, the higher its governance level and efficiency (Zhang et al., 2022) [6]. This impact is mainly because digitalization can effectively eliminate information barriers, help avoid the negative impact caused by information asymmetry, and improve the rationality of enterprise managers’ decision-making. Finally, the development of the digital economy can effectively promote the transformation of residents’ consumption and narrow the consumption gap between urban and rural residents (Ma, 2020) [17]. At the social level, the digital economy can promote the integrated development of urban and rural areas, promote rural revitalization (Xia and Liu, 2021) [18], and promote common prosperity (Liu, 2022; Xiang et al., 2022) [7,19]. Relevant research results show that the digital economy can promote the transfer of rural labor and expand the market size, thereby promoting the integrated development of urban and rural areas (Tai and Cai, 2022) [11]. Additionally, the digital economy can increase labor demand, significantly promote women’s employment, and improve women’s occupational status and job satisfaction (Lu et al., 2023) [8].
2.2. Carbon Emissions’ Estimation and Its Influencing Factors
According to the literature, there are several methods available for estimating total carbon emissions, including the material balance method, the actual measurement method, and estimation using satellite data. Among these methods, the fuel classification estimation method developed by the United Nations Intergovernmental Panel on Climate Change (IPCC) has been widely used in many studies (IPCC, 2007) [20]. In recent years, some scholars have focused on estimating China’s total carbon emissions. Their findings suggest that the current total carbon dioxide emissions in China have increased by approximately two times compared to the period at the beginning of the 21st century, but the industry proportion of carbon emissions has remained relatively stable. Based on current trends, it is expected that China’s carbon emissions will peak in approximately 2030 (Zhou et al., 2023) [21].
Various factors have been identified as significant contributors to carbon emissions. These include regional industrial structure (Zheng et al., 2020) [22], coal consumption (Jiang and Sun, 2023) [23], policies and regulations (Du et al., 2023) [24], finance and technology (Cheng et al., 2023) [25], the urbanization level (Xiao et al., 2023) [26], and carbon pricing mechanisms based on carbon taxes and carbon emission trading (Gugler et al., 2023; Zhang et al., 2022) [27,28]. Since 2020, the COVID-19 pandemic has had a significant impact on carbon emissions (Liu et al., 2023) [29], as well as an impact on the growth rate of carbon emissions. Researchers are exploring different paths to achieve the goal of carbon emission reduction. Firstly, achieving carbon emission reduction requires the establishment of a multilevel carbon emissions trading system (Qi and Cheng, 2018) [30]. Secondly, increasing urban employment and R&D intensity can promote carbon emission reductions (Lin and Wang, 2021) [31]. Thirdly, using clean energy is beneficial for reducing carbon emissions (Dogan and Seker, 2016) [32]. Finally, green cooperative innovation and green production technology can contribute to the reduction in carbon emission levels by optimizing industrial structure and reducing energy intensity (Guo and Zhang, 2023) [33].
2.3. The Impact of the Digital Economy on Carbon Emissions
2.3.1. The Direct Effects
Firstly, the digital economy is based on advancements in technologies, which can create wider channels for information dissemination and generate a more substantial technology dissemination effect. This technology dissemination effect can promote the application of more internet technologies in the environmental protection measures and clean production of enterprises and is conducive to supporting the promotion and application of carbon emission reduction technologies, thereby promoting the carbon emission reduction (Hu, 2023; Ma et al., 2022) [34,35]. In addition, digital technology can help to eliminate information barriers and bridge information gaps. Meanwhile, it can promote the renewal of enterprises’ notions of environmental protection and green management, and on the other hand, it can encourage governments to formulate environmental regulations that keep pace with the times and align with international standards (Wang et al., 2023) [36].
Secondly, the utilization of digital technology can optimize the energy allocation structure, decreasing the industrial energy consumption intensity and promoting energy efficiency (Zhang et al., 2022; Chen et al., 2022) [6,37]. The digital economy has facilitated the expansion of the scale of digital industries and the deepening of industrial digitization and has promoted the transfer of different production factors to knowledge-intensive industries from high-energy-consuming industries. Additionally, enterprises can leverage digital technology to simulate and formulate optimization plans, improve operational efficiency, achieve energy-saving goals in key processes at a lower cost, and utilize energy efficiently, thereby reducing carbon emissions.
Finally, the digital economy is conducive to the implementation of environmental regulations and the improvement of the enforcement and accuracy of environmental policies. It can encourage firms to shift from high-carbon energy sources, such as fossil fuels, to low-carbon alternatives, such as electricity, thereby transforming the energy consumption structure (Chen et al., 2022) [37]. In addition, digital technology can support the renewable energy development, e.g., solar energy, and increase the share of renewable energy in the energy market, reducing the supply of traditional fossil energy, further optimizing the energy structure, and lowering overall carbon emissions.
However, some studies suggest that the direct impact of the digital economy on carbon emissions reduction is not entirely positive. For instance, Salahuddin and Alam (2016) [38] indicate that the internet stimulates electricity consumption, which is detrimental to carbon emission reduction. Zhou et al. (2022) [39] found that the digital economy may lead to an increase in total CO2 emissions due to the expansion of digital demand and supply. Based on the above analysis, Hypothesis 1 is proposed.
Hypothesis 1 (H1).
The digital economy could directly promote carbon emissions reduction.
2.3.2. Spatial Spillover Effects
The spatial spillover effects of the digital economy on carbon emissions have received little attention in current research. The digital economy mainly relies on digital technology and digital platforms, which can transcend geographical barriers. Therefore, areas with a more mature digital economy can exert a certain radiating effect on regions with close economic ties. The rise of the internet economy has weakened the attenuation law of technological spillover effects resulting from the geographical distance of market players, strengthened the dissemination of information and technology, and formed spatial spillover effects. Regarding regional carbon emissions, its spatial effect may encompass two aspects (Yi et al., 2022; Wang et al., 2022) [9,12]. Firstly, due to the concentration of fossil fuels such as coal and oil and considering the transportation cost, the carbon emissions in the neighboring regions of resource-rich provinces with high carbon emissions are relatively high. Secondly, the reduction in carbon emissions in a region may be due to the relocation of energy-intensive enterprises with large carbon emissions to surrounding areas. Adjacent regions often have complementary industries, so the carbon emission levels of regions with declining carbon emission levels may increase in neighboring provinces. Based on the above analysis, Hypothesis 2 is proposed.
Hypothesis 2 (H2).
The digital economy could affect carbon emissions reduction in neighboring regions through spatial spillover effects.
2.3.3. Indirect Effects
In terms of curbing total carbon emissions in the digital economy, whether it is directly improving energy use efficiency, promoting the upgrading of industrial structure, or promoting the establishment and improvement of carbon emission trading markets, it will improve energy use efficiency. The rapid development of the digital economy is profoundly changing our means of production and way of life. In terms of production mode, the development of the digital economy optimizes the production process and uses data flow to promote efficient integration of production, distribution, circulation, and consumption, thereby reducing energy consumption (Lange et al., 2020) [40]. Specifically, digital technologies and carriers such as internet technologies and platforms are widely used in enterprise R&D, design, manufacturing, market operation and management, etc., to optimize energy utilization technology and production process, improve energy utilization efficiency, and reduce energy consumption (Lopez et al., 2022; Feng et al., 2022) [41,42]. The application of digital technology in the field of new energy accelerates the promotion and popularization of new energy and improves the proportion of new energy consumption, so as to optimize the energy consumption structure. Based on the above analysis, Hypothesis 3 and Hypothesis 4 are proposed.
Hypothesis 3 (H3).
The energy efficiency could play a mediating role between the digital economy and regional carbon emissions.
Hypothesis 4 (H4).
The energy structure could play a mediating role between the digital economy and regional carbon emissions.
2.3.4. Heterogeneity Effects
At present, many scholars are paying more and more attention to the new inequality phenomenon of the “digital divide”, believing that although the digital economy provides equal opportunities for the development of various regions, the digital dividends are not equal due to the different economic bases and stages in different regions (Qiu et al., 2016) [43]. There are differences in digital dividends among regions, and the impact of the digital economy on carbon emissions levels in different regions may also be relatively large (Li et al., 2021) [44]. On the other hand, due to the regional heterogeneity of digital economic development, there are also spatial differences in the impact of digital economy on regional carbon emissions. The digital economy includes many industries, including high-energy-consuming big data centers and 5G base station construction, as well as low-energy-efficient industries, such as artificial intelligence and big data. There are differences between different sectors of the digital economy, having different impacts on carbon emissions. Therefore, at different levels of development, the digital economy will inevitably have different impacts on regional carbon emissions. Based on the above analysis, Hypothesis 5 and Hypothesis 6 are proposed.
Hypothesis 5 (H5).
The impact of the digital economy on carbon emissions could be heterogeneous, depending on the region.
Hypothesis 6 (H6).
The impact of the digital economy on carbon emissions could be heterogeneous, depending on the level of digital economy development.
The existing research provides a solid theoretical foundation for this study, but overall, there is still room for further improvement. Firstly, in terms of the measurement index system of the digital economy, different definitions and measurement methods produce different empirical results, so more research and exploration are needed. Regarding the comprehensive evaluation method of the digital economy’s development level index system, methods such as the entropy method have certain limitations. Secondly, the impact of the digital economy on carbon emissions is multi-dimensional, comprehensive, and has many paths. At present, there is no unified theoretical framework. Thirdly, compared to the economic benefits of the digital economy, the environmental effects of the digital economy have not received enough attention. How the digital economy, as a new driving force for economic development, affects carbon emissions has not yet been detailed. To sum up, this paper intends to expand on the following aspects. Firstly, this paper sorts out the impact mechanism of the digital economy on carbon emissions under the theoretical framework and explores the direct and indirect mechanisms of digital economy affecting carbon emissions, as well as the spatial spillover effect and heterogeneity of digital economy on carbon emissions. Secondly, this paper constructs the index system of digital economy based on the influence mechanism and measures it using the PCA-entropy weight method. Finally, this paper constructs empirical models from direct effects, intermediary effects, and spatial effects and comprehensively evaluates the impact of the digital economy on regional carbon emissions. In addition, compared to existing studies that mostly analyze regional heterogeneity, this article extends the perspective of heterogeneity at different development levels of the digital economy.
Accordingly, the mechanism analysis diagram of the emission reduction effect of the digital economy is shown in Figure 1.
3. Methodology
3.1. Measurement of Regional Carbon Emissions
This study used the emission-factor approach proposed by the IPCC to estimate carbon emissions while accounting for carbon emissions in each region. By utilizing the carbon emission coefficient published in the “IPCC National Greenhouse Gas Inventory 2006” and combined with the annual energy use of each province, this study used the actual consumption of energy and the corresponding coefficient for calculation. This study used a total of nine sources: coal, coke, crude oil, fuel oil, gasoline, kerosene, diesel, natural gas, and electric power. Ultimately, the total regional carbon emissions (CE) was calculated via the following formula:
where i is the energy type, and is the standard coal consumption of the i-th energy. Energy consumption is represented by E, and the energy conversion coefficient and energy carbon emission coefficient are denoted by H and K, respectively (see Table 1). Based on the research of various energy conversion coefficients and carbon emission coefficients, the calculation coefficients in the formula are listed in Table 1.
Carbon emission intensity refers to the carbon dioxide emissions per unit of GDP, which links the economy of each province and city to carbon emissions. The lower the carbon emission intensity, the less carbon dioxide emissions per unit of GDP, indicating that economic growth is less dependent on carbon emissions. The formula of carbon emission intensity and per capita carbon emissions was
where GDP is the gross domestic product of each province and city at constant price, and is the population size.
3.2. Measurement of the Digital Economy
Referring to the “Statistical Classification of the Digital Economy and Its Core Industries” standard issued by the National Bureau of Statistics (NBS) of China in 2021, this paper categorized the metrics for measuring the digital economy into four primary parts: (1) Digital infrastructure, which is the carrier and foundation of the digital economy’s development. This study adopted five secondary indicators to measure per capita internet access traffic, per capita internet access ports, optical cable length per square kilometer, number of domain names per square kilometer, and number of computers per 100 people. (2) Industrial structure is an important dimension for assessing the development of the digital economy. The higher the proportion of the digital economy in the regional economy, the greater the digital economy’s contribution to the region’s GDP, and the greater the role of the digital economy in stimulating economic growth. In the “Statistical Classification of the Digital Economy and Its Core Industries (2021)” issued by the NBS, the industrial division of the digital economy focuses more on related industries, such as software and information technology, and digital finance is also one of the important medium categories. Therefore, this study used the proportion of the added value of the software and information technology service industry in GDP, the proportion of information transmission, the role of software and information technology service industry in the employment of urban units, and the digital financial inclusion index released by Peking University for measurement. (3) The digital industrial scale was also used, which is the most direct indicator of regional digital economic development. Following the “China Digital Economy Development Report (2022)” issued by the China Academy of Information and Communications Technology, this study categorized the digital economy industry into two aspects: digital industrialization and industrial digitization. In this study, the secondary indicators of digital industrialization included technology market turnover, software product revenue, software business revenue, and information technology service revenue. The measurement indicators of industrial digitalization included e-commerce purchases, e-commerce sales, and the proportion of enterprises with e-commerce activities. (4) The technological innovation of the digital economy, which lies in digital technology, and its rapid development of digital technology is the basic driving force for the development and growth of the digital economy. Therefore, this study employed technological innovation as a primary metric to measure the development of the digital economy in each province and used three second-level indicators, namely research and experimental development (R&D) funding, the number of R&D projects, and the number of digital economy-related patents. According to Xu et al. (2022) [45], patents related to the digital economy include digital high-tech technologies, such as artificial intelligence and big data, as well as digital foundational components, such as chips and computing equipment.
Since the data have a certain correlation, according to the research of Zhang and Li (2022) [6], this study employed the combination of the entropy weight method and principal component analysis method to determine the index weight. The entropy weight method was utilized to ascertain the weight of the secondary indicators, while the method of principal component analysis was employed to determine the final results of the digital economy index using the four primary indicators. Specifically, the steps of empowerment were as follows:
- (1)
- The Secondary Indicators’ Weights
This study employed the entropy weight method to determine the weight of the first-level indicators. The weight coefficient of the index was determined based on the degree of dispersion, which represents the amount of information in the entropy information evaluation index. This method can avoid the anthropic factor’s interference in the computing process, unlike subjective weighting methods such as AHP.
In the established index system evaluating the digital economy’s development, the measurement methods and units of measurement used in the secondary indicators vary, leading to large differences in the magnitude of the data. Measuring with raw data may not reflect the actual situation. To avoid measurement result deviation, this study utilized the threshold method to standardize the data of all indicators. The normalized formula for the indicator was
is the standardized variable of the j-th indicator in the i-th province in the t-th year. and are the minimum and maximum values of the indicator, respectively. To simplify the data analysis, this study determined that and . Therefore, the weight of the j-th indicator in province i in year t was
where N is the number of provinces, T is the number of years, and and . Then, the information entropy of the j-th index was
The information entropy redundancy and weight were
where is the number of second-level indicators under each first-level indicator. Therefore, calculating the comprehensive score of the first-level index for each sample
- (2)
- The Weight of the Primary Indicators
Due to the high correlation between the four first-level indicators, namely digital infrastructure, industrial structure, digital industrial scale, and technological innovation, this study used principal component analysis (PCA) to determine their weight. In this study, Bartlett’s sphericity test and the KMO test were first carried out, and the results are shown in Table 2. Among them, the KMO value is greater than 0.7, indicating the presence of collinearity among the four variables, and the weight can be calculated using PCA.
Principal component analysis can be represented by the following mathematical model:
where is the common factor, the is factor load matrix, and is the factor load.
To determine the weight of indicators via principal component analysis, we must first calculate the coefficients of the indicators in the linear combination of each principal component () and the variance contribution rate of the principal components ().
where is the number of common factor, and is eigenvalue.
Using the as the weight to weighted average , and then standardized to obtain the weight of each indicator, we obtained the following equation:
Finally, the weights of the indicators to calculate the digital economy index in each province are presented in Table 3.
The formula of the digital economy was
3.3. Empirical Models
3.3.1. STIRPAT Model
This study first used the improved IPAT model, namely the STIRPAT model, to explore the influence of the digital economy on carbon emissions. The predecessor of the STIRPAT model is the environmental pressure equation (IPAT) proposed by Ehrlich and Holdren (1971) [46], that is, . This function expresses environmental impact (I) as a function of the product of population size (P), social wealth (A), and production technology (T). However, there are certain limitations in the application of the IPAT model, and its variables are only allowed to change in a monotonous and proportional manner. The environmental Kuznets hypothesis suggests that the relationship between environmental quality and per capita income follows an inverted U-shaped curve rather than a linear monotonous form. To address this issue, York et al. (2003) [47] improved the IPAT model to examine the nonlinear effects of various variables on environmental pressure, resulting in the STIRPAT model, which is defined as follows:
where represents the environmental impact, which can be measured based on the discharge of pollutants. denotes the population size, while represents social wealth, which can be measured based on per capita income, and stands for technological innovation. and are coefficients and errors, and , , and are the indices of the corresponding indicators. To visually illustrate the impact of each factor on , Equation (8) is usually converted into logarithmic form:
where and are the logarithms of and , and the model preserves the multiplicative logic of the IPAT equation. Lankao et al. (2009) [48] noted that other variables can be incorporated into the basic STIRPAT model if they conceptually conform to their multiplicative specification. This study focuses on analyzing the impact of the digital economy on carbon emissions. To achieve this, this study introduced the digital economy indicator into the basic STIRPAT model and, at the same time, included other control variables to enhance the model. The final model was defined as follows:
In this model, represents the carbon emissions of provincial region i in year t, and denotes the digital economy index of province i in year t. represents other control variables that have an impact on carbon emissions, including economic development level, population, opening to the outside world, consumption level, etc. is the time fixed effect, is the individual fixed effect of each province, and represents the error term.
3.3.2. Spatial Effect Model
Spatial Weight Matrix
To investigate the spatial effect of the digital economy on carbon emissions, this study constructed three spatial weight matrices: an adjacency weight matrix, a geographic distance weight matrix, and an economic–geography distance weight matrix.
- (1)
- Geospatial Proximity Weight Matrix
The construction principle of the geospatial proximity weight matrix is that when the two regions share a mutual boundary, the two regions are regarded as adjacent regions; otherwise, they are regarded as nonadjacent. Due to the special geographical circumstances of Hainan Province, which lacks a common geographical border with other provinces, this study considered Hainan Province to be adjacent to Guangdong Province. The geographic adjacency weight matrix () was constructed as follows:
- (2)
- Geographic Distance Weight Matrix
Considering that the correlation of carbon emissions increases with decreasing regional geographical distance, this study constructed a geographical distance weight matrix (), which was defined as follows:
where is the spatial distance between the capital cities of provinces i and j in the Cartesian coordinate system.
- (3)
- Economic Geographic Distance Weight Matrix
Due to the existence of inter-regional economic linkages and industrial relocations within the realm of digital economic development, this study further constructed the economic geospatial distance weight matrix (), which was defined as follows:
where is the average per capita GDP of province j from 2011 to 2021, and the meaning of is the same as in Formula (20).
Spatial Correlation Test
The premise of considering spatial effects in the model is the existence of spatial autocorrelation. This study utilized the geographic adjacency weight matrix () to conduct spatial autocorrelation analysis of regional carbon emissions and the level of the digital economy to determine whether the variables were spatially correlated and whether there was spatial clustering of the research variables. The spatial autocorrelation indices used were the global Moran index and local Moran index, which were employed to explore the spatial correlation, spatial agglomeration, and dispersion characteristics of carbon emissions and the digital economy across various provinces in China.
- (1)
- Global Moran Index
This study constructed a global Moran index to test the spatial agglomeration effect of regional carbon emissions and the digital economy. These two indicators could reflect the overall spatial connectivity among provinces in China. The calculation method was as follows:
where represents the global Moran index, is the spatial weight matrix between province i and j, and = 30 is the number of provinces. is the corresponding indicator for province i, and is the mean of . The range of Moran’s exponent is [−1, 1]. The larger the absolute value, the stronger the spatial correlation of the corresponding index. When it was significantly positive, it indicated that there was a clear spatial agglomeration in adjacent provinces. When it was significantly negative, it indicated that there was a clear spatial differentiation in adjacent provinces. When the value of Moran’s index was close to zero, it indicated that there was no obvious spatial autocorrelation of the index, and the spatial distribution was random.
- (2)
- Local Moran Index
Compared to the global Moran index, the local Moran index provided a more comprehensive depiction of the spatial distribution characteristics and correlation among provinces. This study explored the local spatial autocorrelation and aggregation characteristics of each province by constructing a scatter plot of the local Moran index. The first and third quadrants of the scatter plot signified high–high clustering and low–low clustering, respectively, indicating a positive spatial correlation. Conversely, the second and fourth quadrants represented low–high clusters and high–low clusters, respectively, indicating a negative spatial correlation. The calculation of the local Moran index was as follows:
where is the local Moran index of , and the meanings of other symbols are the same as in Equation (22).
Spatial Durbin Model
This study used the spatial Durbin model to examine the spatial effect. The model incorporates spatial lag items of both the dependent and independent variables, which can solve the problem of omitted variables to some extent and enables an effective estimation of the spatial effect in panel data. The spatial Durbin model can be represented as follows:
where represents the spatial autoregressive coefficient, and denotes the spatial weight matrix. represents the spatial lag item of the digital economy and other relevant control variables. is the regression coefficient of the independent variable, and is a random error item that obeys a normal distribution.
4. Data and Variables
4.1. Sample Selection
This study measures the level of regional carbon emissions and digital economic development using data ranging from 2011 to 2021, as most of the digital economic indicators are only available after 2011, and China’s digital economy has developed quickly since that year. Data sources include the following elements: (1) Carbon emissions—the energy consumption figures from 2011 to 2020 are obtained from the “China Energy Statistical Yearbook”. The energy consumption of each province in 2021 comes from the 2022 statistical yearbook of each province. (2) Digital economy index—the data mainly come from various sources, such as the provincial annual data on the website of the National Bureau of Statistics, “China Statistical Yearbook”, “China Electronic Information Industry Statistical Yearbook”, “China City Statistical Yearbook”, and “Peking University Digital Financial Inclusion Index”. The number of patents related to the digital economy comes from the patent search website of the State Intellectual Property Office. (3) Other variables—the data for other variables mainly come from the annual China Statistical Yearbook and provincial statistical yearbooks.
It should be noted that due to a lack of data, this study does not cover Tibet, Taiwan, Hong Kong, and Macao and includes a total of 30 provincial regions. According to the NBS of China, these areas are divided into three major regions: eastern, central, and western. The eastern region covers Beijing, Tianjin, Hebei, Liaoning, Shanghai, Jiangsu, Zhejiang, Fujian, Shandong, Guangdong, and Hainan. The central region covers Shanxi, Jilin, Heilongjiang, Anhui, Jiangxi, Henan, Hubei, and Hunan. The western region covers Inner Mongolia, Guangxi, Chongqing, Sichuan, Guizhou, Yunnan, Shanxi, Shaanxi, Gansu, Qinghai, Ningxia, and Xinjiang.
4.2. Variable Description
The variables used in this study can be categorized into four types: explained variables, core independent variables, mechanism variables, and control variables.
4.2.1. Explained Variables
The explained variable represents the carbon emissions (CE) of each province, which is calculated according to Equation (1), which is mentioned above. In the subsequent robustness testing, the independent variables are replaced by the annual carbon emission intensity and per capita carbon emission of each province.
From the perspective of total carbon emissions, the changes in China’s 30 provinces over the past 11 years can be divided into four types, as shown in Figure 2. The first type of change in total provincial carbon emissions shows a trend of first increasing and then decreasing. The total emissions in 2021 are expected to be smaller than those in 2011, with an inflection point appearing between 2012 and 2014. Provinces of this type include Beijing, Tianjin, and Shanghai. The second type of province exhibits a fluctuating upward trend in carbon emissions. This type includes Hebei, Inner Mongolia, Shanxi, Liaoning, Jiangsu, Anhui, Jiangxi, Shandong, Guangxi, Guizhou, Shaanxi, Gansu, Ningxia, and Xinjiang. The third type of province showed a trend of decreasing fluctuations in carbon emissions over the past 11 years, including Jilin, Henan, Hubei, Chongqing, and Sichuan. The fourth type of province has experienced relatively stable carbon emissions over the past 11 years, with minimal changes, including Heilongjiang, Fujian, Hunan, Hainan, Guangdong, Yunnan, and Qinghai. Overall, there are 21 provinces whose total carbon emissions in 2021 were higher than in 2011, of which Jiangxi exhibited the largest increase of 72%, and nine provinces showed a reduction in carbon emissions, of which Hubei exhibited the largest reduction of 23%.
Among them, the top five provinces with the highest average total carbon emissions from 2011 to 2021 were Shandong (333.5125 million tons), Guangdong (268.8042 million tons), Hebei (245.0839 million tons), Jiangsu (244.2595 million tons), and Inner Mongolia (202.8511 million tons). The five provinces with the smallest carbon emissions were Hainan (18.2877 million tons), Qinghai (33.7543 million tons), Gansu (33.7543 million tons), Beijing (53.1065 million tons), and Jilin (54.4820 million tons). Obviously, there were significant disparities in carbon emission levels between different provinces in China; however, these disparities decreased over time.
From the perspective of the three major regions, namely the east, middle, and west, the average cumulative carbon emissions in the eastern region over the past 11 years was 1.743 billion tons, that in the central region was 812 million tons, and that in the western region reached 1.247 billion tons. However, in terms of growth rate, the central region increased by 33%, followed by the western region, with a growth rate of 20%, and the eastern region increased by 12%. These results indicate that the contribution of China’s carbon emissions is dominated by the eastern region, accounting for 46%, but the carbon emissions in the central region have increased rapidly in recent years.
Carbon emission intensity refers to the emission of carbon dioxide per unit of GDP, which directly reflects the level of carbon emission efficiency in regional economic development. In general, Hainan exhibits the highest carbon emission intensity, projected to be 16.26 metric tons per ten thousand yuan in 2021. Conversely, Zhejiang boasts the lowest carbon emission intensity, which is anticipated to be 0.06 tons per ten thousand yuan in 2021. Figure 3 illustrates that the carbon emission intensity of all 30 provinces demonstrates a downward trajectory, indicating that most provinces in China have enhanced their carbon emission efficiency in the process of economic development. The carbon emissions produced per unit GDP growth are diminishing, and the carbon emission reduction work has been fruitful. In terms of the decline rate, the five regions that experienced the most substantial decrease in carbon emission intensity over the past 11 years are Guizhou (−77.8%), Chongqing (−71.0%), Jiangsu (−66.9%), Xinjiang (−66.4%), and Anhui (−63.8%).
From the perspective of the three major regions, the central region exhibits the highest carbon emission intensity, with an average of 4.22 metric tons per ten thousand yuan overall, while the western region has the smallest carbon emission intensity, with an average of 1.87 metric tons per ten thousand yuan overall. From the perspective of changes in carbon emission intensity, the central region experienced the most substantial decline, i.e., approximately 55.15%. However, the reductions in the three major regions all exceeded 40%, showing a remarkable effect on carbon emissions reduction.
4.2.2. Core Independent Variables
The core independent variable is the digital economy (DE) of each province, which is calculated according to the comprehensive evaluation system of the digital economy constructed above. According to Table 4, the digital economy in all provinces has shown an upward development trend over the past 11 years, indicating that the digital economy of China has developed rapidly, especially in Beijing, Shanghai, and Chongqing. Meanwhile, the imbalance of the digital economy has gradually emerged. In 2011, there were small gaps in the digital economy among the 30 provinces, while the gap in the digital economy between provinces widened significantly.
From 2011 to 2021, the top five provinces with the most advanced digital economies were Beijing, Shanghai, Zhejiang, Jiangsu, and Tianjin. The five provinces with comparatively underdeveloped digital economies were Xinjiang, Gansu, Guangxi, Shanxi, and Guizhou. Overall, the digital economy is usually consistent with the local economic level, and the level of the digital economy in regions with more developed economies is also higher.
As shown in Figure 4, considering the three major regions, the level of the digital economy in the eastern region is significantly superior to that of the central and western regions, and the gap is progressively widening over time. The level of the digital economy in the central region is slightly higher than that in the western region, but the difference is not substantial. The aforementioned trend demonstrates a certain degree of regional heterogeneity for the digital economy, as it developed rapidly in the eastern region and is in a more mature stage of development. In contrast, the digital economy in the central and eastern regions is less developed and has great potential for growth.
4.2.3. Mechanism Variables
The mechanism variables used in this study include the following aspects: (1) Energy efficiency (EE). It is quantified by the energy consumption per unit of GDP. The greater the energy utilization efficiency in a region, the less energy consumption and carbon emissions are produced for the same level of GDP growth. (2) Energy structure (EM). The structure of energy consumption can directly affect regional carbon emissions. The higher the proportion of clean energy in a region’s energy consumption, the lower the region’s carbon emissions under the same energy consumption. Conversely, if the proportion of nonclean energy, such as coal, is higher, the carbon emissions under the same energy consumption will be greater, and the difficulty in reducing carbon emissions in this region will be greater. This variable is measured based on the ratio of electricity consumption to coal consumption.
4.2.4. Control Variables
The control variables utilized in this study include the following aspects: (1) The level of economic development (pGDP). There is a certain correlation between regional economic growth and carbon emissions. This study employs GDP per capita as an indicator to measure economic development. (2) Population size (POP). Population size will directly affect energy consumption and, therefore, carbon emissions. In this study, the population density (the ratio of the permanent population at the end of the year to the administrative area) is used to measure the population. (3) Education level (EL). The regional education level affects carbon emissions by influencing the environmental awareness of local residents and enterprises. The education level is measured by the average number of students in colleges and universities per 100,000 population. (4) Consumption level (CL). The level of consumption has an impact on regional carbon emissions from the consumption side. The higher the consumption level, the more products are needed, and the more carbon is emitted in the production and transportation process. This study uses per capita consumption expenditure to measure regional consumption levels. (5) Openness to the outside world (OE). Regional openness to the outside world has various impacts on carbon emissions. On one hand, the more open a region is to the outside world, the closer its economic ties with foreign countries will be. In particular, in regions dominated by export trade, it is very easy to produce the carbon transfer phenomenon of transferring the carbon emissions generated by the consumption demand of foreign products to China through trade, which increases the level of carbon emissions in this region. On the other hand, opening to the outside world is conducive to the introduction of advanced technology and, at the same time, can promote the implementation of stricter environmental protection standards, which has a negative effect on carbon emissions to a certain extent. This study uses the average amount of foreign investment (the ratio of the total investment of foreign-invested enterprises to the number of foreign-invested enterprises) to measure the degree of openness.
The descriptive statistics of these variables are presented in Table 5.
5. Empirical Results
5.1. Baseline Results
To validate the relationship between the digital economy’s development and carbon emission intensity, we first built a conventional econometric model using Equation (10). The Hausman test found that a fixed-effects model is appropriate for empirical analysis. As shown in Table 6, the results demonstrate that while gradually incorporating control variables, the coefficient of the core independent variable lnDE consistently displays a negative trend, and the results are statistically significant. This indicates that the regression results are consistent with our expectations. However, the adjusted R2 is very low, showing that the control variables have a significant impact on the results and cannot be disregarded. When the number of control variables increases, the significance of the regression results increases. The core independent variable lnDE coefficient in the final basic regression model is −1.09, which is statistically significant at a 1% confidence level. This indicates that for every 1% increase in the digital economy development index, the corresponding regional carbon emissions will decrease by 1.09%. This aligns with the previous predictions and actual situation, proving that the digital economy development exhibits a certain inhibitory effect on regional carbon emissions. The digital economy can provide support for China’s carbon peaking and carbon neutrality. The results of baseline regression verify the research hypothesis (H1) of this paper.
Regarding the controlling variables, it can be observed that the coefficient of the regional economy (lnpGDP) is consistently positive, signifying its role in promoting regional carbon emissions, which aligns with the preceding analysis. Economic development will drive energy consumption, thereby increasing carbon emissions. The coefficient of the population indicator (lnPOP) is positive with a significant level of 1%, indicating that population growth will exert certain pressure on carbon reduction and the achievement of dual carbon goals. The coefficient of the educational level is positive, which deviates from the preceding assumptions. This is perhaps because although the progress of environmental awareness and the behavior of environmental protect contribute to carbon reduction, there is a certain lag between the two and the development of education level, and their inhibitory effect on carbon emissions has not yet been demonstrated. The consumption level has a promoting effect on carbon emissions. The higher the regional consumption level, the higher the required energy consumption, which, in turn, affects carbon emissions. Therefore, high-quality consumption should be encouraged even more in the process of fulfilling the dual carbon goal. The results of this study demonstrate that opening up to the rest of the world has a greater promoting effect on carbon emissions than a restraining effect, i.e., compared to the technology spillover effect, the carbon transfer effect brought by foreign capital is greater, ultimately leading to more carbon emissions being produced in China.
This study further regresses the four primary indicators of the digital economy to explore the impacts of digital infrastructure, industrial structure, industrial scale, and technological innovation on regional carbon emissions. In Table 7, the results show that except for digital infrastructure, the primary indicators have a certain inhibitory effect on regional carbon emissions. The coefficient of digital infrastructure is positive, with a significance level of 5%. This may be due to the relatively small direct correlation between digital infrastructure and regional carbon emissions, and the construction of digital infrastructure will consume certain resources and energy, leading to an increase in carbon emissions. However, a lag exists in the inhibitory effect of digital infrastructure on carbon emissions. The coefficient of industrial structure is negative, which aligns with the previous analysis. This indicates that the more the regional industrial structure tends toward tertiary industry, such as information and finance, the higher the proportion of the digital economy in the regional economic structure, the less energy it consumes, and the lower the regional carbon emissions. The coefficient of industrial scale is negative and significant at a confidence level of 1%, demonstrating that digital industrialization and industrial digitization have a positive impact on reducing regional carbon emissions. The development of the digital industry relies more on high-tech industries such as the internet, reducing its dependence on energy and promoting the decoupling of economic development from carbon emissions to a certain extent. The digitization of industries has transformed the traditional development mode of high pollution and emissions in industries, which is conducive to high-quality economic development and has a positive effect on achieving the dual carbon goals. Technological innovation has a significant negative impact on the growth of regional carbon emissions. On one hand, technological innovation can improve the level of environmental protection, prompting the government to introduce stricter environmental standards. In addition, technological innovation can improve energy utilization efficiency in actual production, promoting the reduction in and harmless use of energy. The coefficients of the control variables are basically similar to those of the digital economy overall index.
5.2. Robustness Check
5.2.1. Replace the Dependent and Independent Variables
To check the robustness, the independent variables are replaced with carbon emission intensity (CEI) and per capita carbon emissions (pCE), following the methodology of Yi et al. (2022) [9]. To eliminate heteroscedasticity, the variables are logarithmically transformed, and the outcomes obtained via fitting the fixed effect model are presented in Columns (1) and (2) of Table 8. Obviously, irrespective of whether we use carbon emission intensity or per capita carbon emissions as the dependent variable, the digital economy has a negative impact on it, and the confidence interval is less than 10%. This shows the robustness of the results and indicates that the digital economy is advantageous for reducing regional carbon emission intensity and per capita carbon emissions. The results also demonstrate that the inhibitory effect of the digital economy on carbon emissions may be manifested in two aspects. One aspect is to directly affect the total carbon emissions, while the other is to suppress the level of carbon emissions by decreasing their intensity. The regression results indicate that the digital economy can have a negative impact on carbon emission intensity. Despite the constant growth of the digital economy, it will not cause an increase in carbon emissions. In other words, the development of the digital economy can achieve a decoupling between economic growth and increased carbon emissions at a certain stage. From this perspective, the digital economy can not only fulfill the requirements of economic development but also contribute to an ecological civilization and promote the achievement of the dual carbon goal.
When testing robustness, some studies also use the method of substituting core explanatory variables. Following the “Statistical Classification of Digital Economy and Its Core Industries (2021)” of the NBS, digital finance is classified as a medium category within the digital economy. The degree of digital finance can be considered a reflection of the level of the digital economy. The Digital Finance Inclusion Index is a research publication produced by authoritative institutions at Peking University that can accurately reflect the level of digital finance. This index was utilized as a secondary indicator in measuring the level of the digital economy in this study. During the robustness testing, the Digital Finance Inclusion Index was directly employed to represent the level of the digital economy and tested using a fixed effects model, as shown in the regression results in Column (3) of Table 8. The result is negative at a 5% confidence level, indicating that the carbon reduction effect of the digital economy really exists, thus supporting the robustness of the benchmark regression results.
5.2.2. Test the Endogeneity
Since there may be a bidirectional causal relationship between the digital economy and total regional carbon emissions, this study employs instrumental variable estimation to solve endogeneity problems. There are typically two methods used to construct instrumental variables. The first involves utilizing the lag term of the core independent variable as the instrumental variable, which resolves the issue of potential correlation between endogenous variables and error terms. This study uses the core independent variable lnDE, lagged for one period, as the instrumental variable for endogenous treatment, effectively mitigating the endogeneity problem. Another approach is to identify other variables that are highly correlated with endogenous independent variables but not with perturbation terms. This study uses the number of telephones per capita in every provincial region in 2000 as the instrumental variable, which serves as a crucial indicator of postal and telecommunications infrastructure, effectively reflecting the local digital infrastructure construction situation in 2000. The per capita number of telephones in each province in 2000 can reflect local economic development trends and consumption patterns. The higher the number of telephones per capita, the more popular post and telecommunications are in the local area, which is conducive to the digital economy’s development in the future. Therefore, selecting the historical number of telephones per capita in each province the instrumental variable of the regional digital economy level satisfies the correlation requirements with endogenous variables. Correspondingly, due to the fast development of the digital economy and the continuous breakthrough of information technology, the per capita number of telephones in each province has a relatively weak impact on carbon emission levels in history, making it hard to influence the current regional carbon emission levels. Meanwhile, there is no correlation between the per capita number of telephones in 2000 and other variables. Therefore, the number of telephones per capita in every region in 2000 is selected as the instrumental variable estimation, which satisfies the requirement of being unrelated to the disturbance term. Additionally, considering that the regional number of telephones per capita in 2000 is an example of cross-sectional data, it cannot be used as an instrumental variable for panel data. Referring to the method of Nunn et al. (2014) [49], this study uses time series variables to be the panel instrumental variable. Specifically, the instrumental variable of the current period is the interactive term of the number of telephones in each province in 2000 multiplied by the number of internet broadband access users in the previous period, and then 2SLS regressions are performed on the model. The data of internet broadband access users are sourced from the NBS, but the data for 2010 are missing and completed via the interpolation method. The data used in the study are also subjected to logarithmic processing.
A Hausman test was conducted on the digital economy index with a one-period lag, yielding a p-value of 0.0502. The results indicate that the original hypothesis should be rejected at a 10% significance level, and the digital economy should be considered an endogenous variable. In addition, the F statistic exceeds 10, the p-value is 0.0000, and Shea’s partial R2 is greater than 0.04, indicating that the results pass the weak instrumental variable estimation test. For the instrumental variable of telephone number, the above tests are also carried out. The p-value of the Hausman test is 0.0000, Shea’s partial R2 is 0.051, and the F statistic exceeds 10. These results demonstrate that these two instrumental variables are reasonable and effective. As shown in Table 9, after re-estimation via instrumental variable estimation, the coefficient of core independent variables remains significantly negative, which is consistent with the regression results, revealing that the empirical studies are robust.
5.3. Heterogeneity Analysis
5.3.1. Regional Heterogeneity
The digital economy and carbon emissions are influenced by geographical location to a certain extent. The eastern coastal areas boast developed economies, robust digital industry foundations, and high levels of technological innovation, while the digital industry development level in the central and western regions is relatively low, and the development conditions are limited. In addition, carbon emission levels exhibit certain spatial heterogeneity. Therefore, this study conducted a heterogeneity analysis from a geographical spatial perspective, and the results are displayed in Table 10. It is evident that there is spatial heterogeneity in the impact of the digital economy on regional carbon emissions. For the eastern region, a 1% increase in the development level of the digital economy decreases the total carbon emissions by 1.07%, which is significant at a confidence level of 5%. The absolute value of this coefficient is higher than that of the central and western regions, indicating that the digital economy in the eastern region has a stronger inhibitory effect on carbon emissions than that in the central and western regions. The impact coefficient of the digital economy in the central region is −0.42, indicating that the digital economy in the central region has a negative impact on regional carbon emissions, but the significance of this coefficient is not strong, i.e., the role of the digital economy in carbon reduction in the central region is insignificant. On the contrary, the results of the western region are different from those of the basic model, with a positive indicator coefficient for the digital economy. Thus, the influence of the digital economy on carbon emissions levels in the western region is found as a promoting effect, but it is insignificant. This is perhaps because the digital economy in the western region is still in the early phase of development, and there are no signs of decoupling between the economy and carbon emissions. Meanwhile, due to the low level of the digital economy in the western region, the impact of the digital economy on regional carbon emissions is not yet significant. The results of regional heterogeneity verify the research hypothesis (H5) of this paper.
5.3.2. Digital Economy Level Heterogeneity
With fluctuations in the digital economy, the impact of the digital economy on regional carbon emissions changes accordingly. This study further subdivides the developmental stages of the digital economy and scrutinizes its effect on carbon emissions. Based on the average value of the digital economy indicators of 30 provinces from 2011 to 2021, the top 10 provinces are classified as high-level regions, provinces 11–20 are classified as medium-level regions, and provinces 21–30 are classified as low-level regions. The high-level areas include Beijing, Shanghai, Zhejiang, Jiangsu, Tianjin, Guangdong, Fujian, Shandong, Liaoning, and Chongqing. The middle-level areas include Shaanxi, Anhui, Hubei, Sichuan, Hainan, Ningxia, Hunan, Jilin, Jiangxi, and Inner Mongolia. The low-level areas include Hebei, Qinghai, Henan, Heilongjiang, Yunnan, Guizhou, Guangxi, Shanxi, Xinjiang, and Gansu.
Regression was conducted for provinces with three different levels of digital economic development, and the results are presented in Table 11. It is evident that for provinces with a high level of development of the digital economy, the impact of the digital economy on carbon emissions has a significant negative inhibitory effect. For every 1% increase in the development level of the digital economy, the total carbon emissions in the region will decrease by 1.26%. In areas with moderate levels of the digital economic development, the coefficient of the digital economy is negative, but its absolute value is smaller than those of high-level areas. This indicates that the higher the development level of the digital economy, the greater the promoting effect on regional carbon reduction. In provinces with low levels of digital economic development, the digital economy plays a positive role in promoting regional carbon emissions. The reason is that the construction of digital infrastructure in areas with a high level of digital economy has been essentially completed, and the digital economy is on track. Its economic growth no longer requires a large amount of energy consumption to drive. In areas with relatively underdeveloped digital economies, their digital infrastructure is still under construction, which requires the consumption of energy and resources. In addition, due to the relatively backward development of the digital economy and the lagging effect of the economy on the environment, the inhibitory effect of the digital economy on carbon emissions in these regions has not yet been revealed. It should be noted that among the control variables, the indicator of openness to the outside world corresponds to similar results to those of the digital economy variable. The possible reason is that as the economy enters a high-level stage of development, the technology spillover effect begins to emerge, and its inhibitory effect on carbon emissions exceeds the promoting effect brought about via carbon transfer. Therefore, from this perspective, it further illustrates the importance of developing the digital economy and promoting high-quality economic development to reduce carbon emissions. The results of regional heterogeneity verify the research hypothesis (H6) of this paper.
5.4. Mechanism Analysis
This section scrutinizes whether energy efficiency and energy structure can function as mechanism variables for the impact of the digital economy on carbon emissions. The development of the digital economy has curtailed reliance on fossil fuels during the process of economic development. The energy consumption of GDP with the same growth rate has plummeted, and energy efficiency has improved, resulting in a reduction in carbon emissions. Meanwhile, according to the relevant classification of the digital economy issued by the NBS, the digital economy industry is more concentrated in tertiary industries, such as finance, thereby diminishing the utilization rate of fossil energy, such as coal. Simultaneously, technological innovation promoted by the digital economy has further changed the structure of energy use.
This study selects the stepwise regression method to scrutinize the role of energy efficiency and energy structure in the effect of the digital economy on regional carbon emissions. The empirical models are as follows:
where denotes the energy efficiency index, computed as the ratio of regional coal consumption to local GDP. refers to the energy structure, calculated based on the proportion of regional electricity consumption to coal consumption. Other symbols remain consistent with Equation (18), which represents the total impact model of the digital economy on carbon emissions, where represents the total impact level of the digital economy on carbon emissions. Equation (25) represents a model for the impact of the digital economy on energy efficiency, where denotes the direct impact level of the digital economy on energy efficiency. Equation (27) represents an impact model of the digital economy on carbon emissions, where is the direct impact level of the digital economy on carbon emissions, and is the direct impact level of energy efficiency on regional carbon emissions. Equations (26) and (28) replace the intermediate variable with the energy structure for the same analysis.
If energy efficiency and energy structure are significant mechanism variables, the following conditions must be satisfied. Firstly, should be significant in Equation (18), indicating that the impact of the digital economy on carbon emissions is significant. Secondly, should also be significant in Equation (25), indicating that the direct impact of the digital economy on energy efficiency is significant. Thirdly, if is significant and the absolute value of decreases or its sign changes, it proves that energy efficiency plays a mediating role, i.e., the digital economy affects regional carbon emissions levels by regulating energy efficiency. The mechanism analysis of the energy structure is the same as that of energy efficiency, as shown in Table 12.
The results illustrate that energy efficiency and energy structure are both mechanism variables that influence carbon emissions in the digital economy. In other words, the digital economy impacts regional carbon emissions by enhancing energy efficiency and modifying the energy structure. Specifically, from the perspective of energy structure, the direct impact of the digital economy on energy structure is demonstrated as a significant promoting effect. The digital economy will facilitate the upgrading of the energy structure, increasing the share of clean energy such as electricity in energy consumption, and the energy structure improvement can significantly reduce regional carbon emissions. The coefficient of the digital economy has changed from negative to positive, indicating that the rationalization of energy structure is a mechanism variable that exerts an impact on carbon emissions in the digital economy. From the perspective of energy efficiency, the direct impact coefficient of the digital economy is significant at a confidence level of 1%, and the direct impact coefficient of energy efficiency on regional carbon emissions is positive. Based on the expression method of energy efficiency used in this study, it can be observed that the higher the energy efficiency, the lower the regional carbon emissions. Furthermore, after incorporating energy efficiency into the regression equation, the coefficient of the digital economy significantly decreased, and it changed from negative to positive. This indicates that energy efficiency plays a mediating role between the digital economy and regional carbon emissions. The results of mechanism analysis verify the research Hypothesis (H3) and Hypothesis (H4) of this paper.
6. Further Study: Spatial Spillover Effect
Theoretically, the digital economy is more open and shared compared to the traditional economy. The digital economy mainly transmits information efficiently through digital platforms, thereby eliminating spatial barriers and reducing information asymmetry over market entities. Moreover, the digital economy has the potential to transcend temporal and spatial boundaries, enabling close connections between regions and generating spatial spillover effects. In addition, carbon emissions usually exhibit a certain degree of spatial correlation. When exploring the impact of the digital economy on regional carbon emissions, ignoring spatial effects may lead to coefficient estimation bias. Therefore, this study further establishes a spatial econometric model to explore the spatial spillover effect of the digital economy on carbon emissions.
6.1. Spatial Correlation Test
The estimations of the nationwide Moran’s index are shown in Table 13 and reveal that the overall Moran’s index for carbon emissions and the digital economy are both positive, implying a positive spatial autocorrelation. This suggests that both indices exhibit a certain degree of spatial clustering and spillover effects. Notably, the Moran’s index of the digital economy is higher and reveals that the digital economic development has a stronger spatial spillover effect than regional carbon emissions.
Figure 5 and Figure 6 depict scatter plots of the local Moran’s Index of the carbon emissions of each province in 2011, 2015, and 2021. Obviously, the carbon emissions and digital economy index of the 30 regions involved in this study are mostly concentrated in the first and third quadrants, presenting high–high clustering and low–low clustering trends. Additionally, the spatial autocorrelation of the two variables is positive, showing a certain degree of spatial clustering. Compared to carbon emissions, the spatial agglomeration effect of the digital economy is relatively stronger.
6.2. Spatial Durbin Test
To select an appropriate form of spatial econometric model, this study conducts the LM test, LR test, and Hausman test on panel data. LM tests are conducted on the OLS regression results to determine the presence of a spatial effect, and the results show that the original hypothesis is rejected with a p-value of less than 0.05, indicating the need for spatial measurement in the panel data. In addition, LR tests are conducted on the spatial Durbin model (SDM), spatial autoregressive model (SAR), and spatial error model (SEM). All p-values are 0.00, indicating the rejection of the original hypothesis. Therefore, the SDM model cannot degenerate into an SEM. The result of the Hausman test is a p-value of less than 0.01, and, therefore, a spatial Durbin model with fixed effects is employed in this study.
The results of the spatial Durbin model with the adjacency weight matrix are presented in Table 14. In Column (1), the coefficient of the digital economy is negative and significant at the 1% level and indicates that the development of the local digital economy will decrease the regional carbon emissions level. For a 1% increase in the development level of the digital economy, the level of carbon emissions will reduce by 0.9%, which is similar to the previous results of the basic regression. Column (2) reveals that the estimate coefficient of the spatial lag term in the digital economy no longer conforms to the characteristics of Column (1), and the estimate is statistically significant. This means that the current development of the regional digital economy in China has a promoting effect on the carbon emissions of neighboring areas. Therefore, the development of the local digital economy may lead to an increase in carbon emissions in surrounding areas. The reason is perhaps that the digital economy in a region may lead to the relocation of high-energy-consuming enterprises. At the same time, the strengthening of trade connections between regions through the digital economy and the disappearance of local consumption demand via production in neighboring regions ultimately leads to an increase in the total carbon emissions of neighboring regions. Columns (3)–(5) reflect the spatial effects of each explanatory variable on carbon emissions, representing direct effects, indirect effects, and total effects, respectively. Direct effects refer to the effects of local explanatory variables on the total amount of local carbon emissions. Indirect effects refer to the effects of explanatory variables from other regions on local carbon emissions. The total effect encompasses both direct and indirect effects of explanatory variables on local carbon emissions. The direct effect of the digital economy on carbon emissions is significant at a 1% confidence level and indicates that the digital economy will result in a decrease in local carbon emission levels. The indirect effect is positive, indicating that the expansion of the digital economy has a certain spatial spillover effect on carbon emission levels. The overall effect of the digital economy is positive, but the coefficient is close to 0 and not significant. This indicates that considering the spatial spillover effect, the digital economy currently has a slight promoting effect on carbon emissions, but the impact is not significant.
In the control variables, the coefficients of economic development level, population, and opening on regional carbon emissions are all positive, which is consistent with the fundamental regression results. This indicates that after accounting for spatial effects, all three variables have a similar promoting effect on regional carbon emissions. After accounting for the spatial effect, the coefficient of education level on carbon emissions becomes negative, which is consistent with the previous analysis. Obviously, the improvement in the education level in the region can reduce carbon dioxide emissions, mainly because receiving education can correspondingly enhance people’s environmental consciousness.
As shown in Table 15, the outcomes derived from utilizing the geographical distance weight matrix are nearly identical to those obtained using the adjacency matrix. The direct impact of the digital economy on regional carbon emissions is demonstrated as an inhibitory effect, while the indirect impact is demonstrated as a promoting effect. Overall, it has a minor impact on promoting carbon emissions, but its significance is not robust. Concerning the control variables, the result of education level is different from that of using the adjacency matrix, and the coefficient becomes negative, which is consistent with the fundamental regression result. A possible reason for this outcome is that the impact of education level on carbon emissions is trivial and not significant, ultimately resulting in diverse fitting results using different weight matrices.
As illustrated in Table 16, the results obtained by utilizing the economic geographic distance weight matrix are generally consistent with the aforementioned outcomes, although there are some slight differences. Specifically, the impact coefficient of the local digital economy on the area’s carbon emissions level is negative at a confidence level of 1%. This implies that the digital economy can decrease carbon emissions, which is consistent with previous estimating results. Column (2) indicates that the coefficient of the spatial lag term in the digital economy is not significant. Columns (3) to (5) show that the direct and total effects of the digital economy are statistically significant at confidence levels of 1% and 10%, respectively. The overall impact of the digital economy on regional carbon emissions is inhibitory. The indirect effect is statistically significant at the 5% level. The digital economy has a certain spatial spillover effect on carbon emissions, that is, the digital economy’s development in a neighboring region will increase the local carbon emission level.
Finally, this study conducted a comprehensive analysis of three spatial weight matrices and demonstrates that the fitting effect of utilizing the economic geographical distance weight matrix as the spatial weight matrix is superior. The main reason is that the development of the digital economy involves regional economic connections and industrial transfer, and the use of economic geographic weight matrices can comprehensively reflect geographical distance factors and socioeconomic factors. However, overall, the results of the three are not significantly divergent, indicating the robustness of the results. The digital economy has an overall inhibitory effect on regional carbon emissions, but the local digital economy will result in an increase in carbon emissions levels in neighboring provinces and economically interconnected provinces. The results of spatial Durbin test verify the research hypothesis (H2) of this paper.
7. Conclusions and Implications
This study explores the impact of the digital economy on carbon emissions over regions and its mechanism. The empirical results find that the digital economy has a suppressive effect on regional carbon emissions in general, and if the development level of the digital economy in one region increases by 1%, its total carbon emissions will decrease by approximately 1.09%. However, this effect exhibits a certain spatial heterogeneity; in the eastern region, the digital economy has a significant inhibitory effect on carbon emissions, while in the central and western regions, the negative effect of the digital economy on carbon emissions is not significant. Regarding the mechanism, the digital economy suppresses regional carbon emissions by affecting energy efficiency and changing the energy structure. Usually, regional economic development, population, and consumption levels will positively influence the carbon emissions level of the region. In particular, economic development drives energy consumption, leading to an increase in carbon emissions. A further spatial effect analysis shows that the development of the local digital economy can significantly decrease the internal carbon emissions level, and it has played a certain positive role in the carbon emission levels of neighboring regions, although this effect is not significant.
This study has some important policy implications. Firstly, the digital economy can considerably diminish regional carbon emissions levels, and its impact has a spatial spillover effect. From this perspective, it is imperative to fully exploit the promoting role of the digital economy in carbon reduction and promote the development and innovation of energy technology, especially carbon reduction technology. The authorities should support the utilization of digital technologies, including cloud computing, big data, and artificial intelligence, to revamp and upgrade traditional industries and enhance management efficiency and energy efficiency in production, transportation, manufacturing, and other activities. Secondly, the current development of China’s digital economy is unbalanced and inadequate, and the radiation and driving effects of regions with more highly developed digital economies on other regions have not been fully released. Therefore, it is necessary to increase the coordination of digital infrastructure construction in different regions, fully leveraging the radiative driving role of the digital economy and unleashing its potential to suppress carbon emissions. Thirdly, based on the spatial heterogeneity of carbon emissions suppressed by the digital economy within the regions, the current high level of development in the eastern region should prioritize enhancing the application and innovation level of digital technology, which must take the lead in tackling the key technical challenge of reducing emissions in the digital economy and accumulating replicable and promotable development experience. Meanwhile, the central and western regions should focus on promoting the construction of new digital infrastructure, based on low-cost advantages and resource endowments, to facilitate the development of the digital economy. Fourthly, the digital economy has the potential to curtail carbon emissions by influencing the energy structure and efficiency. Therefore, pertinent authorities must advance the digitization of the energy industry and establish innovative formats and energy models, such as comprehensive energy services, energy industry clouds, energy blockchain, and artificial intelligence. In addition, we must fully leverage the potential of digital technology in promoting the development and utilization of new energy development, such as wind, nuclear, tidal power, and other new clean energy, to promote the sustained growth and refinement of the new energy industry. Fifthly, to facilitate the realization of the dual carbon goals and global emission reduction tasks, China should actively introduce advanced environmental protection technologies and processes and integrate digital technology with key carbon emission fields, such as energy, electricity, manufacturing, construction, and transportation, as well as promote deep cooperation at the national level. In particular, energy and resource utilization efficiency should be continuously improved to achieve mutual growth in economic benefits and carbon reduction effects.
Author Contributions
Conceptualization, M.C. and J.W.; methodology, J.W. and S.Z.; software, J.W.; validation, J.W.; formal analysis, J.W.; resources, J.W.; data curation, J.W.; writing—original draft preparation, J.W. and M.C.; writing—review and editing, S.Z. and M.C.; visualization, J.W.; supervision, M.C.; project administration, M.C.; funding acquisition, M.C. All authors have read and agreed to the published version of the manuscript.
Funding
This study is supported by the Project of the Beijing Natural Science Foundation (9232012) and the National Social Science Fund of China (19ZDA118).
Institutional Review Board Statement
Not applicable.
Informed Consent Statement
Not applicable.
Data Availability Statement
The data are available on request, except those subject to privacy or ethical restrictions.
Conflicts of Interest
The authors declare no conflict of interest. The funders had no role in the design of the study; the collection, analyses, or interpretation of data; the writing of the manuscript; or the decision to publish the results.
References
- Li, Z.; Wang, J. The Dynamic Impact of Digital Economy on Carbon Emission Reduction: Evidence City-Level Empirical Data in China. J. Clean. Prod. 2022, 351, 131570. [Google Scholar] [CrossRef]
- Bowman, J.P. The Digital Economy: Promise and Peril in the Age of Networked Intelligence. Acad. Manag. Perspect. 1996, 10, 69–71. [Google Scholar] [CrossRef]
- United Nations Conference on Trade and Development (UNCTAD). “Digital Economy Report 2019-Values Creation and Capture: Implications for Developing Countries”. 2019. Available online: https://unctad.org/en/PublicationsLibrary/der2019_en.pdf (accessed on 5 July 2020).
- Xu, X.; Zhang, M. Research on the Scale Measurement of China’s Digital Economy: Based on the Perspective of International Comparison. China Ind. Econ. 2020, 5, 23–41. [Google Scholar]
- Liu, J.; Yang, Y.; Zhang, S. Research on the measurement and driving factors of China’s digital economy. Shanghai Econ. Res. J. 2020, 6, 81–96. [Google Scholar]
- Zhang, Z.; Li, Y. Research on the impact of digital economy on carbon emissions in China. Theory Pract. Financ. Econ. 2022, 43, 146–154. [Google Scholar]
- Xiang, Y.; Lu, Q.; Li, Z. The Development of Digital Economy Enables Common Prosperity: Impact Effect and Mechanism. Secur. Mark. Her. 2022, 358, 2–13. [Google Scholar]
- Lu, J.; Xiao, Q.; Wang, T. Does the Digital Economy Generate a Gender Dividend for Female Employment? Evidence from China. Telecommun. Policy 2023, 47, 102545. [Google Scholar] [CrossRef]
- Yi, M.; Liu, Y.; Sheng, M.S.; Wen, L. Effects of Digital Economy on Carbon Emission Reduction: New Evidence from China. Energy Policy 2022, 171, 113271. [Google Scholar] [CrossRef]
- Yang, H.; Jiang, L. Digital economy, spatial effect and total factor productivity. Stat. Res. 2021, 38, 3–15. [Google Scholar]
- Tai, D.; Cai, R. Digital Economy Empowers Urban and Rural Economic Integration: Internal Mechanism and Empirical Test. Contemp. Econ. Manag. 2022, 44, 59–70. [Google Scholar]
- Wang, J.; Luo, X.; Zhu, J. Does the Digital Economy Contribute to Carbon Emissions Reduction? A City-Level Spatial Analysis in China. Chin. J. Popul. Resour. Environ. 2022, 20, 105–114. [Google Scholar] [CrossRef]
- Sheng, B.; Liu, Y.Y. Research on the Measurement and Spatial Characteristics of China’s Digital Economy. Nanjing J. Soc. Sci. 2022, 411, 43–54. [Google Scholar]
- Wang, J.; Zhu, J.; Luo, X. Research on the Measurement of China’s Digital Economy Development and the Characteristics. J. Quant. Technol. Econ. 2021, 38, 26–42. [Google Scholar]
- Jin, C.Y.; Xu, A.T.; Qiu, K.Y. Measurement of China’s Provincial Digital Economy and Its Spatial Correlation. J. Stat. Inf. 2022, 37, 11–21. [Google Scholar]
- Bai, X.; Song, P.; Li, L. Can Digital Economy Promote the Transformation of China’s Industrial Structure: Based on the Perspective of Efficient Technological Progress. J. Xi’an Jiaotong Univ. (Soc. Sci.) 2021, 41, 1–15. [Google Scholar]
- Ma, X. The Change of Consumption in the Digital Economy: Trends, Characteristics, Mechanisms and Model. Financ. Econ. 2020, 382, 120–132. [Google Scholar]
- Xia, J.; Liu, C. Empowerment of Common Prosperity Through Digital Economy: Pathways and Policy Design. Res. Econ. Manag. 2021, 42, 3–13. [Google Scholar]
- Liu, C. Digital Economy and Common prosperity: A Theoretical Analysis Based on Income Distribution. Res. Financ. Econ. Issues 2022, 461, 25–35. [Google Scholar]
- Parry, M.L. Climate Change 2007–Impacts, Adaptation and Vulnerability: Working Group II Contribution to the Fourth Assessment Report of the IPCC; Cambridge University Press: Cambridge, UK, 2007; Volume 4. [Google Scholar]
- Zhou, X.; Niu, A.; Lin, C. Optimizing Carbon Emission Forecast for Modelling China’s 2030 Provincial Carbon Emission Quota Allocation. J. Environ. Manag. 2023, 325, 116523. [Google Scholar] [CrossRef]
- Zheng, H.; Gao, X.; Sun, Q.; Han, X.; Wang, Z. The Impact of Regional Industrial Structure Differences on Carbon Emission Differences in China: An Evolutionary Perspective. J. Clean. Prod. 2020, 257, 120506. [Google Scholar] [CrossRef]
- Jiang, W.; Sun, Y. Which Is the More Important Factor of Carbon Emission, Coal Consumption or Industrial Structure? Energy Policy 2023, 176, 113508. [Google Scholar] [CrossRef]
- Du, Y.; Liu, H.; Huang, H.; Li, X. The Carbon Emission Reduction Effect of Agricultural Policy—Evidence from China. J. Clean. Prod. 2023, 406, 137005. [Google Scholar] [CrossRef]
- Cheng, X.; Yao, D.; Qian, Y.; Wang, B.; Zhang, D. How Does Fintech Influence Carbon Emissions: Evidence from China’s Prefecture-Level Cities. Int. Rev. Financ. Anal. 2023, 87, 102655. [Google Scholar] [CrossRef]
- Xiao, Y.; Huang, H.; Qian, X.-M.; Zhang, L.-Y.; An, B.-W. Can New-Type Urbanization Reduce Urban Building Carbon Emissions? New Evidence from China. Sustain. Cities Soc. 2023, 90, 104410. [Google Scholar] [CrossRef]
- Gugler, K.; Haxhimusa, A.; Liebensteiner, M. Carbon Pricing and Emissions: Causal Effects of Britain’s Carbon Tax. Energy Econ. 2023, 121, 106655. [Google Scholar] [CrossRef]
- Zhang, Y.; Qi, L.; Lin, X.; Pan, H.; Sharp, B. Synergistic Effect of Carbon ETS and Carbon Tax under China’s Peak Emission Target: A Dynamic CGE Analysis. Sci. Total Environ. 2022, 825, 154076. [Google Scholar] [CrossRef] [PubMed]
- Liu, Y.; Zhu, J.; Tuwor, C.P.; Ling, C.; Yu, L.; Yin, K. The Impact of the COVID-19 Pandemic on Global Trade-Embodied Carbon Emissions. J. Clean. Prod. 2023, 408, 137042. [Google Scholar] [CrossRef] [PubMed]
- Qi, S.; Cheng, S. China’s National Emissions Trading Scheme: Integrating Cap, Coverage and Allocation. Clim. Policy 2018, 18 (Suppl. S1), 45–59. [Google Scholar] [CrossRef]
- Lin, B.; Wang, M. The Role of Socio-Economic Factors in China’s CO2 Emissions from Production Activities. Sustain. Prod. Consum. 2021, 27, 217–227. [Google Scholar] [CrossRef]
- Dogan, E.; Seker, F. Determinants of CO2 Emissions in the European Union: The Role of Renewable and Non-Renewable Energy. Renew. Energy 2016, 94, 429–439. [Google Scholar] [CrossRef]
- Guo, Z.; Zhang, X. Carbon Reduction Effect of Agricultural Green Production Technology: A New Evidence from China. Sci. Total Environ. 2023, 874, 162483. [Google Scholar] [CrossRef] [PubMed]
- Hu, J. Synergistic Effect of Pollution Reduction and Carbon Emission Mitigation in the Digital Economy. J. Environ. Manag. 2023, 337, 117755. [Google Scholar] [CrossRef] [PubMed]
- Ma, Q.; Tariq, M.; Mahmood, H.; Khan, Z. The Nexus between Digital Economy and Carbon Dioxide Emissions in China: The Moderating Role of Investments in Research and Development. Technol. Soc. 2022, 68, 101910. [Google Scholar] [CrossRef]
- Wang, W.; He, Y.; Lei, Y.; Gao, W.; Li, Y.; Lan, H.; Zhuang, S.; Höök, M. Digital Economy Sectors Are Key CO2 Transmission Centers in the Economic System. J. Clean. Prod. 2023, 407, 136873. [Google Scholar] [CrossRef]
- Chen, S.; Ding, D.; Shi, G.; Chen, G. Digital Economy, Industrial Structure, and Carbon Emissions: An Empirical Study Based on a Provincial Panel Data Set from China. Chin. J. Popul. Resour. Environ. 2022, 20, 316–323. [Google Scholar] [CrossRef]
- Salahuddin, M.; Alam, K.; Ozturk, I. The Effects of Internet Usage and Economic Growth on CO2 Emissions in OECD Countries: A Panel Investigation. Renew. Sustain. Energy Rev. 2016, 62, 1226–1235. [Google Scholar] [CrossRef]
- Zhou, X.; Zhou, D.; Zhao, Z.; Wang, Q. A Framework to Analyze Carbon Impacts of Digital Economy: The Case of China. Sustain. Prod. Consum. 2022, 31, 357–369. [Google Scholar] [CrossRef]
- Lange, S.; Pohl, J.; Santarius, T. Digitalization and Energy Consumption. Does ICT Reduce Energy Demand? Ecol. Econ. 2020, 176, 106760. [Google Scholar] [CrossRef]
- Lopez, L.J.R.; Aponte, G.P.; Garcia, A.R. Internet of Things Applied in Healthcare Based on Open Hardware with Low-Energy Consumption. Healthc. Inform. Res. 2019, 25, 230–235. [Google Scholar] [CrossRef]
- Feng, Y.; Hong, Z.; Zhang, Z.; Zhang, Z.; Tan, J. Interval Analysis and DEMA℡-Based Reliability Apportionment for Energy Consumption Optimization with Energy Internet. IEEE Access 2017, 5, 4769–4778. [Google Scholar] [CrossRef]
- Qiu, Z.Q.; Zhang, S.Q.; Liu, S.D.; Li, G.H. From the Digital Divide to the Connectivity Dividend Difference: A Connectivity Capital Perspective. Soc. Sci. China 2019, 40, 63–81. [Google Scholar]
- Li, Y.; Yang, X.; Ran, Q.; Wu, H.; Irfan, M.; Ahmad, M. Energy Structure, Digital Economy, and Carbon Emissions: Evidence from China. Environ. Sci. Pollut. Res. 2021, 28, 64606–64629. [Google Scholar] [CrossRef] [PubMed]
- Xu, W.; Zhou, J.; Liu, C. The Impact of Digital Economy on Urban Carbon Emissions: Based on the Analysis of Spatial Effects. Geogr. Res. 2022, 41, 111–129. [Google Scholar]
- Ehrlich, P.R.; Holdren, J.P. Impact of Population Growth. Obstet. Gynecol. Surv. 1971, 26, 769–771. [Google Scholar] [CrossRef]
- York, R.; Rosa, E.A.; Dietz, T. STIRPAT, IPAT and ImPACT: Analytic Tools for Unpacking the Driving Forces of Environmental Impacts. Ecol. Econ. 2003, 46, 351–365. [Google Scholar] [CrossRef]
- Lankao, P.R.; Tribbia, J.L.; Nychka, D. Testing Theories to Explore the Drivers of Cities’ Atmospheric Emissions. Ambio 2009, 38, 236–244. [Google Scholar] [CrossRef] [PubMed]
- Nunn, N.; Qian, N. US Food Aid and Civil Conflict. Am. Econ. Rev. 2014, 104, 1630–1666. [Google Scholar] [CrossRef]
Figure 1.
Mechanism analysis of the emission reduction effect of the digital economy.
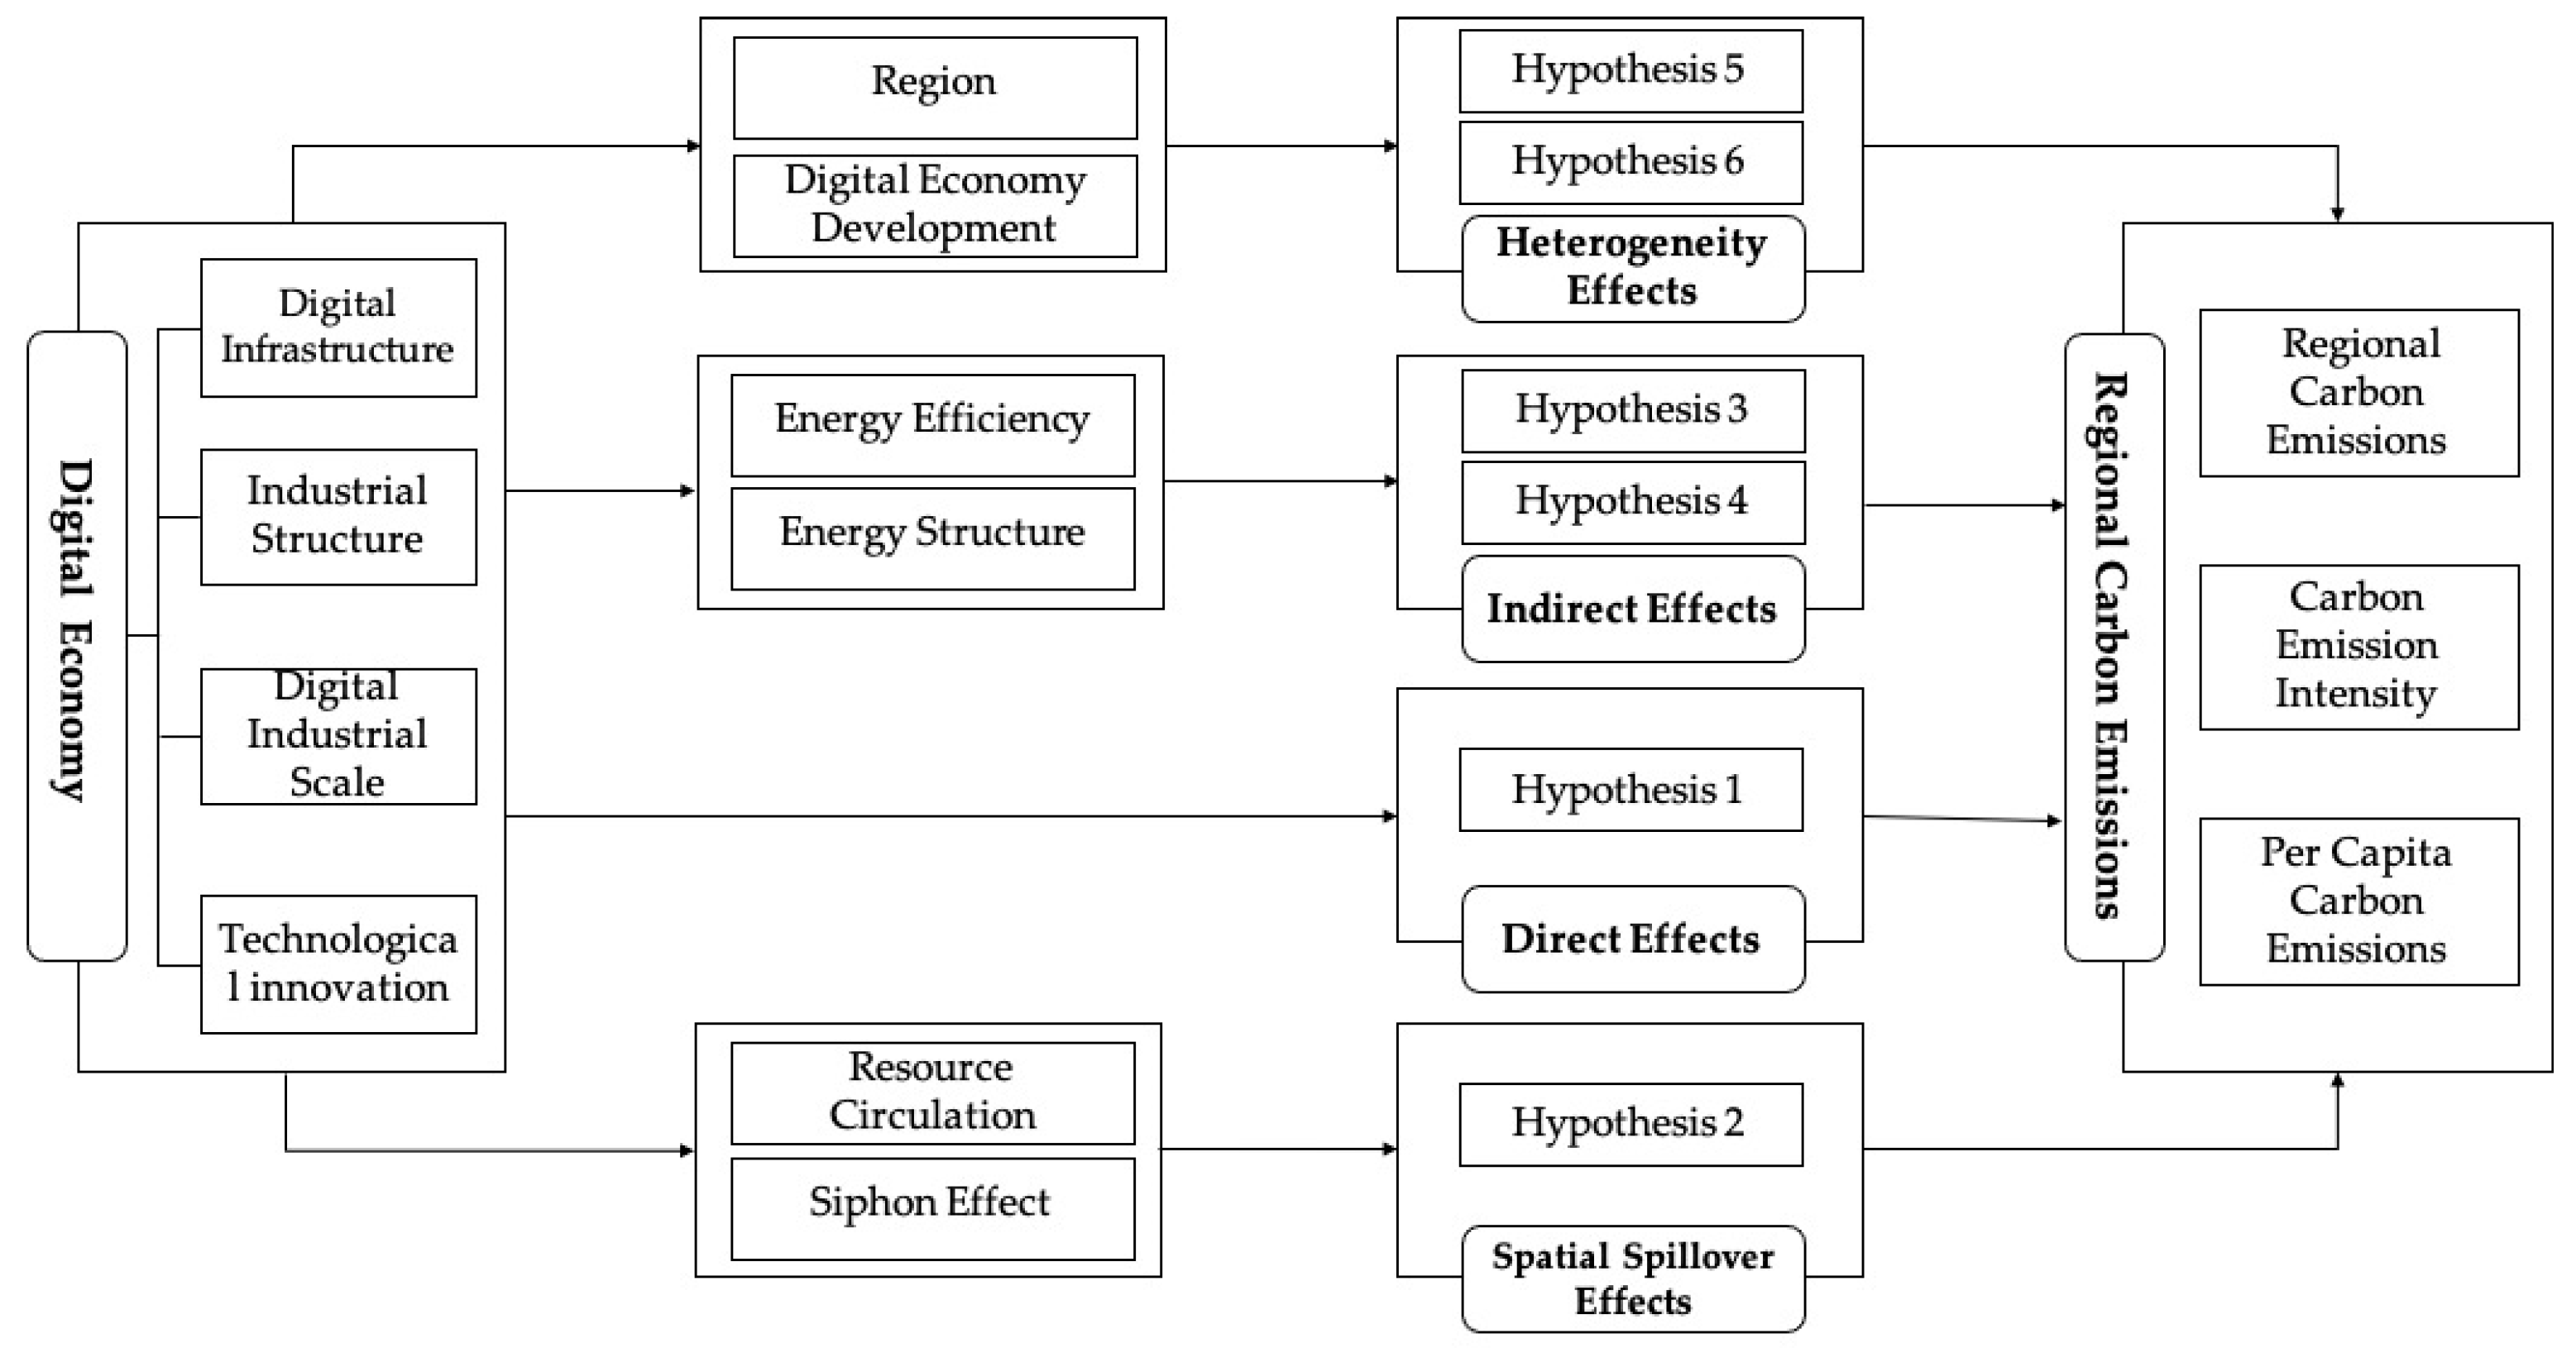
Figure 2.
Total carbon emissions of each province from 2011 to 2021.

Figure 3.
Carbon emission intensity of each province from 2011 to 2021.
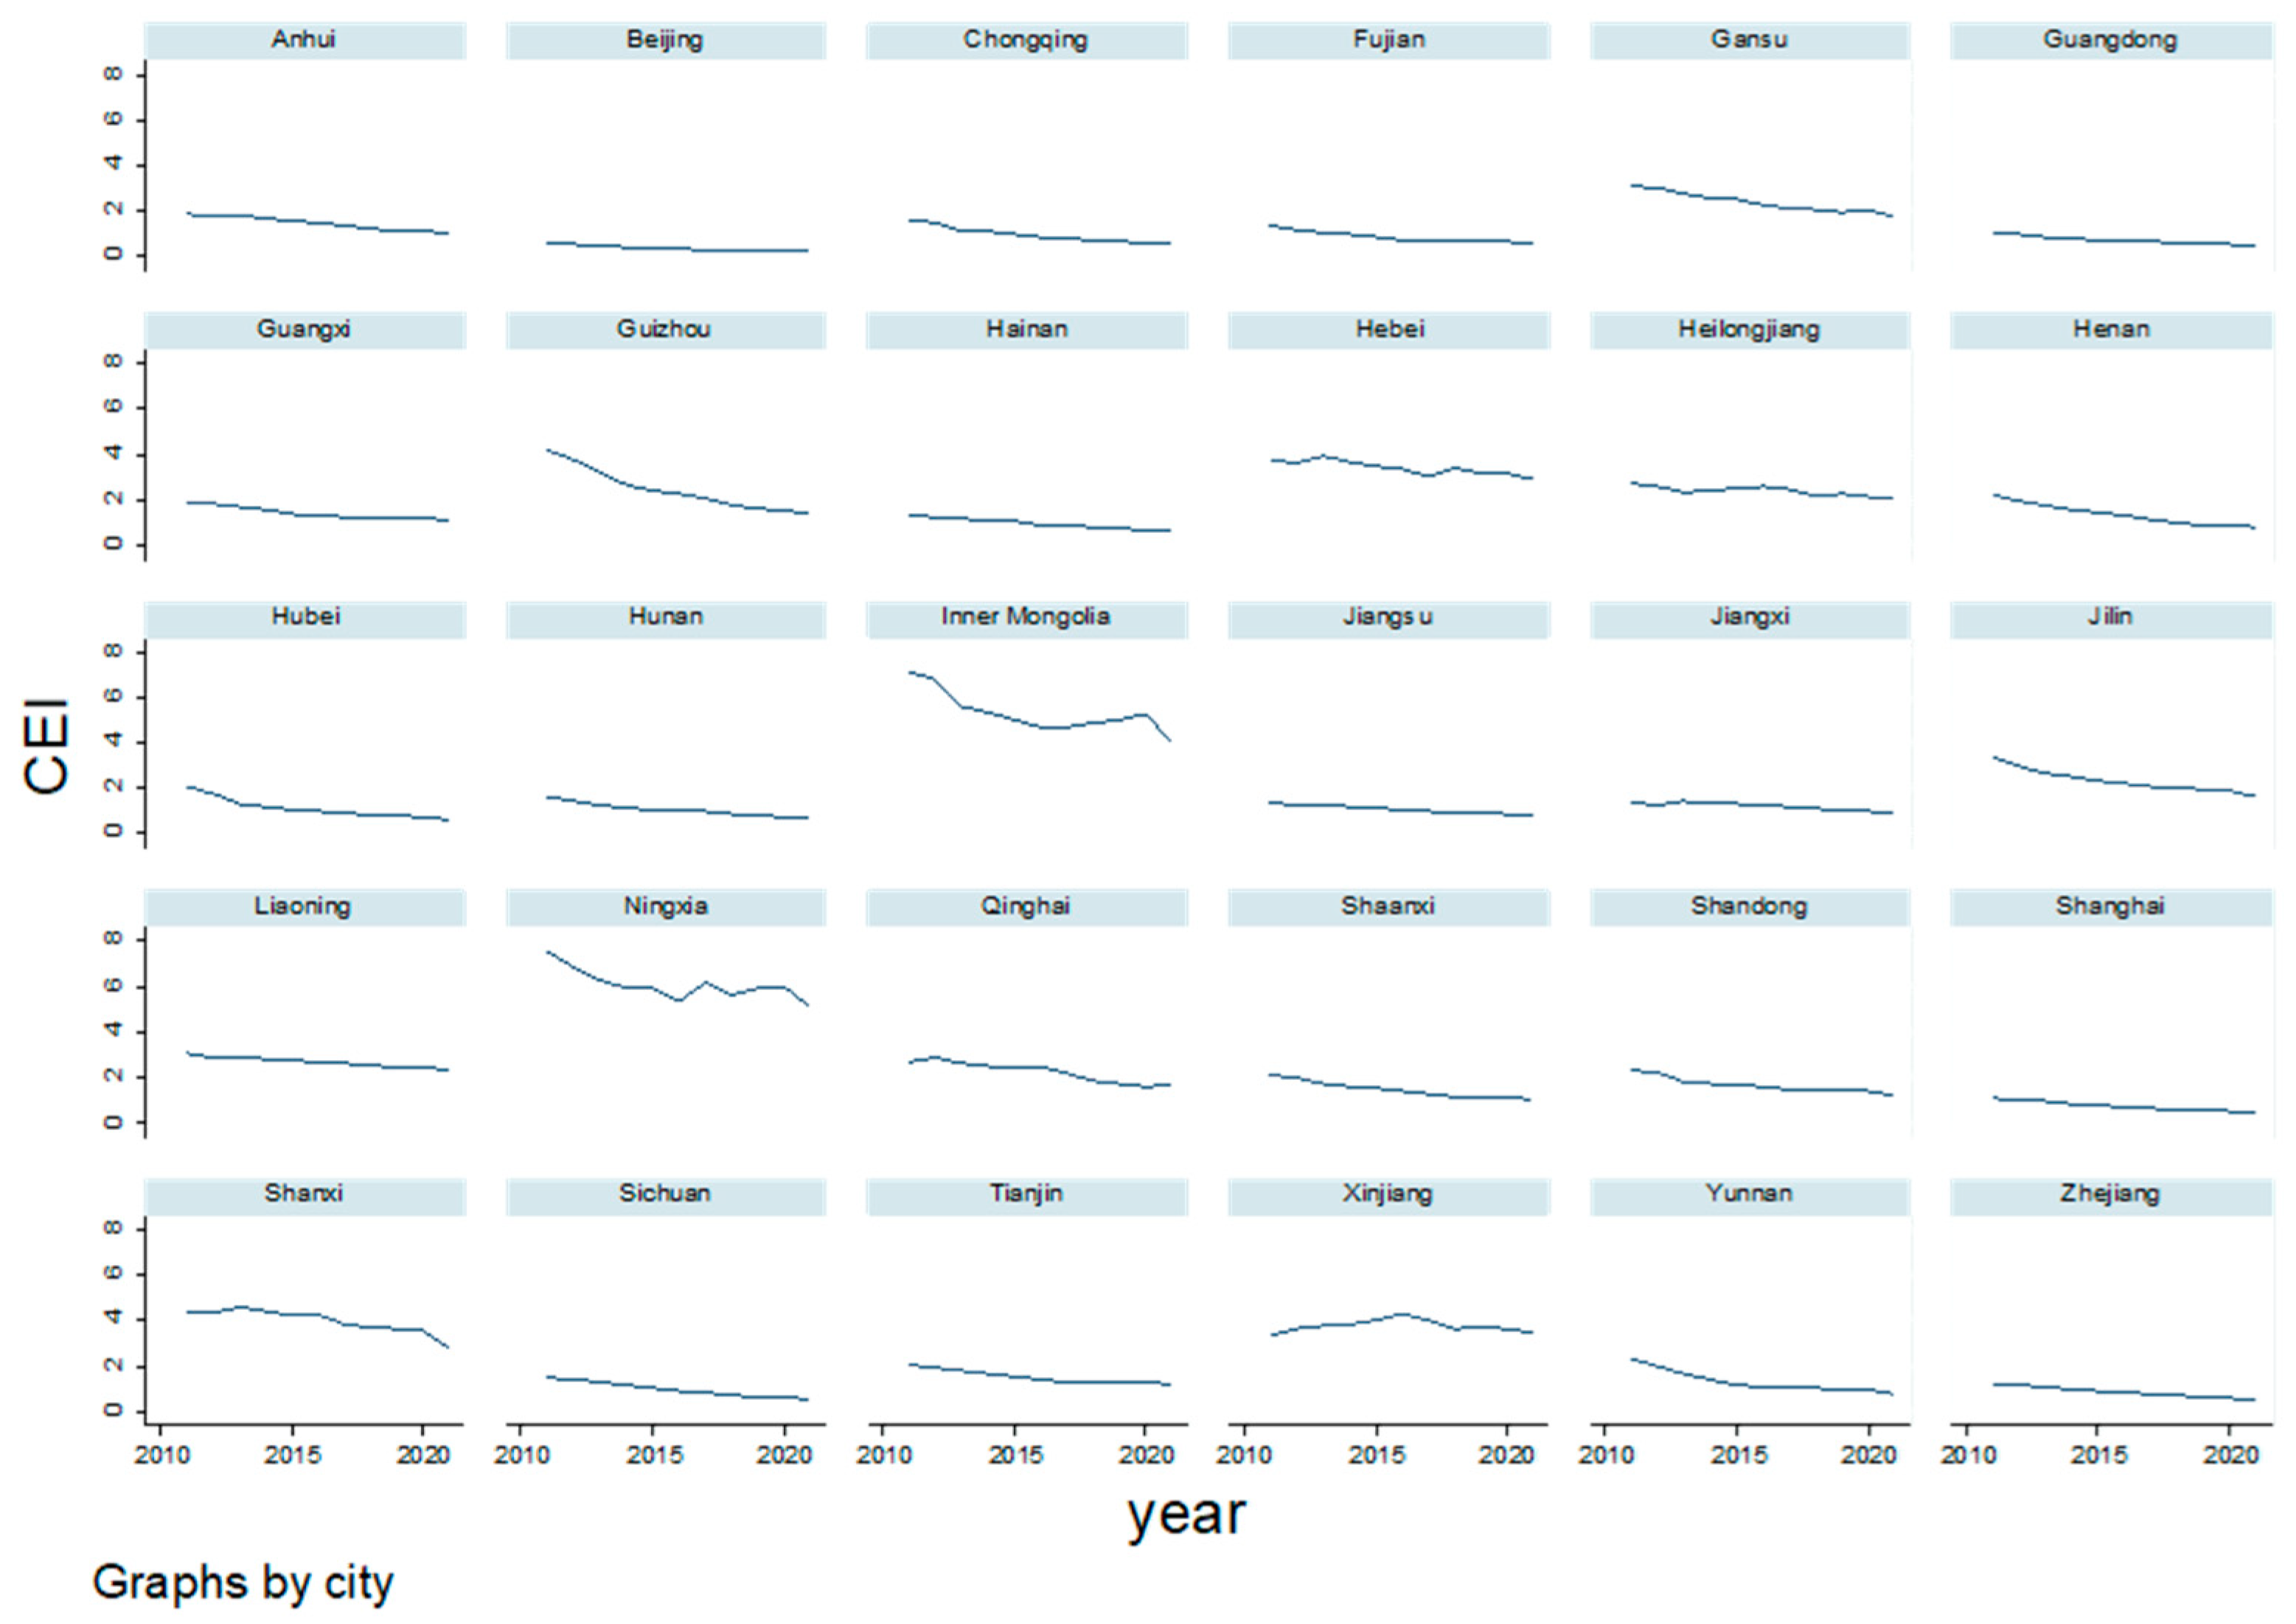
Figure 4.
The 2011–2021 digital economy index of three regions.
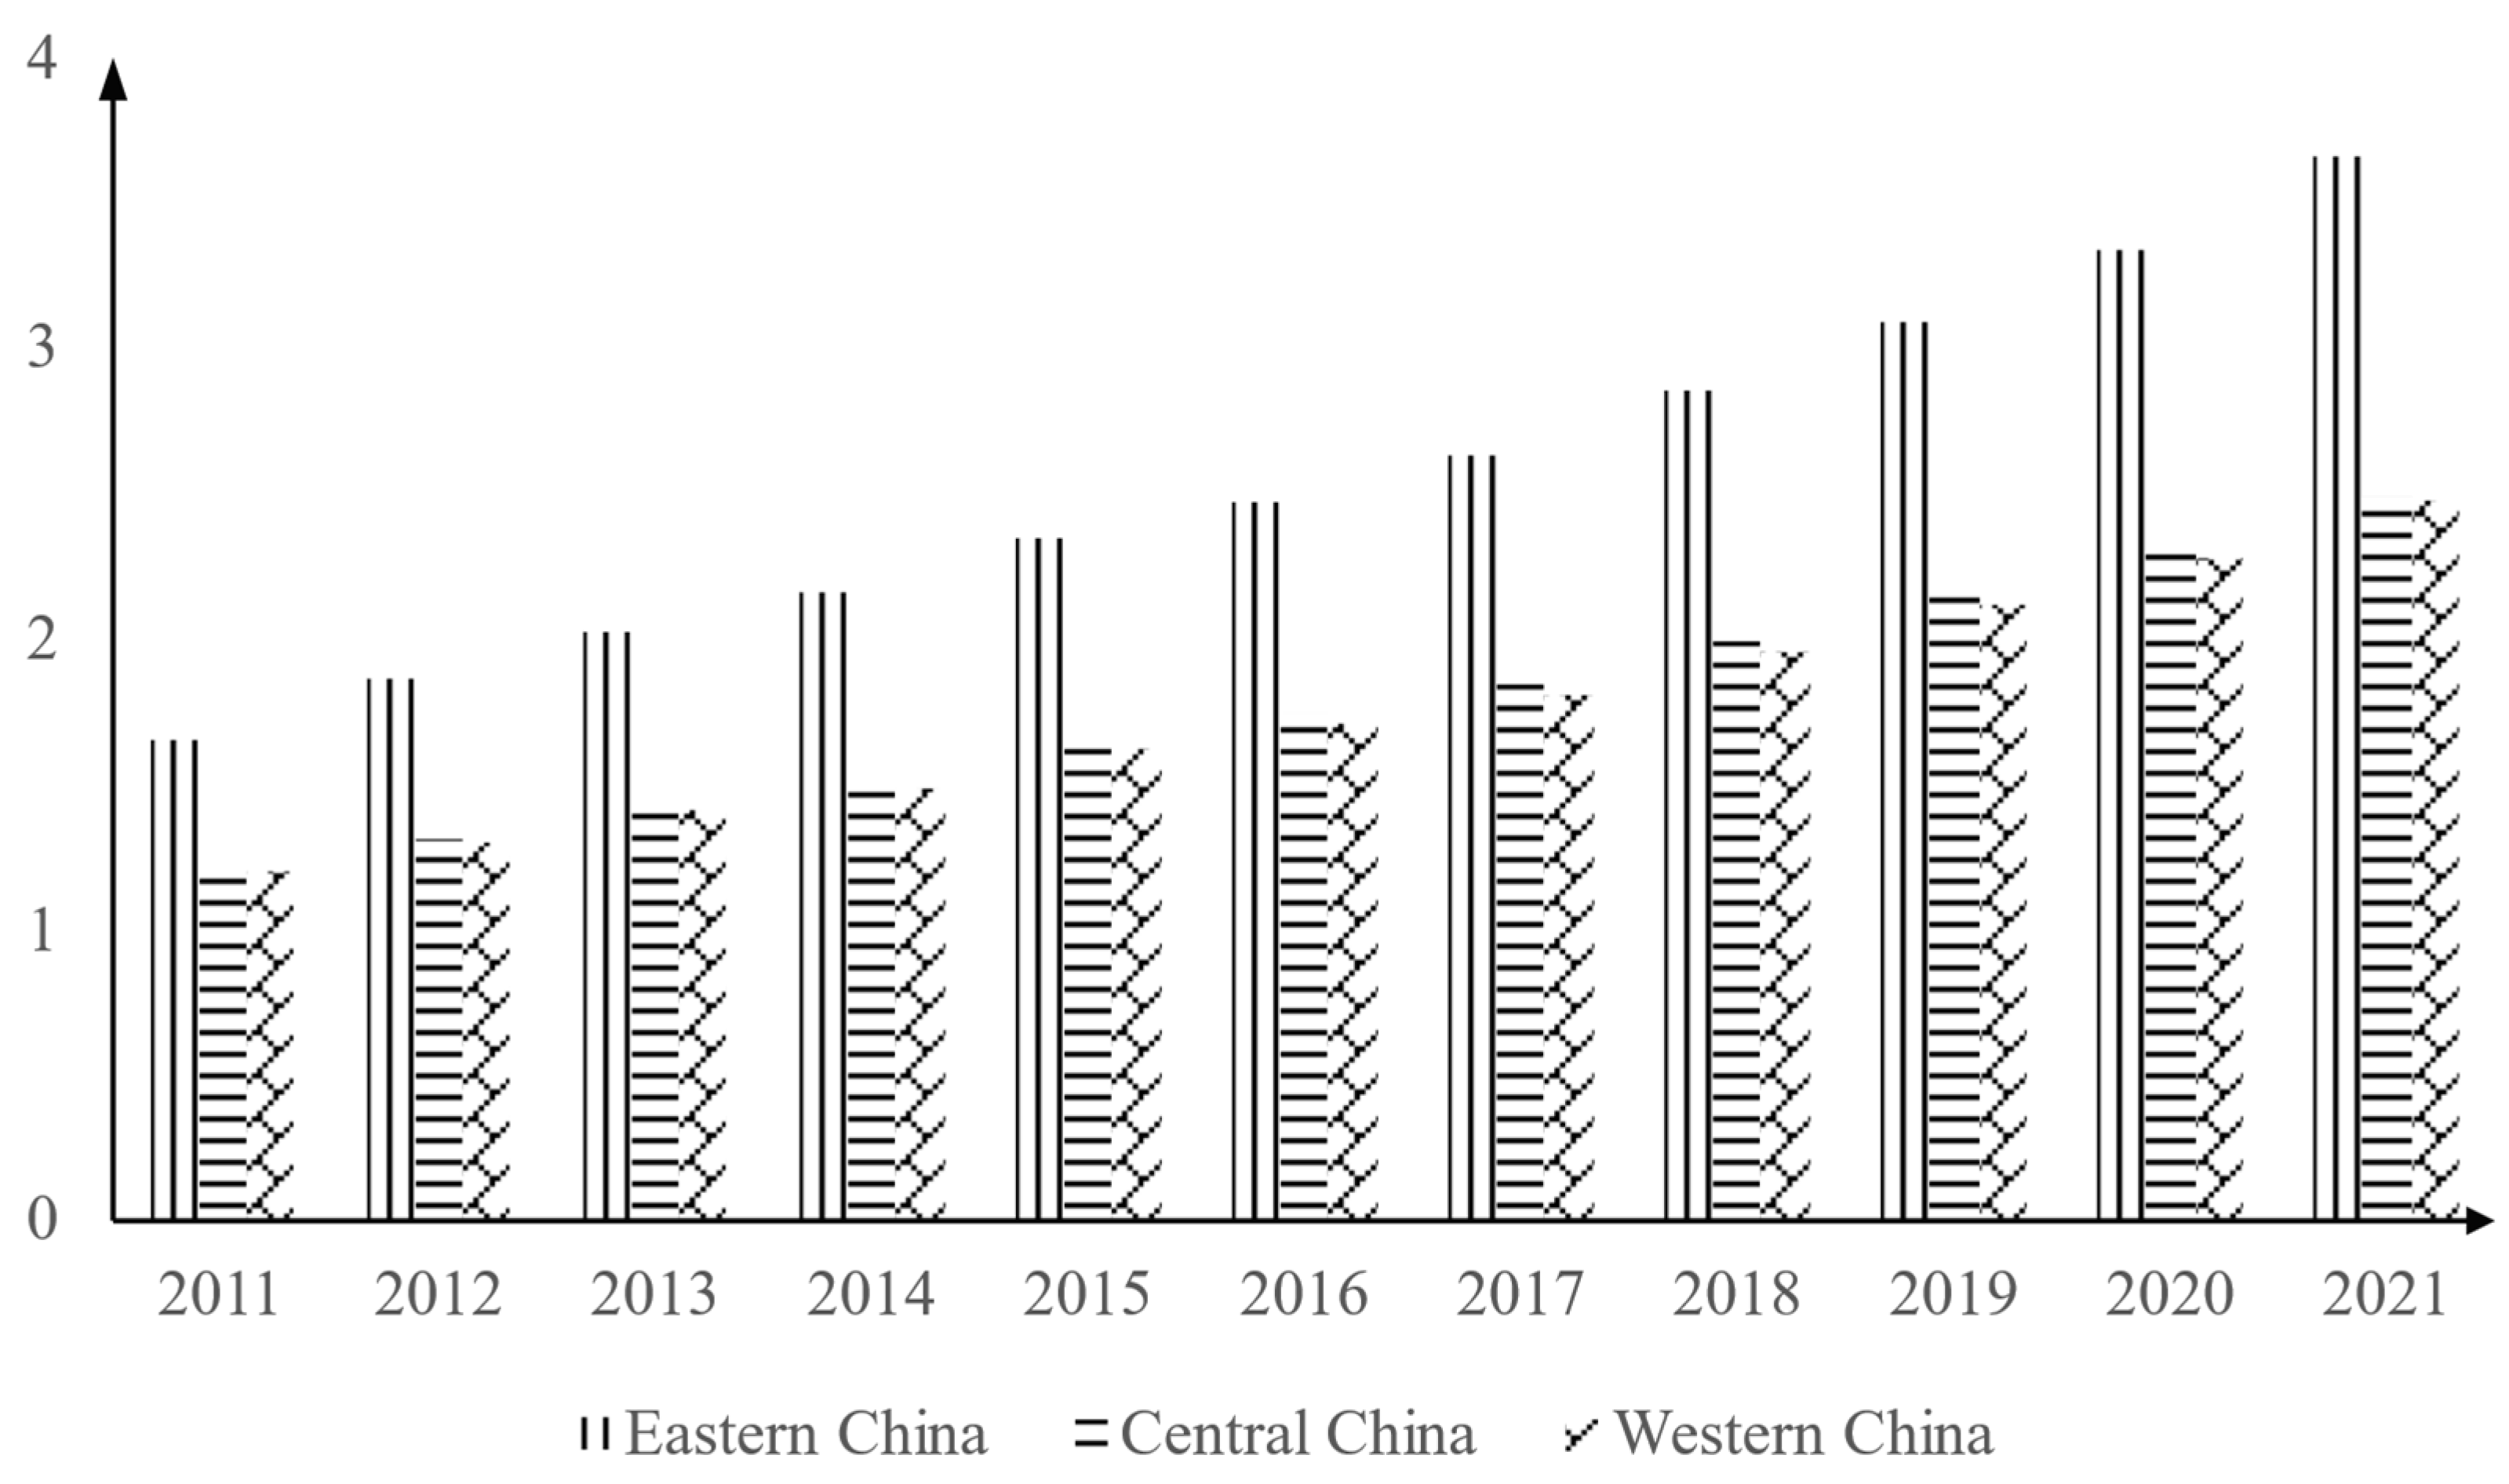
Figure 5.
Local Moran’s Index chart of carbon emissions in 2011, 2015, and 2021.
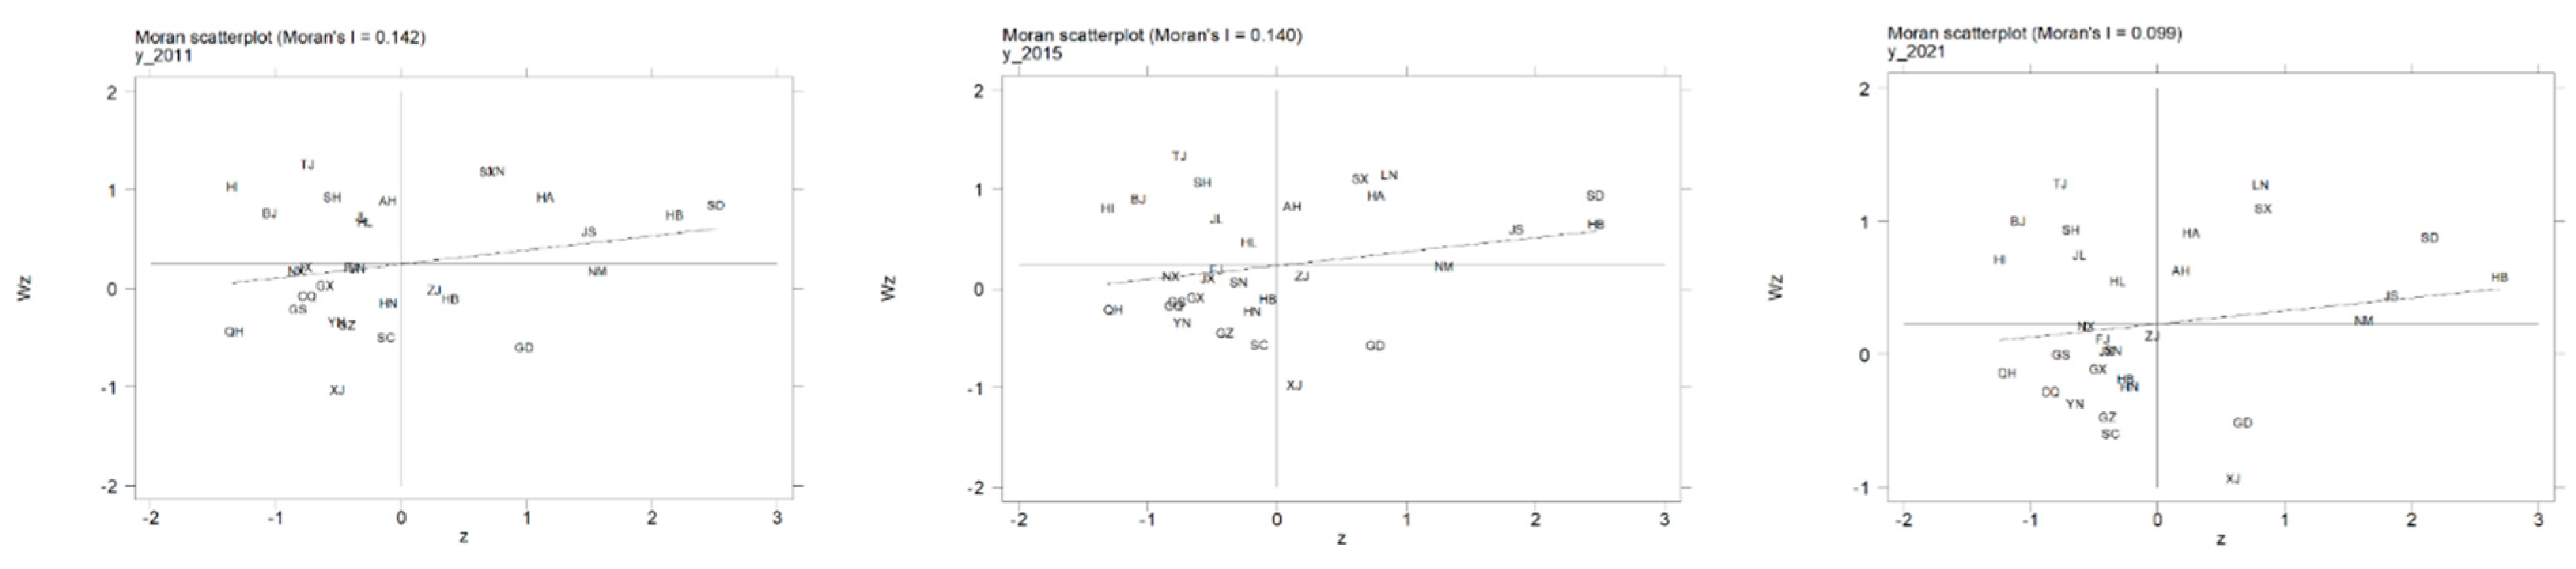
Figure 6.
Local Moran’s Index chart of digital economy in 2011, 2015, and 2021.
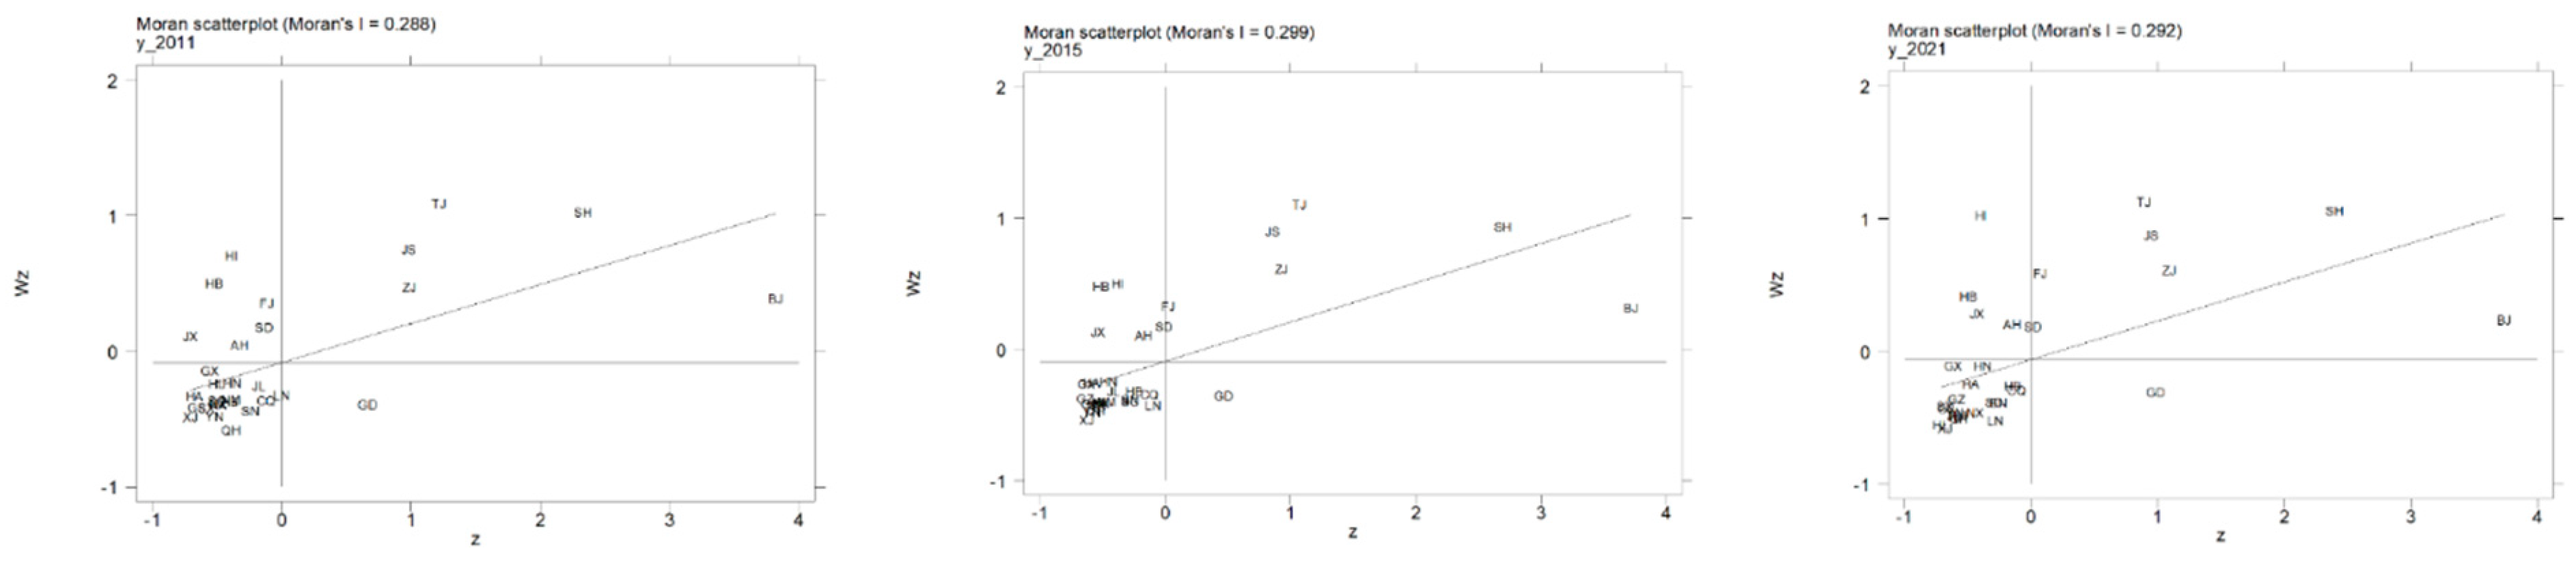

Table 1.
Energy conversion coefficients and carbon emission coefficients.
| Type | Energy Conversion Coefficient | Carbon Emission Coefficient |
|---|---|---|
| Coal | 0.7143 kg standard coal/kg | 0.7476 tC/t standard coal |
| Coke | 0.9714 kg standard coal/kg | 0.1128 tC/t standard coal |
| Crude Oil | 1.4286 kg standard coal/kg | 0.5854 tC/t standard coal |
| Fuel Oil | 1.4286 kg standard coal/kg | 0.6176 tC/t standard coal |
| Gasoline | 1.4714 kg standard coal/kg | 0.5532 tC/t standard coal |
| Kerosene | 1.4714 kg standard coal/kg | 0.3416 tC/t standard coal |
| Diesel | 1.4571 kg standard coal/kg | 0.5913 tC/t standard coal |
| Natural Gas | 13.3000 t standard coal/104 m3 | 0.4479 tC/t standard coal |
| Electric power | 1.2290 t standard coal/104 kWh | 2.2132 tC/t standard coal |
Table 2.
Bartlett’s sphericity test and KMO test.
| Type | Indicator | Result |
|---|---|---|
| KMO Test | KMO value | 0.73 |
| Bartlett’s Sphericity Test | 1152.51 | |
| DF | 6 | |
| value | 0.00 |
Table 3.
The weight of digital economy measurement.
| Primary Indicator | Weight | Secondary Indicator | Function | Weight |
|---|---|---|---|---|
| Digital Infrastructure | 0.2523 | Internet access traffic per capita | + | 0.2354 |
| Internet access ports per capita | + | 0.0537 | ||
| Cable length per square kilometer | + | 0.1914 | ||
| Number of domain names per square kilometer | + | 0.4657 | ||
| Computer use per hundred people | + | 0.0538 | ||
| Industrial Structure | 0.2729 | Added value of software and information technology service industry as a percentage of GDP | + | 0.3588 |
| Proportion of information transmission, software, and information technology service industry to employed persons in urban units | + | 0.3402 | ||
| Digital financial inclusion index | + | 0.3010 | ||
| Digital Industrial Scale | 0.2551 | Technology market turnover | + | 0.1982 |
| Software product revenue | + | 0.1666 | ||
| Software business revenue | + | 0.1663 | ||
| Information technology service revenue | + | 0.1874 | ||
| E-commerce purchases | + | 0.1320 | ||
| E-commerce sales | + | 0.1246 | ||
| Proportion of enterprises with e-commerce activities | + | 0.0249 | ||
| Technological innovation | 0.2197 | R&D expenses | + | 0.3542 |
| Number of R&D projects | + | 0.3404 | ||
| Number of patents related to the digital economy | + | 0.3054 |
Table 4.
Provincial digital economy index from 2011 to 2021.
| Region | 2011 | 2012 | 2013 | 2014 | 2015 | 2016 | 2017 | 2018 | 2019 | 2020 | 2021 |
|---|---|---|---|---|---|---|---|---|---|---|---|
| Beijing | 2.33 | 2.68 | 2.95 | 3.19 | 3.58 | 3.81 | 4.10 | 4.39 | 4.88 | 5.40 | 6.10 |
| Tianjin | 1.73 | 1.95 | 2.09 | 2.25 | 2.40 | 2.48 | 2.54 | 2.79 | 3.02 | 3.34 | 3.69 |
| Hebei | 1.12 | 1.24 | 1.34 | 1.39 | 1.49 | 1.57 | 1.67 | 1.80 | 1.95 | 2.08 | 2.28 |
| Shanxi | 1.14 | 1.23 | 1.32 | 1.37 | 1.45 | 1.51 | 1.59 | 1.72 | 1.86 | 1.99 | 2.18 |
| Inner Mongolia | 1.14 | 1.24 | 1.35 | 1.40 | 1.51 | 1.59 | 1.66 | 1.79 | 1.94 | 2.09 | 2.33 |
| Liaoning | 1.46 | 1.57 | 1.71 | 1.78 | 1.87 | 1.87 | 1.96 | 2.06 | 2.20 | 2.35 | 2.52 |
| Jilin | 1.19 | 1.27 | 1.39 | 1.43 | 1.54 | 1.65 | 1.75 | 1.85 | 1.96 | 2.07 | 2.22 |
| Heilongjiang | 1.16 | 1.25 | 1.34 | 1.41 | 1.48 | 1.57 | 1.65 | 1.72 | 1.85 | 1.96 | 2.07 |
| Shanghai | 1.98 | 2.32 | 2.52 | 2.83 | 3.09 | 3.31 | 3.51 | 3.66 | 4.01 | 4.39 | 4.89 |
| Jiangsu | 1.67 | 1.90 | 2.06 | 2.18 | 2.34 | 2.45 | 2.58 | 2.90 | 3.16 | 3.44 | 3.74 |
| Zhejiang | 1.67 | 1.94 | 2.09 | 2.17 | 2.41 | 2.49 | 2.66 | 2.94 | 3.25 | 3.56 | 3.89 |
| Anhui | 1.19 | 1.34 | 1.45 | 1.57 | 1.71 | 1.79 | 1.90 | 2.05 | 2.24 | 2.41 | 2.64 |
| Fujian | 1.32 | 1.49 | 1.63 | 1.73 | 1.91 | 2.03 | 2.19 | 2.39 | 2.54 | 2.68 | 2.92 |
| Jiangxi | 1.09 | 1.20 | 1.31 | 1.39 | 1.51 | 1.56 | 1.69 | 1.86 | 2.04 | 2.19 | 2.38 |
| Shandong | 1.28 | 1.45 | 1.63 | 1.72 | 1.82 | 1.94 | 2.07 | 2.25 | 2.33 | 2.53 | 2.85 |
| Henan | 1.10 | 1.20 | 1.30 | 1.36 | 1.46 | 1.54 | 1.64 | 1.79 | 1.93 | 2.07 | 2.29 |
| Hubei | 1.18 | 1.31 | 1.45 | 1.54 | 1.67 | 1.78 | 1.87 | 2.03 | 2.23 | 2.39 | 2.63 |
| Hunan | 1.16 | 1.28 | 1.37 | 1.44 | 1.53 | 1.60 | 1.68 | 1.85 | 2.02 | 2.20 | 2.43 |
| Guangdong | 1.57 | 1.73 | 1.89 | 1.98 | 2.12 | 2.30 | 2.53 | 2.86 | 3.15 | 3.43 | 3.77 |
| Guangxi | 1.11 | 1.21 | 1.29 | 1.35 | 1.43 | 1.51 | 1.56 | 1.72 | 1.89 | 2.05 | 2.26 |
| Hainan | 1.17 | 1.28 | 1.36 | 1.48 | 1.62 | 1.70 | 1.79 | 2.00 | 2.15 | 2.24 | 2.49 |
| Chongqing | 1.24 | 1.37 | 1.50 | 1.60 | 1.76 | 1.86 | 1.98 | 2.18 | 2.34 | 2.52 | 2.81 |
| Sichuan | 1.18 | 1.31 | 1.46 | 1.55 | 1.69 | 1.77 | 1.88 | 2.02 | 2.17 | 2.36 | 2.57 |
| Guizhou | 1.09 | 1.17 | 1.25 | 1.32 | 1.42 | 1.51 | 1.59 | 1.75 | 1.93 | 2.10 | 2.27 |
| Yunnan | 1.09 | 1.18 | 1.28 | 1.33 | 1.44 | 1.53 | 1.61 | 1.74 | 1.92 | 2.08 | 2.26 |
| Shaanxi | 1.22 | 1.33 | 1.46 | 1.56 | 1.69 | 1.82 | 1.90 | 2.10 | 2.30 | 2.47 | 2.66 |
| Gansu | 1.06 | 1.17 | 1.26 | 1.32 | 1.43 | 1.47 | 1.55 | 1.68 | 1.84 | 1.97 | 2.16 |
| Qinghai | 1.10 | 1.18 | 1.26 | 1.31 | 1.45 | 1.55 | 1.63 | 1.82 | 1.97 | 2.14 | 2.38 |
| Ningxia | 1.11 | 1.23 | 1.32 | 1.40 | 1.51 | 1.60 | 1.73 | 1.91 | 2.06 | 2.23 | 2.48 |
| Xinjiang | 1.09 | 1.20 | 1.28 | 1.34 | 1.44 | 1.48 | 1.53 | 1.66 | 1.83 | 2.00 | 2.23 |
Table 5.
Descriptive statistics for the main variables.
| Variables | (1) Symbol | (2) Mean | (3) S.D. | (4) Min | (5) Max |
|---|---|---|---|---|---|
| Total Carbon Emissions | lnCE | 10.24 | 0.76 | 8.08 | 11.66 |
| Digital Economy Index | lnDE | 0.67 | 0.32 | 0.10 | 1.80 |
| Economy Level | lnpGDP | 10.83 | 0.45 | 9.68 | 12.14 |
| Education Level | lnEL | 7.86 | 0.29 | 6.98 | 8.63 |
| Consumption Level | lnCL | 9.68 | 0.38 | 8.77 | 10.79 |
| Opening Level | lnOE | 2.44 | 0.64 | 1.02 | 6.61 |
| Energy Structure | EM | 0.27 | 0.80 | 0.04 | 9.42 |
| Energy Efficiency | EE | 0.87 | 0.88 | 0.03 | 4.11 |
| Population | lnPOP | 5.47 | 1.29 | 2.06 | 8.28 |
| Digital Infrastructure | DE1 | 2.05 | 0.91 | 1.06 | 5.88 |
| Industrial Structure | DE2 | 2.69 | 0.88 | 1.09 | 6.88 |
| Industrial Scale | DE3 | 1.52 | 0.67 | 1.01 | 6.99 |
| Technology Innovation | DE4 | 2.02 | 1.03 | 1.07 | 6.19 |
Table 6.
The Impact of the digital economy on carbon emissions.
| Variables | (1) | (2) | (3) | (4) | (5) | (6) |
|---|---|---|---|---|---|---|
| FE1 | FE2 | FE3 | FE4 | FE5 | FE6 | |
| lnDE | −0.51 *** | −0.57 *** | −1.20 *** | −1.07 *** | −1.10 *** | −1.09 *** |
| (0.17) | (0.18) | (0.19) | (0.21) | (0.22) | (0.22) | |
| lnpGDP | 0.10 | 0.02 | 0.05 | 0.01 | 0.01 | |
| (0.10) | (0.10) | (0.11) | (0.12) | (0.12) | ||
| lnPOP | 1.46 *** | 1.37 *** | 1.40 *** | 1.38 *** | ||
| (0.22) | (0.23) | (0.23) | (0.23) | |||
| lnEL | 0.12 | 0.18 * | 0.17 * | |||
| (0.08) | (0.09) | (0.09) | ||||
| lnCL | 0.23 | 0.25 | ||||
| (0.15) | (0.15) | |||||
| lnOE | 0.02 | |||||
| (0.01) | ||||||
| Constant | 10.28 *** | 9.22 *** | 2.24 | 2.57 * | 3.53 ** | 3.75 ** |
| (0.04) | (1.10) | (1.49) | (1.50) | (1.63) | (1.65) | |
| Province FE | Yes | Yes | Yes | Yes | Yes | Yes |
| Year FE | Yes | Yes | Yes | Yes | Yes | Yes |
| Adjusted R2 | 0.25 | 0.25 | 0.35 | 0.35 | 0.36 | 0.36 |
Note: *, **, and *** indicate significance at the levels of 10%, 5%, and 1%, respectively. FE denotes fixed effects. Standard errors are shown in parentheses.
Table 7.
The Impact of the digital economy primary index on carbon emissions.
| Variables | (1) | (2) | (3) | (4) |
|---|---|---|---|---|
| FE1 | FE2 | FE3 | FE4 | |
| lnDE1 | 0.21 ** | |||
| (0.10) | ||||
| lnDE2 | −0.59 *** | |||
| (0.13) | ||||
| lnDE3 | −0.59 *** | |||
| (0.07) | ||||
| lnDE4 | −0.14 * | |||
| (0.08) | ||||
| lnpGDP | −0.24 ** | −0.15 | 0.05 | −0.19 * |
| (0.11) | (0.11) | (0.11) | (0.11) | |
| lnPOP | 0.64 *** | 0.98 *** | 1.05 *** | 0.88 *** |
| (0.20) | (0.20) | (0.19) | (0.22) | |
| lnEL | 0.34 *** | 0.23 ** | 0.04 | 0.32 *** |
| (0.09) | (0.09) | (0.09) | (0.09) | |
| lnCL | 0.17 | 0.11 | 0.42 *** | 0.17 |
| (0.16) | (0.15) | (0.15) | (0.16) | |
| lnOE | 0.02 | 0.02 | 0.02 | 0.01 |
| (0.02) | (0.02) | (0.01) | (0.02) | |
| Constant | 8.07 *** | 5.83 *** | 7.38 *** | 6.51 *** |
| (1.51) | (1.52) | (1.37) | (1.64) | |
| Province FE | Yes | Yes | Yes | Yes |
| Year FE | Yes | Yes | Yes | Yes |
| Adjusted R2 | 0.32 | 0.35 | 0.43 | 0.31 |
Note: *, **, and *** indicate significance at the levels of 10%, 5%, and 1%, respectively. FE denotes fixed effects. Standard errors are shown in parentheses.
Table 8.
Test using carbon emission intensity and per capita carbon emissions as dependent variables.
Table 8.
Test using carbon emission intensity and per capita carbon emissions as dependent variables.
| Variables | (1) | (2) | (3) |
|---|---|---|---|
| FE1 | FE2 | FE3 | |
| lnDE | −0.23 ** | −0.21 ** | |
| (0.09) | (0.09) | ||
| lnDF | −0.03 ** | ||
| (0.02) | |||
| lnpGDP | −0.95 *** | 0.04 | 0.02 |
| (0.11) | (0.11) | (0.09) | |
| lnPOP | −0.28 | −0.27 | 0.20 ** |
| (0.20) | (0.20) | (0.09) | |
| lnEL | 0.19 ** | 0.18 ** | 0.21 *** |
| (0.07) | (0.07) | (0.07) | |
| lnCL | 0.13 | 0.13 | −0.03 |
| (0.09) | (0.09) | (0.11) | |
| lnOE | 0.02 | 0.02 | 0.02 |
| (0.01) | (0.02) | (0.01) | |
| Constant | 9.52 *** | 0.37 | 7.75 *** |
| (1.32) | (1.32) | (0.70) | |
| Province FE | Yes | Yes | Yes |
| Year FE | Yes | Yes | Yes |
| Adjusted R2 | 0.87 | 0.18 | 0.27 |
Note: **, and *** indicate significance at the levels of 10%, 5%, and 1%, respectively. FE denotes fixed effects. Standard errors are shown in parentheses.
Table 9.
Instrumental variables test.
| Variables | (1) | (2) |
|---|---|---|
| IV1 | IV2 | |
| lnDE | −1.41 *** | −9.45 ** |
| (0.26) | (3.80) | |
| lnpGDP | 0.16 | 1.87 ** |
| (0.12) | (0.94) | |
| lnPOP | 1.61 *** | 6.36 *** |
| (0.30) | (2.21) | |
| lnEL | 0.15 | −1.10 * |
| (0.09) | (0.62) | |
| lnCL | −0.34 ** | −0.74 * |
| (0.14) | (0.39) | |
| lnOE | 0.01 | −0.04 |
| (0.01) | (0.04) | |
| Constant | 1.48 | −30.11 * |
| (3.54) | (15.75) | |
| Province FE | Yes | Yes |
| Year FE | Yes | Yes |
| Adjusted R2 | 0.99 | 0.93 |
Note: *, **, and *** indicate significance at the levels of 10%, 5%, and 1%, respectively. FE denotes fixed effects. Standard errors are shown in parentheses.
Table 10.
Test of regional heterogeneity.
| Variables | (1) | (2) | (3) |
|---|---|---|---|
| Eastern | Central | Western | |
| lnDE | −1.07 ** | −0.42 | 0.36 |
| (0.47) | (0.55) | (0.23) | |
| lnpGDP | −0.16 | −0.67 ** | −0.56 ** |
| (0.20) | (0.28) | (0.23) | |
| lnPOP | 3.15 *** | 2.76 *** | 3.50 *** |
| (0.41) | (0.61) | (0.52) | |
| lnEL | 0.29 * | 0.21 | 0.16 |
| (0.16) | (0.24) | (0.18) | |
| lnCL | −1.18 *** | −0.58 | −0.00 |
| (0.24) | (0.35) | (0.22) | |
| lnOE | −0.03 | 0.08 *** | 0.09 *** |
| (0.01) | (0.03) | (0.03) | |
| Constant | 1.51 | 5.49 * | 7.91 * |
| (2.28) | (2.87) | (4.61) | |
| Province FE | Yes | Yes | Yes |
| Year FE | Yes | Yes | Yes |
| Adjusted R2 | 0.60 | 0.59 | 0.69 |
Note: *, **, and *** indicate significance at the levels of 10%, 5%, and 1%, respectively. FE denotes fixed effects. Standard errors are shown in parentheses.
Table 11.
Test of digital economy level heterogeneity.
| Variables | (1) | (2) | (3) |
|---|---|---|---|
| High Level | Medium Level | Low Level | |
| lnDE | −1.26 ** | −0.61 ** | 0.54 |
| (0.52) | (0.24) | (0.60) | |
| lnpGDP | 0.11 | 0.10 | 0.06 |
| (0.16) | (0.22) | (0.20) | |
| lnPOP | −0.48 | 1.44 *** | 1.99 *** |
| (0.37) | (0.37) | (0.35) | |
| lnEL | 0.39 *** | 0.03 | −0.49 *** |
| (0.09) | (0.14) | (0.17) | |
| lnCL | 0.32 ** | −0.56 *** | −0.37 |
| (0.13) | (0.18) | (0.23) | |
| lnOE | −0.02 | −0.01 | 0.06 * |
| (0.03) | (0.02) | (0.03) | |
| Constant | 5.94 ** | 1.55 | 4.45 * |
| (2.93) | (3.53) | (2.60) | |
| Province FE | Yes | Yes | Yes |
| Year FE | Yes | Yes | Yes |
| Adjusted R2 | 0.38 | 0.54 | 0.64 |
Note: *, **, and *** indicate significance at the levels of 10%, 5%, and 1%, respectively. FE denotes fixed effects. Standard errors are shown in parentheses.
Table 12.
The Results of mechanism analysis.
| Variables | Model (1) | Model (2) | Model (3) | Model (4) |
|---|---|---|---|---|
| lnDE | 1.13 *** | −0.95 *** | 0.22 ** | 0.20 ** |
| (0.26) | (0.28) | (0.10) | (0.091) | |
| lnEM | -- | -- | −0.21 *** | |
| (0.02) | ||||
| lnpGDP | 1.05 *** | −1.76 *** | 0.15 | 0.35 *** |
| (0.26) | (0.28) | (0.10) | (0.09) | |
| lnPOP | 0.05 | −0.17 | 0.66 *** | 0.69 *** |
| (0.47) | (0.51) | (0.17) | (0.16) | |
| lnEL | −0.65 *** | 0.77 *** | 0.07 | 0.02 |
| (0.17) | (0.18) | (0.06) | (0.06) | |
| lnCL | −0.99 *** | 1.05 *** | −0.10 | −0.14 * |
| (0.25) | (0.27) | (0.09) | (0.08) | |
| lnOE | −0.01 | 0.04 | 0.02 | 0.01 |
| (0.04) | (0.04) | (0.01) | (0.01) | |
| lnEE | -- | -- | -- | 0.23 *** |
| (0.02) | ||||
| Constant | 0.47 | 3.71 | 4.74 *** | 3.76 *** |
| (3.39) | (3.71) | (1.26) | (1.15) | |
| Adjusted R2 | 0.53 | 0.66 | 0.44 | 0.54 |
Note: *, **, and *** indicate significance at the levels of 10%, 5%, and 1%, respectively. Standard errors are shown in parentheses.
Table 13.
The results of the overall Moran’s Index.
| Year | 2011 | 2012 | 2013 | 2014 | 2015 | 2016 |
|---|---|---|---|---|---|---|
| CE | 0.14 * | 0.12 * | 0.16 * | 0.15 * | 0.14 * | 0.12 * |
| (1.47) | (1.47) | (1.47) | (1.55) | (1.46) | (1.32) | |
| DE | 0.28 *** | 0.32 *** | 0.32 *** | 0.31 *** | 0.29 *** | 0.27 *** |
| (3.05) | (3.34) | (3.30) | (3.26) | (3.16) | (2.97) | |
| Year | 2017 | 2018 | 2019 | 2020 | 2021 | |
| CE | 0.09 | 0.11 * | 0.11 | 0.11 | 0.09 | |
| (1.08) | (1.28) | (1.19) | (1.23) | (1.12) | ||
| DE | 0.27 *** | 0.29*** | 0.28 *** | 0.29 *** | 0.29 *** | |
| (2.90) | (3.09) | (3.01) | (3.07) | (3.05) |
Note: * and *** indicate significance at the levels of 10% and 1%, respectively. Z statistic shown in parentheses.
Table 14.
Spatial Durbin model regression of adjacency matrix.
| Variables | (1) x | (2) Wx | (3) Direct | (4) Indirect | (5) Total |
|---|---|---|---|---|---|
| lnDE | −0.90 *** | 1.08 * | −0.98 *** | 1.13 *** | 0.15 |
| (0.18) | (0.22) | (0.18) | (0.20) | (0.13) | |
| lnpGDP | −0.13 | 0.32 * | −0.15 | 0.29 * | 0.13 |
| (0.11) | (0.18) | (0.11) | (0.15) | (0.13) | |
| lnPOP | 1.28 *** | −0.72 ** | 1.36 *** | −0.93 *** | 0.43 ** |
| (0.23) | (0.31) | (0.23) | (0.27) | (0.19) | |
| lnEL | 0.27 *** | −0.28 ** | 0.20 ** | −0.21 ** | −0.01 |
| (0.08) | (0.11) | (0.08) | (0.10) | (0.08) | |
| lnCL | −0.07 | −0.02 | −0.07 | −0.01 | −0.07 |
| (0.13) | (0.16) | (0.14) | (0.16) | (0.10) | |
| lnOE | 0.08 | 0.02 | 0.07 | 0.01 | 0.02 |
| (0.01) | (0.03) | (0.01) | (0.02) | (0.02) | |
| rho | −0.29 *** | ||||
| (0.07) | |||||
| sigma2_e | 0.01 *** | ||||
| (0.00) |
Note: *, **, and *** indicate significance at the levels of 10%, 5%, and 1%, respectively. Standard errors are shown in parentheses.
Table 15.
Spatial Durbin model regression of geographical weight matrix.
| Variables | (1) x | (2) Wx | (3) Direct | (4) Indirect | (5) Total |
|---|---|---|---|---|---|
| lnDE | −1.07 *** | 1.15 *** | −1.13 *** | 1.20 *** | 0.07 |
| (0.19) | (0.26) | (0.20) | (0.23) | (0.14) | |
| lnpGDP | −0.06 | 0.44 ** | −0.09 | 0.36 ** | 0.28 |
| (0.11) | (0.21) | (0.11) | (0.17) | (0.17) | |
| lnPOP | 0.99 *** | −0.54 | 1.04 *** | −0.70 ** | 0.33 |
| (0.21) | (0.43) | (0.21) | (0.33) | (0.30) | |
| lnEL | 0.24 *** | −0.18 | 0.25 *** | −0.20 * | 0.05 |
| (0.08) | (0.13) | (0.08) | (0.11) | (0.09) | |
| lnCL | −0.07 | −0.12 | −0.06 | −0.08 | −0.14 |
| (0.13) | (0.17) | (0.13) | (0.16) | (0.12) | |
| lnOE | 0.01 | 0.01 | 0.01 | 0.00 | 0.01 |
| (0.01) | (0.03) | (0.01) | (0.02) | (0.02) | |
| rho | −0.32 *** | ||||
| (0.09) | |||||
| sigma2_e | 0.01 *** | ||||
| (0.00) |
Note: *, **, and *** indicate significance at the levels of 10%, 5%, and 1%, respectively. Standard errors are shown in parentheses.
Table 16.
Spatial Durbin model regression of economic geography weight matrix.
| Variables | (1) x | (2) Wx | (3) Direct | (4) Indirect | (5) Total |
|---|---|---|---|---|---|
| lnDE | −1.32 *** | 1.25 | −1.36 *** | 1.29 ** | −0.07 * |
| (0.35) | (0.20) | (0.29) | (0.20) | (0.21) | |
| lnpGDP | −0.13 | 0.51 * | −0.14 | 0.41 * | 0.26 |
| (0.11) | (0.30) | (0.11) | (0.23) | (0.23) | |
| lnPOP | 0.94 *** | −0.13 | 0.96 *** | −0.36 | 0.60 |
| (0.21) | (0.65) | (0.20) | (0.48) | (0.45) | |
| lnEL | 0.26 *** | −0.15 | 0.26 *** | −0.18 | 0.07 |
| (0.08) | (0.19) | (0.08) | (0.15) | (0.13) | |
| lnCL | −0.12 | 0.02 | −0.11 | 0.05 | −0.06 |
| (0.13) | (0.24) | (0.13) | (0.21) | (0.17) | |
| lnOE | 0.01 | 0.05 | 0.00 | 0.04 | 0.04 |
| (0.02) | (0.05) | (0.02) | (0.04) | (0.04) | |
| rho | −0.34 ** | ||||
| (0.16) | |||||
| sigma2_e | 0.01 *** | ||||
| (0.00) |
Note: *, **, and *** indicate significance at the levels of 10%, 5%, and 1%, respectively. Standard errors are shown in parentheses.
Disclaimer/Publisher’s Note: The statements, opinions and data contained in all publications are solely those of the individual author(s) and contributor(s) and not of MDPI and/or the editor(s). MDPI and/or the editor(s) disclaim responsibility for any injury to people or property resulting from any ideas, methods, instructions or products referred to in the content. |
© 2023 by the authors. Licensee MDPI, Basel, Switzerland. This article is an open access article distributed under the terms and conditions of the Creative Commons Attribution (CC BY) license (https://creativecommons.org/licenses/by/4.0/).
Share and Cite
MDPI and ACS Style
Chen, M.; Zhao, S.; Wang, J. The Impact of the Digital Economy on Regional Carbon Emissions: Evidence from China. Sustainability 2023, 15, 14863. https://doi.org/10.3390/su152014863
AMA Style
Chen M, Zhao S, Wang J. The Impact of the Digital Economy on Regional Carbon Emissions: Evidence from China. Sustainability. 2023; 15(20):14863. https://doi.org/10.3390/su152014863
Chicago/Turabian StyleChen, Menggen, Songyangyang Zhao, and Jiawen Wang. 2023. "The Impact of the Digital Economy on Regional Carbon Emissions: Evidence from China" Sustainability 15, no. 20: 14863. https://doi.org/10.3390/su152014863
Note that from the first issue of 2016, this journal uses article numbers instead of page numbers. See further details here.