Article

Creating a Nationwide Composite Hazard Index Using Empirically Based Threat Assessment Approaches Applied to Open Geospatial Data

1
National Center for Integrated Coastal Research, School of Public Administration, University of Central Florida, Orlando, FL 32816, USA
2
Applied Aviation Sciences Department, College of Aviation, Embry-Riddle Aeronautical University, Daytona Beach, FL 32114, USA
*
Author to whom correspondence should be addressed.
Sustainability 2022, 14(5), 2685; https://doi.org/10.3390/su14052685
Submission received: 6 December 2021 / Revised: 7 February 2022 / Accepted: 18 February 2022 / Published: 25 February 2022
(This article belongs to the Special Issue Hydrometeorological Hazards and Disasters)

Abstract

:
The US is exposed to myriad natural hazards causing USD billions in damages and thousands of fatalities each year. Significant population and economic growth during the last several decades have resulted in more people residing in hazardous places. However, consistent national-scale hazard threat assessment techniques reflecting the state of hazard knowledge are not readily available for application in risk and vulnerability assessments. Mapping natural hazard threats is the crucial first step in identifying and implementing threat reduction or mitigation strategies. In this study, we demonstrate applied GIS approaches for creating and synthesizing US hazard threat extents using publicly available data for 15 natural hazards. Individually mapping each threat enables empirically supported intervention development and the building of a Composite Hazard Index (CHI). Summarizing the hazard frequencies provides a novel representation of US hazardousness. Implementing cluster analysis to regionalize US counties based on their underlying hazard characteristics offers insight into hazard threats’ spatial (non-political) natures. The results indicate that the southeast, central plains, and coastal regions of the northeast had high hazard occurrence scores, whereas more moderate hazard scores were observed west of the continental divide. Furthermore, while no place is safe from hazard occurrence, identifying each region’s distinct “hazardousness” can support individualized risk assessments and mitigation intervention development.

1. Introduction

Natural hazards have caused severe damage and substantial loss and pose an increasing threat to the environment and society [1,2,3]. The impact of natural hazards and disasters escalated globally in recent years, with the cost to mitigate and reduce risk also increasing [2,4,5]. In the United States (US), natural disasters have caused over USD 1.75 trillion (2019) in property and crop damages and more than 35,000 fatalities between 1960 and 2019 [6]. Moreover, despite continuous hazard mitigation efforts, the costs of weather and climate disasters are increasing in the US. This escalating trend is due to a combination of increased exposure, vulnerability, and changes in the frequency and magnitude of climate extremes [7,8]. Mitigating future hazard impacts requires an improved understanding of the spatial extent of hazard threats faced by communities, the expected severity of consequences for known hazards, and the intersection of threats and consequences with vulnerable populations and infrastructure. These three pieces of risk information will enable both planning and emergency management entities to formulate effective mitigation strategies and response plans for evacuation, sheltering, and relief distribution.
Qualitative and quantitative natural hazard risk assessments are abundant at US state and county levels due to federal risk reduction legislation, programs, robust geophysical data, and advances in modern computing and geospatial technology. The Disaster Mitigation Act of 2000 (DMA 2000) sets the basis for requiring natural hazard risk assessments from state and local governments to receive federal risk reduction program funds. As such, most current risk assessments focus on singular natural hazards, like damages from earthquake ground motions, inundation from river floods, or exposure to extreme winds in hurricanes. Natural hazard risk assessments encompass knowledge of the underlying geophysical and hydrometeorological processes causing a hazardous condition, how frequently it occurs, who and what gets exposed to the hazard, and what can be done to mitigate the consequences of a hazard’s occurrence [9,10]. Turning this definition into an empirically measurable equation helps move us from concepts toward application. Here, risk is defined as a combination of hazard threat, vulnerability, and the severity of consequences, where all components vary across space and over time. This relationship can be expressed using the pseudo-equation below, indicating the interaction of the three components (Hazard Threat, Vulnerability, and Severity of Consequences) giving rise to risks:
R i s k   ( R ) = f ( H a z a r d   T h r e a t   ( H T )   ×   V u l n e r a b i l i t y   ( V ) ×   S e v e r i t y   o f   C o n s e q u e n c e s ( S o C ) )
where Hazard Threat (HT) is defined as the spatial location of hydrologic, meteorologic, or geophysical events that posed a possible danger to people and the human use system, Vulnerability (V) is represented by the distribution of the total population, socially vulnerable population, and the locations of those specific lifelines recently identified by the Federal Emergency Management Agency (FEMA) as critical for enabling continuous operation of critical government and business functions essential to human health and safety or economic security, and Severity of Consequences (SoC) combines historical incident information (event occurrence counts, property and crop losses, fatalities, and injuries), a measure of frequency vs. severity (Does the threat occur frequently and cause minimal damage, occur infrequently and cause high levels of damage, or some other combination?), an indication of climate sensitivity (Is the hazard threat likely to be influenced by changes in climate?), and a measure of the hazard threat’s priority in current risk assessment and mitigation planning efforts.
In this conceptual model, risk cannot exist in places without threats, in places with no vulnerability, or in places threatened and vulnerable but for which no real severity of consequence exists. For example, hail hazard threats will only manifest into risks where there are people and community lifelines that will be exposed and in places where hail itself has been historically impactful on lives and livelihoods.
With hazard threat identification, the first step is risk assessment, which provides the factual basis for risk reduction activities in mitigation planning in the US, including informing other planning activities around emergency response operations [11,12,13,14]. As one of the seven core functions of the National Mitigation Framework, FEMA states that hazard data should be translated “into meaningful and actionable information through appropriate analysis and collection tools to aid in preparing the public” [15] (p. 16). Notably, to meet a separate set of goals for emergency preparedness and response capabilities, FEMA established a similar but separate program of risk assessments—Threat Hazard Identification and Risk Assessment (THIRA)—for the analysis of many additional technological and human-caused hazards [16]. However, this paper focuses only on natural hazard risk assessments in the context of DMA 2000.
Recognizing the inherent utility in creating individual maps of hazard threat extent for planning, hazard mitigation, or emergency management, decision makers, practitioners, and scholars have focused on building very detailed assessments for many hazards. Often, these individual hazard assessments span countless manuscripts or government reports and provide state-of-the-science representations of historical [17] and future hazard threats [18]. These highly complex individual models and formulas create a disconnect between science and practice, in which applying robust science to planning and mitigation efforts is decreased. Hazard mapping has become a fairly ubiquitous task across the US since multi-hazard advisory maps became federally required as part of DMA 2000. Every state, county, and municipality interested in receiving Hazard Mitigation Grant Program (HMGP) funds from the Federal Emergency Management Agency (FEMA) must provide “a map on which hazard data concerning each type of natural disaster is identified simultaneously for the purpose of showing areas of hazard overlap.” DMA 2000 goes on to state that “multi-hazard advisory maps shall be made available to the appropriate State and local governments for the purposes of … informing the general public about the risks of natural hazards in [areas, not fewer than five States, that are subject to commonly recurring natural hazards (including flooding, hurricanes and severe winds, and seismic events)” [14]. However, there are relatively few “hazard geographers” capable of applying complex geospatial techniques in a manner consistent with underlying hazard science knowledge at the US scale.
This paper aims to address this need by presenting the results from several geospatial threat assessment processes applied to freely available nationwide datasets for assessing individual hazard threat areas and a Composite Hazard Index (CHI) spatially incorporating 15 of the most impactful natural hazards for the contiguous United States. Our vision is to close this gap between research and practice by providing sound geospatial representations of hazard threats as the first step in empirically defining individual and composite hazard risk.

2. Background

Mapping and analyzing hazard threats from numerous perspectives—in this case, both individually and in composite—provides richer information from which to make critical planning decisions and also offers an opportunity to deepen our understanding around how these hazards combine, connect, cascade, or otherwise interact with each other spatially. Recent studies elucidated how singular natural hazard risk assessments may underestimate the cumulative or total risk by failing to consider concurrent or downstream hazards occurring in a similar time and space, functioning to increase risks, decrease resilience, and lengthen follow-on recovery periods [19,20,21,22]. Indeed, research efforts in Europe, some in coordination with United Nations (UN) risk reduction programs and the International Panel on Climate Change (IPCC), have in recent years begun to focus on multi-risk assessments to examine how natural hazards have interdependencies, compounding or cascading effects, or increased complexity when more than one hazard affects an area concurrently [23,24]. Compiling a set of hazard layers on a map may produce a depiction of multiple hazard threat areas, but such multi-hazard maps may be confusing or distort risk communication without some explanation or identification of interdependencies between the hazards. Moreover, one map’s approach to displaying multiple geographic features of different temporal and spatial resolutions invites questions about sources of errors and biases, ranging from ill-conceived cartographic design criteria about data classification, scale, and symbolization to ulterior motives for political or economic goals or, more simply, “a lazy map author (who) [3] failed to explore designs offering a more coherent or complete picture of reality(.)” [25]. Indeed, natural hazards are multidimensional across many space, time, hypsographic, geophysical, and socioeconomic factors, posing numerous cartographical challenges for mapping and communicating risk, often due to disregarding cartographic principles that overload or unbalance maps and making interpretation difficult [25,26,27,28,29,30]. Accordingly, through surveys of engineers, scientists, and spatial planners, Kunz and Hurni [27] established an urgent need to improve cartographic representations of multiple thematic layers like natural hazards, a goal of the current work.
Constructing a useful and scientifically-based Composite Hazard Index first requires a thorough understanding of the terms related to hazard interactions, including those about individual (singular) and multiple (complex, cascading, or connecting) hazard events and how these terms are operationalized in the literature. Though natural hazards research and practice have only more recently begun considering the effects of multiple hazards occurring simultaneously or with composite effects in specific areas, the environmental justice movement arising from the 1964 Civil Rights Act in the US prompted the Environmental Protection Agency (EPA) to develop a cumulative risk assessment (CRA) framework for risk reduction in vulnerable communities exposed to multiple hazardous chemicals. Officially released in 2003, the EPA’s CRA focuses on community-scale approaches to solve the problems of toxic exposure by explicitly incorporating measures of social and cultural vulnerabilities for holistic risk assessments (i.e., by recognizing that communities are often impacted by multiple risks at once such that “a collection of individual stressors (occur) simultaneously and multiply”) [31] (pp. 6–14). Cumulative risk, therefore, is defined by the EPA “as the combination of risks posed by aggregate exposure to multiple agents or stressors (including chemical, biologic, radiologic, physical, and psychologic stressors affecting human and the environment) in which aggregate exposure is exposure by all routes and pathways and from all sources of each given agent or stressor”. More specifically, CRA “evaluates the combined effects of multiple stressors rather than focusing on single compounds” and is “not necessarily quantitative” [32,33]. Though geared toward environmental regulations, the EPA’s CRA framework acknowledges both a need for tools to evaluate multiple stressors simultaneously such that exposures are not isolated from the context of other community exposures and risk factors and that historical risk assessments focusing on singular hazards “produced uneven results and left significant pockets of higher exposure and adverse impacts” and “toxic hotspots” in historically disadvantaged, underserved, and overburdened communities [31] (pp. 11–12). A cornerstone of any cumulative or multi-hazard risk process, the EPA’s CRA analytical component begins with hazard identification as the first step in assessing risk [32] (p. 34).
More recently, though DMA 2000 defined a multi-hazard advisory map, the term multi-hazard is not clearly defined. Several disciplinary definitions of multi-hazard serve to further complicate the hazard assessment landscape. The World Meteorological Organization [34] (WMO) defines multi-hazard as “(1) the selection of multiple major hazards that (a) country faces, and (2) the specific contexts where hazardous events may occur simultaneously, cascading, or cumulatively over time, and taking into account the potential interrelated effects.” Furthermore, the WMO states that the first element of efficient warning systems is “disaster risk knowledge based on the systematic collection of data and disaster risk assessments.” In a checklist for multiscale organizational efforts to implement warning systems, the World Meteorological Organization [34] states clearly that risk assessments for all relevant hazards, including compounding risks, should be integrated into local risk management plans, with a “responsibility for coordinating hazard identification and risk information (exposure, social and physical vulnerability and capacity) assigned to one national organization with a view to consolidating approaches and monitoring linkages and cascading impacts.” In the UN’s 2015 Sendai Framework for Disaster Risk Reduction (SFDRR), the term multi-hazard is used frequently but is also not defined specifically. Gill and Malamud [35] stated that multi-hazard is used regularly in theory and practice in three keyways: (1) the overlay of single hazards, (2) the identification of all hazards in a place, and (3) the identification of all hazards in a place and the interactions that may occur between them. Further, Gill and Malamud [35] explicitly noted that single hazard approaches, including the overlay of multiple single hazards that are treated independently, may underestimate risk, distort risk management priorities, or serve to increase vulnerability to other spatially relevant hazards occurring in a place. To that end, Scolobig et al. [36] highlighted that earthquake-proof homes built of wooden frames increased the vulnerabilities of entire neighborhoods to wildfires that occurred in 2017, when more than 7000 households were displaced. Similarly, wind-proofed homes with reinforced concrete roofs in Kobe, Japan observed increased vulnerability to building damage and collapse in the historic 1995 earthquake. As such, Scolobig, Komendantova, and Mignan [36] highlighted a failure of multi-risk governance in Japan by drawing upon cascading impacts from the Tohoku earthquake that led to the Fukushima nuclear disaster. In summarizing their research, Gill and Malamud [35] defined multi-hazard to mean “an approach that considers more than one hazard in a given place (ideally progressing to consider all known hazards) and the interrelation between these hazards, including their simultaneous or cumulative occurrence and their potential interactions.”
Beyond defining the term multi-hazard, we must consider the analytical methods for arriving at a multi-hazard risk assessment. Taking multi-hazard to encompass multiple hazards, the definitional purposes of a multi-hazard advisory map lose some clarity, particularly in the simplification that some areas have “hazard overlap”, as when multiple hazards occur in an area, those hazards may causally or coincidentally interact to amplify the socioeconomic and environmental consequences. Kappes et al. [37] stated that “hazard relations and interactions may have unexpected effects and pose threats that are not captured by means of separate single-hazard analysis.” There are numerous terms to describe the ways that multiple hazards can interact, including but not limited to cascades, chains, crowding, spatiotemporal coinciding hazards, compounding hazards, follow-on events, interactions, interconnections, interrelations, knock-on effects, synergic effects, triggering effects, or complex hazards [37,38,39].
Garcia-Aristizabal et al. [40] established a framework for moving from single-risk assessments (i.e., analysis of one hazard’s effects on exposed assets) to multi-hazard risk assessment, where multiple independent hazard sources occur in a common area, and then on to multi-risk assessment, resulting in a generalization of the multi-hazard assessment considering possible interactions and cascading effects. Though describing physical damages through a vulnerability lens and illustrating reasons that multi-hazard and multi-risk assessments are under-developed, including the paucity of data and complexity of interactions, Garcia-Aristizabal, Gasparini, and Uhinga [40] described holistic risk assessments as including contextual conditions that include socioeconomic and other factors affecting hazard loss scenarios. Regardless, Pilone et al. [41] found that planning processes are currently inadequate for addressing multiple concurrent and interacting hazards.
Thus, in support of ongoing multi-hazard risk assessment analysis and planning, we address three specific research aims and questions. First, can nationwide hazard threat maps be created from open datasets using new, novel, or existing geospatial techniques, and do resulting threat outputs match the representations built by other subject matter experts focused on the associated uni-hazard analysis of the same hazards? Second, what utility does a national-level Composite Hazard Index (CHI) integrating 15 natural hazards occurring in the contiguous US provide in terms of advancing the common understanding of where threats coalesce across the nation? Finally, what new information about hazard threats is derived from applying a regionalization clustering algorithm to the CHI? By creating individual hazard threat geographies from authoritative and open datasets, we produce a sum-total hazard layer which acts as the critical first step in the risk assessment process: hazard threat identification. The CHI forms the empirical basis from which complete risk assessments accounting for vulnerabilities and severity of consequences can be undertaken.

3. Materials and Methods

3.1. Hazard Identification, Data Source, and the Individual Hazard Indicator

Addressing the first aim of this manuscript, namely the creation of individual hazard threat zones for 15 of the costliest hazards affecting the United States using novel geospatial approaches applied to freely available datasets, required application of geospatial techniques and concepts tied to a variety of works in the hazards literature, significant amounts of raw data manipulation, and computationally intensive processing. Here, we assess 15 hazards selected because they have the potential to cause damage nationwide, and underlying datasets provide complete coverage across the contiguous United States [2,42]. For data representation and ease of visualization, we further divided these 15 hazards into 5 categories: (1) severe weather, (2) flooding, hurricanes, and storm surges, (3) winter weather, (4) heat, drought, and wildfires, and (5) earthquakes. Volcano hazards, tsunamis, and mass movements including avalanches, landslides, and debris flows were not included here because (1) these hazards have threatened more regional areas, compared with other hazards that have broader areas of potential impact across the Conterminous United States, and (2) impacts from these threats have historically accounted for ~2% of disaster property losses [2]. The 15 hazards, their sources, and the timeframes assessed are detailed in Table 1. Detailed information on each of the hazard threat identification methods utilized in this manuscript can be found in the referenced scientific papers. Our intent here was to establish a baseline method for implementing these state-of-the-science approaches and combining them meaningfully for the entire United States.
High temperature, low temperature, wind, winter weather, and fog hazard data were extracted from the Global Historical Climatology Network’s (GHCN) daily in situ ground observation data (1988–2017) and were quality controlled by NOAA’s National Climatic Data Center [43]. For each hazard, the 30-year average hazard indicators for each station were calculated based on specific criteria for each hazard type (Table 1). Heat and cold temperature hazards were defined as the number of days in which the daily maximum temperature was above 310.928 degrees Kelvin (100 °F) or the daily minimum temperature was below 3273.15 degrees Kelvin (2 °F), respectively. Wind hazards were defined as the average annual days with WSF2 (fastest 2-min average wind speed) above 30 knots (wind hazard advisory). The fog hazard was defined as the annual average number of days in which WT01 (fog, ice fog, or freezing fog including heavy fog), WT02 (heavy fog or heaving freezing fog), WT08 (smoke or haze), or WT22 (ice fog or freezing fog) occurred. Winter weather hazards were defined as the average number of days where WT04 (ice pellets, sleet, snow pellets, or small hail), WT06 (glaze or rime), WT09 (blowing or drifting snow), WT15 (freezing drizzle), WT17 (freezing rain), WT18 (snow, snow pellets, snow grains, or ice crystals), or WT22 (ice fog or freezing fog) occurred at a given station. After calculating the annual average value for each hazard indicator (high and low temperatures, wind, winter weather, and fog) at the station level, the station data were interpolated into continuous raster surfaces with a 10-km resolution covering the contiguous US using the Kriging interpolation technique [53,54]. Finally, the interpolated raster surfaces were summarized to a 647.5-sq. km (250 sq. mile) hexagon grid (detailed in Section 3.2), where the average annual number of days for each hazard was assigned to each grid cell.
Drought data were obtained from the US Drought Monitor (USDM), produced jointly by the National Drought Mitigation Center, the US Department of Agriculture, and the National Oceanic and Atmospheric Administration [51]. Weekly USDM drought data are available in GIS polygon format from 2000 to the present. The drought intensity was categorized into five different classes: (1) D0 (abnormally dry), (2) D1 (moderate drought), (3) D2 (severe drought), (4) D3 (extreme drought), and (5) D4 (exceptional drought), based on five key drought indicators (Palmer Drought Severity Index, CPC Soil Moisture Model, USGS Weekly Streamflow, Standardized Precipitation Index, and Objective Drought Indicator Blends) and local condition reports, impact reports, and expert observation. In the current analysis, drought polygons with an intensity from D1 to D4 were selected to represent the drought hazard threat, and the average annual drought frequency for each hexagon was calculated by applying areal overlay procedures in GIS.
Flood hazard data were obtained from the National Flood Hazard Layer (NFHL) provided by FEMA [49]. The NFHL is the digital (snapshot in time) version of FEMA’s effective 100-year flood maps, the national standard used by FEMA and all federal agencies for the purposes of requiring and rating the purchase of flood insurance and regulating new developments. To date, the NFHL does not cover the contiguous US completely, but new, updated, and revised flood maps are added continuously. In the current assessment, the Special Flood Hazard Area (SFHA) dataset represents flood hazards with a 0.01 probability of occurrence in any given year (commonly referred to as a 100-year flood or the 1% annual chance of flooding) [55]. The flood hazard threat was calculated as the percentage of each hex grid’s land area inside the FEMA 100-year flood zone.
NOAA’s Sea, Lake, and Overland Surges from Hurricanes (SLOSH) dataset was used to map Category 1 storm surge inundations for the entire US East Coast and Gulf of Mexico coastlines. SLOSH is a model that estimates storm surges from an estimated tropical cyclone wind field using pressure, size, forward speed, and track data [50]. Thousands of hypothetical tropical cyclones are simulated in SLOSH to produce storm surge inundation areas based on the storm intensity, angle of approach to the coastline, and other hydrodynamic variables. The Category 1 storm surge threat was calculated as the percentage of each hex grid’s land area inside the Category 1 hurricane storm surge’s Maximum Envelope of Water.
Wildfire hazards were obtained from USDA’s Spatial Wildfire Occurrence dataset, an observational dataset of fire occurrences across the US compiled from federal, state, and local fire organizations [47]. The wildfire threat was calculated as the average annual number of wildfire events occurring in each hexagonal grid.
Hurricane wind hazard threats were generated from wind swaths for all North Atlantic tropical cyclones making landfall over the US during 1988–2017 by implementing the Kruk et al. [56] model of multi-distance asymmetrical buffer analysis to identify areas affected by inland tropical cyclone (TC) wind over threshold speeds of 17, 26, and 33 m s−1. Each wind swath buffer was then categorized according to their Saffir–Simpson intensities for extra- or post-tropical (PT) storms, tropical storms (TSs), and Category 1–5 hurricanes. The average overland distances in each of four quadrants (northeast, northwest, southeast, and southwest) for each wind intensity threshold were calculated using Colorado State’s Extended Best Track Dataset [48]. Wind swaths for the TCs were constructed using the distance parameters for 17m s−1 winds and then overlaid with the hexagon grid to ascertain the total frequency of storm-force winds, from which the average annual frequency was calculated by dividing the total frequency by the number of years in the record.
Hail occurrence data were obtained from the Storm Prediction Center (SPC) severe weather database operated by the NOAA National Weather Service (NWS) [46]. The dataset provides the location (latitude and longitude) and hail size for each hail event recorded since 1955. In 2010, the NWS changed the criteria for recording from 0.75 inches (1.9 cm) at minimum to 1 inch (2.5 cm). Here, events with hail sizes equal to or larger than 1 inch (2.5 cm) were selected, and the average annual frequency of hail events (1989–2018) was calculated for each hexagon grid.
Lightning data (1988–2017), collected from the World Wide Lightning Location Network developed by the University of Washington (http://wwlln.net/), represent all cloud-to-ground lightning locations [45]. These points, coded as coordinate points (latitude and longitude), were first plotted in GIS. Then, the average annual lightning frequency was calculated as the number of lightning points intersecting with each hexagon divided by the total number of years in the record (n = 30).
The severe thunderstorm and tornado warning polygons (2002–2017) were obtained from the Iowa Environmental Mesonet [44]. Associated spatial information was systematically extracted from the warning text and then converted into the shapefile format, representing the geospatial footprint of each severe storm warning extent. A total count of warnings for each hexagonal grid was calculated as the number of severe storm or tornado warning polygons that intersected each hexagon. An average annual frequency was then calculated by dividing the total frequency by the number of years on record (n = 16).
Earthquake hazard data were obtained from the USGS 2014 US (Lower 48) Seismic Hazard Long-Term Model [52]. The data were derived from seismic hazard curves calculated on a grid of sites across the US that describe the annual frequency of exceeding a set of ground motions. The data were updated in 2014 based on potential earthquakes and associated ground shaking information from recent models for ground motions, faults, seismicity, and geodesy. We chose the 2% exceedance probability for peak ground acceleration (PGA) in 50 years of data to map earthquake hazards in the conterminous US and averaged the PGA values for each hexagonal grid [57,58].

3.2. Hexagonal Grid for Spatial Binning

Hexagonal grids represent a simplified method of displaying complex geospatial information [59,60] in an approachable way that serves three primary goals. First, hex grids simplify the data sets and aid in the visual communication of complex data. If performed correctly, visual binning can enable readers to make reasonable count or density estimates that would otherwise be impossible because of the complexity of the underlying data. Here, aggregating outputs to the 647.5 sq. km (250 sq. mile) hex grid provided a seamless representation of a variety of datasets in a visually approachable way. Second, spatial binning shows a smooth surface of aggregated values across larger areas. This is particularly true in the current context, where we were manipulating 15 different types of hazard data originally represented by both vector (points, lines, and polygons) and raster GIS data models. Finally, a standardized regular gridded framework, such as the hexagonal grids used here, enabled analysis and evaluation within and between datasets that would normally be difficult (or impossible) to compare visually, statistically, or spatially [61,62]. Identifying patterns in individual hazard threat extents or the resultant Composite Hazard Index (CHI) would be difficult at the US level without standardizing the outputs to a common geospatial unit: the hexagonal grid.

3.3. Aggregation of Multiple Hazard Layers

Achieving the second aim, creating the CHI, required the implementation of several geospatial and statistical steps, including (1) standardizing the indicator values for each (of 15) hazards using a z-scores method [63], followed by (2) classifying the data by the z-score values into five categories, namely low (z-score < −1.50), low-medium (−1.50 < z-score < −0.5), medium (−0.5 < z-score < 0.5), medium-high (0.5 < z-score < 1.5), and high (z-score > 1.51), and assigned an associated value (1–5 from low to high). This step was undertaken to minimize the potential for inappropriate regional bias based on raw z-score values in particular areas of the contiguous US, because each hazard had different distributions. (3) A composite hazard index (CHI) score was created by summing the individual hazard threat scores for each hexagon in the national grid without weighting any individual hazard threat over another, such that
C o m p o s i t e   H a z a r d   I n d e x   ( C H I ) = i = 1 n ( x i ) = x 1   + x 2   + x 3   + x 4   + x 5   + x 6   + x 7   + x 8   + x 9   + x 10   + x 11   + x 12   + x 13   + x 14   + x 15    
where x is the singular hazard threat hex grids classified (1 = low, 5 = high).
An equal weighting scheme was used in creating the CHI, recognizing the aim of this work as identifying hazard threat areas (the first part of the risk equation) independently from the severity of consequences, underlying population, or infrastructure vulnerabilities. The composite hazard score has a theoretical range from 15 to 75 based on a minimum value of 1 and a maximum value of 5 for each hazard. Finally, (4) the composite hazard scores were classified into five categories using the same z-score classification method discussed above and mapped.

3.4. Clustering of Multi-Hazards

Accomplishing the third aim, developing a regionalization of the Composite Hazard Index, required an application of k-means clustering that included the observation locations as part of the weighted optimization routine [64]. The k-means unsupervised algorithm partitions data in iterations based on similarity within and between data groupings. Similar to an orthogonal principal component analysis [65], where the data are reduced to groups based on likeness, k-means clustering includes a spatial component where the cluster members are most similar to one another within the cluster and most dissimilar to members of other clusters in terms of both attributes and spatial location. Applying a weighted optimization k-means to the CHI values produced clusters by means to two separate functions accounting for the location and attributes, which are where the number of clusters k is determined using the total within-cluster sum of squares (WSS) and the difference in the total WSS from k − 1 to k. Oftentimes, using WSS values alone (common elbow method) is not sufficient for determining an appropriate cut-off value for clusters, because breaks in the data are not discernable. As previous research mentions, the common elbow method might not be suitable in all cases (including here), given that no distinct elbow is established because of the large number of observations considered, yet a relatively small number of clusters is desired. Thus, the CHI clusters were derived by first calculating the difference in the total WSS from k − 1 to k and then evaluated using the elbow method (see the differences between the bars and line in Section 4.2 for an example of the differences between these two methods for determining clusters) [66]. In cases such as these, the elbow method [67] for measuring the difference in the total WSS provided a clearer indication of how many clusters should be selected. The number of clusters was determined using the difference in the total WSS from k − 1 to k.

4. Results

4.1. Individual Hazard Layers

In this section, the results pertaining to our first specific aim—the spatial distributions of 15 individual hazard indicators—are examined and validated against similar singular hazard analyses undertaken by other subject matter experts. As discussed above, these 15 hazards were grouped into 5 categories based on the hazard type, namely (1) severe weather, (2) flooding, coastal hazards, and hurricanes, (3) winter weather, (4) heat, drought, and wildfires, and (5) earthquakes. Six severe weather hazards are presented in Figure 1. Severe thunderstorm (SVR) hazard threats based on storm-based warnings were distributed over the eastern two-thirds of the CONUS (Figure 1A). High hazard zones were distributed over the central plains, lower Mississippi Valley, and the southern Appalachians. This pattern roughly agrees with previous research on SVR [68]. Like the SVR threat areas, tornado hazard threats were also distributed east of the Rocky Mountains (Figure 1B). A large area of high tornado hazard threat can be seen in the central plains and lower Mississippi River as well as the Tennessee River valleys. A third, smaller concentration of high tornado threat hex grids is also discernable east of Boulder, Colorado. This pattern aligns with previous research on tornado hazard threats [68]. The high frequency of severe thunderstorms and tornadoes in the Midwest and the southeast US likely reflects a positive trend over the southeastern regions since 1979 [69]. The lightning hazard threat frequency exhibited a general decrease from south to north and from east to west with high zones along the Gulf Coast and over Florida, which showed similar patterns to previous studies (Figure 1C) [70]. The hail hazard threats (Figure 1D) are distributed across the central and northern plains, with the line of the higher hail threat trending from northern Alabama through North Carolina. These hail hazard threat patterns resonate with other studies [71,72]. The wind hazard threat areas visualize a clear pattern of a high threat along the north-south expanse from western Texas in the south, along the Rocky Mountain Continental Divide, and through to the Canadian border in central Montana (Figure 1E). These high wind threat patterns align with those found by others interested in wind hazard fatalities [73]. The high fog hazard threat zones are more clustered along the Pacific coast and the Gulf of Mexico’s coast, as well as the northeastern region around New England and regions adjacent to the Great Lakes and in the Appalachians (Figure 1F). Although these spotty patterns may indicate a need for more weather stations collecting information on fog, they generally match the associated fog hazard research [74,75,76].
Flooding, coastal hazards, and hurricane winds were combined into a set of storm surge and flood hazard threat maps (Figure 2). The areas of higher 100-year flood hazard threats (Figure 2A) tended to follow US major rivers, including the Mississippi, Ohio, Arkansas, and Missouri River basins, as well as the flatland areas of Florida, where very small changes in elevation cause water to drain slowly. Additionally, the coastal plain areas in Virginia, the Carolinas, and Georgia, as well as the coastal lowland swamps of Louisiana and Texas and the Central Valley of California, also had some of the highest flood hazard threats (Figure 2A). The storm surge threat zones stretch from South Texas along the entire Gulf Coast and East Coast up to Northern Maine. These areas can experience storm surges associated with Category 1 hurricanes, and they were binned into the high hazard zone in our analysis based on the amount of a hex grid’s land area in the NOAA modeled inundation zone (Figure 2B). The frequency of tropical cyclone wind hazards had a general decrease from the southeastern coast to the inland regions (Figure 2C). A vast and continuous region from coastal Texas extending northeastward to Vermont and Maine was classified as several moderate-to-high tropical cyclone wind hazard zones. The coastal states, including all of Florida, the coastal and inland counties in Louisiana, Mississippi, Alabama, and Georgia, as well as eastern North and South Carolina and Virginia, average at least one tropical cyclone event per year. This hurricane wind hazard pattern agrees with previous research on the topic [56].
The third hazard threat category includes low temperature and winter weather hazard threats. The distribution of low temperature hazards exhibited latitudinal distributions, especially over the regions east of the Rocky Mountains (Figure 3A). High hazard zones (mostly cold temperature days) are distributed across high elevation areas in the Rocky Mountains over western Wyoming and Colorado. High winter weather hazard threat areas are generally located within the moderate-to-high low temperature hazard zones and are confined to small-scale areas (Figure 3B). Previous studies also found that most events were confined to small areas [77]. This finding strongly indicates the importance of mesoscale processes in most winter weather systems, although such findings are also linked with the sparse number of weather stations—mainly in urban areas—collecting winter weather (i.e., snow, ice, and freezing precipitation) data. It should be assumed that the spaces between these high hazard threat areas may in fact be experiencing similarly high levels of winter weather hazard threats.
Heat, drought, and wildfire hazards were analyzed together because they are theoretically most likely to show spatial overlap. The southwestern and south-central US regions are most impacted by extreme heat hazard threats (Figure 4A). Our assessment found that much of the southern Great Plains is accustomed to experiencing moderate-to-high heat hazard threats. Like Wobus et al. [78], we found that large parts of the Mojave Desert over California and Arizona, as well as the South Texas Plains, are characterized by a higher heat hazard threat. A higher drought hazard (Figure 4B) is primarily distributed in the west and southwest regions (California, Nevada, Arizona, Idaho, New Mexico, and Texas) of the US. The drought hazard threat been most severe in the southern and plains states, where crop and livestock assets are densely populated. These drought hazard patterns agree with other research using USDM data [79]. Conversely, wildfire hazard threats are primarily concentrated in southeast and along a line trending north and south through central California and Oregon, with numerous small clusters dispersed over eastern Kentucky, southwest West Virginia, New Jersey, and various places in Pennsylvania (Figure 4C). These wildfire threat areas closely match those identified in [80] in an assessment of US wildfires (1992–2011).
Earthquake hazards were presented alone as the single geophysical hazard assessed here. The areas of the highest earthquake hazard threat are located on the West Coast, parts of the northern Rocky Mountains from Idaho southward to the Wasatch Range of Utah, and around the New Madrid, Southern Appalachian, and Charleston Seismic Zones, corresponding to the USGS-sourced National Seismic Hazard Map (Figure 5). The risk of an earthquake hazard is primarily associated with the presence of folds and faults across the country (Figure 5). Elevated earthquake hazard zones in the Pacific Mountain and northern Rocky Mountain regions in Idaho, Wyoming, and western Montana are characterized by the presence of numerous quaternary faults. The high earthquake region in South Carolina is associated with the Charleston fault. Likewise, the high hazard zones in the border regions of Indiana, Illinois, Missouri, Arkansas, Mississippi, Tennessee, and Kentucky are the result of the presence of the New Madrid, Reelfoot scarp, Western Lowland, Thebes Gap, St. Louis-Cape Girardeau, and Wabash Valley faults. However, the occurrence of earthquakes outside of these fault areas, especially in the central and eastern US, dramatically increased in recent years, and this has been attributed to induced seismicity from hydraulic fracturing and deep injection wells [81,82]. The earthquake map in this study was derived from the USGS 2014 long-term model, which excludes induced seismicity as ephemeral features inappropriate for long-term hazard models [83], which may pose a significant challenge for risk mitigation as many fragile buildings are exposed to these new shaking events.

4.2. Composite Multi-Hazard Score

Constructing a Composite Hazard Index (CHI) overlaying all singular hazard threat area maps resulted in a unique visualization of threats across the contiguous US (Figure 6). The categorized CHI values reflect the regional contrasts between the east and west and the south and north. In general terms, the areal percentages for each category (high, medium-high, medium, medium-low, and low) were 7%, 23%, 33%, 32%, and 5% of the area, respectively, indicating that there were more hex grids in the high hazard areas than the low hazard areas but fewer hex grids in the medium-high hazard threat zones than medium-low threat zones. The high and medium-high hazard zones are distributed across the central, southeastern, and coastal regions from New Jersey in the north through the southeast and up into the midwestern states and eastern Colorado. The high CHI threat areas are particularly concentrated over the southeastern region (Georgia, South Carolina, Louisiana, Mississippi, Alabama, and Florida) as well as the central regions (e.g., Nebraska, Kansas, Oklahoma, and northern Texas). We further divided the composite hazard score by state (Figure 7) to enable quick comparisons across the nation. Among the 48 states observed, Alabama had the highest average CHI z-score of 1.63, followed by South Carolina, Mississippi, and Georgia. A total of 19 states, including Washington, DC, have more than 50% of their land area located in the medium-high to high CHI zones.

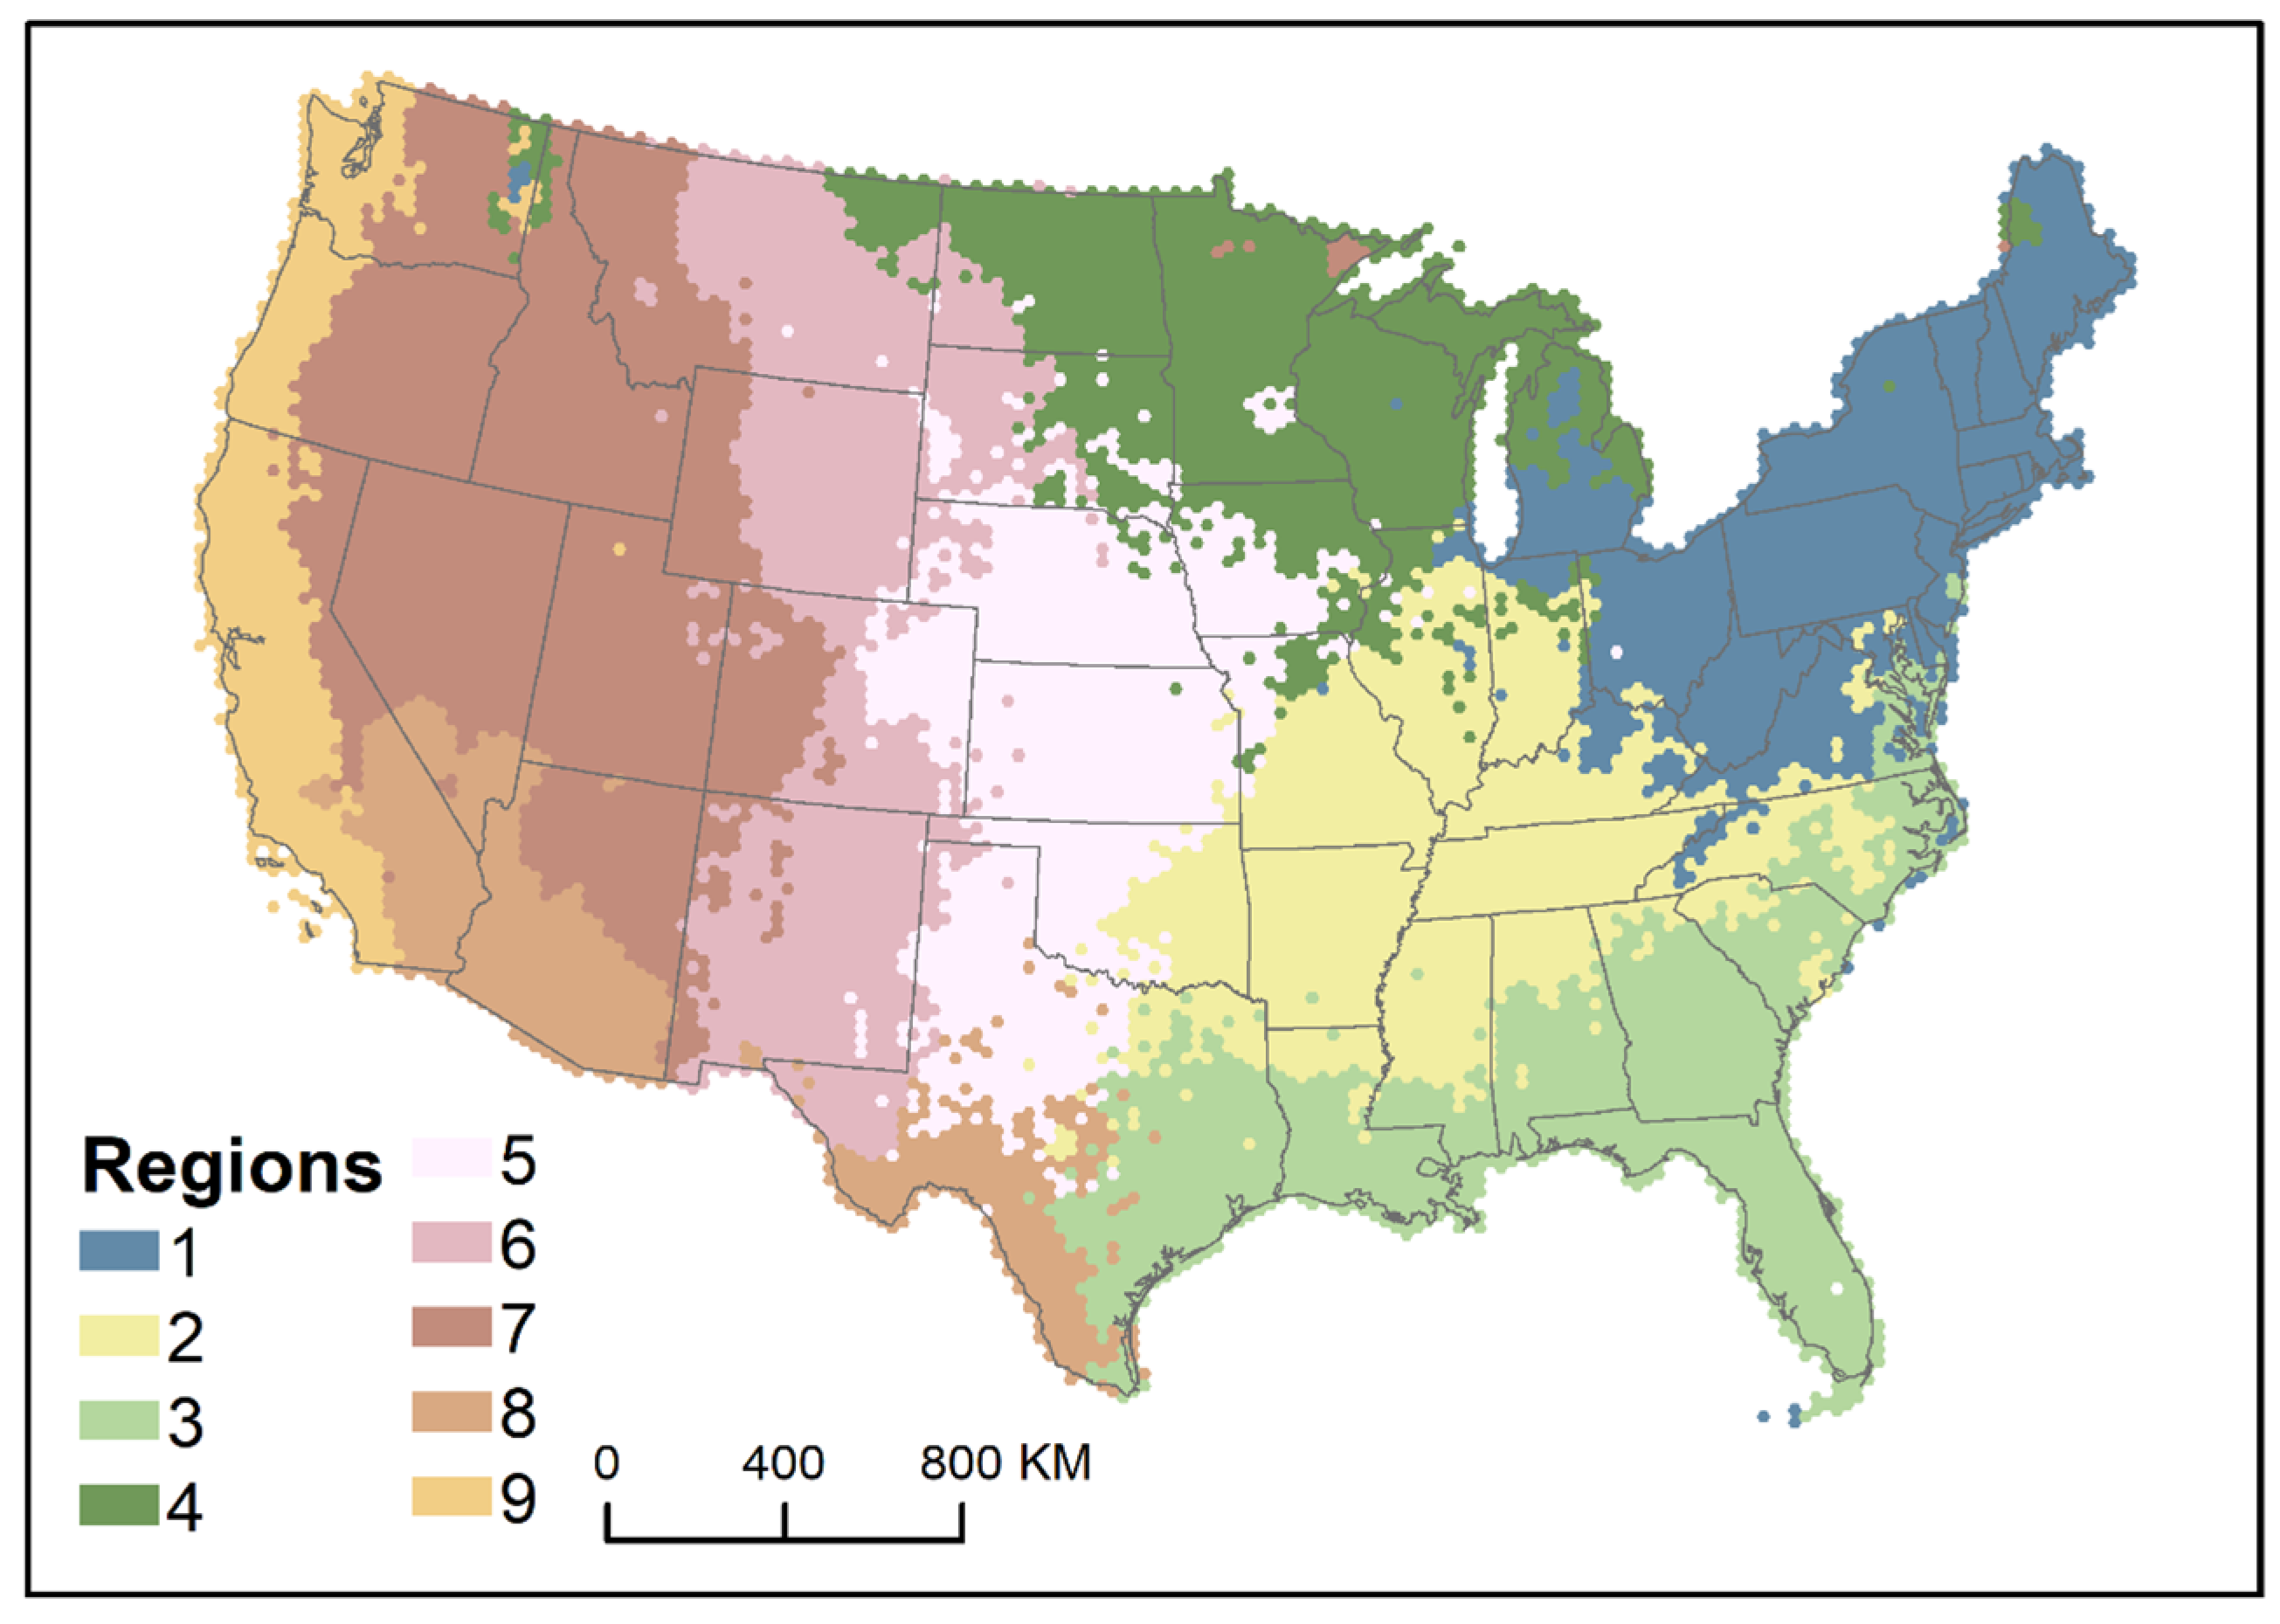
4.3. Regionalization of Multi-Hazards

Extending their utility, the CHI locations were regionalized using the indicators of the 15 hazards. The number of clusters was determined using the total WSS and the difference of the WSS from the total WSS from k − 1 to k (Figure 7). In contrast to the very smooth total WSS curve from the standard elbow approach, the difference in the total WSS showed apparent elbows, indicating a significant change in the slope at nine clusters. The optimal k was determined to be nine, since the WSS showed a shape decline from k = 9 to k = 10 and not much change in the difference in k greater than 10. The map of spatially constrained multivariate clustering of five spatial metrics is shown in Figure 8. The average values of the spatial metrics of nine clusters are shown in Table 2.
Region 1, stretching from the northeast into portions of the mid-Atlantic and upper Midwest (Figure 9), is characterized predominantly by fog hazard threats, with an average threat score of 4 (Table 2). Although the northeastern seaboard is one of the most fog-prone coastal regions of the US, it receives less attention than the West Coast’s fog events [84]. Previous research has found that the area is affected by a combination of advection fog, precipitation fog, cloud-based lowering, and radiation fog. This region also experienced a moderate-to-high level of winter weather and hurricanes, which have average hazard threat scores of 3.8 and 3.44, respectively. Nor’easters, storms that commonly strike the northeast as winter storms, typically occur between September and April, coupled with the Atlantic hurricane season from June to November [85], causing a dual threat in terms of severe weather for the region. The region has a high risk of major storms year round, which indicates the need for additional personnel and resources during times of multiple concurrent hazards.
Region 2, the second most hazardous based on the overall average CHI score, is mainly located across the eastern central states. Here, hazardousness is characterized by severe thunderstorms and tornadoes, each of these ranking first in relation to all nine regions. This region also experiences a higher-than-average number of lightning strikes, making severe weather the main driver of hazard threats and pointing to a definitive pattern of concurrent or compounding hazards across this area. Long et al. [86] found that tornado activities in the southeastern US have two peak periods: one in the spring and one in the fall and early winter, which poses the challenge for hazard mitigation. Previous studies have also found that most tornado fatalities happen in the lower Arkansas, Tennessee, and lower Mississippi River valleys of the southeastern US. The high fatalities here may be due to the unique juxtaposition of both physical and social vulnerabilities [87].
Region 3, spanning the southeastern states extending from Texas to the coastal regions of Virginia, is the most hazardous region in the United States. Region 3 is characterized by hurricane winds and lightning hazard threats, both of which are ranked at the top here compared with all other regions (Table 2). However, our study estimated the hurricane winds only and not other threats associated with hurricanes such as high wind gusts, intense rainfall, tornadoes, flooding, and landslides, which pose challenges to hazard forecasting and mitigation during the Atlantic hurricane season. Moreover, this region also experiences a variety of hazards beyond hurricanes and lightning, as evidenced by seven hazards with higher-than-average hazard scores (Table 2), including severe weather, flooding, fog, coastal hazards, and wildfires. According to the NOAA [88], the southeastern region experienced a higher frequency and diversity of billion-dollar disaster events than any other region in the US. Given the continued population growth in coastal areas across the southeast, this situation poses significant challenges for this and other coastal areas with high composite hazard index scores.
Region 4 covers the upper Midwest region and is characterized by low temperature hazards and winter hazards, for which the area is ranked first and second, respectively, across all nine regions (Table 2). The Midwest is subject to the intrusion of extremely cold air masses from the Arctic. An important area for corn and soybean production, in addition to a variety of high-value specialty crops including sweet peas, cranberries, and blueberries, the effects of cold temperatures infiltrating the crop growing region during the spring seasons can cause severe frost and freeze damage to crops [89]. Moreover, the Fourth US National Climate Assessment (2018) reported that Midwest temperatures are expected to increase more than any other region of the US during the warm season [90]. The warming trend may have led to earlier and longer occurrences of warm conditions in late winter, which promote plant development before the last spring freeze. As a result, many fruit and vegetable crops are at risk of spring freezes due to earlier dormancy breaks [89].
Region 5 covers the central-to-southern Great Plains. This region is characterized by frequent hail and severe storms, with hail hazard threats ranking first among the nine regions. Previous studies found that hailstones and tornadoes over the southern Great Plains are mainly associated with supercell thunderstorms in the warm season (spring and summer) [91,92]. The Great Plains have witnessed the greatest hail loss [93]. Tang, Gensini, and Homeyer [72] found that the severe hail frequency increased in the central Great Plains and the southeastern US. Moreover, Brimelow, Burrows, and Hanesiak [71] found that the hail damage potential was expected to increase (>40%), especially in the spring, over most ecoregions, including key hail areas such as the High Plains and Great Plains in the US.
Region 6, spanning the entire Rocky Mountain Continental Divide, is nearly identical to the high wind hazard threat zones. Orographic lifting of westerly winds and the associated dissipation of precipitation on the western side of the Rocky Mountains has resulted in large swaths of this region being characterized by drylands. Here, wind-driven erosion of topsoil and dust emissions degrade the soil quality, negatively impacting agriculture, the ecosystem, and human health. Moreover, given Region 6′s large latitudinal distribution, it experiences frequent cold hazard threats in the northern portions (Figure 3A) and drought hazard threats in the southern portions (Figure 4B). Thus, in the northern part, the combination of wind and low temperatures in winter can lead to dangerous wind chill conditions, while in the southern region, the high wind, coupled with higher temperatures, promotes rapid evaporation, further worsening drought conditions [94].
Region 7 covers the Rocky Mountain regions. This region did not experience any hazards, with an average score above 4, and the overall average CHI is the lowest of all regions making it a region with a relatively lower threat in comparison with all other regions. However, a combination of high-ranking threats including low temperatures (CHI rank = 2), drought (CHI rank = 2), and earthquakes (CHI rank = 2) increases the overall hazardousness of the region.
Region 8, covering two smaller areas in southern California, Nevada, and Arizona, as well as southwestern Texas, has the third lowest overall average CHI score (2.79), making this region relatively less hazardous than others. Here, in the Chihuahuan, Mohave, and Sonoran Deserts, areas with high temperatures and drought are both the highest in comparison with other regions. These climate-sensitive hazard threats stand to not only increase in the future but may also occur concurrently or in a cascading manner in which heatwaves can exacerbate droughts across the region [95,96].
Region 9 covers the entire Pacific coastal region from Mexico in the south to Canada in the north. Here, the main hazard threats include fog and earthquakes, both signified by the highest average CHI scores across all regions. While the earthquake hazard threats are well known and include building collapses and associated fires from the disruption of infrastructure assets, fog hazards have also been known to account for vision-related fatal crashes, including chain reaction crashes and injurious consequences, especially in specific regions, including the Interstate 5 corridor of California, Oregon, and Washington [74]. In this region, most fatal crashes occurred due to fog occurring on highways that had high traffic volumes.

5. Discussion

The individual hazard threat maps created here conform to previous well-understood patterns of geophysical, meteorological, and climatological events. While the spatial patterns derived here are not new, these output visualizations in a 647.5 sq. km (250 sq. mile) hex grid and associated annual occurrence data represent a novel approach to undertaking systematic hazard threat analysis. The creation of a Composite Hazard Index represents a new method for overlaying hazard threat potentials independent of their consequences for people and infrastructure as the first step in a multi-hazard assessment. Understanding the combined overall distribution from potential natural hazard threats in the US adds an important multifactorial context called for by similar EPA, CRA, and Garcia-Aristizabal, Gasparini, and Uhinga [40] methods. Grouping the occurrence of multiple natural hazard threats by standardized z-scores in a novel hexagonal grid representation may assist emergency managers, planners, and the public at large in considering aggregate or holistic risks affecting their communities differently and disproportionately. To wit, earthquake or flood hazards may affect only certain parts of the US, but in combination, larger or previously unidentified regions of the US may face numerous hazards concurrently, sequentially, or more frequently in the future. Such knowledge can support the development of multiple hazard mitigation options, where one risk management strategy has the potential to influence the vulnerabilities to one or more other hazards. Thus, the Composite Hazard Index reveals spatial patterns of potentially consequential events in distributions heretofore unmeasured, expanding the understanding of natural hazards in the US and establishing a means for examining connected vulnerabilities, consequences, potential future losses, and risk reduction strategies.
There are some limitations to the hazard identification process employed in this study. First, the hazard analysis for severe storms and tornados relied on the historical issuance of watches and warnings rather than direct observations of these events. The historical odds of a tornado’s occurrence do not necessarily predict the future locations of tornadoes, as recent trends show an eastward shift from the Great Plains toward the southeast. As a proof-of-concept study, the use of watches and warnings as a proxy for severe storm and tornado frequencies provide both a direct means to assess event occurrence without interannual variability or climatologically shifting areas and a direction for future research for the use of flash flood watches and warnings to expand the assessment of hydrological hazards. Though FEMA’s 1% annual chance flood layer is comprehensive, the data are aging, constantly updated, and simultaneously incomplete because certain areas have not been mapped. These factors lead to the potential underestimation of flood hazards as well as risk. Second, the use of the SLOSH data for the hurricane storm surge hazard permits the individual and composite hazards to consider one source of coastal flooding which is neither probabilistic nor expected but represents a risk of hurricane occurrence. Specifically, rather than focusing on the frequency or probability, the spatial extent of potential storm surge inundation permits an aerial calculation for determining the amount of land flooded in a hexagon as a part of the composite score. Finally, the use of weather station data for temperature (high and low), winter weather, wind, and fog requires a user to accept the inclusion of errors associated with non-stationarity and the fact that interpolation between sometimes scarce weather stations may result in an underestimation of hazard threats in areas further away from measured events.
Given the recent release of a National Risk Index (NRI) by FEMA [97], further research into composite natural hazard identification, mapping, and risk assessment is needed for considering impacts on mitigation planning and risk management strategies. In practical terms, the NRI appears to be the basis for hazard mitigation planning for the state of New York, whereas the state of Washington determined the NRI to be insufficient for state and local interests [98,99]. Future studies should consider the applications for composite hazard identification and mapping and how social and physical vulnerabilities may be influenced by aggregate risk assessment rather than analyzing single hazards and risks independent of other concurrent hazards as well as examine the more complex interactions both between hazards and for cascading, compounding, synergistic, or otherwise interacting events. As suggested by the EPA CRA framework, we expect that natural hazards interact in ways similar to toxic chemicals, whereby cumulative risks for multiple hazards necessitate the development of novel and unique methods for assessing composite hazards in support of communities and hazard mitigation planning.

6. Conclusions

This paper presented novel geospatial approaches for creating individual hazard threat area maps for 15 different natural hazards and provided a national-level Composite Hazard Index integrating these individual hazards in support of multi-hazard risk assessment and planning. This study offers a method to map all spatially relevant hazards in a particular geographic location through both individual and composite hazard risk for the conterminous US. The Composite Hazard Index is based on publicly available authoritative data analyzed and formatted into a novel hexagonal geospatial binning for better visualization and computational efficiency and reduced estimate bias. The Composite Hazard Index represents a sum total multi-hazard layer comprising the first step in a multi-hazard risk assessment: threat analysis. Although conceptually similar to annual threat assessment reports like those produced by the United Nations Office of Disaster Risk Reduction (Swiss Re and Munich Re), this type of threat assessment spans many years on record and provides a high level of geospatial specificity. In shifting from hazard observations to hazard warning areas, we provide a newer understanding of hazard occurrence based on populations being warned of imminent hazardous conditions. This approach inherently includes exposure to hazardous conditions such that the severity of the consequences to the exposed populations and built environment can be estimated historically or probabilistically, a shift called for by hazard mitigation program officials. The temporal and spatial novelty of this work will enable further combination with vulnerability and severity of consequence data, resulting in novel information with which decision makers and planners can build specific mitigation interventions. This empirical understanding of hazard threats, both individually and in combination, can be extended to include similar spatial representations of hazard impacts and consequences as well as underlying vulnerabilities and critical infrastructure information. Together, such composite threat, consequence, and vulnerability information would result in a novel multi-risk assessment for any place in the US where interacting natural hazards can be explored, assessed, and analyzed to improve the comprehensive understanding of natural hazard risks in combination with vulnerability assessment of the communities.
The Composite Hazard Index uses equally sized hexagonal binning at a 647.5-sq. km (250 sq. mile) resolution for the aggregation of hazard occurrences because of its superior performance over rectangles [61]. The hexagonal cells are regular, with straight-line edge segments of equal length that reduce the bias to edge effects and therefore provide more accurate spatial estimates, better visualization, and improved diagonal distribution patterns [60,62]. We used equal weighting for the hazards to formulate a composite hazard. However, the weighting schemes in this technique can be changed to reflect a more significant hazard or interaction with other hazards producing a more significant threat to a community. The CHI’s unique hexagonal quantization also offers advantages over square tessellations, as lines produced by hexagonal quantization retain informative geographical shapes for greater differences in scale than those produced by quantization in square cells [100]. The CHI can be applied across multiple jurisdictional scales from local to regional, state, and federal levels for comparative hazard analysis. The regionalization technique applied here revealed spatial patterns of individual and composite hazard occurrences that are not defined by political boundaries. As such, the individual and composite hazard regions revealed potential opportunities to consider or reconsider hazard mitigation program specialties or focus areas needing improvement for multi-hazard risk and consequence management.
Future related research aims to empirically define other aspects of the risk equation, including building a spatial representation of vulnerability and severity of consequences. Additionally, individual hazard threat zones and associated frequencies over time form the basis of the CHI, making the application of “space-time” cubes and other clustering algorithms a certainty in the future. Such forecasts of future hazard threat areas will clearly identify those places already known to be areas of increased risk and will also result in a more robust pinpointing of places where emergent threat areas have begun to materialize.
Creating a holistic representation of risks, including economic impacts and severity of consequences, will result in a spatial view of where hazards are causing the most losses. The resulting outputs will enable planners and decision makers to see not only the threat areas where physical mitigation measures can reduce impacts but also where threats and vulnerabilities intersect, pinpointing where mitigation measures will serve the most impacted and distressed areas. Appropriate planning and mitigation investments cannot be made without this critical first step of translating state-of-the-science approaches for threat assessment by using geospatial tools that result in a mapped representation of the various hazards occurring at any given place. Just as the National Research Council and Mapping Science Committee [101] have found that a successful response starts with a map, and this paper suggests that successful risk assessments and mitigation planning start with a map as well.

Author Contributions

Conceptualization, C.T.E. and Y.Z.; methodology, Y.Z. and C.T.E.; validation, C.T.E., H.E.L., S.K.A. and Y.Z.; formal analysis, Y.Z., S.K.A. and C.T.E.; investigation, S.K.A., H.E.L., Y.Z. and C.T.E.; data curation, Y.Z.; writing—original draft preparation, Y.Z. and C.T.E.; writing—review and editing, H.E.L., S.K.A., Y.Z. and C.T.E.; visualization, Y.Z. and C.T.E.; supervision, C.T.E.; project administration, C.T.E.; funding acquisition, C.T.E. All authors have read and agreed to the published version of the manuscript.

Funding

This research was funded by the National Academies of Science Gulf Research Program’s Thriving Communities Grant, “The New First Line of Defense: Building Community Resilience through Residential Risk Disclosure”, grant number 200010880.

Data Availability Statement

Data will be made available at www.vulnerabilitymap.org (17 February 2022).

Conflicts of Interest

The authors declare no conflict of interest.

References

  1. Cutter, S.L.; Emrich, C. Are natural hazards and disaster losses in the US increasing? EOS Trans. Am. Geophys. Union 2005, 86, 381–389. [Google Scholar] [CrossRef]
  2. Gall, M.; Borden, K.A.; Emrich, C.T.; Cutter, S.L. The unsustainable trend of natural hazard losses in the United States. Sustainability 2011, 3, 2157–2181. [Google Scholar] [CrossRef] [Green Version]
  3. White, G.F.; Kates, R.W.; Burton, I. Knowing better and losing even more: The use of knowledge in hazards management. Glob. Environ. Change Part B Environ. Hazards 2001, 3, 81–92. [Google Scholar] [CrossRef] [Green Version]
  4. Wallemacq, P.; House, R.; McClean, D.; Below, R. Economic Losses, Poverty, and Disasters 1998–2017; Centre for Research on the Epidemiology of Disasters (CRED) and United Nations Office for Disaster Risk Reduction (UNISDR): Geneva, Switzerland, 2018. [Google Scholar]
  5. Dilley, M.; Chen, R.S.; Deichmann, U.; Lerner-Lam, A.L.; Arnold, M. Natural Disaster Hotspots: A Global Risk Analysis; The World Bank: Washington DC, USA, 2005. [Google Scholar]
  6. CEMHS. Center for Emergency Management and Homeland Security (CEMHS) The Spatial Hazard Events and Losses Database for the United States, Version 19.0. [Online Database]. 2021. Available online: https://cemhs.asu.edu/sheldus (accessed on 11 September 2021).
  7. Iglesias, V.; Braswell, A.E.; Rossi, M.W.; Joseph, M.B.; McShane, C.; Cattau, M.; Koontz, M.J.; McGlinchy, J.; Nagy, R.C.; Balch, J. Risky development: Increasing exposure to natural hazards in the United States. Earth’s Future 2021, 9, e2020EF001795. [Google Scholar] [CrossRef] [PubMed]
  8. Smith, A.B.; Katz, R.W. US billion-dollar weather and climate disasters: Data sources, trends, accuracy and biases. Nat. Hazards 2013, 67, 387–410. [Google Scholar] [CrossRef]
  9. Mileti, D. Disasters by Design: A Reassessment of Natural Hazards in the United States; Joseph Henry Press: Washington, DC, USA, 1999. [Google Scholar]
  10. Leahy, P.P. Natural Hazards Identification and Hazard Management Systems. In Oxford Research Encyclopedias, Natural Hazard Science; Oxford University Press: Oxford, UK, 2017. [Google Scholar] [CrossRef]
  11. FEMA. State Mitigation Plan Review Guide; Federal Emergency Management Authority: Washingtond, DC, USA, 2016.
  12. FEMA. Hazard Identification and Risk Assessment. Available online: https://www.fema.gov/hazard-identification-and-risk-assessment (accessed on 20 October 2021).
  13. National Research Council. Risk Assessment in the Federal Government: Managing the Process; The National Academies Press: Washington, DC, USA, 1983; p. 205. [Google Scholar]
  14. DMA. Disaster Mitigation Act of 2000, Public Law 106–390, 114 STAT. 1552. 42 USC 5133 2000. Available online: https://www.fema.gov/sites/default/files/2020-11/fema_disaster-mitigation-act-of-2000_10-30-2000.pdf (accessed on 27 November 2020).
  15. FEMA. National Mitigation Framework; FEMA: Washington, DC, USA, 2020.
  16. FEMA. Threat Hazard Identification and Risk Assessment. Available online: https://www.fema.gov/threat-and-hazard-identification-and-risk-assessment (accessed on 17 March 2021).
  17. Field, C.B.; Barros, V.; Stocker, T.F.; Dahe, Q. Managing the Risks of Extreme Events and Disasters to Advance Climate Change Adaptation: Special Report of the Intergovernmental Panel on Climate Change; Cambridge University Press: Cambridge, UK, 2012. [Google Scholar]
  18. IPCC. Climate Change 2014: Impacts, Adaptation, and Vulnerability; Cambridge University Press: Cambridge, UK; New York, NY, USA, 2014; p. 688. [Google Scholar]
  19. Hahn, D.J.; Viaud, E.; Corotis, R.B. Multihazard Mapping of the United States. ASCE-ASME J. Risk Uncertain. Eng. Syst. Part A Civ. Eng. 2017, 3, 04016016. [Google Scholar] [CrossRef]
  20. Depietri, Y.; Dahal, K.; McPhearson, T. Multi-hazard risks in New York City. Nat. Hazard Earth Syst. 2018, 18, 3363–3381. [Google Scholar] [CrossRef] [Green Version]
  21. Aksha, S.K.; Resler, L.M.; Juran, L.; Carstensen, L.W., Jr. A geospatial analysis of multi-hazard risk in Dharan, Nepal. Geomat. Nat. Hazards Risk 2020, 11, 88–111. [Google Scholar] [CrossRef] [Green Version]
  22. Bathrellos, G.D.; Skilodimou, H.D.; Chousianitis, K.; Youssef, A.M.; Pradhan, B. Suitability estimation for urban development using multi-hazard assessment map. Sci. Total Environ. 2017, 575, 119–134. [Google Scholar] [CrossRef]
  23. Marzocchi, W.; Garcia-Aristizabal, A.; Gasparini, P.; Mastellone, M.L.; Di Ruocco, A. Basic principles of multi-risk assessment: A case study in Italy. Nat. Hazards 2012, 62, 551–573. [Google Scholar] [CrossRef]
  24. Komendantova, N.; Mrzyglocki, R.; Mignan, A.; Khazai, B.; Wenzel, F.; Patt, A.; Fleming, K. Multi-hazard and multi-risk decision-support tools as a part of participatory risk governance: Feedback from civil protection stakeholders. Int. J. Disaster Risk Reduct. 2014, 8, 50–67. [Google Scholar] [CrossRef] [Green Version]
  25. Monmonier, M. Ethics and map design: Six strategies for confronting the traditional one-map solution. Cartogr. Perspect. 1991, 3–8. [Google Scholar] [CrossRef]
  26. Gill, J.C.; Malamud, B.D. Reviewing and visualizing the interactions of natural hazards. Rev. Geophys. 2014, 52, 680–722. [Google Scholar] [CrossRef] [Green Version]
  27. Kunz, M.; Hurni, L. How to enhance cartographic visualisations of natural hazards assessment results. Cartogr. J. 2011, 48, 60–71. [Google Scholar] [CrossRef]
  28. Pourghasemi, H.R.; Gayen, A.; Edalat, M.; Zarafshar, M.; Tiefenbacher, J.P. Is multi-hazard mapping effective in assessing natural hazards and integrated watershed management? Geosci. Front. 2020, 11, 1203–1217. [Google Scholar] [CrossRef]
  29. Kellens, W.; Vanneuville, W.; Ooms, K.; De Maeyer, P. Communicating flood risk to the public by cartography. In Proceedings of the Twenty-Fourth International Cartographic Conference, Santiago, Chili, 24 November 2009. [Google Scholar]
  30. Cohen, J.E.; Small, C. Hypsographic demography: The distribution of human population by altitude. Proc. Natl. Acad. Sci. USA 1998, 95, 14009–14014. [Google Scholar] [CrossRef] [Green Version]
  31. EPA. Ensuring Risk Reduction in Communities with Multiple Stressors: Environmental Justice and Cumulative Risks/Impacts; EPA: Washington, DC, USA, 2004.
  32. EPA. Framework for Cumulative Risk Assessment; EPA: Washington, DC, USA, 2003.
  33. National Research Council. Implementing Cumulative Risk Assessment. In Science and Decisions: Advancing Risk Assessment; The National Academies Press: Washington, DC, USA, 2009. [Google Scholar]
  34. World Meteorological Organization. Multi-Hazard Early Warning Systems: A Checklist. 2018, pp. 1–20. Available online: https://public.wmo.int/en/our-mandate/focus-areas/natural-hazards-and-disaster-risk-reduction/mhews-checklist (accessed on 17 February 2022).
  35. Gill, J.C.; Malamud, B.D. Hazard interactions and interaction networks (cascades) within multi-hazard methodologies. Earth Syst. Dyn. 2016, 7, 659–679. [Google Scholar] [CrossRef] [Green Version]
  36. Scolobig, A.; Komendantova, N.; Mignan, A. Mainstreaming Multi-Risk Approaches into Policy. Geosciences 2017, 7, 129. [Google Scholar] [CrossRef] [Green Version]
  37. Kappes, M.S.; Keiler, M.; von Elverfeldt, K.; Glade, T. Challenges of analyzing multi-hazard risk: A review. Nat. Hazards 2012, 64, 1925–1958. [Google Scholar] [CrossRef] [Green Version]
  38. Liu, Z.; Nadim, F.; Garcia-Aristizabal, A.; Mignan, A.; Fleming, K.; Luna, B.Q. A three-level framework for multi-risk assessment. Georisk Assess. Manag. Risk Eng. Syst. Geohazards 2015, 9, 59–74. [Google Scholar] [CrossRef] [Green Version]
  39. Cutter, S.L. The changing nature of hazard and disaster risk in the Anthropocene. Ann. Am. Assoc. Geogr. 2021, 111, 819–827. [Google Scholar]
  40. Garcia-Aristizabal, A.; Gasparini, P.; Uhinga, G. Multi-risk assessment as a tool for decision-making. In Urban Vulnerability and Climate Change in Africa; Springer: Berlin/Heidelberg, Germany, 2015; pp. 229–258. [Google Scholar]
  41. Pilone, E.; Demichela, M.; Baldissone, G. The Multi-Risk Assessment Approach as a Basis for the Territorial Resilience. Sustainability 2019, 11, 2612. [Google Scholar] [CrossRef] [Green Version]
  42. Smith, A.B. 2010–2019: A landmark decade of U.S. billion-dollar weather and climate disasters. Natl. Ocean. Atmos. Adm. 2020. Available online: https://www.climate.gov/news-features/blogs/beyond-data/2010-2019-landmark-decade-us-billion-dollar-weather-and-climate (accessed on 11 February 2021).
  43. Menne, M.J.; Durre, I.; Korzeniewski, B.; McNeal, S.; Thomas, K.; Yin, X.; Anthony, S.; Ray, R.; Vose, R.S.; Gleason, B.E. Global Historical Climatology Network-Daily (GHCN-Daily), Version 3.26; NOAA: Washington, DC, USA, 2012; Volume 10. [CrossRef]
  44. IEM. Iowa Environmental Mesonet; Iowa State University: Ames, IA, USA, 2020. [Google Scholar]
  45. Jacobson, A.R.; Holzworth, R.H.; Brundell, J.B. Using the World Wide Lightning Location Network (WWLLN) to Study Very Low Frequency Transmission in the Earth-Ionosphere Waveguide: 1. Comparison With a Full-Wave Model. Radio Sci. 2021, 56, e2021RS007293. [Google Scholar] [CrossRef]
  46. SPC. U.S. Hails (1955–2019). 2021. Available online: https://www.spc.noaa.gov/gis/svrgis/ (accessed on 27 March 2021).
  47. Short, K.C. Spatial Wildfire Occurrence Data for the United States, 1992–2018 [FPA_FOD_20210617]; USDA: Washington, DC, USA, 2021. [CrossRef]
  48. Demuth, J.L.; DeMaria, M.; Knaff, J.A. Improvement of advanced microwave sounding unit tropical cyclone intensity and size estimation algorithms. J. Appl. Meteorol. Climatol. 2006, 45, 1573–1581. [Google Scholar] [CrossRef]
  49. FEMA. National Flood Hazard Layer (NFHL). Available online: https://msc.fema.gov/portal/home (accessed on 11 February 2020).
  50. Zachry, B.C.; Booth, W.J.; Rhome, J.R.; Sharon, T.M. A national view of storm surge risk and inundation. Weather Clim. Soc. 2015, 7, 109–117. [Google Scholar] [CrossRef]
  51. USDM. U.S. Drought Monitor. Available online: https://droughtmonitor.unl.edu/DmData/GISData.aspx (accessed on 11 February 2019).
  52. Petersen, M.D.; Mueller, C.S.; Moschetti, M.P.; Hoover, S.M.; Shumway, A.M.; McNamara, D.E.; Williams, R.A.; Llenos, A.L.; Ellsworth, W.L.; Michael, A.J. 2017 one-year seismic-hazard forecast for the central and eastern United States from induced and natural earthquakes. Seismol. Res. Lett. 2017, 88, 772–783. [Google Scholar] [CrossRef]
  53. Meng, Q.; Liu, Z.; Borders, B.E. Assessment of regression kriging for spatial interpolation–comparisons of seven GIS interpolation methods. Cartogr. Geogr. Inf. Sci. 2013, 40, 28–39. [Google Scholar] [CrossRef]
  54. Oliver, M.A.; Webster, R. Kriging: A method of interpolation for geographical information systems. Int. J. Geogr. Inf. Syst. 1990, 4, 313–332. [Google Scholar] [CrossRef]
  55. Wing, O.E.J.; Bates, P.D.; Sampson, C.C.; Smith, A.M.; Johnson, K.A.; Erickson, T.A. Validation of a 30 m resolution flood hazard model of the conterminous United States. Water Resour. Res. 2017, 53, 7968–7986. [Google Scholar] [CrossRef]
  56. Kruk, M.C.; Gibney, E.J.; Levinson, D.H.; Squires, M. A climatology of inland winds from tropical cyclones for the eastern United States. J. Appl. Meteorol. Climatol. 2010, 49, 1538–1547. [Google Scholar] [CrossRef]
  57. Petersen, M.D.; Moschetti, M.P.; Powers, P.M.; Mueller, C.S.; Haller, K.M.; Frankel, A.D.; Zeng, Y.; Rezaeian, S.; Harmsen, S.C.; Boyd, O.S.; et al. The 2014 United States National Seismic Hazard Model. Earthq. Spectra 2015, 31, S1–S30. [Google Scholar] [CrossRef]
  58. Moschetti, M.P.; Powers, P.M.; Petersen, M.D.; Boyd, O.S.; Chen, R.; Field, E.H.; Frankel, A.D.; Haller, K.M.; Harmsen, S.C.; Mueller, C.S.; et al. Seismic Source Characterization for the 2014 Update of the U.S. National Seismic Hazard Model. Earthq. Spectra 2015, 31, S31–S57. [Google Scholar] [CrossRef]
  59. Battersby, S.E. Data Map Discovery: How to Use Spatial Binning for Complex Point Distribution Maps. 2017. Available online: https://www.tableau.com/about/blog/2017/11/data-map-discovery-78603 (accessed on 17 September 2021).
  60. Birch, C.P.; Oom, S.P.; Beecham, J.A. Rectangular and hexagonal grids used for observation, experiment and simulation in ecology. Ecol. Model. 2007, 206, 347–359. [Google Scholar] [CrossRef]
  61. Battersby, S.E.; Strebe, D.d.; Finn, M.P. Shapes on a plane: Evaluating the impact of projection distortion on spatial binning. Cartogr. Geogr. Inf. Sci. 2017, 44, 410–421. [Google Scholar] [CrossRef]
  62. Chua, A.; Moere, A.V. Binsq: Visualizing geographic dot density patterns with gridded maps. Cartogr. Geogr. Inf. Sci. 2017, 44, 390–409. [Google Scholar] [CrossRef]
  63. Emrich, C.T.; Cutter, S.L. Social vulnerability to climate-sensitive hazards in the southern United States. Weather Clim. Soc. 2011, 3, 193–208. [Google Scholar] [CrossRef]
  64. Anselin, L. Cluster Analysis: Spatially Constrained Clustering Methods; GeoDa: GitHub, 2017. Available online: https://geodacenter.github.io/tutorials/spatial_cluster/skater.html (accessed on 17 September 2021).
  65. Bloomfield, P.; Davis, J.M. Orthogonal rotation of complex principal components. Int. J. Climatol. 1994, 14, 759–775. [Google Scholar] [CrossRef]
  66. Zhang, Y.; Moges, S.; Block, P. Optimal Cluster Analysis for Objective Regionalization of Seasonal Precipitation in Regions of High Spatial–Temporal Variability: Application to Western Ethiopia. J. Clim. 2016, 29, 3697–3717. [Google Scholar] [CrossRef]
  67. Marutho, D.; Handaka, S.H.; Wijaya, E. The determination of cluster number at k-mean using elbow method and purity evaluation on headline news. In Proceedings of the 2018 International Seminar on Application for Technology of Information and Communication, Semarang, Indonesia, 21–22 September 2018; pp. 533–538. [Google Scholar]
  68. Harrison, D.R.; Karstens, C.D. A climatology of operational storm-based warnings: A geospatial analysis. Weather Forecast. 2017, 32, 47–60. [Google Scholar] [CrossRef]
  69. Gensini, V.A.; Brooks, H.E. Spatial trends in United States tornado frequency. NPJ Clim. Atmos. Sci. 2018, 1, 38. [Google Scholar] [CrossRef] [Green Version]
  70. Holle, R.L. Diurnal Variations of NLDN-Reported Cloud-to-Ground Lightning in the United States. Mon. Weather Rev. 2014, 142, 1037–1052. [Google Scholar] [CrossRef]
  71. Brimelow, J.C.; Burrows, W.R.; Hanesiak, J.M. The changing hail threat over North America in response to anthropogenic climate change. Nat. Clim. Change 2017, 7, 516. [Google Scholar] [CrossRef]
  72. Tang, B.H.; Gensini, V.A.; Homeyer, C.R. Trends in United States large hail environments and observations. NPJ Clim. Atmos. Sci. 2019, 2, 45. [Google Scholar] [CrossRef] [Green Version]
  73. Ashley, W.S.; Black, A.W. Fatalities associated with nonconvective high-wind events in the United States. J. Appl. Meteorol. Climatol. 2008, 47, 717–725. [Google Scholar] [CrossRef]
  74. Ashley, W.S.; Strader, S.; Dziubla, D.C.; Haberlie, A. Driving Blind: Weather-Related Vision Hazards and Fatal Motor Vehicle Crashes. Bull. Am. Meteorol. Soc. 2015, 96, 755–778. [Google Scholar] [CrossRef]
  75. Kumfer, W.; Harmon, K.; Lan, B.; Wang, Y.; Goodwin, A.; Srinivasan, R.; Vann, M. Traffic Safety in Appalachia; Appalachian Regional Commission: Wasington, DC, USA, 2021.
  76. Call, D.A.; Wilson, C.S.; Shourd, K.N. Hazardous weather conditions and multiple-vehicle chain-reaction crashes in the United States. Meteorol. Appl. 2018, 25, 466–471. [Google Scholar] [CrossRef] [Green Version]
  77. Branick, M.L. A climatology of significant winter-type weather events in the contiguous United States, 1982–1994. Weather Forecast. 1997, 12, 193–207. [Google Scholar] [CrossRef]
  78. Wobus, C.; Zarakas, C.; Malek, P.; Sanderson, B.; Crimmins, A.; Kolian, M.; Sarofim, M.; Weaver, C.P. Reframing Future Risks of Extreme Heat in the United States. Earth’s Future 2018, 6, 1323–1335. [Google Scholar] [CrossRef]
  79. Chen, L.G.; Gottschalck, J.; Hartman, A.; Miskus, D.; Tinker, R.; Artusa, A. Flash Drought Characteristics Based on U.S. Drought Monitor. Atmosphere 2019, 10, 498. [Google Scholar] [CrossRef] [Green Version]
  80. Short, K. A spatial database of wildfires in the United States, 1992–2011. Earth Syst. Sci. Data 2014, 6, 1–27. [Google Scholar] [CrossRef] [Green Version]
  81. Hough, S.E. Shaking from injection-induced earthquakes in the central and eastern United States. Bull. Seismol. Soc. Am. 2014, 104, 2619–2626. [Google Scholar] [CrossRef] [Green Version]
  82. Ellsworth, W.L.; Llenos, A.L.; McGarr, A.F.; Michael, A.J.; Rubinstein, J.L.; Mueller, C.S.; Petersen, M.D.; Calais, E. Increasing seismicity in the US midcontinent: Implications for earthquake hazard. Lead. Edge 2015, 34, 618–626. [Google Scholar] [CrossRef] [Green Version]
  83. Petersen, M.D.; Shumway, A.M.; Powers, P.M.; Mueller, C.S.; Moschetti, M.P.; Frankel, A.D.; Rezaeian, S.; McNamara, D.E.; Luco, N.; Boyd, O.S.; et al. The 2018 update of the US National Seismic Hazard Model: Overview of model and implications. Earthq. Spectra 2020, 36, 5–41. [Google Scholar] [CrossRef]
  84. Tardif, R.; Rasmussen, R.M. Event-based climatology and typology of fog in the New York City region. J. Appl. Meteorol. Climatol. 2007, 46, 1141–1168. [Google Scholar] [CrossRef] [Green Version]
  85. Frumhoff, P.C.; McCarthy, J.J.; Melillo, J.M.; Moser, S.C.; Wuebbles, D.J. Confronting Climate Change in the US Northeast: Science, Impacts, and Solutions; 2007. Available online: https://www.ucsusa.org/sites/default/files/2019-09/confronting-climate-change-in-the-u-s-northeast.pdf (accessed on 17 February 2022).
  86. Long, J.A.; Stoy, P.C.; Gerken, T. Tornado seasonality in the southeastern United States. Weather Clim. Extrem. 2018, 20, 81–91. [Google Scholar] [CrossRef]
  87. Ashley, W.S. Spatial and temporal analysis of tornado fatalities in the United States: 1880–2005. Weather Forecast. 2007, 22, 1214–1228. [Google Scholar] [CrossRef]
  88. NOAA. Record Number of Billion-Dollar Disasters Struck U.S. in 2020: Nation Saw Its 5th-Warmest Year on Record. 8 January 2021. Available online: https://www.noaa.gov/stories/record-number-of-billion-dollar-disasters-struck-us-in-2020 (accessed on 24 May 2021).
  89. Kistner, E.; Kellner, O.; Andresen, J.; Todey, D.; Morton, L.W. Vulnerability of specialty crops to short-term climatic variability and adaptation strategies in the Midwestern USA. Clim. Chang. 2018, 146, 145–158. [Google Scholar] [CrossRef] [Green Version]
  90. Reidmiller, D.; Avery, C.; Easterling, D.; Kunkel, K.; Lewis, K.; Maycock, T.; Stewart, B. Fourth National Climate Assessment. Vol. II: Impacts Risks Adapt. United States. 2018. Available online: https://nca2018.globalchange.gov/downloads/NCA4_2018_FullReport.pdf (accessed on 17 March 2021).
  91. Doswell III, C.A.; Brooks, H.E.; Kay, M.P. Climatological estimates of daily local nontornadic severe thunderstorm probability for the United States. Weather Forecast. 2005, 20, 577–595. [Google Scholar] [CrossRef] [Green Version]
  92. Jeong, J.-H.; Fan, J.; Homeyer, C.R.; Hou, Z. Understanding hailstone temporal variability and contributing factors over the US Southern Great Plains. J Clim. 2020, 33, 3947–3966. [Google Scholar] [CrossRef] [Green Version]
  93. Allen, J.T.; Tippett, M.K. The characteristics of United States hail reports: 1955–2014. E-J. Sev. Storms Meteorol. 2015, 10, 1–26. [Google Scholar]
  94. Cook, E.R.; Seager, R.; Cane, M.A.; Stahle, D.W. North American drought: Reconstructions, causes, and consequences. Earth-Sci. Rev. 2007, 81, 93–134. [Google Scholar] [CrossRef]
  95. AghaKouchak, A.; Cheng, L.; Mazdiyasni, O.; Farahmand, A. Global warming and changes in risk of concurrent climate extremes: Insights from the 2014 California drought. Geophys. Res. Lett. 2014, 41, 8847–8852. [Google Scholar] [CrossRef] [Green Version]
  96. Scanlon, B.; Levitt, D.; Reedy, R.; Keese, K.; Sully, M. Ecological controls on water-cycle response to climate variability in deserts. Proc. Natl. Acad. Sci. USA 2005, 102, 6033–6038. [Google Scholar] [CrossRef] [PubMed] [Green Version]
  97. FEMA. The National Risk Index. 2021. Available online: https://hazards.fema.gov/nri/ (accessed on 21 September 2021).
  98. NY-DHSES. New York State Hazard Mirgiation Plan. 2019, New York State Division of Homeland Security and Emergency Services. Available online: https://mitigateny.availabs.org/ (accessed on 21 September 2021).
  99. WEMD. Washington State Enhanced Hazard Mitigation Plan; Washington Emergency Management Division (WEMD): Washington, DC, USA, 2018; pp. 1–245.
  100. Raposo, P. Scale-specific automated line simplification by vertex clustering on a hexagonal tessellation. Cartogr. Geogr. Inf. Sci. 2013, 40, 427–443. [Google Scholar] [CrossRef]
  101. National Research Council. Successful Response Starts with a Map: Improving Geospatial Support for Disaster Management; National Academies Press: Washington, DC, USA, 2007. [Google Scholar] [CrossRef]
Figure 1. Severe weather hazards: (A) severe storms, (B) tornadoes, (C) lightning, (D) hail, (E) wind, and (F) fog.
Sustainability 14 02685 g001
Figure 2. Flood and coastal hazards: (A) flooding, (B) storm surges, and (C) hurricanes.
Sustainability 14 02685 g002
Figure 3. (A) Low temperature and (B) winter weather hazards.
Sustainability 14 02685 g003
Figure 4. (A) High temperature, (B) drought, and (C) wildfire hazards.
Sustainability 14 02685 g004
Figure 5. Earthquake hazard.
Sustainability 14 02685 g005
Figure 6. Composite Hazard Index representing the combination of 15 individual hazard threat maps.
Sustainability 14 02685 g006
Figure 7. Categorical Summary of Composite Hazard Index scores by US state.
Sustainability 14 02685 g007
Figure 8. The total within-cluster sum of squares (WSS) (gray bar chart, primary Y-axis) and the difference in total WSS from k − 1 to k (blue line chart, secondary Y-axis).
Sustainability 14 02685 g008
Figure 9. Regionalization of Composite Hazard Index and associated singular hazards.
Sustainability 14 02685 g009
Table 1. Data sources and variables of hazards.
HazardsPeriodIndicators or Threat Determination FactorsDataset and Source
Wind1988–2017Average annual days of wind speed exceeding 30 knotsGHCN [43]
Fog1988–2017Average annual fog daysGHCN [43]
Tornado2002–2017Average annual frequency of tornado warningsIEM [44]
Severe Storm2002–2017Average annual frequency of severe thunderstorm warningsIEM [44]
Lightning1988–2017Average annual of cloud-to-ground lightning flashes per sq. kmWWLLN [45]
Hail1988–2017Average annual frequency of hailSPC, NOAA [46]
Wildfire1980–2016Probability of an acre or more burning if ignitedUSGS [47]
Hurricane1988–2017Average annual frequency of tropical storm-force windsEBT [48]
100-Year Flood-Modeled inundation of 100-year floodFEMA [49]
Storm Surge-Modeled inundation of storm surge from a Category 1 hurricaneSLOSH, NOAA [50]
High Temperatures1988–2017Average annual frequency of days where the daily maximum is above 100 °FGHCN [43]
Drought2000–2017Average annual frequency of weeks in drought per yearUSDM [51]
Low Temperatures1988–2017Average annual frequency of days where the daily minimum is below 32 °FGHCN [43]
Winter Day1988–2017Average annual frequency of days an area can expect to experience winter weatherGHCN [43]
Earthquake-Peak ground acceleration with a 2% probability of exceedance in 50 yearsUSGS [52]
Table 2. Average hazard indicator values of regions derived from CHI. Red text indicates the most frequent threats in each region.
Region Created by Clustering Algorithms
123456789
1Severe Storm3.274.283.292.894.162.542.002.392.00
2Tornado2.584.263.752.853.572.302.012.272.02
3Lightning2.433.924.272.523.492.582.072.752.00
4Hail2.883.502.893.014.302.622.062.242.02
5Wind2.082.132.032.833.914.813.002.982.08
6Fog4.003.084.072.772.592.252.272.254.17
7Flooding2.853.363.872.662.662.282.302.622.91
8Storm Surge3.233.013.553.003.003.003.003.013.00
9Hurricane3.803.504.662.092.142.052.002.342.00
10Low Temperature3.242.391.593.843.213.743.831.631.75
11Winter3.443.032.943.173.133.042.972.763.09
12High Temperature3.003.043.073.003.313.053.014.553.26
13Drought1.612.482.982.053.383.583.794.322.99
14Wildfire2.923.113.662.592.592.602.922.663.35
15Earthquake2.793.212.312.102.302.813.623.124.58
Overall Average2.943.223.262.763.182.882.722.792.75
Overall Rank
(1–9 (most to least hazardous))
421735968
Publisher’s Note: MDPI stays neutral with regard to jurisdictional claims in published maps and institutional affiliations.

