
Can the Spatial Function Division of Urbanization Promote Regional Coordinated Development? Evidence from the Yangtze River Economic Belt in China


1
School of Economics and Management, Nanjing University of Aeronautics and Astronautics, Nanjing 211106, China
2
School of Economics and Management, Qilu Normal University, Jinan 250200, China
*
Author to whom correspondence should be addressed.
Sustainability 2022, 14(12), 7115; https://doi.org/10.3390/su14127115
Submission received: 10 May 2022
/
Revised: 6 June 2022
/
Accepted: 8 June 2022
/
Published: 10 June 2022
Abstract
:The spatial function division of urbanization (SFDU) based on the value chain has an important impact on optimizing the industrial layouts of these areas and promoting regional coordinated development. Based on urban panel data from the Yangtze River Economic Belt (YREB) from 2007 to 2016, this paper uses the SYS-GMM, fixed-effects, and quantile regression methods to test the impact of the SFDU on regional coordinated development and further reveals its mechanism of impact. The results show the following: (1) the SFDU significantly improves the level of regional coordinated development, and the introduction of the SYS-GMM method enables us to overcome the endogenous problem of regression; (2) the improvement of capital allocation efficiency is an important way for the SFDU to promote regional coordinated development, whereas labor allocation efficiency is related to “process distortion”; (3) the impact of the SFDU on coordinated regional development in the middle and lower reaches of the YREB is stronger than that in the upper reaches; and (4) the promoting effect of the SFDU on coordinated regional development is significantly higher in the “economic coordination dimension” than in the “people’s livelihoods” and “ecological coordination” dimensions. This paper provides a valuable reference for the government to formulate regional coordinated development policies in basin economies around the world from the perspective of sustainable development.
1. Introduction
The green and coordinated development of urbanization has become an important issue in regional sustainable development [1,2,3]. Regions are not isolated; one region affects another [4,5]. Regional development is the result of a balance between agglomeration force [6] and diffusion force [7], formed via the effects of market size [8], market crowding [9], cost of living [10], and the ecological environment [11] through the circular accumulation of causal chains. Cities and urban agglomerations or economic belts organically composed of contiguous cities play a role in promoting the green and coordinated development of regions through the division of labor among cities [12,13,14]. The development of inter-city divisions of labor has already had various effects on the evolution of intra-group economic geography [15,16]. Studying the influence of the urban division of labor on regional coordinated development is of great significance in order to improve the regional development strategies dominated by cities in the future.
Spatial–functional division is an important way to induce regional economic growth to promote the optimal allocation of factor space, and it is also an important means to lead the rational optimization of industrial spatial layout, which has gradually become a general consensus in the literature [17,18,19]. In contrast with the traditional division of labor between departments and products, the spatial function division of urbanization (SFDU) is based on the division of labor at different nodes of the industrial chain within products, blurring industrial boundaries and breaking space constraints. In terms of space, it is the vertical separation of the industrial chain, and in terms of function, it is the differentiation of urban functions [20,21]. The SFDU reflects a state in which different industries are arranged in space to achieve optimal spatial efficiency. It is an important form of the division of labor between cities and conveys an important mechanism for regional coordinated development. However, the existing research has paid little attention to the empirical analysis of how the SFDU promotes regional coordinated development and also has not considered the effect of heterogeneity in different regions and different dimensions. In addition, a large body of research has focused on the national or enterprise level, whereas little research has been conducted on river basin economies.
In fact, the river basin economy is a type of economic system that is divided by the basin as a spatial unit, and it is a subsystem of the giant national economic system [22]. Various elements in the basin are extremely closely related, and the mutual restriction and mutual influence between the upper, middle, and lower reaches, and even the cities, are also very significant. It has the development characteristics of strong integrity and a high degree of relevance [23]. At the same time, cities are becoming the main spatial form bearing the elements of development, playing the role of a production incubator and a factor flow hub [24]. They are also the most effective units for the government to carry out governance [25]. Therefore, the coordinated governance of river basin cities is an important part of the overall strategy of national socio-economic development, and researching the heterogeneity among river basin regions and achieving coordinated development among regions has become an important issue for most countries worldwide. In addition, the differences in the development backgrounds of the river basin regions may lead to different paths and characteristics for the SFDU and regional coordinated development under the influence of certain factors, which are also worth examining and exploring.
The Yangtze River Economic Belt (YREB) is one of the world’s typical basin economies [26]; it is similar to the Mississippi, Rhine, Danube, and La Plata-Parana in terms of natural conditions, ecological conditions, and socioeconomic development. The development scenarios of the upper, middle, and lower reaches of each basin are different [27]. These large span river basin economies all exhibit the problem of ignoring sustainable social and economic development due to the excessive pursuit of short term benefits [27]. In “The 14th Five-Year Development Plan for the Yangtze River Economic Belt” issued in 2021, it was pointed out that it is necessary to promote the high-quality development of the Yangtze River Economic Belt and create a new model of regional coordinated development. However, for a long time, market segmentation, disorderly competition, and homogenization of the industrial structure among cities in the YREB have been serious problems [28,29], affected by factors such as historical development, geographical location, factor endowments, and administrative intervention. As a result, there are great differences in the developmental levels of the regional economy, people’s livelihoods, and in terms of ecology. The high-quality coordinated development of the YREB is facing major challenges. Therefore, the choice of the YREB as a research sample has great theoretical and practical significance. Specifically, does the deepening of the SFDU help to promote the regional coordinated development of the YREB? What is the internal mechanism by which the SFDU affects the regional coordinated development? Does the SFDU have a heterogeneous impact on the coordinated development in different river basins and different dimensions of regional coordinated development? In order to solve the above questions, in this paper we not only attempt to verify whether the SFDU in the YREB has a positive role in promoting regional coordinated development but also attempt to further study the internal mechanism of influence and the heterogeneity between the two. We also hope that it can enrich the theoretical exploration of the inter-regional economic division mode and regional coordinated development. We also aim to provide meaningful experience and guidance for the coordinated development of basin economies around the world from the perspective of sustainable development.
In view of this, based on panel data from 108 cities in the Yangtze River economic belt from 2007 to 2016, in this paper, we conduct analyses of the following aspects. First, we conduct a theoretical analysis and empirical testing of the impact of the SFDU on regional coordinated development and explore the heterogeneity of its impact. Second, based on the connotations of regional coordinated development in the new era, we establish an evaluation system to measure the levels, focusing on three aspects—the economy, residents’ livelihoods, and the ecological environment. Thirdly, we explore the internal mechanism of the influence of the SFDU on regional coordinated development from the perspective of resource allocation efficiency.
The marginal contribution of this paper is mainly reflected in three aspects. The first is the research content. Most of the existing studies have focused on the effects of the SFDU on economic development. Based on the calculation of the degree of specialization of urban participation in the industrial value chain using industry employment data, in this paper, we attempt to analyze the impact of the SFDU on coordinated regional development, which will broaden the scope of research on spatial function division and coordinated development. The second is the research perspective. Existing studies focusing on regional coordinated development are limited to the level of administrative regions such as provinces or cities. This perspective has blurred the coevolution and inner economic relationships between regions. In contrast with these previous perspectives, based on panel data from 108 cities in the Yangtze River Economic Belt, this paper empirically tests the role of the SFDU in promoting regional coordinated development and studies its internal impact path from the perspective of labor and capital factor allocation efficiency. This deepens our understanding of the SFDU, the efficiency of factor allocation, and their role in terms of regional coordination. The third marginal contribution is in the area of policy inspiration. On the basis of demonstrating the effects and mechanisms of the influence of the SFDU on regional coordinated development, this paper further examines the effect of the heterogeneity of the SFDU on regional coordinated development in the upper, middle, and lower reaches of the study area, as well as in the coordination dimensions of the economy, people’s livelihoods, and ecology. This provides empirical support and experience for international river basin economies to optimize the combination of regional coordination measures and enhance the effect of regional coordination policies.
The rest of this paper is organized as follows: Section 2 presents the literature review. Section 3 introduces the theoretical analysis and research hypotheses. Section 4 presents the regression methods and related data. In Section 5, we present the empirical results. In Section 6, we present a discussion. In Section 7, the conclusions and prospects are discussed.
2. Literature Review
Regional coordinated development is a process in which the gap between regions is gradually narrowed on the basis of the improvement of the economy, people’s livelihoods, and ecology in the region. Research on regional coordinated development has gradually deepened along the following three lines: The first of these is in terms of the theoretical discussion. The relevant research mainly considers the actual situation of the region in order to carry out theoretical analyses from the perspective of a basic idea, concept connotation, logic, mechanism, future development, and so on [30,31,32]. The second line of research involves the measurement of regional coordinated development. Regional coordinated development requires comprehensive consideration, but due to different perspectives on the connotation of regional coordinated development, a unified measurement system has not been formed. Some scholars have used the variation coefficient of a single index, such as per capita GDP or the Gini coefficient, to measure and evaluate the degree of coordination of regional economic development from the perspective of economic differences [33,34]. In view of the complexity of regional coordinated development, some scholars have constructed indicator systems of regional coordinated development to comprehensively measure the level of regional coordinated development from different perspectives, examining topics such as differences in economic and social development [35,36], the realization of main functions [37,38], and modern development concepts [39,40]. The third line of research involves the empirical testing of regional coordinated development. Starting from a factor that affects regional coordinated development, most studies empirically test the relationship and mechanism of its impact on regional coordinated development and, respectively, discuss the relationship between industrial development [41,42], industry and market development [43], spatial and temporal patterns [44,45], regional spillover [46,47], urban space and networks [48,49], and regional coordinated development. In addition, some studies have explored the internal mechanism of promoting regional coordinated development from the perspective of technological progress [50] and the upgrading of the industrial structure [51].
Existing studies on the relationship between the SFDU and regional development mainly focus on the impact of the SFDU on regional economic development, and the conclusions of these studies are inconsistent. Most studies have indicated that the SFDU promotes regional economic development. The SFDU can significantly promote regional economic development through the optimization of inter-city industrial agglomeration modes [52]. From the perspective of the action mechanism, the SFDU essentially strengthens the positive externalities between cities, accelerates the formation of agglomeration economic effects between cities [53], and strengthens the positive spillovers between neighboring cities, thus leading to greater economies of scale and promoting the high-quality development of the regional economy [54]. Moreover, other studies have found that the SFDU has an inverted, U-shaped impact relationship on economic development [55,56], and economic development can be effectively promoted only when it exceeds a certain level. However, some studies believe that the SFDU may be detrimental to the development of the urban economy. The unipolar development of cities in a region is generally observed, and the central city under the mode of labor division of the urban area has a certain effect of squeezing and shielding the development of the sub-central city [57,58]. When the industrial scale of the central city overexpands, a crowding effect also occurs, and enterprises may face higher land rent and transportation costs [59]. In addition, the cities within an area exhibit economic decentralization according to industry and the space function division, which can improve the development of local government economic motivation and prompt them to use administrative measures to protect local industry in order to maximize short-term economic interests, thereby hampering the free flow of elements within the urban agglomeration and optimizing the configuration to limit the overall efficiency of ascension [60]. There is a lack of literature on the relationship between the SFDU and regional coordinated development, and few studies have discussed the influence of the SFDU on regional coordinated development from a theoretical level. Wei [35] found that the SFDU based on the industrial chain was an effective way to resolve industrial conflicts between regions. Liao and Li [61] showed that the professionalization of the urban green technology innovation process promotes urban green development, and it also narrows the gap in the level of green development between China’s central cities and non-central cities. Li [62] took the Beijing–Tianjin–Hebei urban circle as an example to verify the synergistic relationship between the SFDU and regional economic development. Hou and Zhang [63] analyzed the impact of the SFDU in the Beijing–Tianjin–Hebei urban agglomeration on the coordinated development of the region and concluded that the Beijing–Tianjin–Hebei urban agglomeration had not formed a real SFDU pattern, which was not conducive to the continued promotion of coordinated regional development.
The existing literature has provided a basis and inspiration for this paper, but there are still some deficiencies in exploring the relationship between the SFDU and regional coordinated development. Firstly, the existing research has mainly focused on the impact of the SFDU on regional economic development. Empirical analyses and discussions of the effect of the SFDU on regional coordinated development are scarce. Secondly, research on the internal mechanism of the SFDU affecting regional coordinated development seems to have been neglected. Third, regional coordinated development is a systematic project. Most scholars measure and analyze it from a certain dimension, such as economic growth or wage gaps in regional coordinated development, which lacks comprehensiveness and is not a systematic approach. As a typical example of one of the world’s basin economies, the YREB is a key region in relation to China’s new strategy of regional coordinated development [22]. The relationship between the SFDU and the development pattern of the YREB is thus also relevant to and worthy of attention from most countries worldwide.
3. Theoretical Analysis and Research Hypotheses
3.1. The SFDU and Regional Coordinated Development
The SFDU shows the characteristics of industrial agglomeration in different cities. Industrial agglomeration will not only produce positive effects such as knowledge spillover effects and scale effects, but also negative effects such as crowding effects, cost effects, and competition effects [64,65]. According to neoclassical economics theory, industries that are part of different links in the industrial chain can combine their own characteristics and make decisions on whether to move industries spatially, based on the comparison of marginal benefits and marginal costs generated by agglomeration effects [66,67]. For example, high-end links in the industrial chain that are more sensitive to the positive effect of agglomeration (or for which the marginal benefit of the agglomeration effect is greater than the marginal cost) such as R&D and design industries, will choose to stay in large cities or regional central cities with a high level of agglomeration. This will attract similar industrial chain links in surrounding cities with low agglomeration levels to agglomerate to that city [17]. On the contrary, low-end industrial chain links such as manufacturing and others are more sensitive to negative effects such as rising costs caused by agglomeration. This means that the decision to transfer to the neighboring small and medium-sized cities is made when the marginal cost exceeds the marginal revenue. Therefore, with the continuous deepening of the SFDU, the advantages for industries that are part of different links in the industrial chain and for different cities in the region have been optimized and matched, avoiding the shortcomings of excessive agglomeration and simple, diversified agglomeration. The symbiotic relationship of cities has been continuously strengthened, forming a new pattern of the reasonable industrial division of labor, orderly competition, complementary functions, and close cooperation between cities in the region, which has narrowed the developmental differences within the region, enhanced the regional comprehensive strength, and improved the level of regional coordinated development. Therefore, this paper proposes the following research hypothesis:
Hypothesis 1 (H1).
The SFDU has a positive impact on regional coordinated development.
3.2. The SFDU, Allocating of Factors and Regional Coordinated Development
Reasonable flow and the optimized allocation of resource factors are the main factors driving regional coordinated development. Firstly, the SFDU optimizes the regional industrial chain and its spatial layout, so that knowledge-intensive industrial chain links such as design, R&D, and finance are mainly concentrated in large cities or regional central cities. Industrial chain links, such as high-tech industries and logistics distribution are mainly concentrated in medium cities or regional sub-center cities. Labor-intensive industrial chain links such as general production and manufacturing are mainly concentrated in small cities or regional peripheral cities, realizing the efficient agglomeration of production factors such as labor and capital at the industrial chain level and the regional space level. The various links of the industrial chain cooperate closely between different cities, which improves the efficiency of resource allocation in various regions [68,69]. Secondly, the SFDU brings about the optimization of the division of industrial functions between cities, which changes the demand for labor, capital, and other factors in different regions, and promotes the flow and transfer of various factors across regions under the action of market pricing [70]. Therefore, the SFDU makes the agglomeration and allocation of factors between cities more reasonable. On the one hand, the SFDU promotes the rationalization of the allocation of labor factors in the region, improves labor productivity, and reduces labor costs through the rational spatial flow of labor and its efficient agglomeration among different industries. The cost of production promotes the balance between the economic growth of the inflow and outflow areas [71] and the high-quality development of each city [72] and ultimately achieves the coordinated development of the entire region. On the other hand, the efficient agglomeration of different regions improves the efficiency of capital investment, thereby reducing the development gap within the region while promoting regional coordinated development [73]. Based on the above analysis, this paper proposes the following research hypotheses:
Hypothesis 2 (H2).
The SFDU positively impacts regional coordinated development by improving the allocation efficiency of labor factors.
Hypothesis 3 (H3).
The SFDU positively impacts regional coordinated development by improving the allocation efficiency of capital factors.
Figure 1 shows the theoretical analysis framework of this paper.
4. Methodology and Data
4.1. Model Specification
4.1.1. Basic Regression Model
This paper mainly analyzes the impact of the SFDU on regional coordinated development. Therefore, the following basic regression model based on panel data is firstly constructed:
In Equation (1), represents the regional coordinated development indicator of city i in period t, represents the SFDU index, stands for physical capital level, stands for human capital level, is the urbanization rate, is the government intervention level, is foreign direct investment, is the industrial structure, and is the random error term.
4.1.2. Dynamic Panel Model
Considering that regional coordinated development is a dynamic process, we have adopted the practice of Chen and Wu [74], adding the first-phase lag value of the regional coordinated development index as an explanatory variable and constructing the following dynamic panel data model to avoid the adverse effects of inertia generated by regional coordinated development index data. This method can also avoid the endogenous interference caused by the omission of some variables in the model to a certain extent. The created model is as follows:
4.1.3. The Mediation Effect Model
In order to further test the mediating effect mechanism of resource allocation efficiency, this paper draws on the method of Hayes and Andrew [75] and constructs the following two regression models for testing:
In Equations (3) and (4), represents the mediating variable of resource allocation efficiency, represents each control variable, and and both represent random error terms.
4.2. Variable Construction and Measurement
4.2.1. Explained Variable: Regional Coordinated Development Level
Coordinated development aims to promote the balance and coordination of the relevant development systems; giving full play to the advantages and potentials of each element; enabling each development element to meet its development requirements, exert its overall function, and achieve sustainable, balanced, and healthy economic and social development [76]. Coordinated development is a kind of sustainable development. It does not simply pursue the growth of GDP but improves the welfare of all people on the basis of economic development [77]. The theoretical standard of regional coordinated development is to narrow and eliminate the gap in regional economic development, achieve a moderate balance and equal opportunities for people’s livelihoods and social development among regions, and achieve the sustainable development of the population, resources, and the environment [78]. This paper draws on the indicator construction method adopted by Yao and Ye [38], along with the “five development concepts” put forward by the Chinese government and the strategic thinking of the coordinated development of the YREB and considers basic principles such as representativeness, validity, and data availability, constructing a regional coordinated development indicator (RCDI) system based on the three dimensions of coordinated economic development, the coordinated development of people’s livelihoods, and the coordinated development of the ecological environment. The details of the indicator system are shown in Table 1.
This paper uses the improved entropy weight method to calculate the RCDI. Considering that regional coordinated development is essentially a comparative relationship between regions, the above-mentioned indicator system cannot fully reflect the comparison of development differences between regions. The data standardization method was improved upon as follows. The average of the indicators of the three core cities in the YREB—Shanghai, Chengdu, and Chongqing—is used as the benchmark, and the indicators of each city are compared with each other and then normalized (as shown in Equation (5)), which can not only reflect inter-regional differences but also achieve the purpose of data standardization. According to Equation (5), the standardized indicator value is between 0 and 1. The closer the index value is to 1, the smaller the difference between regions, indicating that the degree of regional coordinated development is higher, and the RCDI has the same properties. The specific calculation steps of the RCDI are as follows:
- Use the improved extreme value method to standardize the value of each indicator:
- 2.
- Calculate the information entropy and weight of each indicator:
- 3.
- Calculate the RCDI according to the indicator weight:
In Equations (5)–(7), i and j represent cities and indicators, respectively; n is the number of cities (regions); m is the number of indicators; is the standardized value of the improved indicators; is the information entropy of the indicators; and is the weight of the indicators.
4.2.2. Explanatory Variable: The SFDU
Since the SFDU is based on the division of labor in an industrial chain in relation to a product, the same product originates from different companies in the intertwined industrial chain from the enterprise level and belongs to different multi-level sub-industries or sub-categories from the industrial level [20]. Therefore, it is difficult to obtain direct statistical data from both the enterprise level and the macro-statistics department, which introduces great challenges to the calculation of the SFDU. At present, for the measurement of the SFDU, researchers usually adopt the indirect method of labor type division instead of industrial chain division. Management personnel represent the division of labor of the high-end industrial chain and are specifically represented by the number of employees in some sub-sectors of producer services. The labor division of the low-end industrial chain is represented by the production and manufacturing personnel, which is replaced by the number of employees in related sub-sectors of the production and manufacturing industry. The specific calculation methods are divided into two categories. One is to construct an index similar to “location entropy” from the perspective of industry to measure the level of the specialized division of labor in different cities. Although this method makes it relatively simple to obtain data and perform calculations, it cannot accurately reflect the level of the SFDU because the connotation reflected is quite different from that of the SFDU. The second method is to compare the level of the SFDU between central cities and peripheral cities from the perspective of urban agglomerations [73,79]. Although this method can reflect the connotations of the SFDU framework, its disadvantage is that it can only be viewed from the overall perspective. It cannot deeply reflect the functional divisions of each city within a region and the patterns of urban division [80]. In order to overcome this defect, some scholars [64] have improved this method to deeply reflect the SFDU in a region.
This paper draws on the principle of the above-mentioned second type of method, and the ratio of producer service workers to manufacturing workers in each city of the YREB is calculated and compared with the mean value of the same ratio in Shanghai, Wuhan, and Chongqing, so as to concretely reflect the SFDU in the YREB. Among these, the category of producer service workers includes “employees in scientific research and comprehensive technical services”, “employees in transportation, warehousing, and postal services”, “employees in leasing and commercial services”, “employees in the financial industry”, “real estate employees”, “industry practitioners”, and “information transmission, computer service, and software industry practitioners”. The category of manufacturing workers includes “employees in the mining industry”, “employees in the manufacturing industry”, and “employees in the production and supply of electricity, gas, and water”. The specific calculation method is as follows:
In this formula, k and l represent the number of sub-sectors in producer services and manufacturing, respectively; r represents the number of central cities; represents the new division of labor index of city i in year t; S is the number of employees in producer services; and p is the number of employees in production and manufacturing.
4.2.3. Mediating Variable: Resource Allocation Efficiency (RAE)
This paper adopts the relative distortion degree of the factor market to reflect resource allocation efficiency. We draw on the calculation model framework of Aoki [81] and reflect the resource allocation efficiency by measuring the relative distortion coefficients of labor and capital in various cities. The specific calculation method is as follows:
We assume that firms in a unified industry have the same production function and follow the form of CD function; that is:
In this formula, represents the total output of city i in year t; is technological progress; and represent the marginal output elasticity coefficients of labor and capital in a city, respectively; and .
According to the view of some scholars [82,83], the distortion of factors can be regarded as the external manifestation of the ad valorem tax on factors, assuming that the tax rates of labor and capital are and , so the prices of labor and capital factors actually used by the enterprise are and . Here, and represent the prices of labor and capital factors when there is no allocation distortion.
Therefore, the profit maximization objective of the enterprise under the constraint of total resources can be expressed as follows:
According to the above formula, the relationship between urban capital and labor input and their corresponding total amount can be deduced as:
If the share of the output of city i in the total output of the economic belt is recorded as , using the output share to weight the output elasticity of capital and labor, we can obtain , . According to the degree of the definition of factor distortion and the above formula, the formula for calculating the coefficient of the relative distortion of labor and capital factors can be obtained as follows:
where and represent the factor ratio under the optimal allocation of capital and labor, and and represent the relative distortion coefficient of the labor force and capital allocation of city i in year t. If the coefficient is greater than 1, the factor is over-allocated, and if the coefficient is less than 1, the factor is under-allocated.
The key parameters are explained as follows:
The amount of capital investment is denoted as .
The amount of capital input is represented by the annual capital stock of each city. Specifically, according to the calculation method of Zhang et al. [84], the constant price in 2005 is used as the base period price, and the perpetual inventory method is used to calculate the fixed capital stock of each city. The calculation formula is as follows:
where represents the capital stock of city i in year t; is the depreciation rate, which is constant at 9.6%; is the investment amount of fixed assets in year t of city i; and is the price index of investment in fixed assets in year t of city i.
The capital stock in the base period () is calculated by referring to the practice of Hall and Jones [85]. We calculate the ratio of the fixed asset investment in the base period ( to the sum of the average annual growth rate and the depreciation rate δ of the fixed asset investment; that is, .
The amount of labor input is denoted as .
The amount of labor input is represented by the number of employed persons, specifically represented by the total number of employed persons in urban units in each city at the end of the year.
The marginal product elasticity of capital () and the marginal product elasticity of labor ().
The marginal output elasticity of capital and labor will vary greatly depending on time and region and are affected by the differences in factor inputs and technological development levels among different cities. In order to describe this space–time difference as accurately as possible, this paper constructs a time-varying state-space model and uses the Kalman filter method to estimate the marginal output elasticity coefficients of labor and capital [86,87]. The specific calculation model is as follows:
Measurement equation:
State equation:
4.2.4. Control Variables
This paper references the mainstream research on regional coordinated development, controlling the effects of 7 variables, which are shown as follows.
- (1)
- Physical capital level (PCL). We use the proportion of the city’s annual fixed-asset investment to GDP as a proxy.
- (2)
- Human capital level (HCL). We use the proportion of college students in the total registered population to measure this level.
- (3)
- Urbanization Level (URR). We use the proportion of the population of municipal districts to the total population of the city to represent this.
- (4)
- Degree of government intervention (GIL). We use the proportion of fiscal expenditure to GDP to express this level.
- (5)
- Level of opening-up (FDI). We use the proportion of foreign direct investment as a proxy.
- (6)
- Infrastructure level (INF). We use per capita urban road area to measure this level.
- (7)
- Industrial structure (IS). We use the ratio of urban tertiary industry added value to secondary industry added value as a proxy.
The description of variables mentioned above are showed in Table 2.
4.3. Study Area and Data Description
This paper takes 108 cities of 11 provinces in the YREB as the research object in order to reveal the relationship between the SFDU and regional coordinated development and the mechanism underlying this relationship. Due to the serious lack of statistical data for some cities and variables and the unavailability of prefecture-level fixed asset investment data for the period since 2017, this paper selects 2007–2016 as the research period, and selects 108 cities to carry out empirical research, excluding three cities: Bijie, Chaohu, and Tongren. At the same time, the study was carried out layer by layer from the spatial level, in accordance with the research context, from the YREB to the three major urban agglomerations in the upper, middle, and lower reaches, and then to cities. According to the development plan for the YREB, 41 cities in Shanghai, Jiangsu, Zhejiang, and Anhui were selected as the region of the “Pan-Yangtze River Delta Urban agglomeration” in the lower reaches. Thirty-six cities in Jiangxi, Hubei, and Hunan were selected as the urban agglomeration region in the middle reaches, and thirty-one cities in Chongqing, Sichuan, Yunnan, and Guizhou were selected as the region of the “Pan-Chengdu–Chongqing urban agglomeration” in the upper reaches.
The raw data required for each variable were mainly obtained from the China Urban Statistical Yearbook, the China Urban Construction Statistical Yearbook, the statistical yearbooks of relevant provinces and cities, and the regional economic database of the State Research Network. In order to enhance the comparability of data, the GDP deflator in 2005 was used as the base period to deflate the value indicators such as GDP over the years. The missing values of some data were imputed via the moving average method. The descriptive statistics for each variable are shown in Table 3.
5. Empirical Results
5.1. Preliminary Observation
5.1.1. The Regional Coordinated Development Level
Figure 2 shows the changes in the overall RECDI and its three sub-indices in the YREB from 2007 to 2016. From an overall perspective, over the past decade, the coordinated development level of the YREB has shown an upward trend in fluctuations, but the rate of increase is small and the speed is relatively slow. From the perspective of different dimensions, the coordinated development indicators of people’s livelihoods and the economy in the YREB are significantly higher than that of the ecological environment, and the ecological environment coordination indicator has tended to decline since 2012. This shows that the level of regional coordinated development in the YREB needs to be further improved. In the process of coordinated development, the coordinated development of the ecological environment should be especially emphasized. Economic and social development cannot ignore the limited environmental capacity and the fragility of ecological features. The premise of this strategy is to implement the basic concepts of “together with large-scale protection, not to engage in large-scale development” and “ecological priorities and green development”.
Figure 3 shows the changes in the overall RCDI of the three major urban agglomerations in the YREB from 2007 to 2016. On the whole, the degree of coordinated development among the three major urban agglomerations decreased in turn from east to west. In terms of time, the fluctuation characteristics of the RCDI of the three major urban agglomerations are more obvious than the upward trend, and the gap between the urban agglomerations in the Pan-Yangtze River Delta and the middle reaches of the Yangtze River tended to narrow, but the gap between the pan-Chengdu–Chongqing urban agglomerations and the other two urban agglomerations tended to widen. This shows that the overall level of the coordinated development of the urban agglomerations was relatively low, the development gap between regions was increasing, and the coordinated development of the YREB has become a major practical problem that needs to be solved urgently.
Figure 4 shows the distribution of the overall RCDI of 108 cities in the YREB in 2016. It can be clearly seen in the figure that the RCDI of cities showed an overall distribution pattern of decreasing from downstream to upstream. There was an obvious gap in the degree of coordinated development among different urban agglomerations, and there was also a large difference in the degree of coordinated development among different cities within urban agglomerations. Among them, the degree of coordinated development in the Yangtze River Delta region was generally high and the gap between cities was relatively small, and there was still a large gap in the degree of coordinated development between cities in the middle reaches of the Yangtze River and the Pan-Chengdu–Chongqing urban agglomeration. Cities with an RCDI above 0.8 were mainly distributed in the lower reaches of the Yangtze River. Cities with an RCDI of over 0.85 included Suzhou, Hangzhou, Ningbo, Wuhan, Nanchang, and Chengdu, which are mainly located in the core areas of the three major urban agglomerations.
5.1.2. The Level of SFDU
Figure 5 shows the changes in the NDI of the YREB from 2007 to 2016. On the whole, since 2007, the SFDU in the YREB showed an upward trend in certain fluctuations. In terms of urban agglomerations, the changes in the SFDU in the three major urban agglomerations with time showed great similarity, but the difference in their levels is very obvious. Among them, the Pan-Yangtze River Delta urban agglomeration had the highest level of the SFDU, but its change was also the most volatile. Followed by the urban agglomeration in the middle reaches of the Yangtze River, the size and trend of its division of labor basically represented the development level and changes of the YREB. The level of SFDU in the Pan-Chengdu–Chongqing urban agglomeration was relatively low.
Figure 6 shows the urban distribution of the NDI in the YREB in 2016. It can be seen in the figure that there was a large difference in the urban functional division indicator based on the SFDU. The minimum and maximum values were 0.2 and 0.82 respectively, but the spatial distribution in the YREB was relatively uniform, which is similar to the development of the SFDU. The theoretical requirement of mutual cooperation and synergy between cities is in line with this. It is worth noting that the degree of the SFDU based on industrial chains in some areas of the upper reaches of the Yangtze River was relatively low, affected by the traditional division of urban functions mainly based on the industrial division of labor, indicating that the region has not formed an SFDU approach in the true sense.
5.2. Basic Regression Results
Table 4 reports the model-based regression results between the SFDU and regional coordinated development. Model (1) is the benchmark regression model, without adding any control variables. The OLS estimation results show that the SFDU can significantly promote regional coordinated development, and it passes the test at the 5% significance level. After adding control variables on the basis of model (1), it can be clearly seen from the regression results of models (2)–(4) that the SFDU still significantly promotes regional coordinated development, and all of them pass the test at the 1% significance level. This shows that the improvement of the SFDU is conducive to accelerating the coordinated development between regions, narrowing the development gap between regions, and thus promoting the level of regional coordinated development. Column (5) of Table 4 presents the estimation results of the dynamic panel model. In order to alleviate the possible endogeneity problem of the dynamic panel model, this paper uses the method of System Generalized Moments Estimation (SYS-GMM) to estimate the model. The estimation results show that the SFDU still positively promotes the coordinated development of the YREB at a significance level of 1%, which is consistent with the estimation results of other different models as a whole. Hypothesis 1 (H1), as proposed in this paper, is confirmed. In addition, the p values of AR(1) and AR(2) in the regression results show that there is a first-order serial correlation but no second-order serial correlation in the level of regional coordinated development, which further illustrates the appropriateness of this paper’s approach to building a dynamic panel data model.
The influences of different control variables on regional coordinated development are different. The level of physical capital has an inhibitory effect on the regional coordinated development. A possible reason for this is that areas with higher levels of development tend to have higher rates of return on capital [39], and the profit-seeking characteristics of physical capital make increased physical capital more concentrated in areas with higher levels of development, thereby enhancing the attractiveness of capital in high-level development regions and further widening the gap with underdeveloped regions, thereby reducing the level of coordinated development among regions. The level of human capital plays a significant positive role in promoting regional coordinated development. A possible reason for this is that the improvement of the level of human capital in the YREB not only enhances the role of human capital in promoting regional development but also promotes the increase in suitable human capital and its reasonable flow between regions and narrows the development gaps between regions. The level of regional coordinated development has been improved, and this conclusion is consistent with the research results obtained by Sheng and Zhou [88]. Government intervention adversely affects regional coordinated development. This shows that the cooperation mechanism between local governments in the YREB has not been fully established, the government has intervened excessively, and some administrative barriers between regions have not been completely removed, which affects the effective interaction and coordinated development of regions. FDI can promote regional coordinated development. This shows that the improvement in the level of the opening to the outside world has injected a development impetus into the cities of the region, which plays a positive role in driving employment, increasing taxes, and promoting industrial diversification, especially for underdeveloped regions.
5.3. Regression Results of Sub-Regional and Coordination Dimensions
This paper conducts an in-depth analysis of regional differences and coordination dimension differences in order to verify whether there is heterogeneity in the relationship between the SFDU and regional coordinated development. Considering that the YREB spans the eastern, central, and western regions of China, there are great differences in resource endowments, geographical conditions, and economic levels among different regions, and urban agglomerations have become the main form of regional economic and social development in China [63]; therefore, this paper divides the YREB into three major units: the Pan-Yangtze River Delta urban agglomeration, the urban agglomeration in the middle reaches of the Yangtze River, and the Pan-Chengdu–Chongqing urban agglomeration. At the same time, since regional coordinated development involves many aspects of regional development and has various connotations, this paper conducts in-depth research from the three subdivision dimensions of coordinated economic development, the coordinated development of people’s livelihoods, and the coordinated development of ecology.
Table 5, Table 6, and Table 7 respectively report the relationship between the SFDU and the regional coordinated development of the three major urban agglomerations in the YREB. It can be clearly seen in column (1) of Table 6, Table 7 and Table 8 that the regression coefficients of the SFDU and regional coordinated development are all positive in the three urban agglomerations. Furthermore, this result is significant at a 1% level, indicating that the SFDU in the three urban agglomerations can improve the level of regional coordinated development, which is consistent with the basic regression results. From the perspective of the regression coefficient, the regression coefficients of the three urban agglomerations are 0.012, 0.012, and 0.006, in turn, indicating that the urban agglomerations in the middle reaches of the Yangtze River and the Pan-Chengdu–Chongqing urban agglomeration have a significantly higher role in promoting regional coordinated development than the Pan-Yangtze River Delta urban agglomeration in the upper reaches. The possible reason for this is that compared with the downstream urban agglomeration, the SFDU between the urban agglomeration in the middle reaches of the Yangtze River and the Pan-Chengdu–Chongqing urban agglomeration is relatively low, and the connection between cities is not close enough [89]. A reasonable and orderly SFDU approach has not yet been formed, so the improvement of the SFDU will promote regional coordinated development to a relatively higher degree, which also shows that it is more urgent and important to improve the SFDU in the middle and upper reaches of the Yangtze River.
Columns (2), (3), and (4) of Table 5, Table 6, and Table 7, respectively, show the regression results of the relationship between the SFDU and regional coordinated development in the three urban agglomerations with the dimensions of coordinated economic development, people’s livelihoods, and ecological development. On the whole, the regression coefficients between the SFDU and the coordinated development of the economy and people’s livelihoods in the three urban agglomerations are all positive, all passing the test at the 1% significance level, and the regression coefficients of the coordinated development of the economy are greater than those of the coordinated development of people’s livelihoods. This shows that the improvement of the SFDU in the three urban agglomerations is obviously conducive to the improvement of the coordinated development of the inter-regional economy and people’s livelihoods, and the SFDU has the greatest role in promoting the coordinated development of the regional economy. However, the regression coefficients between the SFDU and the coordinated development of ecology in the Pan-Yangtze River Delta urban agglomeration and the Pan-Chengdu–Chongqing urban agglomeration are significantly negative at the 5% and 1% levels, respectively. The possible reason for this counter-intuitive result is that the high-end and low-end industries of the value chain formed by the SFDU are distributed in different regions. High-end industries tend to cause a low degree of pollution and damage to the ecological environment, whereas low-end industries (such as heavy industry) tend to cause a high degree of damage to the ecological environment. In the process of the formation of the SFDU, if the government does not pay attention to the ecological and environmental protection regulations and effective supporting measures, it will lead to the widening of the ecological environmental gaps between regions, which shows that the SFDU inhibits the coordinated development of regional ecology. This also shows that for both the Pan-Yangtze River Delta urban agglomeration with a relatively high level of SFDU and the Pan-Chengdu–Chongqing urban agglomeration (with a relatively low level of SFDU), great importance should be attached to the coordination of environmental protection and ecological governance measures in the process of the division of labor.
5.4. Mechanism Test
It can be seen from the above analysis that the SFDU can significantly improve the level of regional coordinated development, and in this section, we continue to verify its internal mechanism. An in-depth analysis of this issue will help to deepen the understanding of the relationship between the SFDU and regional coordinated development, and it will also be conducive to the adjustment and improvement of policies related to the SFDU and regional coordinated development. In accordance with the relevant theoretical analyses, we examine its transmission mechanism in relation to two aspects—labor and capital allocation efficiency.
Table 8 reports the results of the intermediary mechanism test based on the efficiency of resource allocation. The results show that, on the whole, the allocation efficiency of capital and labor resources plays a significant mediating effect in the regional coordinated development affected by the SFDU. Hypothesis 2 (H2) has been verified. However, there are significant differences in the way they work. From the regression results of model (1) and model (3), it can be seen that the estimated coefficient after adding the SFDU and capital factor allocation efficiency variables is 0.003, which is 50% lower than the coefficient of 0.006 in the basic regression model, indicating that accelerating the allocation of capital factors is a key path by which the SFDU can promote regional coordinated development, which is consistent with theoretical expectations. The results of model (2) and model (4) also show that the coefficient of the SFDU (0.005), adding the labor factor allocation efficiency variable, decreased slightly compared with the basis of the regression coefficient. However, the sign of the estimated coefficient of the SFDU in model (2) and the sign of the estimated coefficient of the labor resource allocation efficiency in model (4) are significantly negative, which is not completely consistent with the theoretical expectation.
There are two possible explanations for the above results. On the one hand, the improvement in the level of the SFDU will prompt enterprises in different value chains to agglomerate in certain regions. If this is unreasonable, it will have a negative impact on the efficiency of resource utilization through the cost effect or the crowding effect. In addition, the market segmentation caused by the occurrence of bad competition between local governments will form a greater obstacle to the orderly flow of labor factors, which will eventually lead to regions with labor factors. The industrial distribution brought about by the SFDU is increasingly mismatched, which in turn reduces the efficiency of labor resource allocation. On the other hand, the allocation of labor resources has a certain inhibitory effect on regional coordinated development due to the mismatch between the efficiency of labor resource allocation and the level of regional coordinated development in the YREB. This distortion shows that the mechanism of the allocation of labor resources in the YREB is not yet perfect, and it has not entirely played the role of a channel for the SFDU to promote regional coordinated development.
5.5. Robustness Test
The basic regression results, obtained under different panel data models and presented in Table 4, are consistent, which illustrates the robustness of the conclusions in this paper to a certain extent. In order to further enhance the reliability of the regression results, this paper continues to conduct robustness tests from two perspectives. The first approach is to replace the explained variables, drawing on the practice of Ding, Liu, and Li [49], and use the relative per capita income of cities as a surrogate variable for regional coordinated development; that is, the ratio of per capita GDP between each city and the central cities (Shanghai, Wuhan, and Chongqing) is reversely converted (1-Gini coefficient) and substituted as the explained variable. The second approach is to carry out the quantile regression of the lower quartile (25%), the median (50%), and the upper quartile (75%), which can verify the reliability of the research conclusions, taking into account the differences in the impact of different regions.
5.5.1. Robustness Test I: Replacing the Explained Variable
Table 9 reports the estimated results of each model after replacing the explained variables. It can be concluded that the results of the SFDU with regard to promoting regional coordinated development all pass the test with a significance level of 1% in the three models. The overall results are consistent with the previous estimates, and the robustness of the estimated results in this paper is further verified.
5.5.2. Robustness Test II: Quantile Regression
The models based on the OLS and SYS-GMM methods cannot fully reflect the problem that the relationships between the SFDU and regional coordinated development may be different between regions with different historical development levels. Quantile regression can reversely weight the residual items according to the level of the quantile, which avoids the defects of the equal weight method in OLS, and ensures that the sum of the weighted absolute values of the residuals is as small as possible, making the estimation results more robust and reliable [90]. Therefore, this paper adopts the method of quantile regression for further in-depth verification.
Table 10 reports the regression results of the impact of the SFDU on regional coordinated development at three quantile positions. It can be observed that the intensity of influence of the SFDU on regional coordinated development varies with the location of the conditions of the SFDU. On the whole, it shows a trend of first rising and then falling as the location rises. However, regardless of the quantile, the influence coefficient of the SFDU passes the test at least at the 5% level, which is consistent with the results of the previous overall regression analysis. Therefore, the promoting effect of the SFDU on regional coordinated development is not affected by the location of conditional distribution, which again verifies the robustness of the empirical results in this paper.
6. Discussion
6.1. Environmental Impacts of the SFDU on the Yangtze River Ecosystems
On the whole, the SFDU plays a significant role in promoting the coordinated development of the regional ecology. However, it was interesting to observe in this study that the SFDU had different effects on the ecological coordinated development of urban agglomerations in the upper, middle, and lower reaches of the YREB. Specifically, the SFDU had a significantly negative effect on the coordinated development of ecology in the pan-Yangtze River Delta urban agglomeration and the Pan-Chengdu–Chongqing urban agglomeration. This conclusion is different from those of some previous studies [7,48]. The possible reason for this is that the division of labor based on the value chain between cities does not occur at the same time as the transfer of environmental pollution [52]. With technological progress and the great attention paid by local governments to environmental issues, the SFDU was carried out on the premise of the continuous improvement of production equipment and the improvement of energy efficiency [63]. However, Shanghai, Jiangsu, Zhejiang, Chongqing, Chengdu, and other developed regions are in a dual situation of the upgrading of emerging industries and approaching the withdrawal of large-scale production equipment in traditional industries [69]. Due to the common problems of low operating indexes, high energy consumption, and the high pollution emission levels of old equipment, the pollution emission levels of cities increase with the deepening of the division of labor in the value chain.
6.2. Socio-Economic Impacts of the SFDU on the Local Population Involved
The SFDU had a positive effect on the coordinated development of the economy and people’s livelihoods in the YREB and the three urban agglomerations. This conclusion supports the results of many previous studies [52,55]. The SFDU is conducive to the optimization of regional industrial layouts and realizes industrial agglomeration within the region through the reasonable industrial division of labor among cities [73], thus promoting the coordinated development of the regional population and economy. Furthermore, the rational allocation of labor and capital factors is an important channel for the SFDU to promote regional coordinated development. The SFDU can achieve the effect of promoting regional coordinated development through the rational allocation of resources and elements. The improvement of the SFDU has improved the allocation efficiency of regional capital factors, thereby narrowing the development gaps between regions. However, it is worth noting that the mechanism of labor resource allocation is not yet perfect, and the unreasonable allocation of labor resources and related influencing factors has meant that its role in the relationship between the SFDU and regional coordinated development has not really been played out effectively.
6.3. Spatial-Regional Impacts of the SFDU on the Geo-Morphologic and Land Use Changes Reported
There were significant spatial differences in the SFDU levels in the YREB. The Pan-Yangtze River Delta urban agglomeration displayed the highest level of SFDU. This is similar to the conclusions presented in [26,58]. There was heterogeneity in the impact of the SFDU on regional coordinated development. From the perspective of the intensity of influence, the influence of the SFDU on regional coordinated development showed a trend of increasing from the coast to inland, due to the differences in factors such as resource endowments and economic development in different regions. Compared with the Pan-Yangtze River Delta urban agglomeration, the promotion effect on regional coordinated development in the Pan-Chengdu–Chongqing urban agglomeration was more obvious. From the perspective of impact, the SFDU in the three major urban agglomerations played a significant positive role in promoting the coordinated development of the regional economy and people’s livelihoods. However, due to the differing impacts of different industries on the ecological environment, the SFDU has further widened the gap of ecological environment development in the inland regions of the Pan-Yangtze River Delta urban agglomeration and the Pan-Chengdu–Chongqing urban agglomeration, and the mismatch between the SFDU and ecological environment in the above two urban agglomerations was relatively high.
6.4. Governmental Policies and Measures Taken to Support the SFDU
We propose the following recommendations:
- (1)
- Change the status quo of policy homogenization, coordinate urban industrial policies based on the SFDU, and strengthen its promotion in relation to regional coordinated development. Change and adjust the existing form of the traditional division of labor between departments or products, stop the homogenization of industrial policies between cities, formulate urban industrial policies oriented towards the SFDU, and clarify the structures of various industries from the perspective of the industrial chain. The functional positioning of cities promotes the SFDU and effective collaboration between cities based on different industrial chain links.
- (2)
- Refine the strategy of the industrial division of labor between cities by region and by industrial chain node, strengthen advantages, make up for shortcomings, and guide the rational and orderly transfer of industries. On the one hand, remove the boundaries created by administrative divisions, take economic belts and urban agglomerations as units and combine the resource endowments, location advantages, and future development goals of each region to clarify the development orientation of urban industries. Realize the effective matching between the SFDU and the actual situation of the region and guide reasonable and orderly transfers of industries in the upstream, middle, and downstream areas. On the other hand, each region should also clarify its own shortcomings in promoting regional coordinated development through the SFDU and make targeted improvements. For example, the Pan-Yangtze River Delta urban agglomeration and the Pan-Chengdu–Chongqing urban agglomeration should pay more attention to the adverse impact on the ecological environment that occurs during the development of the SFDU and increase supporting policies such as green innovation or environmental regulation, so that the SFDU and the development of the ecological environment can be undertaken with more coordination.
- (3)
- Innovate and improve the market mechanism, optimize the allocation of resources between cities, and unblock the channels and mechanisms by which the SFDU can promote regional coordinated development. On the one hand, optimize and adjust the capital allocation structure, appropriately disperse and transfer the areas with excess capital allocation, guide capital inflow through policies to the areas with insufficient capital allocation, improve the efficiency of capital allocation, and better enable the SFDU to play a channeling role in promoting regional coordinated development. On the other hand, in view of the current situation in which the SFDU in the YREB is not well-matched with the development of the labor market, speed up the development of labor marketization, break down administrative barriers, rationally regulate and guide the current “war for talents” in major cities, and promote the orderly and reasonable flow of labor based on the value chain, as well as realizing the effective allocation of labor resources in different regions.
7. Conclusions
In recent years, China has encountered serious problems related to unbalanced regional development, which have significantly threatened the quality of economic and social development. In this study, we used panel data from 108 cities in the YREB to investigate the impact of the SFDU on regional coordinated development and further analyzed the mechanisms of influence based on the construction of a relevant measure index system. It was found that the SFDU based on the value chain is an important driving force for the coordinated development of YREB. The SFDU (i) promotes the rational division of labor among large, medium, and small cities in the region; (ii) makes the regional industrial layout more reasonable; (iii) enhances the interaction and synergy of development between regions; (iv) narrows the development gaps between regions; and (v) enhances the comprehensive strength of the region and finally promotes regional coordinated development. In addition, the impact of the SFDU on regional coordinated development in the YREB showed two characteristics. On the one hand, the level of the SFDU and the level of regional coordinated development in the YREB were still relatively low. On the other hand, government intervention continued to inhibit the coordinated development of various regions in the YREB, indicating that the cooperation mechanism between regional governments had not been adequately established, and unreasonable competition between governments, local protection, and excessive government intervention in regional development may still exist. We found that the rational allocation of labor and capital factors is an important channel by which the SFDU can promote regional coordinated development.
At the same time, limited by the resources available at present, there are still some improvements that could be made with regard to the topic investigated in this paper. Since 2017, China has carried out a large number of industrial policies at the city level in the YREB. Due to the lack of data, it is difficult to empirically test the relationship between the SFDU and regional coordinated development during this period, which is a deficiency of this paper. In addition, other mechanisms by which the SFDU impacts regional coordinated development, such as industrial structure and technological innovation, are topics worthy of in-depth discussion on the basis of this paper. In short, these deficiencies will also be the focus of our research in the next stage. These deficiencies should be further addressed in future research.
Author Contributions
Conceptualization, S.G. and H.M.; methodology, S.G.; software, S.G.; validation, S.G. and H.M.; formal analysis, S.G.; investigation, S.G.; resources, S.G. and H.M.; data curation, S.G.; writing—original draft preparation, S.G.; writing—review and editing, S.G.; visualization, S.G.; supervision, H.M.; project administration, H.M.; funding acquisition, H.M. All authors have read and agreed to the published version of the manuscript.
Funding
This research was funded by the National Social Science Foundation of China, grant number 19BJL052.
Institutional Review Board Statement
Not applicable.
Informed Consent Statement
Not applicable.
Data Availability Statement
Data are available from the sources stated in the text.
Conflicts of Interest
The authors declare no conflict of interest.
References
- Si, L.; Wang, J.; Yang, S.; Yang, Y.; Zhang, J. Urban Green Development towards Sustainability in Northwest China: Efficiency Assessment, Spatial-Temporal Differentiation Characters, and Influencing Factors. Complexity 2021, 2021, 6630904. [Google Scholar] [CrossRef]
- Cong, X.; Li, X.; Li, S.; Gong, Y. Research on Sustainable Development Ability and Spatial-Temporal Differentiation of Urban Human Settlements in China and Japan Based on SDGs, Taking Dalian and Kobe as Examples. Complexity 2021, 2021, 8876021. [Google Scholar] [CrossRef]
- Yu, X.; Ma, S.; Cheng, K.; Kyriakopoulos, G.L. An evaluation system for sustainable urban space development based in green urbanism principles-a case study based on the Qin-Ba mountain area in China. Sustainability 2020, 12, 5703. [Google Scholar] [CrossRef]
- Chen, X.; Wei, L.; Zhang, H. Spatial and Temporal Pattern of Urban Smart Development in China and Its Driving Mechanism. Chin. Geogr. Sci. 2018, 28, 584–599. [Google Scholar] [CrossRef] [Green Version]
- Yang, Q.; Duan, X.; Wang, L. Spatial-temporal patterns and driving factors of rapid urban land development in provincial China: A case study of Jiangsu. Sustainability 2017, 9, 2371. [Google Scholar] [CrossRef] [Green Version]
- Zhu, W.; Chen, J. The spatial analysis of digital economy and urban development: A case study in Hangzhou, China. Cities 2022, 123, 103563. [Google Scholar] [CrossRef]
- Zhang, G.; Zheng, D.; Wu, H.; Wang, J.; Li, S. Assessing the role of high-speed rail in shaping the spatial patterns of urban and rural development: A case of the Middle Reaches of the Yangtze River, China. Sci. Total Environ. 2020, 704, 135399. [Google Scholar] [CrossRef]
- Wang, Z. Land spatial development based on carrying capacity, land development potential, and efficiency of urban agglomerations in China. Sustainability 2018, 10, 4701. [Google Scholar] [CrossRef] [Green Version]
- Liu, J.; Nijkamp, P.; Huang, X.; Lin, D. Urban livability and tourism development in China: Analysis of sustainable development by means of spatial panel data. Habitat Int. 2017, 68, 99–107. [Google Scholar] [CrossRef]
- Shen, W.; Huang, Z.; Yin, S.; Hsu, W.-L. Temporal and Spatial Coupling Characteristics of Tourism and Urbanization with Mechanism of High-Quality Development in the Yangtze River Delta Urban Agglomeration, China. Appl. Sci. 2020, 12, 3403. [Google Scholar] [CrossRef]
- Li, Y.; Wu, S.; Yan, B. Spatial characteristics and influential mechanism of the coupling coordination degree of urban accessibility and human development index in China. Environ. Sci. Pollut. Res. 2022, 29, 29793–29807. [Google Scholar] [CrossRef]
- Xu, L.; Wang, D.; Du, J. Spatial-Temporal Evolution and Influencing Factors of Urban Green and Smart Development Level in China: Evidence from 232 Prefecture-Level Cities. Int. J. Environ. Res. Public Health 2022, 19, 3939. [Google Scholar] [CrossRef]
- Xu, H.; Zhu, J.; Wang, Z. Exploring the spatial pattern of urban block development based on POI analysis: A case study in Wuhan, China. Sustainability 2019, 11, 6961. [Google Scholar] [CrossRef] [Green Version]
- Wu, C.; Wei, Y.D.; Huang, X.; Chen, B. Economic transition, spatial development and urban land use efficiency in the Yangtze River Delta, China. Habitat Int. 2017, 63, 67–78. [Google Scholar] [CrossRef]
- Xiong, G.; Cao, X.; Hamm, N.A.S.; Lin, T.; Zhang, G.; Chen, B. Unbalanced development characteristics and driving mechanisms of regional urban spatial form: A case study of Jiangsu Province, China. Sustainability 2021, 13, 3121. [Google Scholar] [CrossRef]
- Zhang, Y.; Liu, Y.; Zhang, Y.; Kong, X.; Jing, Y.; Cai, E.; Zhang, L.; Liu, Y.; Wang, Z.; Liu, Y. Spatial patterns and driving forces of conflicts among the three land management red lines in China: A case study of the Wuhan urban development area. Sustainability 2019, 11, 2025. [Google Scholar] [CrossRef] [Green Version]
- Fujita, M.; Tabuchi, T. Regional growth in postwar Japan. Reg. Sci. Urban Econ. 1997, 27, 643–670. [Google Scholar] [CrossRef]
- Puga, D.D. From sectoral to functional urban specialisation. J. Urban Econ. 2005, 57, 343–370. [Google Scholar]
- Zhao, Y.; Bai, Y. Measurement and analysis of functional division of labor in Urban agglomerations in China. China Ind. Econ. 2012, 11, 13. [Google Scholar]
- Li, J. New Industrial Division of Labor: Reshape the Pattern of Regional Development; Social Sciences Academic Press: Beijing, China, 2012. [Google Scholar]
- Duranton, G.; Puga, D. From sectoral to functional urban specialisation. Work. Pap. 2001, 57, 343–370. Available online: https://econpapers.repec.org/paper/tortecipa/dpuga-01-01.htm (accessed on 9 May 2022). [CrossRef] [Green Version]
- Yan, X.; Huang, Y. Is there a nonlinear economic threshold effect of financial development on the efficiency of sci-tech innovation? An empirical test from the Yangtze River Economic Belt. Growth Chang. 2021, 52, 1387–1409. [Google Scholar] [CrossRef]
- Bothmann, F.; Kerndlmaier, R.; Koffeman, A.I.; Mandel, K.; Wallbank, S. A Guidebook for Riverside Regeneration; Springer: Berlin/Heidelberg, Germany, 2007. [Google Scholar]
- Li, Y.; Phelps, N.A. Knowledge polycentricity and the evolving Yangtze River Delta megalopolis. Reg. Stud. 2017, 51, 1035–1047. [Google Scholar] [CrossRef]
- Feiock, R.C.; Krause, R.M.; Hawkins, C.V.; Curley, C. The Integrated City Sustainability Database. Urban Aff. Rev. 2013, 50, 577–589. [Google Scholar] [CrossRef] [Green Version]
- Jin, X.; Hu, G.; Ding, H.; Ye, S.; Lin, J. Evolution of spatial structure patterns of city networks in the Yangtze River Economic Belt from the perspective of corporate pledge linkage. Growth Chang. 2020, 51, 833–851. [Google Scholar] [CrossRef]
- Liu, Y.; Zhu, J.; Li, E.Y.; Meng, Z.; Song, Y. Environmental regulation, green technological innovation, and eco-efficiency: The case of Yangtze river economic belt in China. Technol. Forecast. Soc. Chang. 2020, 155, 119993. [Google Scholar] [CrossRef]
- Cheng, J.; Chen, L. Structural coordination and factor coordination of industrial development in the Yangtze River Economic Belt. Reform 2021, 3, 79–93. [Google Scholar]
- Xu, C.; Xu, T.; Meng, Y. Current situation, problems and development countermeasures of industrial division and cooperation in Yangtze River Economic Belt. Resour. Environ. Yangtze Basin 2015, 24, 1633–1638. [Google Scholar]
- Du, Y. Regional coordinated governance: A new mechanism for regional coordinated development. Explor. Contention 2020, 10, 4–143. [Google Scholar]
- Li, L. Logical framework and theoretical explanation of China’s regional coordinated development. Econ. Trends 2020, 1, 69–82. [Google Scholar]
- Shankar, R.; Shah, A. Lessons from European Union policies for regional development. Policy Res. Work. Pap. 2010, 17, 71–88. [Google Scholar]
- Kim, T.J.; Knaap, G. The spatial dispersion of economic activities and development trends in China: 1952–1985. Ann. Reg. Sci. 2001, 35, 39–57. [Google Scholar] [CrossRef]
- Berliant, M.; Fujita, M. The Dynamics of Knowledge Diversity and Economic Growth. Res. Inst. Econ. Trade Ind. (RIETI) 2010, 77, 856–884. [Google Scholar] [CrossRef] [Green Version]
- Wei, H. New Industrial division of labor and Conflict Management in metropolitan Area: Based on the perspective of industrial chain division. China Ind. Econ. 2007, 2, 28–34. [Google Scholar]
- Yamamoto, D. Scales of Regional Income Disparities in the USA, 1955–2003. J. Econ. Geogr. 2008, 8, 79–103. [Google Scholar] [CrossRef]
- Yao, P.; Ye, Z. Index construction and optimization path analysis of China’s regional coordinated development. Res. Financ. Econ. Issues 2019, 9, 80–87. [Google Scholar]
- Zhang, M.; Xiao, H.; Sun, D.; Li, Y. Spatial differences in and influences upon the sustainable development level of the Yangtze River Delta urban agglomeration in China. Sustainability 2018, 10, 411. [Google Scholar] [CrossRef] [Green Version]
- Xu, Y.; Wu, H. An empirical study on the comprehensive efficiency of regional coordinated development under environmental constraints. China Ind. Econ. 2010, 33, 34–44. [Google Scholar]
- Wang, X.; He, Y.; Rao, C. Evaluation index system design and coordinated development analysis for the industrial green development system and regional non-waste system in the Yangtze River Economic Zone. Environ. Sci. Pollut. Res. 2021, 28, 32592–32608. [Google Scholar] [CrossRef]
- Gumpert, M. Regional inequality: An analysis under the core–peripheral model. Growth Chang. 2019, 50, 775–802. [Google Scholar] [CrossRef]
- Golley, J.; Meng, X. Income inequality and carbon dioxide emissions: The case of Chinese urban households. Energy Econ. 2012, 34, 1864–1872. [Google Scholar] [CrossRef]
- Golley, J. Prospects for diminishing regional disparities. In China: The Next Twenty Years of Reform and Development; ANU Press: Canberra, Australia, 2010. [Google Scholar]
- Cui, H.; Lui, Z. Spatial-temporal pattern and influencing factors of the urban green development efficiency in Jing-Jin-Ji region of China. Pol. J. Environ. Stud. 2021, 30, 1079–1093. [Google Scholar] [CrossRef]
- Liu, H.; Ma, L. Spatial pattern and effects of urban coordinated development in China’s urbanization. Sustainability 2020, 12, 2389. [Google Scholar] [CrossRef] [Green Version]
- Pedroni, P.; Yao, J.Y. Regional income divergence in China. J. Asian Econ. 2006, 17, 294–315. [Google Scholar] [CrossRef] [Green Version]
- Rosés, J.R.; Wolf, N. Regional Economic Development in Europe, 1900–2010: A Description of the Patterns. CEPR Discussion Paper No. DP12749. 2018. Available online: https://www.google.com.hk/url?sa=t&rct=j&q=&esrc=s&source=web&cd=&cad=rja&uact=8&ved=2ahUKEwjAn5vk5aH4AhVSmVYBHRDfBTAQFnoECAQQAQ&url=https%3A%2F%2Fwww.lse.ac.uk%2FEconomic-History%2FAssets%2FDocuments%2FWorkingPapers%2FEconomic-History%2F2018%2FWP278.pdf&usg=AOvVaw0T6ywm9qNbtE1hjtvJhkv6 (accessed on 9 May 2022).
- Ding, R.; Liu, M.; Li, D. Driving effect of multi-center city network on regional economic coordination: A case study of the Yangtze River Economic Belt. Stat. Res. 2020, 37, 93–105. [Google Scholar]
- Liu, Y.; Zhang, X.; Pan, X.; Ma, X.; Tang, M. The spatial integration and coordinated industrial development of urban agglomerations in the Yangtze River Economic Belt, China. Cities 2020, 104, 102801. [Google Scholar] [CrossRef]
- Lu, H.; Zheng, F.; Jia, S. Frontier technological progress, technological efficiency and regional economic gap. China Popul. Resour. Environ. 2012, 22, 6. [Google Scholar]
- Xu, S.; Liu, Q.; Lu, X. Spatial-temporal evolution characteristics and impact of regional development imbalance in China: From the perspective of industrial structure transformation and upgrading. Financ. Trade Res. 2021, 32, 13. [Google Scholar]
- Jin, T.; Wang, Z. Urban scale distribution, spatial function division and regional economic growth. Discuss. Mod. Econ. 2021, 5, 17–27. [Google Scholar]
- Chen, J.; Wang, Y. Industrial correlation and spatial distribution of producer services: A spatial econometric analysis based on Chinese city panel data. Econ. Surv. 2016, 33, 6. [Google Scholar]
- Burger, M.J.; Meijers, E.J. Agglomerations and the rise of urban network externalities. Pap. Reg. Sci. 2016, 95, 5–15. [Google Scholar] [CrossRef]
- Lei, Y.; Xue, P.; ZHang, X. Effects of functional division of labor on manufacturing productivity in pearl River Delta Urban agglomeration from the perspective of industrial economy. Sankei Comments 2020, 11, 122–136. [Google Scholar]
- Zhao, Y.; Wei, H. Government Intervention, Spatial Functional Division of Urban Agglomerations and regional disparities: Also on the effectiveness of China’s regional policies. Manag. World 2015, 8, 14–29+187. [Google Scholar]
- Zhao, Z.; Hou, Y. Research on the evolution characteristics and countermeasures of central city spatial connection in urban agglomerations. Urban Environ. Stud. 2019, 2, 13. [Google Scholar]
- Tao, F.; Tang, G.; Wu, Y.; Zhou, T. Spatiotemporal Heterogeneity and Driving Mechanism of Co-Ordinated Urban Development: A Case Study of the Central Area of the Yangtze River Delta, China. Sustainability 2022, 14, 5105. [Google Scholar] [CrossRef]
- Chen, S.; Liu, C.; Feng, B. Capital allocation efficiency, urban size distribution and welfare analysis. Econ. Res. J. 2019, 54, 15. [Google Scholar]
- Acemoglu, D.; Akcigit, U.; Bloom, N.; Kerr, W. Innovation, Reallocation and Growth. Am. Econ. Rev. 2018, 108, 3450–3491. [Google Scholar] [CrossRef] [Green Version]
- Liao, B.; Li, L. Spatial division of labor, specialization of green technology innovation process and urban coordinated green development: Evidence from China. Sustain. Cities Soc. 2021, 80, 103778. [Google Scholar] [CrossRef]
- Li, J. New industrial division of labor, Functional specialization and regional governance: An empirical study based on the Beijing-Tianjin-Hebei region. China Soft Sci. 2015, 3, 80–92. [Google Scholar]
- Hou, J.; Zhang, M. Study on the influence of functional division of urban agglomeration on regional coordinated Development: A case study of Beijing-Tianjin-Hebei Urban agglomeration. Economists 2020, 6, 77–86. [Google Scholar]
- Shang, Y.; Chen, Y. Does functional division within urban agglomerations contribute to economic growth? Empirical research based on panel data of ten urban agglomerations. Econ. Surv. 2020, 37, 1–8. [Google Scholar]
- Wen, R.; Chen, Y.; Wang, X. Division of labor, market potential and regional wage gap in Urban agglomerations: An empirical study of 16 Urban agglomerations in China. Inq. Into Econ. Issues 2021, 3, 71–79. [Google Scholar]
- Yang, X.; Zhang, Y. New Classical Economics and Ultra Marginal Analysis; Peking University Press: Beijing, China, 2003. [Google Scholar]
- Desmet, K.; Henderson, J.V. The Geography of Development within Countries; Elsevier: Amsterdam, The Netherlands, 2015. [Google Scholar]
- Tang, R.; GU, N. Upstream producer services value chain embeddedness and manufacturing resource misallocation are improved. Ind. Econ. Res. 2018, 3, 13–26. [Google Scholar]
- Yang, X. Agglomeration and resource allocation efficiency of producer services: Based on heterogeneity of region, industry and city size. J. Shanghai Univ. Int. 2020, 27, 39–50. [Google Scholar]
- Liu, X.; Li, S.; Qin, M. Urban spatial structure and Regional economic efficiency: Also on the mode selection of China’s urbanization development Road. Manag. World 2017, 1, 51–64. [Google Scholar]
- Xue, W. Growth embedded in flows: Spatial patterns, economic growth. Macroeconomics 2014, 10, 35–40+98. [Google Scholar]
- Zhang, F.; Li, X. Industrial agglomeration, urban population scale and coordinated development of regional economy: A comparative study of 12 urban agglomerations in China. J. South China Norm. Univ. (Soc. Sci. Ed.) 2021, 2, 156–166, 207–208. [Google Scholar]
- Yang, G.; Cheng, H.; Ouyang, H. Can national Central City Construction promote Regional Coordinated Growth. Financ. Econ. 2018, 5, 90–104. [Google Scholar]
- Chen, Q.; Wu, Q. Domestic value chain, dual outsourcing and coordinated regional economic development: Evidence from the Yangtze River Economic Belt. Financ. Econ. 2018, 39, 144–160. [Google Scholar]
- Hayes, A.F. Beyond Baron and Kenny: Statistical Mediation Analysis in the New Millennium. Commun. Monogr. 2009, 76, 408–420. [Google Scholar] [CrossRef]
- Cheng, J.; Guo, G. Marxist Thought of Regional Coordinated Development: From classical Theory to Chinese development. Econ. Asp. 2020, 6, 1–10. [Google Scholar]
- Sun, J. On the development and innovation of regional coordinated development strategy in the new era. J. Chin. Acad. Gov. 2018, 4, 109–114+151. [Google Scholar]
- Dong, X.; Li, J.; Chi, R. Xi Jinping’s important discussion on regional coordinated development in the new era. J. Zhejiang Univ. (Humanit. Soc. Sci.) 2019, 49, 16–28. [Google Scholar]
- Qi, O.; Zhao, Y. Temporal evolution and regional differences of functional division in urban agglomerations. Financ. Econ. 2014, 7, 114–121. [Google Scholar]
- Ma, Y. An evolutionary model and empirical analysis of the formation of functional space division in urban agglomeration. Econ. Manag. 2016, 38, 31–46. [Google Scholar]
- Aoki, S. A simple accounting framework for the effect of resource misallocation on aggregate productivity. J. Jpn. Int. Econ. 2012, 26, 473–494. [Google Scholar] [CrossRef] [Green Version]
- Chari, V.V.; Mcgrattan, K.E.R. Papers and Proceedings of the One Hundred Fourteenth Annual Meeting of the American Economic Association||Accounting for the Great Depression. Am. Econ. Rev. 2002, 92, 22–27. [Google Scholar] [CrossRef] [Green Version]
- Hsieh, C.T.; Klenow, P.J. Misallocation and Manufacturing TFP in China and India. Q. J. Econ. 2009, 4, 1403–1448. [Google Scholar] [CrossRef] [Green Version]
- Zhang, J.; Wu, G.; Zhang, J. Estimation of provincial physical capital stock in China: 1952–2000. Econ. Res. J. 2004, 10, 35–44. [Google Scholar]
- Hall, R.E.; Jones, C.I. Why Do Some Countries Produce So Much More Output per Worker than Others? Nber Work. Pap. 1999, 114, 83–116. [Google Scholar]
- Harvey, A.C. Forecasting, Structural Time Series Models and the Kalman Filter; Cambridge University Press: Cambridge, UK, 1989. [Google Scholar]
- Hamilton, J.D. Time Series Analysis; Princeton University Press: Princeton, NJ, USA, 1994. [Google Scholar]
- Sheng, D.; Zhou, Y. Coordinated development of suitable human capital and regional economy. Geogr. Res. 2018, 37, 797–813. [Google Scholar]
- Tu, J.; Kuang, R.; Mao, K.; Li, N. Evaluation of chengdu-Chongqing Urban agglomeration’s high quality development level. Econ. Geogr. 2021, 41, 50–60. [Google Scholar]
- Koenker, R.; Hallock, K.F. Quantile regression. J. Econ. Perspect. 2001, 15, 143–156. [Google Scholar] [CrossRef]
Figure 1.
Theoretical analysis framework of this paper.
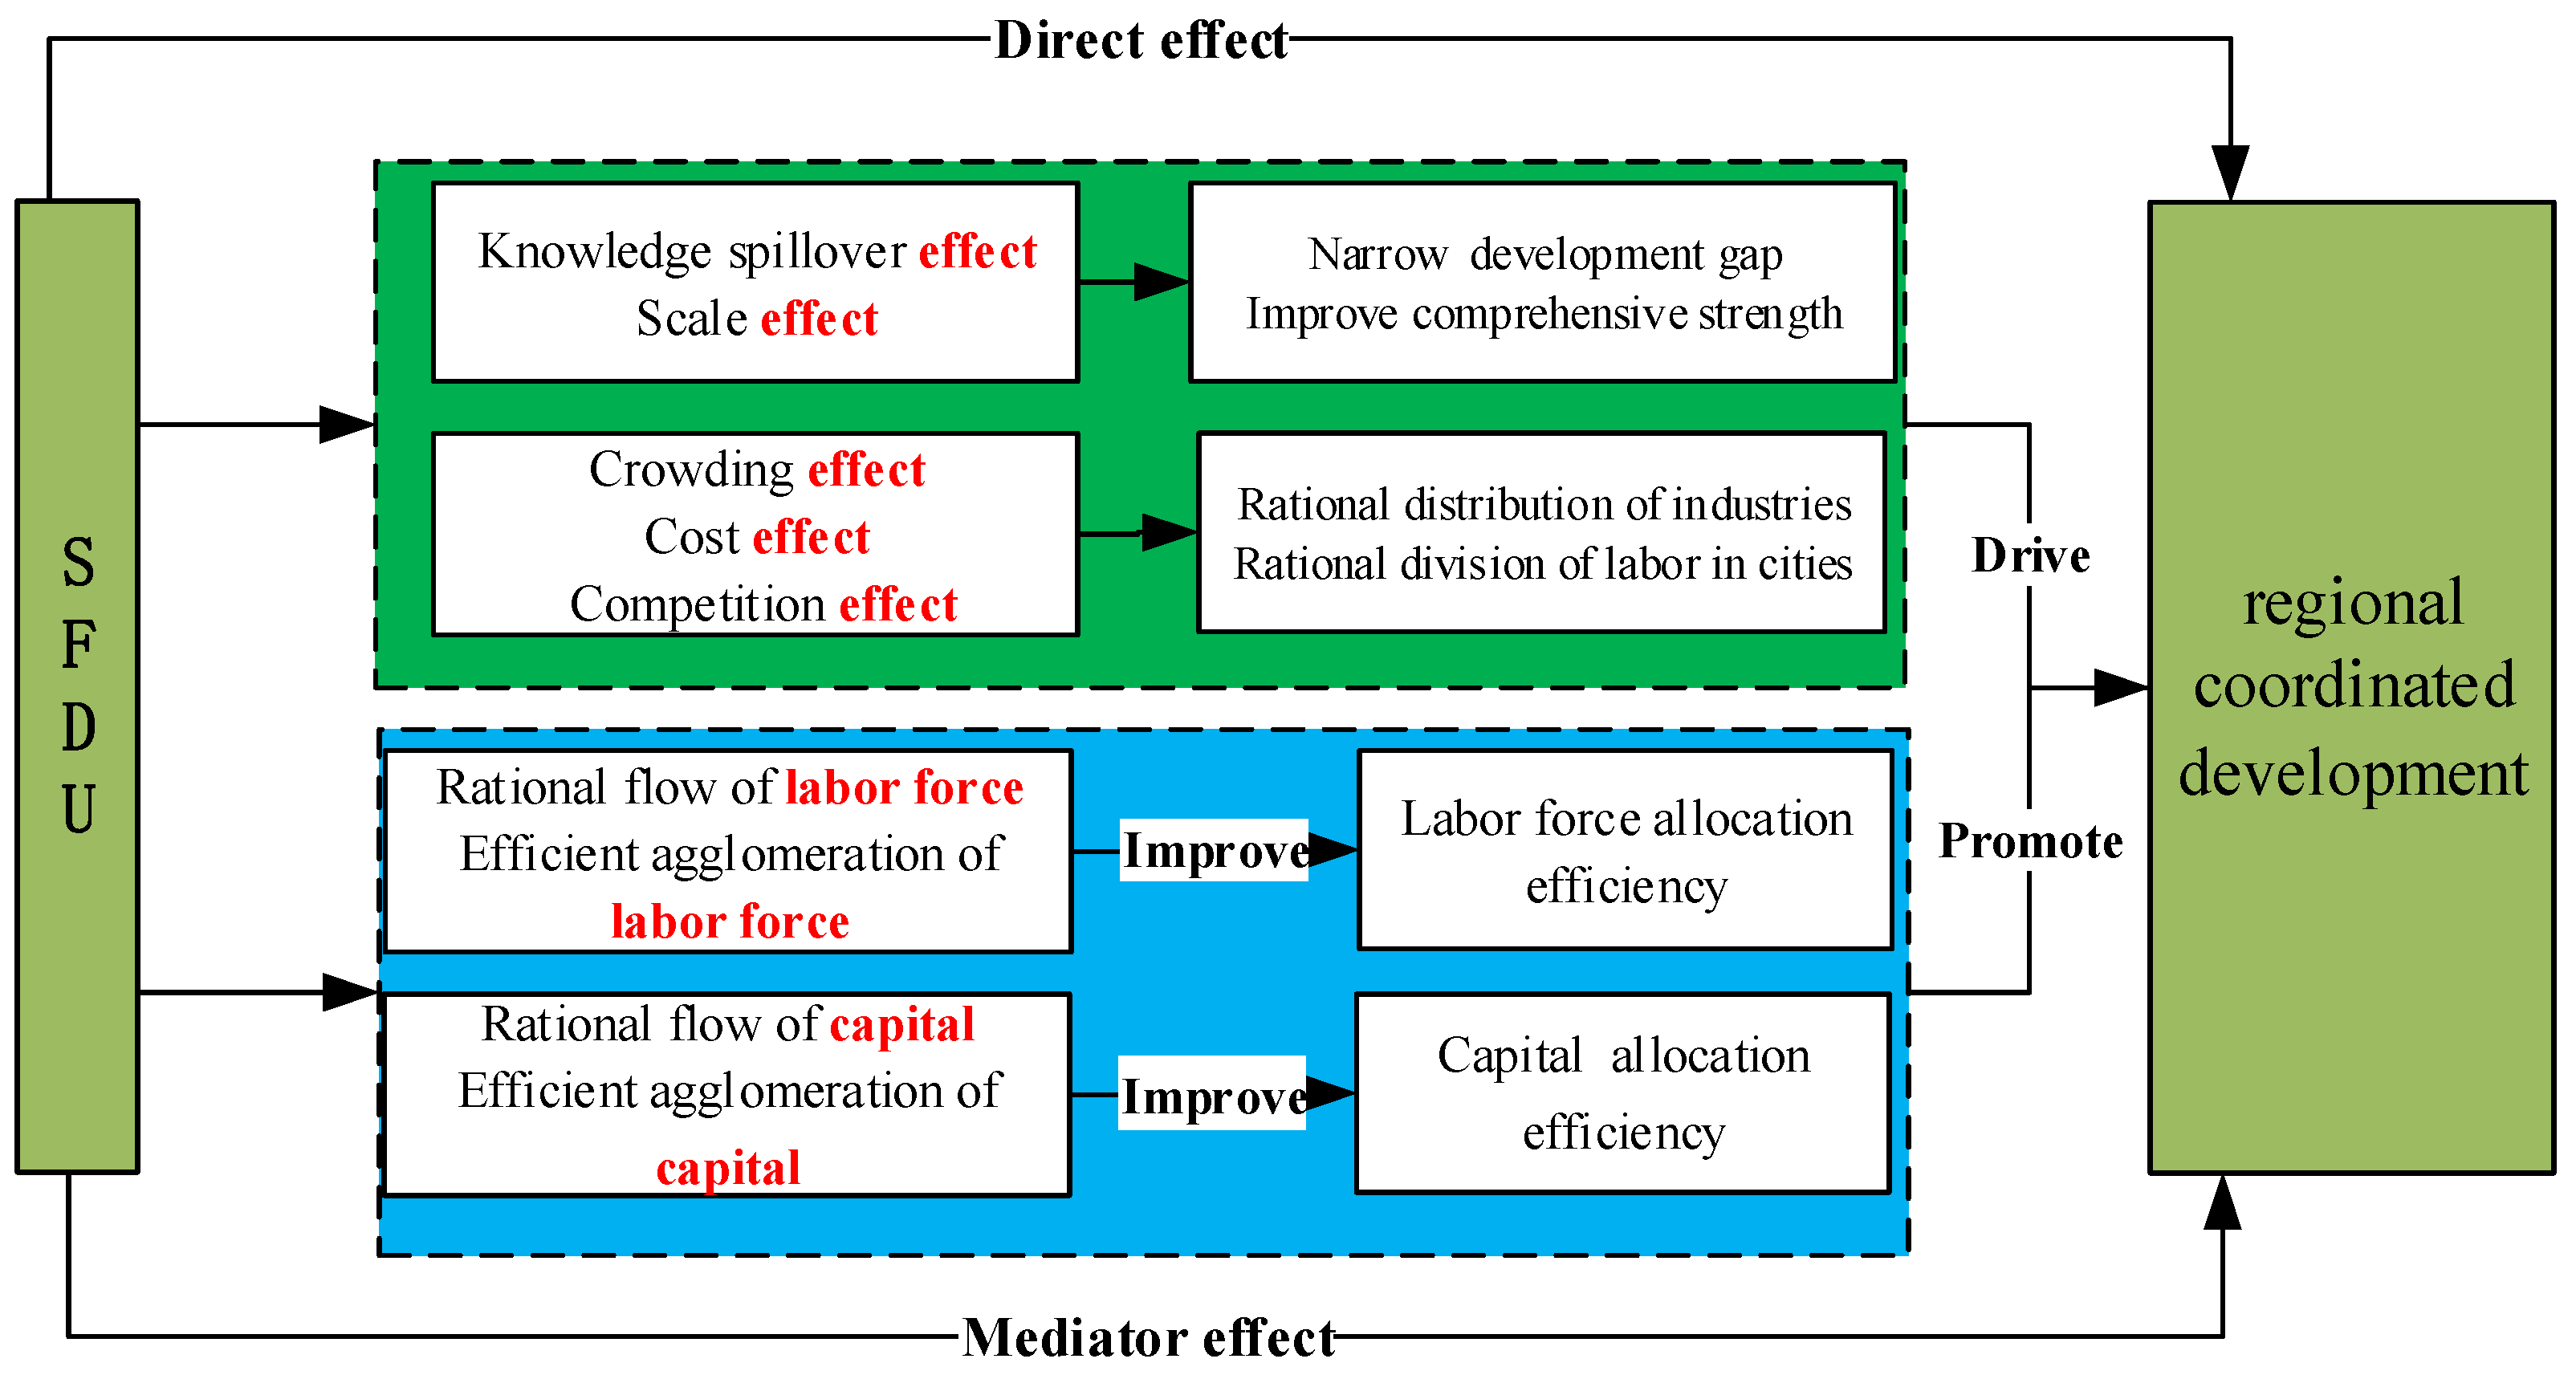
Figure 2.
The RCDI of the YREB from 2007 to 2016.
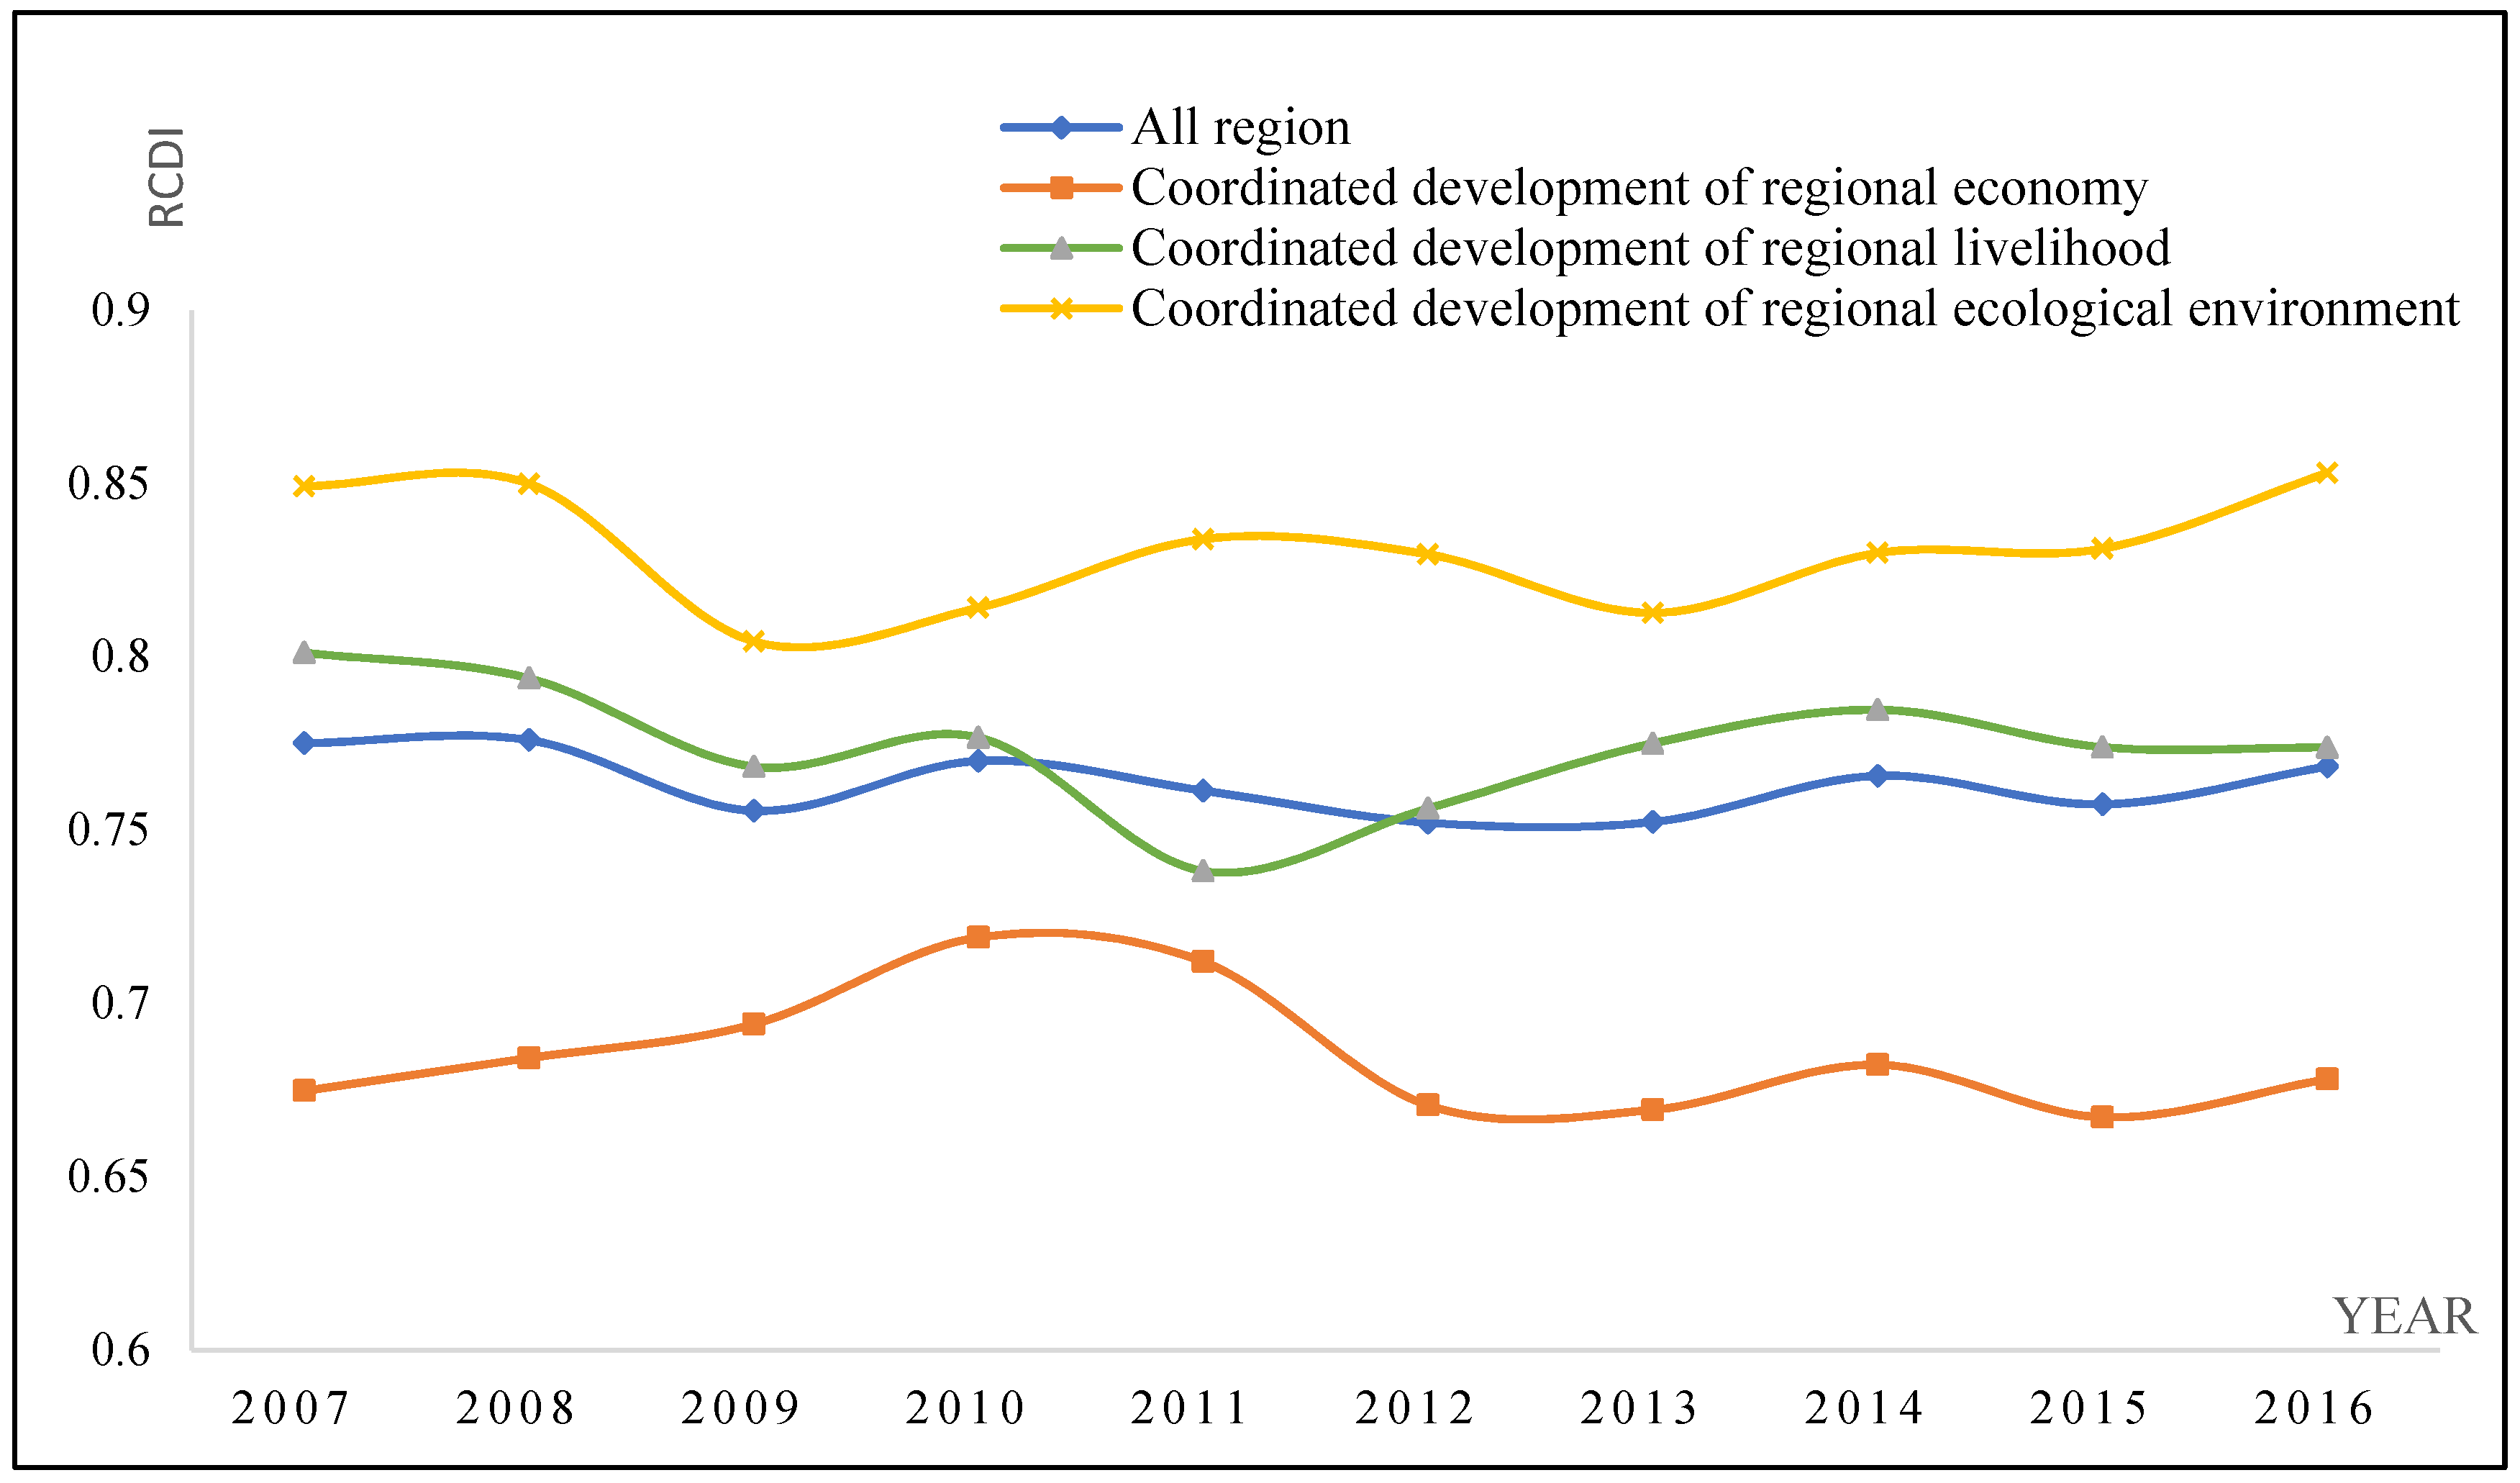
Figure 3.
The overall RCDI of the three major urban agglomerations of the YREB from 2007 to 2016.
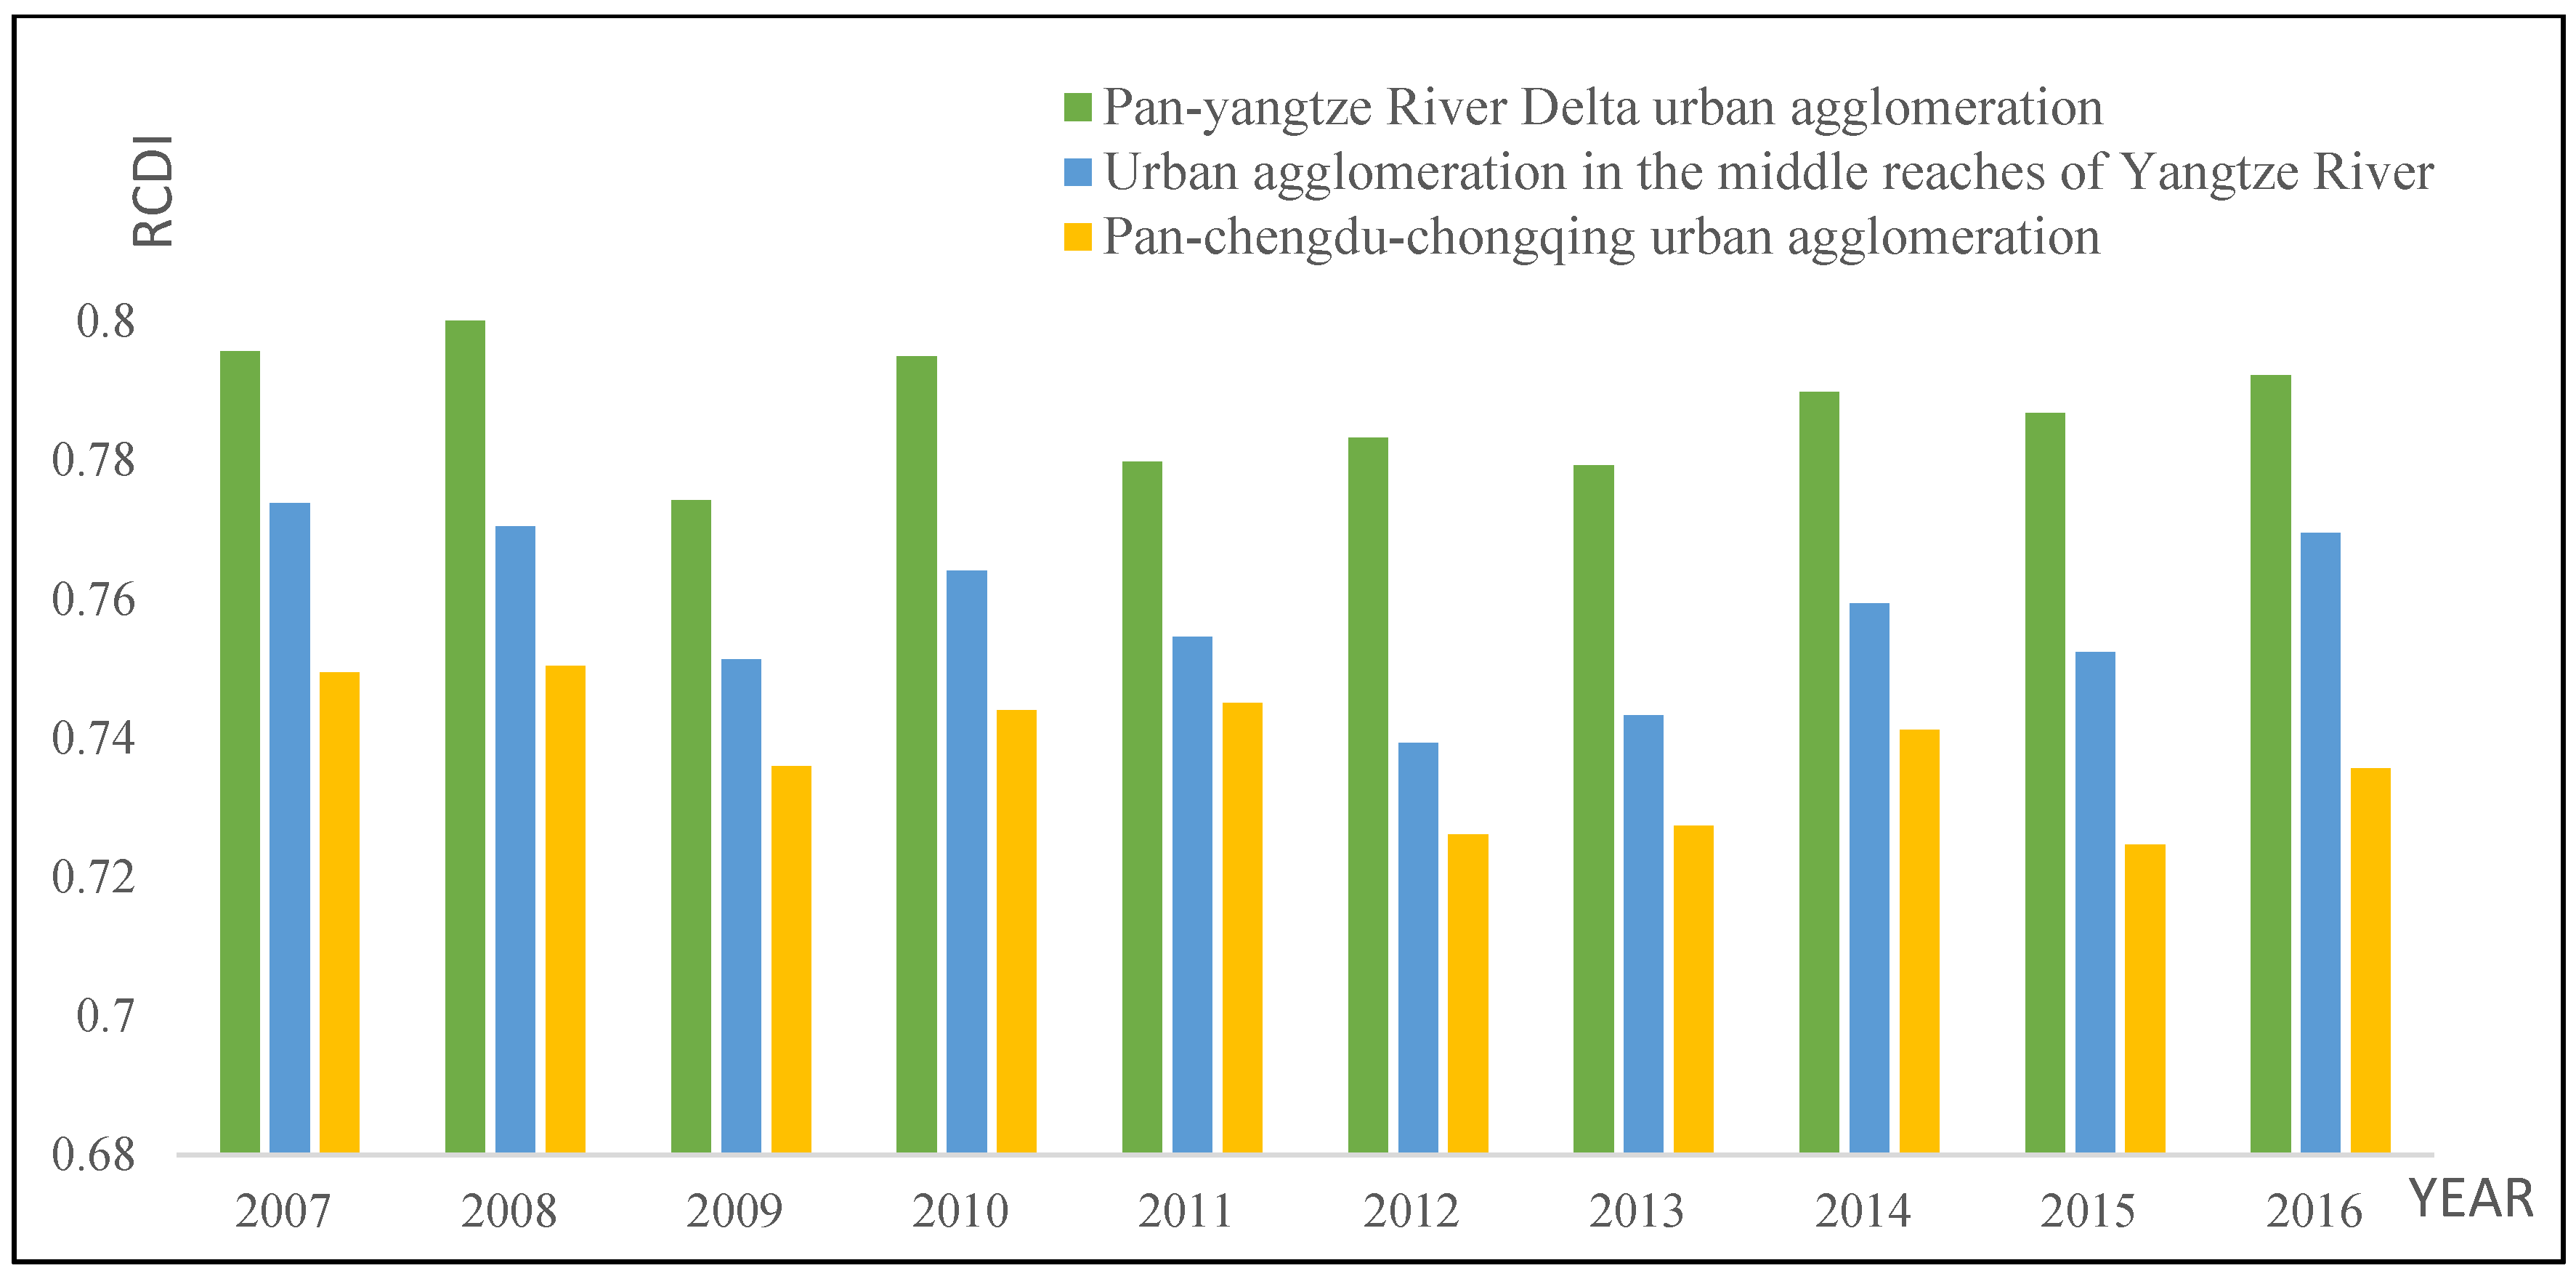
Figure 4.
Distribution of the overall RCDI in 108 cities of the YREB in 2016.
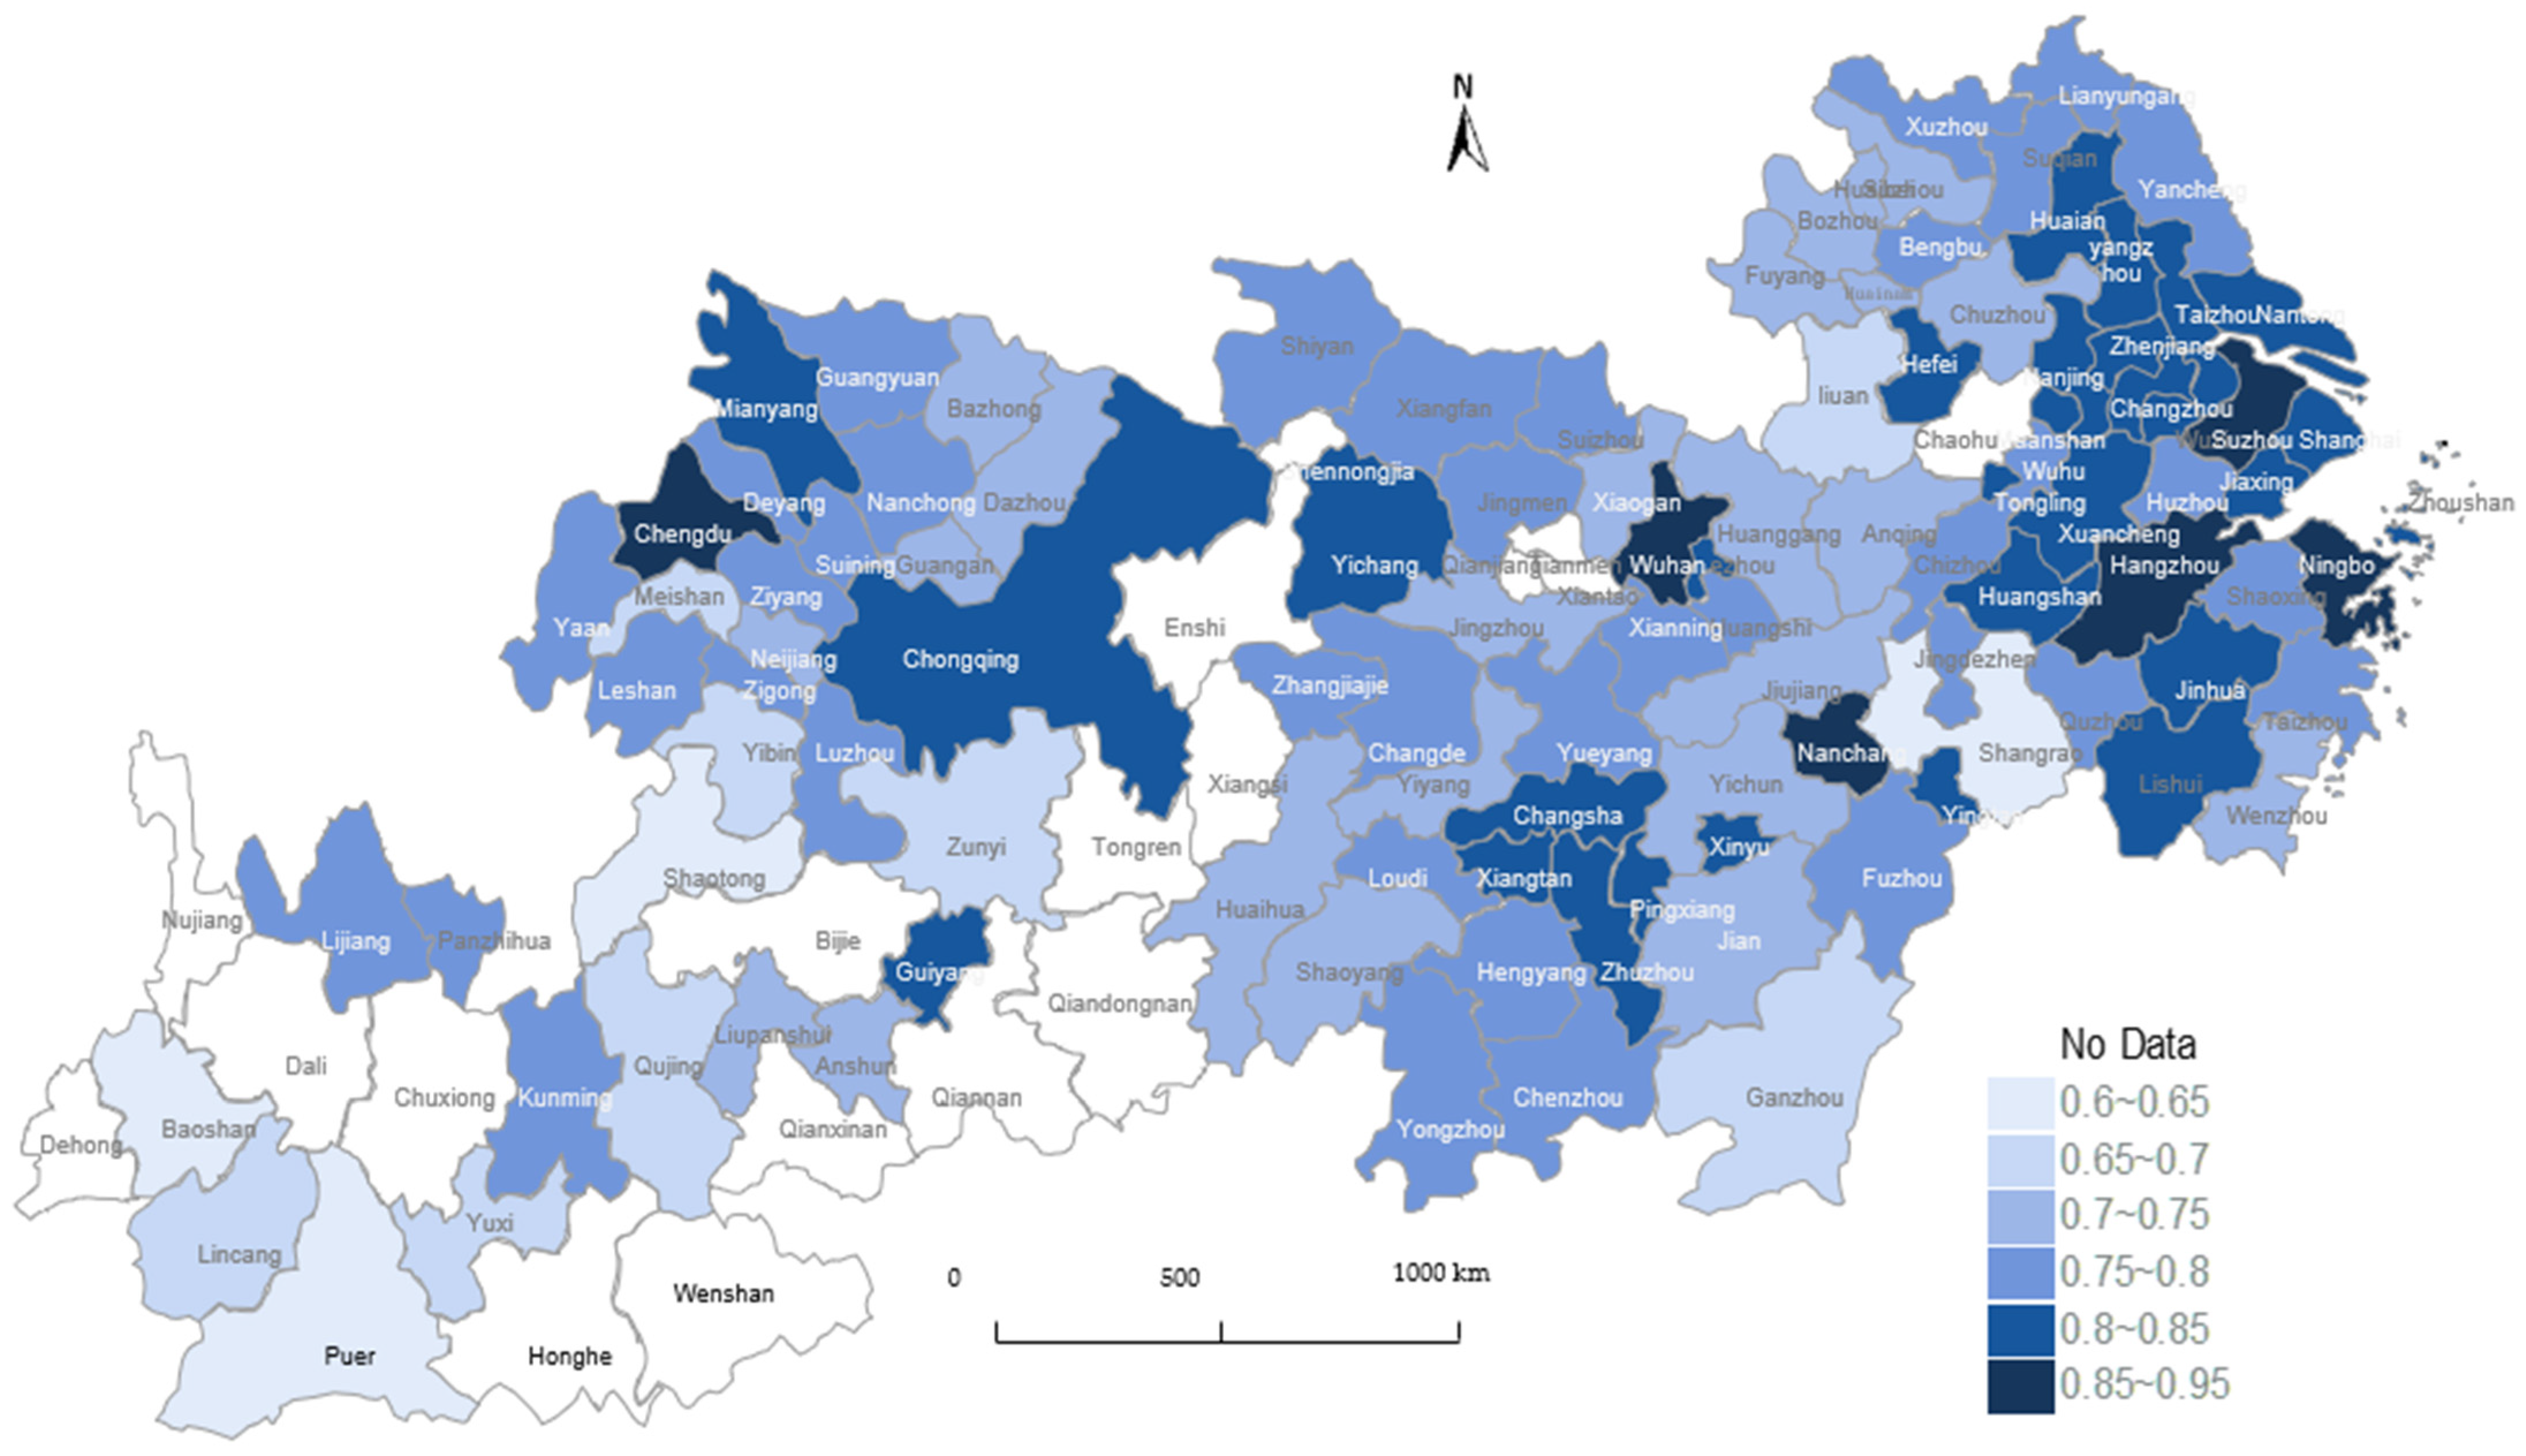
Figure 5.
Changes in the NDI in YREB from 2007 to 2016.
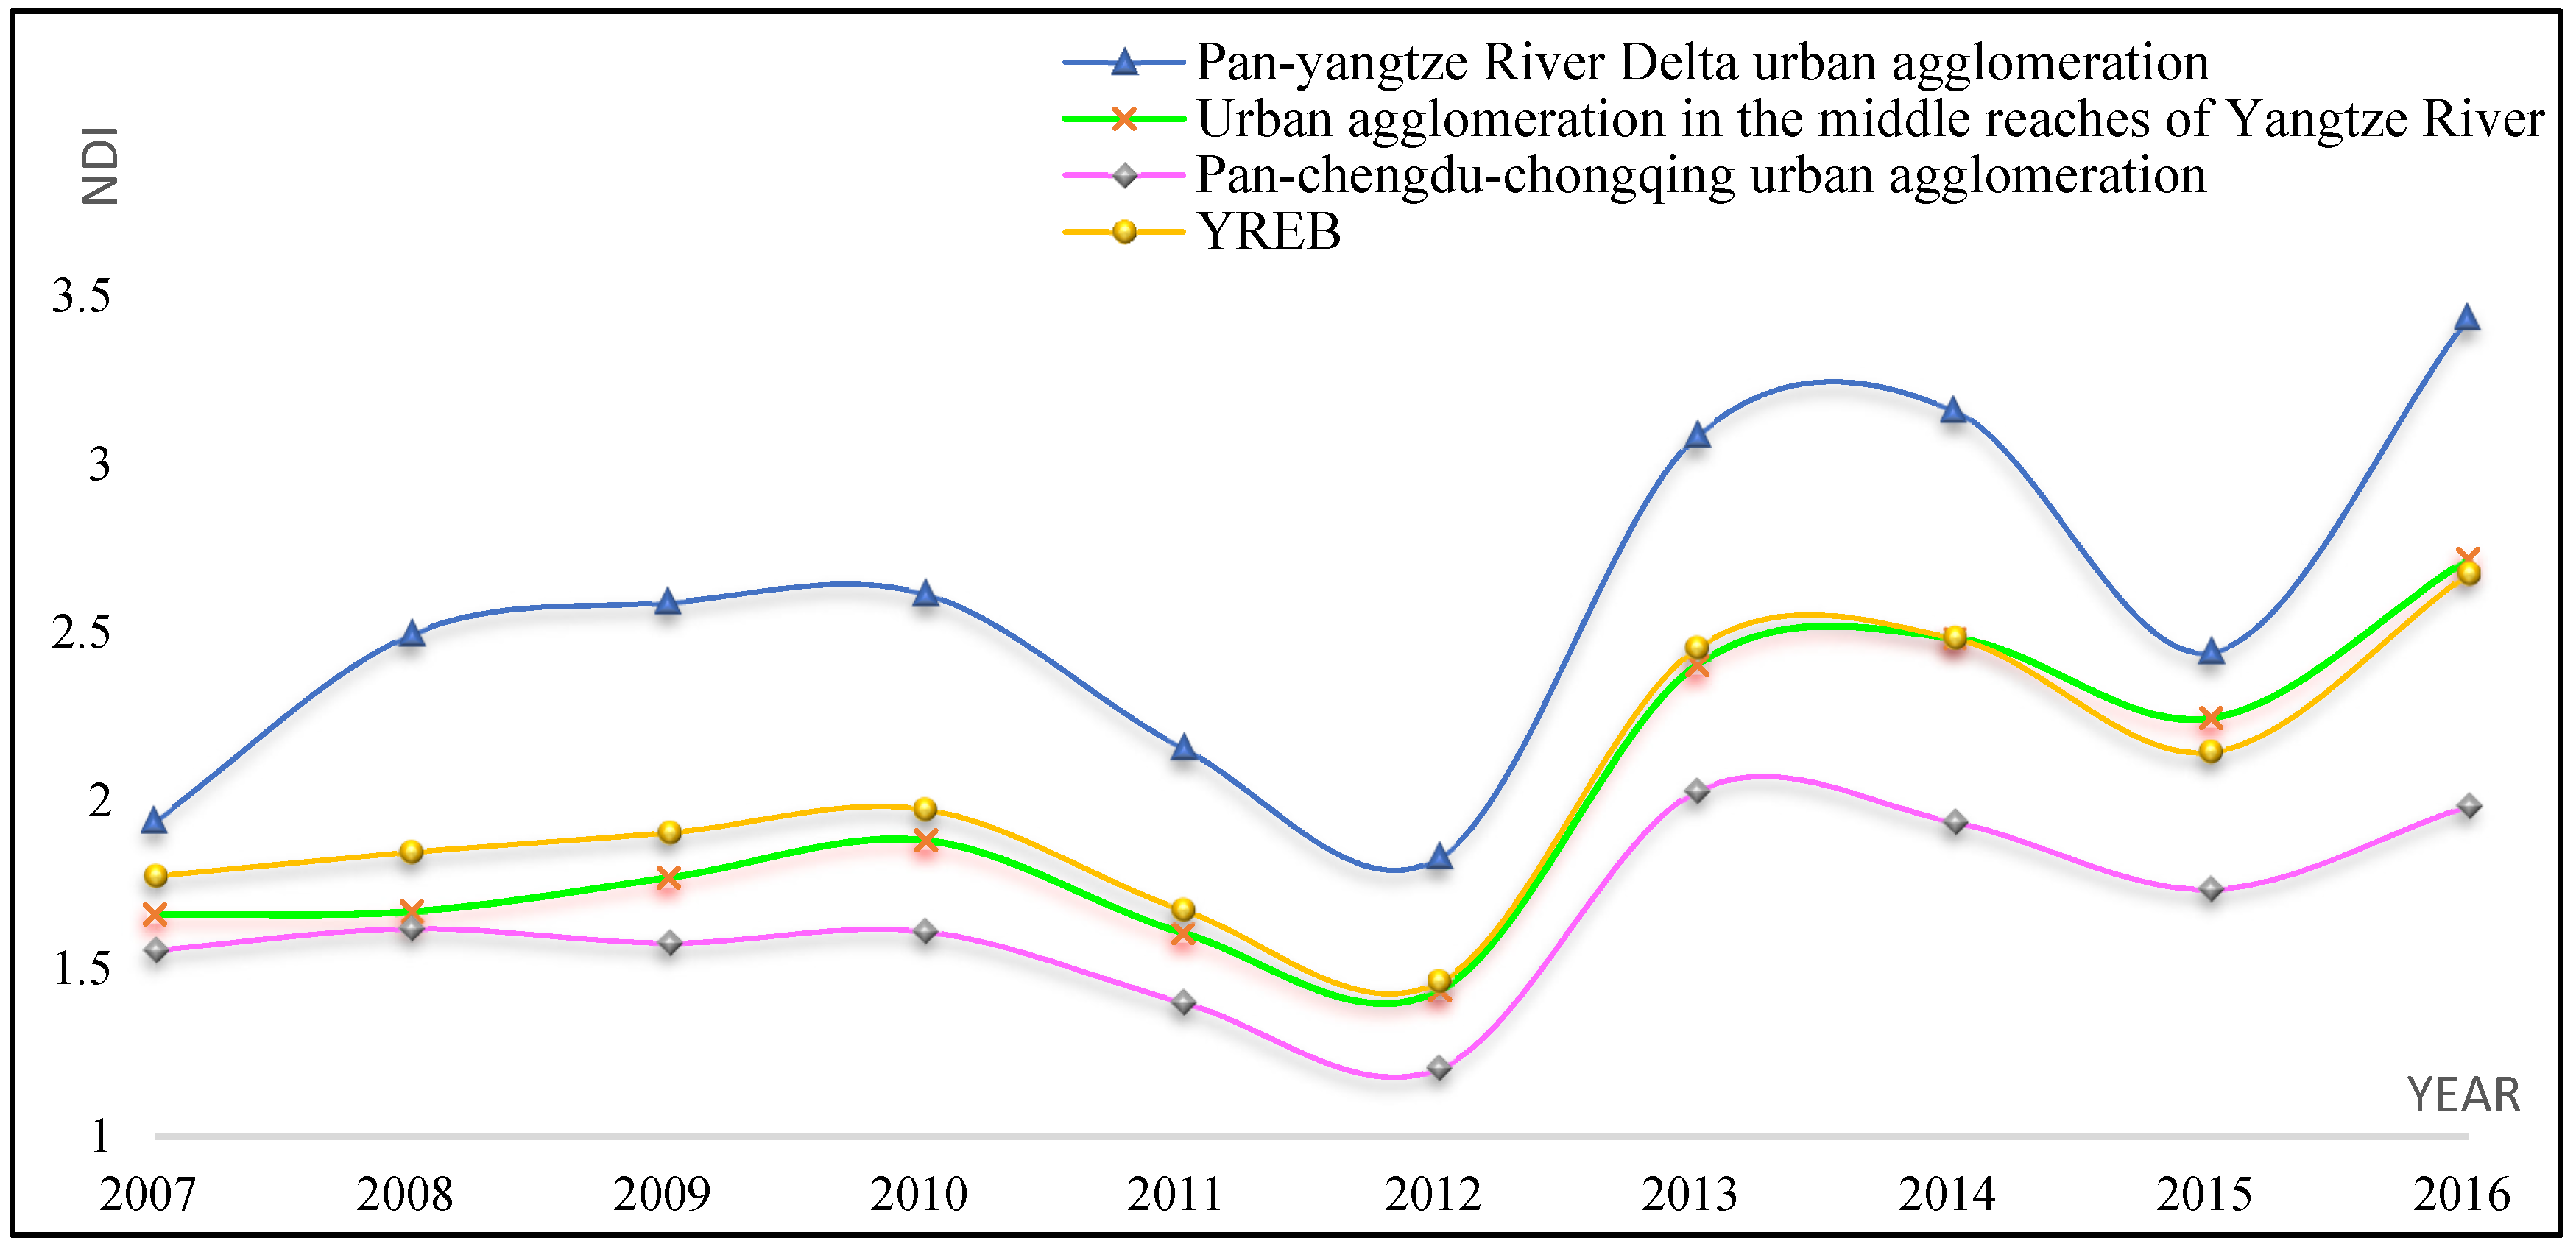
Figure 6.
Distribution of the NDI in 108 cities in the YREB in 2016.
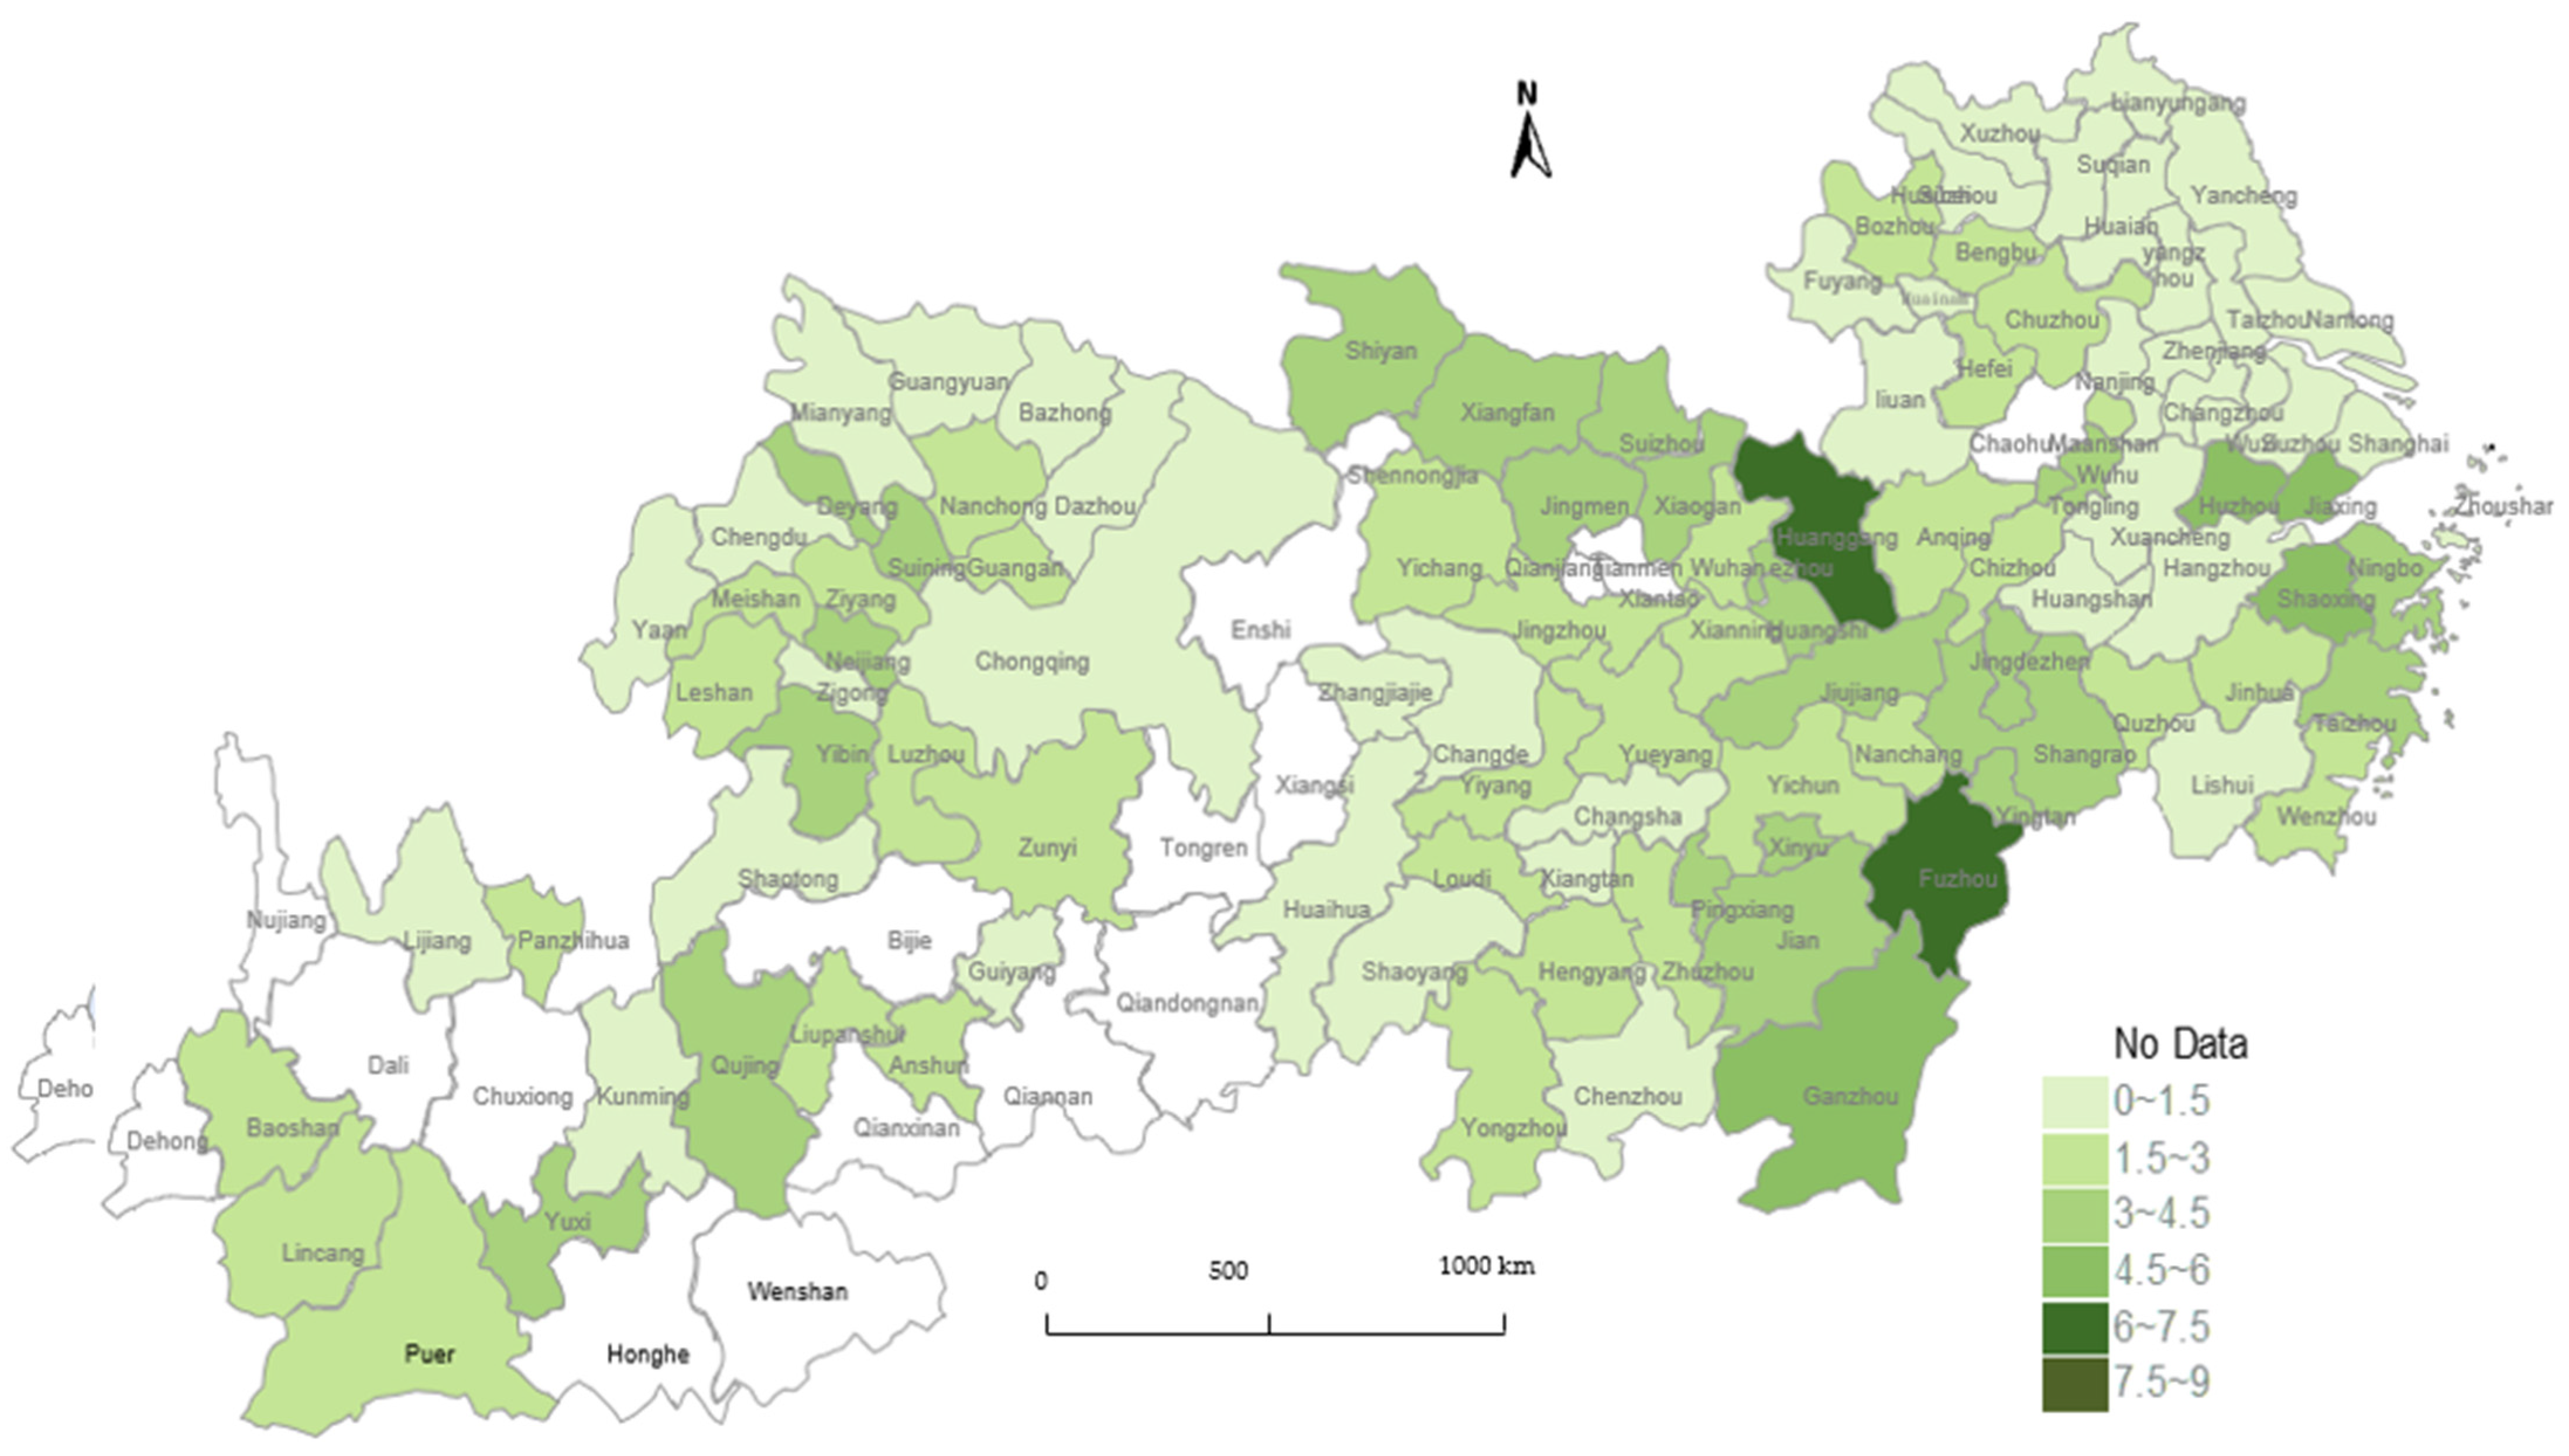

Table 1.
The RCDI system for measuring the level of regional coordinated development in the YREB.
| First-Level Indicators | Secondary Indicators | Third-Level Indicators | Indicator Explanation | Unit |
|---|---|---|---|---|
| Coordinated development of regional economy (RCDI_E) | Total output (B1) | GDP per capita (C1) | GDP/total population | Yuan |
| Public input (B2) | Public budget expenditure per capita (C2) | Total public budget expenditure/total population | Yuan | |
| Innovation input (B3) | R&D expenditure as a percentage of GDP (C3) | R&D spending/GDP | % | |
| Coordinated development of regional people’s livelihood (RCDI_P) | Urban and rural income (B5) | Urban–rural income gap (C5) | Per capita disposable income of urban residents/per capita disposable income of rural residents | times |
| Traffic condition (B6) | Urban road area per capita (C6) | Urban road area/total population of municipal districts | sqm/person | |
| Medical condition (B7) | Medical beds per capita (C7) | Number of medical beds/total population | beds/10,000 people | |
| Education condition (B8) | Education expenditure as a percentage of public budget expenditure (C8) | Education spending/public budget spending | % | |
| Coordinated development of regional green ecology (RCDI_G) | Energy consumption (B9) | Pollutant emissions per 10,000 yuan of GDP (C9) | (Industrial wastewater + industrial sulfur dioxide + industrial soot emissions)/GDP | ton/10,000 yuan |
| Green governance (B10) | Comprehensive utilization rate of industrial solid waste (C10) | Utilized industrial solid waste/total industrial solid waste | % | |
| Ecological outcomes (B11) | Urban green space per capita (C11) | Urban green space area/total population of municipal districts | sqm/person |
Table 2.
Description of the variables.
| Type | Abbreviation | Variable | Explanation |
|---|---|---|---|
| Explained variable | RCDI | Regional coordinated development level | Index |
| Explanatory variable | NDI | The SFDU | Index |
| Mediating Variable | RAE | Resource allocation efficiency | Calculated by model |
| Control variables | PCL | Physical capital level | The city’s annual fixed asset investment/GDP |
| HCL | Human capital level | College students/The total registered population | |
| URR | Urbanization Level | The population of municipal districts/The total population of the city | |
| GIL | Degree of government intervention | Fiscal expenditure/GDP | |
| FDI | Level of opening-up | Foreign direct investment/GDP | |
| INF | Infrastructure level | Per capita urban road area | |
| IS | Industrial structure | Urban tertiary industry added value/Secondary industry added value |
Table 3.
Descriptive statistics of variables.
| Variables | Mean | Standard Deviation | Min | Max | Sample Volume |
|---|---|---|---|---|---|
| RCDI | 0.7634 | 0.0588 | 0.5802 | 0.9148 | 1080 |
| NDI | 2.0396 | 1.2194 | 0.2035 | 8.0343 | 1080 |
| PCL | 0.7364 | 0.2490 | 0.2268 | 2.1761 | 1080 |
| HCL | 0.0172 | 0.0226 | 1.34 × 10⁻⁵ | 0.1270 | 1080 |
| URR | 0.3185 | 0.1941 | 0.0468 | 1 | 1080 |
| GIL | 0.1840 | 0.1070 | 0.0154 | 1.5751 | 1080 |
| FDI | 0.0225 | 0.0192 | 5.92 × 10⁻⁵ | 0.1185 | 1080 |
| INF | 10.9057 | 6.0315 | 0.59 | 71.6393 | 1080 |
| IS | 0.7893 | 0.3142 | 0.2723 | 3.17 | 1080 |
Table 4.
Analysis of basic regression results.
| Baseline Regression | Fixed Effects | Mixed Effects | Random Effects | SYS-GMM | |
|---|---|---|---|---|---|
| (1) | (2) | (3) | (4) | (5) | |
| L.RCDI | 0.432 *** | ||||
| −0.0186 | |||||
| NDI | 0.0028 ** | 0.005 *** | 0.0043 *** | 0.0056 *** | 0.0057 *** |
| (0.0012) | (0.0013) | (0.0012) | (0.0012) | (0.0006) | |
| PCL | −0.0106 ** | −0.0007 | −0.0140 *** | 0.0088 * | |
| (0.0049) | (0.0059) | (0.0048) | (0.0046) | ||
| HCL | 0.103 | 0.679 *** | 0.680 *** | 0.233 *** | |
| (0.2060) | (0.0801) | (0.1410) | (0.0602) | ||
| URR | −0.0064 | 0.0863 *** | 0.0478 *** | 0.0472 *** | |
| (0.0193) | (0.0087) | (0.0146) | (0.0095) | ||
| GIL | −0.0266 ** | −0.132 *** | −0.0429 *** | −0.133 *** | |
| (0.0107) | (0.0146) | (0.0107) | (0.0118) | ||
| FDI | 0.0716 | 0.481 *** | 0.299 *** | 0.0903 ** | |
| (0.0872) | (0.0771) | (0.0793) | (0.0364) | ||
| INF | −0.0019 *** | −0.0001 | −0.0016 *** | −0.0003 ** | |
| (0.0002) | (0.0003) | (0.0002) | (0.0001) | ||
| IS | 0.0010 *** | 0.0003 | 0.0008 *** | 0.0007 *** | |
| (0.0003) | (0.0002) | (0.0002) | (0.0001) | ||
| Constant | 0.758 *** | 0.749 *** | 0.720 *** | 0.723 *** | 0.396 *** |
| (0.0026) | (0.0109) | (0.0084) | (0.0097) | (0.0155) | |
| Observations | 1080 | 1080 | 1080 | 1080 | 972 |
| R-squared | 0.006 | 0.103 | 0.486 | ||
| F | 0.000 | 0.000 | 0.000 | ||
| Region fixed | YES | YES | |||
| Year fixed | YES | YES | |||
| AR(1) AR(2) | 0.000 0.120 | ||||
| Hansen | 0.175 |
Note: The standard deviation is in parentheses, *** p < 0.01, ** p < 0.05, * p < 0.1.
Table 5.
The impact of the SFDU on regional coordinated development in the pan-Yangtze River Delta urban agglomeration.
Table 5.
The impact of the SFDU on regional coordinated development in the pan-Yangtze River Delta urban agglomeration.
| (1) | (2) | (3) | (4) | |
|---|---|---|---|---|
| Overall Regression | Economic Coordination | People’s Livelihood Coordination | Ecological Coordination | |
| L.RCDI | 0.664 *** | |||
| (0.0393) | ||||
| L.RCDI_E | 0.650 *** | |||
| (0.0345) | ||||
| L.RCDI_P | 0.696 *** | |||
| (0.0419) | ||||
| L.RCDI_G | 0.553 *** | |||
| (0.0516) | ||||
| NDI | 0.0117 *** | 0.0231 *** | 0.0172 *** | −0.0157 ** |
| (0.0024) | (0.0030) | (0.0025) | (0.0067) | |
| PCL | −0.0063 | −0.0488 *** | 0.0165 | −0.0656 *** |
| (0.0104) | (0.0102) | (0.0123) | (0.0159) | |
| HCL | 0.341 ** | 0.586 ** | 1.499 *** | −0.856 *** |
| (0.1600) | (0.2770) | (0.3350) | (0.1920) | |
| URR | 0.0147 | 0.0486 *** | 0.0278 * | 0.0342 |
| (0.0335) | (0.0155) | (0.0371) | (0.0859) | |
| GIL | −0.0350 * | −0.0114 | 0.0640 * | −0.183 *** |
| (0.0202) | (0.0277) | (0.0386) | (0.0276) | |
| FDI | 0.0415 ** | 0.00225 ** | 0.139 * | 0.0986 |
| (0.1460) | (0.3840) | (0.2750) | (0.4660) | |
| INF | −0.00001 | −0.0024 *** | −0.0011 | 0.0022 ** |
| (0.0006) | (0.0007) | (0.0007) | (0.0010) | |
| IS | 0.0005 * | 0.0026 *** | −0.0025 *** | 0.0016 *** |
| (0.0003) | (0.0003) | (0.0005) | (0.0005) | |
| Constant | 0.206 *** | 0.163 *** | 0.238 *** | 0.310 *** |
| (0.0317) | (0.0273) | (0.0329) | (0.0540) | |
| Observations | 279 | 279 | 279 | 279 |
| AR(1) | 0.002 | 0.000 | 0.000 | 0.000 |
| AR(2) | 0.444 | 0.312 | 0.312 | 0.710 |
| Hansen | 0.875 | 0.865 | 0.865 | 0.692 |
Note: The standard deviation is in parentheses, *** p < 0.01, ** p < 0.05, * p < 0.1.
Table 6.
The influence of the SFDU on regional coordinated development of the urban agglomeration in the middle reaches.
Table 6.
The influence of the SFDU on regional coordinated development of the urban agglomeration in the middle reaches.
| (1) | (2) | (3) | (4) | |
|---|---|---|---|---|
| Overall Regression | Economic Coordination | People’s Livelihood Coordination | Ecological Coordination | |
| L.RCDI | 0.572 *** | |||
| (0.0331) | ||||
| L.RCDI_E | 0.731 *** | |||
| (0.0228) | ||||
| L.RCDI_P | 0.522 *** | |||
| (0.0408) | ||||
| L.RCDI_G | 0.494 *** | |||
| (0.0438) | ||||
| NDI | 0.0117 *** | 0.0230 *** | 0.0104 *** | 0.0094 *** |
| (0.0012) | (0.0018) | (0.0014) | (0.0020) | |
| PCL | 0.0157 | 0.0545 *** | 0.0736 *** | −0.0764 *** |
| (0.0117) | (0.0074) | (0.0136) | (0.0187) | |
| HCL | 0.383 *** | 0.748 *** | 0.172 ** | −0.0992 |
| (0.0696) | (0.1350) | (0.0682) | (0.1400) | |
| URR | −0.014 | −0.0885 *** | −0.0929 *** | 0.0699 *** |
| (0.0196) | (0.0218) | (0.0326) | (0.0243) | |
| GIL | −0.280 *** | −0.414 *** | −0.656 *** | −0.0695 |
| (0.0475) | (0.0441) | (0.0943) | (0.0569) | |
| FDI | −0.0989 | 0.151 | −0.325 ** | −0.111 |
| (0.1550) | (0.4400) | (0.1410) | (0.3500) | |
| INF | −5.27 × 10⁻⁵ | −0.005 *** | 0.0014 *** | 0.0039 *** |
| (0.0004) | (0.0005) | (0.0004) | (0.0010) | |
| IS | 0.0011 ** | −8.18 × 10⁻⁵ | 0.0019 *** | 0.0026 *** |
| (0.0005) | (0.0005) | (0.0004) | (0.0008) | |
| Constant | 0.294 *** | 0.227 *** | 0.351 *** | 0.311 *** |
| (0.0351) | (0.0221) | (0.0327) | (0.0420) | |
| Observations | 324 | 324 | 324 | 324 |
| Regions | 36 | 36 | 36 | 36 |
| AR(1) | 0.000 | 0.004 | 0.000 | 0.003 |
| AR(2) | 0.153 | 0.255 | 0.247 | 0.298 |
| Hansen | 0.802 | 0.655 | 0.958 | 0.795 |
Note: The standard deviation is in parentheses, *** p < 0.01, ** p < 0.05.
Table 7.
The impact of the SFDU on regional coordinated development in the Chengdu–Chongqing urban agglomeration.
Table 7.
The impact of the SFDU on regional coordinated development in the Chengdu–Chongqing urban agglomeration.
| (1) | (2) | (3) | (4) | |
|---|---|---|---|---|
| Overall Regression | Economic Coordination | People’s Livelihood Coordination | Ecological Coordination | |
| L.RCDI | 0.424 *** | |||
| (0.0202) | ||||
| L.RCDI_E | 0.836 *** | |||
| (0.0300) | ||||
| L.RCDI_P | 0.205 *** | |||
| (0.0341) | ||||
| L.RCDI_G | 0.469 *** | |||
| (0.0321) | ||||
| NDI | 0.0058 *** | 0.0148 *** | 0.0046 *** | −0.0115 *** |
| (0.0009) | (0.0018) | (0.0012) | (0.0024) | |
| PCL | 0.008 | 0.0166 | 0.0720 *** | 0.0312 *** |
| (0.0055) | (0.0110) | (0.0079) | (0.0087) | |
| HCL | 0.069 | 0.803 *** | 0.464 *** | −1.398 *** |
| (0.1240) | (0.2000) | (0.1690) | (0.1360) | |
| URR | 0.0479 *** | −0.0133 | 0.103 *** | 0.0549 ** |
| (0.0164) | (0.0312) | (0.0156) | (0.0277) | |
| GIL | −0.0810 *** | −0.0271 | −0.0679 *** | −0.236 *** |
| (0.0028) | (0.0284) | (0.0252) | (0.0399) | |
| FDI | 0.560 *** | 0.831 *** | 0.614 *** | 0.238 *** |
| (0.0659) | (0.0425) | (0.0428) | (0.0670) | |
| INF | −0.0004 ** | −0.0063 *** | −0.004 *** | 0.0054 *** |
| (0.0002) | (0.0006) | (0.0006) | (0.0004) | |
| IS | 0.0006 ** | 0.0012 *** | 0.0009 *** | 0.0013 *** |
| (0.0003) | (0.0004) | (0.0003) | (0.0003) | |
| Constant | 0.393 *** | 0.0807 *** | 0.506 *** | 0.368 *** |
| (0.0163) | (0.0255) | (0.0286) | (0.0259) | |
| Observations | 369 | 369 | 369 | 369 |
| Regions | 41 | 41 | 41 | 41 |
| AR(1) | 0.000 | 0.000 | 0.000 | 0.000 |
| AR(2) | 0.217 | 0.841 | 0.129 | 0.152 |
| Hansen | 0.615 | 0.516 | 0.482 | 0.443 |
Note: The standard deviation is in parentheses, *** p < 0.01, ** p < 0.05.
Table 8.
The internal mechanism test of the SFDU affecting regional coordinated development.
| RAE_K | RAE_L | RCDI | RCDI | RCDI | |
|---|---|---|---|---|---|
| (1) | (2) | (3) | (4) | (5) | |
| NDI | 2.878 *** | −6.151 *** | 0.0032 *** | 0.0051 *** | 0.0057 *** |
| (0.7100) | (1.9090) | (0.0007) | (0.0006) | (0.0006) | |
| PCL | −17.09 *** | 7.799 | 0.0160 *** | 0.000498 | 0.00876 * |
| (5.2980) | (8.2600) | (0.0036) | (0.0039) | (0.0046) | |
| HCL | 479.0 *** | −588.4 *** | 0.0255 | 0.296 *** | 0.233 *** |
| (80.7300) | (201.2000) | (0.0737) | (0.0438) | (0.0602) | |
| URR | −66.08 *** | 35.52 | 0.0628 *** | 0.0270 *** | 0.0472 *** |
| (17.4300) | (30.5300) | (0.0132) | (0.0043) | (0.0095) | |
| GIL | 53.81 *** | −91.60 ** | −0.136 *** | −0.135 *** | −0.133 *** |
| (17.0200) | (40.8500) | (0.0116) | (0.0080) | (0.0118) | |
| FDI | −1163 *** | 1495 *** | 0.269 *** | 0.311 *** | 0.0903 ** |
| (87.2400) | (273.0000) | (0.0296) | (0.0317) | (0.0364) | |
| IS | 0.076 | 1.314 *** | 0.0005 *** | 0.0007 *** | −0.0003 ** |
| (0.1930) | (0.3130) | (0.0001) | (0.0001) | (0.0001) | |
| L.YL | −0.0962 *** | 0.0007 *** | |||
| (0.0089) | (0.0001) | ||||
| RAE_K | 0.00032 *** | ||||
| (0.0000) | |||||
| RAE_L | −0.0001 *** | ||||
| (0.0000) | |||||
| Constant | 35.54 *** | −34.36 *** | 0.387 *** | 0.449 *** | 0.396 *** |
| (6.1010) | (9.4130) | (0.0176) | (0.0194) | (0.0155) | |
| Observations | 972 | 972 | 972 | 972 | 972 |
| AR(1) | 0.003 | 0.006 | 0 | 0 | 0 |
| AR(2) | 0.675 | 0.987 | 0.129 | 0.17 | 0.12 |
| Hansen | 0.312 | 0.978 | 0.16 | 0.274 | 0.175 |
Note: The standard deviation is in parentheses, *** p < 0.01, ** p < 0.05, * p < 0.1.
Table 9.
Robustness test: replacing explained variables.
| (1) | (2) | (3) | |
|---|---|---|---|
| Fixed Effects | Random Effects | SYS-GMM | |
| L.JN | 0.521 *** | ||
| −0.0097 | |||
| NDI | 0.0174 *** | 0.0167 *** | 0.0048 *** |
| (0.0031) | (0.0031) | (0.0006) | |
| PCL | −0.0412 *** | −0.0481 *** | −0.101 *** |
| (0.0158) | (0.0156) | (0.0048) | |
| HCL | 1.304 *** | 1.309 *** | 0.243 *** |
| (0.1880) | (0.1880) | (0.0866) | |
| URR | 0.162 *** | 0.161 *** | 0.0531 *** |
| (0.0204) | (0.0204) | (0.0116) | |
| GIL | −0.363 *** | −0.366 *** | −0.426 *** |
| (0.0346) | (0.0346) | (0.0205) | |
| FDI | 0.624 *** | 0.678 *** | 0.825 *** |
| (0.1900) | (0.1890) | (0.0441) | |
| INF | 0.0024 *** | 0.0023 *** | 0.0013 *** |
| (0.0007) | (0.0007) | (0.0002) | |
| IS | 0.0007 | 0.0006 | 0.001 *** |
| (0.0005) | (0.0005) | (0.0001) | |
| Constant | 0.610 *** | 0.623 *** | 0.378 *** |
| (0.0244) | (0.0264) | (0.0081) | |
| Control variables | Control | Control | Control |
| Observations | 1080 | 1080 | 972 |
| R-squared | 0.485 | ||
| AR(1) | 0.000 | ||
| AR(2) | 0.051 | ||
| Hansen | 0.163 |
Note: The standard deviation is in parentheses, *** p < 0.01.
Table 10.
Robustness test: quantile regression.
| Median Position | (1) | (2) | (3) |
|---|---|---|---|
| 25% | 50% | 75% | |
| Explained variable | RCDI | RCDI | RCDI |
| NDI | 0.0052 ** | 0.0076 *** | 0.0046 ** |
| (0.0016) | (0.0014) | (0.0020) | |
| Control variable | Yes | Yes | Yes |
| Observations | 1080 | 1080 | 1080 |
| R-squared | 0.236 | 0.376 | 0.395 |
| Region | Yes | Yes | Yes |
| Year | Yes | Yes | Yes |
Note: The standard deviation is in parentheses, *** p < 0.01, ** p < 0.05.
Publisher’s Note: MDPI stays neutral with regard to jurisdictional claims in published maps and institutional affiliations. |
© 2022 by the authors. Licensee MDPI, Basel, Switzerland. This article is an open access article distributed under the terms and conditions of the Creative Commons Attribution (CC BY) license (https://creativecommons.org/licenses/by/4.0/).
Share and Cite
MDPI and ACS Style
Guo, S.; Ma, H. Can the Spatial Function Division of Urbanization Promote Regional Coordinated Development? Evidence from the Yangtze River Economic Belt in China. Sustainability 2022, 14, 7115. https://doi.org/10.3390/su14127115
AMA Style
Guo S, Ma H. Can the Spatial Function Division of Urbanization Promote Regional Coordinated Development? Evidence from the Yangtze River Economic Belt in China. Sustainability. 2022; 14(12):7115. https://doi.org/10.3390/su14127115
Chicago/Turabian StyleGuo, Siliang, and Heng Ma. 2022. "Can the Spatial Function Division of Urbanization Promote Regional Coordinated Development? Evidence from the Yangtze River Economic Belt in China" Sustainability 14, no. 12: 7115. https://doi.org/10.3390/su14127115
Note that from the first issue of 2016, this journal uses article numbers instead of page numbers. See further details here.