
Powerline Corridors Can Add Ecological Value to Suburban Landscapes When Not Maintained as Lawn


1
Department of Biological Sciences, University of Illinois at Chicago, Chicago, IL 60607, USA
2
Cancer Physiology, Moffitt Cancer Center and Research Institute, Tampa, FL 33612, USA
*
Author to whom correspondence should be addressed.
Sustainability 2022, 14(12), 7113; https://doi.org/10.3390/su14127113
Submission received: 28 April 2022
/
Revised: 3 June 2022
/
Accepted: 8 June 2022
/
Published: 10 June 2022
(This article belongs to the Topic Urban Biodiversity and Design)
Abstract
:Electric powerline corridors are informal green spaces that encompass large areas of land and have the potential to support biodiversity in urban and suburban landscapes. However, the extent to which these corridors provide novel habitats compared to the surrounding landscape is unclear. Biodiversity in corridors is often compared to that of “natural” habitats despite the fact that the corridors are subject to frequent vegetation management. In urban and suburban landscapes, residential yards may provide a more appropriate comparison because they are a dominant type of green space and are also characterized by frequent vegetation management. We conducted a study of the biodiversity in suburban powerline corridors in northern Illinois, USA, and compared it to the biodiversity found in nearby residential yards. Our goal was to determine whether powerline corridors added ecological value to these suburban landscapes. We included three different management styles of powerline corridors: (1) frequently mowed and kept as lawn, (2) brush mowed on a five-year cycle (“old-field”), and (3) restored and/or maintained as native prairie. We measured the species richness and composition of plants, birds, and insect pollinators in corridors and yards. The corridor management types and comparison yards differed significantly in the richness of all three taxa, with old-field and/or prairie sites having greater species richness than mown corridors and/or comparison yards. Community composition also differed by management category. While the species richness of old-field sites tended to be high, prairie sites generally had more species of conservation interest. Our study shows that both old-field- and prairie-managed powerline corridors add habitat value to Midwestern U.S. suburban landscapes by providing alternative habitat types that support many species. Nonetheless, we suggest that managers looking to specifically support native and/or grassland specialist species in this region should manage sites as prairies when possible.
1. Introduction
Green space is vital for supporting biodiversity across urban and suburban landscapes [1]. Formal green spaces set aside for nature, such as parks, gardens, and forest preserves, can benefit both wildlife and people; however, informal green spaces, such as brownfields, vacant lots, street verges, and powerline corridor rights-of-way, can also be equally if not more important sources of habitats [2,3]. While informal greenspaces in developed landscapes can support substantial biodiversity, they are understudied systems [4,5].
Electric transmission powerline corridors are a category of informal greenspace that has the potential to contribute greatly to biodiversity in cities because they are generally managed by a single or a few stakeholders, are linear tracts that could increase connectivity between other green spaces, and can encompass large areas. In 2015, there were approximately 642,000 circuit miles of high-voltage transmission lines in the United States [6], which translates to hundreds of thousands of linear kilometers of electric right-of-way corridors, encompassing between 2 and 3 million hectares of land across the country [7]. Electric transmission corridors have unique requirements for management because vegetation must be kept from touching the powerlines [8]. Because of this, powerline corridors are generally maintained as perpetual early-successional or frequently disturbed habitats. Vegetation management in powerline corridors can take many forms, including grass- or brush-mowing, pruning, spot-spraying or blanket-spraying of herbicides [9], or even burning [10]. Many electric companies state a commitment to protecting or sustaining ecosystems, and a national public–private agreement was recently developed to promote voluntary conservation efforts on energy and transportation lands [11]. Therefore, it is important that vegetation management within powerline corridors supports these policies. If vegetation management is done effectively, powerline corridors may provide a huge amount of land area for species that require early-successional habitats, including many pollinators [12] and grassland and shrubland birds [13].
Several studies have examined the effects of powerline corridor vegetation management on biodiversity, e.g., [7,12,14,15], but there is not a consistent answer as to which management strategy is best for biodiversity overall, as it may be taxon- and context-specific. In some cases, the frequent disturbances inherent in powerline corridor management can support an increase in invasive plant cover (e.g., [16]); in other situations, native vegetation, such as tallgrass prairie plants, can thrive (e.g., [17]). Depending on the management of a powerline corridor and its effects on vegetation species richness, there is evidence for an increase in [7,18], mixed response of [19], or no effect on [20] the species richness of bees and butterflies in and around the corridor as compared to surrounding natural habitats.
Like powerline corridors, residential yards and gardens are widely distributed and account for a large proportion of green space, particularly in urban and suburban environments [21]. In some urban areas, residential yards are the single largest contributors to green space (e.g., [22]). Although individual yards are relatively small, when viewed together, they can be envisioned as the backbone of the green urban and suburban matrix. As with powerline corridors, the vegetation in residential yards is generally characterized by routine management (although residential yard management varies widely, and they may be mown more frequently than corridors). This makes yards more similar to powerline corridors than the undisturbed “natural” habitats to which they are more often compared in the literature (e.g., [18,23,24,25,26,27]). Therefore, due to their wide distribution and frequent management, habitats in residential yards provide an ideal baseline of comparison for green space in developed landscapes. If powerline corridors can support different or greater levels of biodiversity than those found in yards, they add ecological value to the urban or suburban landscape. Very few previous studies have actually examined the ecology of powerline corridors in the context of residential landscapes despite the increasing importance of residential areas in the face of expanding global urbanization and suburbanization [28].
The goal of our study was to compare biodiversity in suburban powerline corridors to the biodiversity found in the surrounding residential yard matrix, focusing on three taxa: plants, birds, and bees/wasps/lepidopterans (hereafter, “insect pollinators”). We also compared corridors managed in three different ways: (1) mowed frequently and maintained as lawn, (2) brush mowed approximately every five years, with vegetation allowed to establish and grow spontaneously between mowing events, and (3) restored and/or maintained as native prairie habitat. We compared the biodiversity in these corridors to the biodiversity in the surrounding residential neighborhoods. We hypothesized that vegetation management will significantly affect the added value of the corridor as a habitat for wildlife. We predicted that prairie sites will have different communities and higher overall biodiversity than the other sites, and yard sites would fall somewhere in between mown and prairie sites in terms of habitat quality. In addition, we predicted that differences in management would affect vegetation and floral resources, which would, in turn, affect bird and insect pollinator communities.
2. Materials and Methods
2.1. Study Region and Field Sites
Our study took place in the suburbs of Chicago, Illinois, USA, which is the third-largest metropolitan area in the United States. All of our study sites were located in DuPage and Will counties, two of the five “collar counties” surrounding the city of Chicago. These counties are mainly suburbanized/developed, although some areas to the south are used for agriculture [29]. This region is characterized by a hot-summer humid continental climate and experiences four distinct seasons [30]. Prairies are one of the major historical native habitat types in this region, although their prevalence and connectivity has been greatly decreased due to conversion to agriculture and urbanization [31].
Our study areas were located in electric transmission right-of-way corridors owned by the Commonwealth Edison (ComEd) company, one of the largest landholders in the state of Illinois, USA. ComEd maintains over 22,945 hectares (56,698 acres) of electric transmission rights-of-way in Illinois, and the company has the authority to control how the vegetation in that land is managed (Amy Flansburg, personal communication, 7 December 2021).
These powerline corridors (hereafter, “corridors”) had a mean width of 65.5 m (range = 40–138 m). Vegetation in the corridors was managed in three different ways: (1) maintained as a prairie, (2) managed on a 5-year brush-mowing and herbicide cycle to remove trees and large shrubs, or (3) mowed low and managed as lawn/turf grass. Prairie sites were either restored de novo prior to our study or were located on remnant dolomite prairies. Prairie management during our study season was limited to spot-spray herbicide application to control invasive species. In previous years, the de novo restoration prairies were also managed through seeding, mowing, haying, herbicide application, and burning. Sites maintained on the 5-year cycle resembled old-field habitats (and, in fact, most were previously farmed); lawn-type sites were mowed with differing frequencies, but generally had no tall weeds or shrubs and had grassy vegetation under approximately 40 cm. All of the non-prairie (i.e., mown and old-field) corridor sites were located within suburban residential neighborhoods, while the prairie sites were located within or adjacent to county forest preserves (by necessity due to the fact that this is where all of the prairie corridors in the region are found).
We haphazardly selected three prairie, three old-field, and four mown corridors (to account for the short lengths of two of them) for a total of ten study corridors (Figure 1A,B). All corridors were separated from each other by at least 0.5 km, although the majority were much farther from each other (Figure 1A). At each study corridor, we selected either two or three study sites depending on the length of the corridor section; in all, we had a total of 28 sites spread across the ten corridors. Study sites within a corridor were separated from each other by approximately 300 m (Figure 1C) to ensure spatial independence for both birds [32] and insect pollinators [18]. Owing to logistical constraints, we were unable to sample plants, insect pollinators, and birds at all of the study sites, although each taxon was surveyed in all three types of corridors. Birds were sampled at a subset of 23 sites and insect pollinators and plants were sampled at a subset of 19 sites.
In addition to corridor sites, we selected nearby residential yards for comparison to the non-prairie corridors. Residential comparison sites were different for birds than for insect pollinators and plants due to the need for sampling on different scales for each taxon, but all were between approximately 100 and 300 m from either a mown or old-field corridor where we surveyed birds or insect pollinators and plants. We haphazardly selected one bird comparison site on a street in a residential neighborhood near each mown and old-field corridor (n = 6 residential bird comparison sites). This allowed us to survey birds in multiple yards at once. In contrast, we chose five backyards in each of three neighborhoods near non-prairie corridors for insect pollinator residential comparison sites (15 total backyards). The backyards were chosen haphazardly based on homeowner permission. Because the backyards were smaller than the corridor sites, we treated the data for each cluster of residential backyards as a single site in order to compare sites with equal areas and sampling effort (n = 3 backyard “sites” from 15 backyards).
2.2. Insect Pollinator Surveys
To capture as much of the diversity in the insect pollinator communities as possible, we used two complementary survey methods: Pollard walks and pan traps [27,33]. We set an 8 m transect for insect pollinator surveys in the center of the lawn in each backyard, and 40 m transects were established at each corridor site; therefore, each cluster of five residential backyard transects was of comparable length to one corridor site transect. Transects were used to conduct Pollard walks and to deploy pan traps.
During the Pollard walks, transects were walked at a consistent pace, and all Hymenoptera (excluding ants) and Lepidoptera within 5 m of the transect were identified and counted. In the corridors, each 40 m transect was walked for 30 min. In each residential backyard, 8 m transects were walked for 6 min. All Pollard walks were conducted by the same researcher, once in early summer (15 June through 6 July) and once in mid/late summer (4 August through 21 August). Walks were conducted between the hours of 8 a.m. and 3 p.m. on days that were partly or mostly sunny, with temperatures above 60 °F and wind speeds below 15 mph.
Pan traps, also known as bee bowls, were used to passively sample the insect pollinator community. We used small plastic bowls that were painted white, blue, yellow, or red and filled with a dilute solution of dish soap. Bowls were spaced evenly along the transect in each site, with 4 bowls (one of each color) placed along the transect in each backyard and 20 bowls placed along the transect in each corridor site. Bowls were deployed on the same day that Pollard walks were conducted and then collected on the following day, allowing roughly 24 h of passive sampling. The contents of the bowls were strained and placed in sealed containers with 70% ethanol solution. In the lab, we sorted, pinned, and identified the Hymenoptera (excluding ants) and Lepidoptera [34,35,36,37]. While other insect orders, such as flies (Diptera) and beetles (Coleoptera), may also provide pollination services, we opted to include only Hymenoptera and Lepidoptera because our two sampling methods were designed to optimize collection of these orders only.
We pooled the data from both Pollard walks and pan traps for each site. Because we were unable to confidently identify all hymenopteran pollinators to the species level, we lumped our pollinator data collected from both Pollard walks and pan traps at the genus level for the insect pollinator genus richness per site. We were able to identify all lepidopterans to the species level, so we created a second response variable from a subset of the insect pollinator data describing the species-level richness of lepidopterans only at each site.
2.3. Plant Surveys
In July, we used the same transects established for the Pollard walks to conduct vegetation floristics surveys of each site. Ten 0.25 m2 quadrats were evenly spaced along the transects in the corridors, and two quadrats were evenly spaced along transects in the lawn in the backyards. We identified all plants within each quadrat to the lowest taxonomic level possible while in the field. Plants were later classified as native or non-native according to the USDA PLANTS database [38]. We then determined both the total plant species richness and the native richness per site.
2.4. Bird Surveys
To survey birds, we conducted 10 min point counts at the center of each corridor site and at the residential comparison sites. During the point count, the observer recorded all birds seen or heard within a 100 m radius. At corridor sites, we recorded whether the birds were detected within or outside of the corridor.
Point counts were conducted after sunrise and no later than 9:30 AM at three times during the breeding season: early June (8–16 June), mid/late June (18–25 June), and late June/July (28 June–14 July). A minimum of eight days passed between each point count at a site. Each point count was conducted by a single experienced observer and took place only under appropriate weather conditions (i.e., no rain or strong wind).
We used these data to calculate the cumulative species richness per site (across all point counts) of all birds detected and the cumulative species richness per site of birds detected within the boundaries of the corridor. We normalized the corridor bird species richness by dividing the number of species detected within the corridor by the area of corridor within the 100 m radius buffer. This converted the corridor bird response variable into the number of bird species per hectare of corridor.
2.5. Environmental Covariate Data Collection
We collected data on environmental variables that we hypothesized would affect biodiversity within the sites: floral resources, vegetation density, and surrounding landcover. We measured floral resources twice per season at each pollinator site on the same days and transects as the Pollard walks. A single researcher estimated the percentage of surface area covered by blooming forbs within 5 m of each transect. We then characterized floral resources at each site by selecting the higher floral resource cover of the two visits as an estimate of peak bloom.
We measured vegetation density in corridors along a 50 m transect centered on each point count location and extending lengthwise along the corridor using a modified Robel pole [39]. Robel pole measurements were taken at plots located every 5 m along each transect for a total of 10 plots per site. Robel pole measurements provide an estimate of standing biomass and vegetation structure [40], which is often a significant predictor of bird habitat use [41]. Our pole consisted of a 1.4 m length of a PVC pipe that was 2.13 cm in diameter with markings every 2.5 cm. An observer looked at the pole at a distance of 4 m and a height of 1 m and recorded the lowest marking on the pole that was not obscured by vegetation (even if that marking was visible only due to a gap in the vegetation and was obscured above that point). At each plot, we took Robel pole measurements in the four cardinal directions and measured the maximum live plant height within 20 cm of the pole. We then calculated the mean Robel pole measurement (hereafter, “vegetation density index”) for each site.
Finally, we digitized all impervious surfaces, trees/shrubs, and the area of the corridor within a 100 m radius of each point count location based on reference imagery from the National Agriculture Imagery Program (USDA NAIP) from 2019 (the most recent imagery available) [42]. We then calculated the area of each of the two landcover categories, as well as the area covered by the corridor itself, within each 100 m radius buffer.
2.6. Analysis
We used Shapiro–Wilk tests [43] followed by ANOVA tests to determine whether the four site types (residential comparison site or mown, old-field, or prairie corridor) varied significantly across four environmental variables: (1) maximum floral resource cover; (2) vegetation density index; (3) area of tree or shrub cover within a 100 m radius of each site; (4) area of impervious surface cover within a 100 m radius of each site. When the ANOVA tests were significant, we used Tukey’s honest significance tests to examine pairwise differences among management categories for each environmental variable.
We analyzed the biodiversity at each site by quantifying the plant communities (all plants and native plants only), the bird communities (all birds detected within 100 m of each site and birds detected only within the corridor), and the insect pollinator communities (non-ant hymenopterans and lepidopterans, as well as lepidopterans alone), for a total of six response variables. Each response variable described the species (or genus) richness at each site. We chose richness rather than another index of biodiversity because it is both simple and easy to interpret [44].
We conducted three types of analyses of the biodiversity at each site: (1) testing for an effect of site type on each of the six biodiversity response variables; (2) testing for the effects of environmental covariates on the biodiversity response variables; (3) examining the differences in community composition for each of the three study taxa. All analyses were conducted in R version 3.6.1 [45].
We began by using Shapiro–Wilk tests [43] to determine if each of the six response variables was normally distributed. We then used either ANOVA or Kruskal–Wallis non-parametric tests to determine whether site type significantly affected the richness of each response variable. We followed these up with Tukey’s honest significant difference or pairwise Wilcoxon rank sum tests to determine whether there were significant differences between each site type. The p-value adjustment for the pairwise Wilcoxon rank sum tests followed Benjamini and Hochberg [46].
Next, we used AICc ranking of models in a priori model sets to determine the most important predictors of insect pollinator genus richness, lepidopteran species richness, total bird species richness, and richness of birds/ha in the corridor. We did not create models of plant species richness because we hypothesized that site type would be the most important predictor of plant communities, which we tested in the previous analysis. We created each model set to include variables that we had hypothesized would affect each biodiversity response variable. Specifically, we hypothesized that vegetation density and landscape context would predict bird biodiversity, and floral resource availability would predict insect pollinator diversity; all model sets also included models with the management category as a predictor variable, as well as a null model. We centered and scaled (i.e., subtracted the mean and divided by the standard deviation) the landscape context variables in these models because they were on very different scales from those of the other predictor variables. We used linear mixed-effects models with site location as a random effect (see Supplementary Table S1 for the complete model sets tested for each response variable). We used AICc to select the most parsimonious model for each response variable. We present the coefficients for the top model when only no other models were within ΔAICc < 2 from the best-supported model; when more than one model was within 2 ΔAICc from the top model, we present the model-averaged coefficients from the entire model set.
Finally, we characterized the communities for each taxon at each site based on the presence/absence of species. We examined insect pollinator genera, bird species within the corridor, and all plant species. We used the Jaccard index to calculate the dissimilarity among communities. We visualized community similarity using non-metric multi-dimensional scaling (NMDS) plots and calculated species vectors with 999 permutations. All multivariate analyses were performed using the R package “vegan” [47].
3. Results
During our surveys, we detected 114 plant species, 60 genera of insect pollinators, and 50 species of birds. We recorded 586 individual insect pollinators during the Pollard walks across all sites and collected 2127 individual insect pollinators in the pan traps. We counted 2202 individual birds during the point counts. The full species/genus lists are available in Supplementary Tables S2–S4.
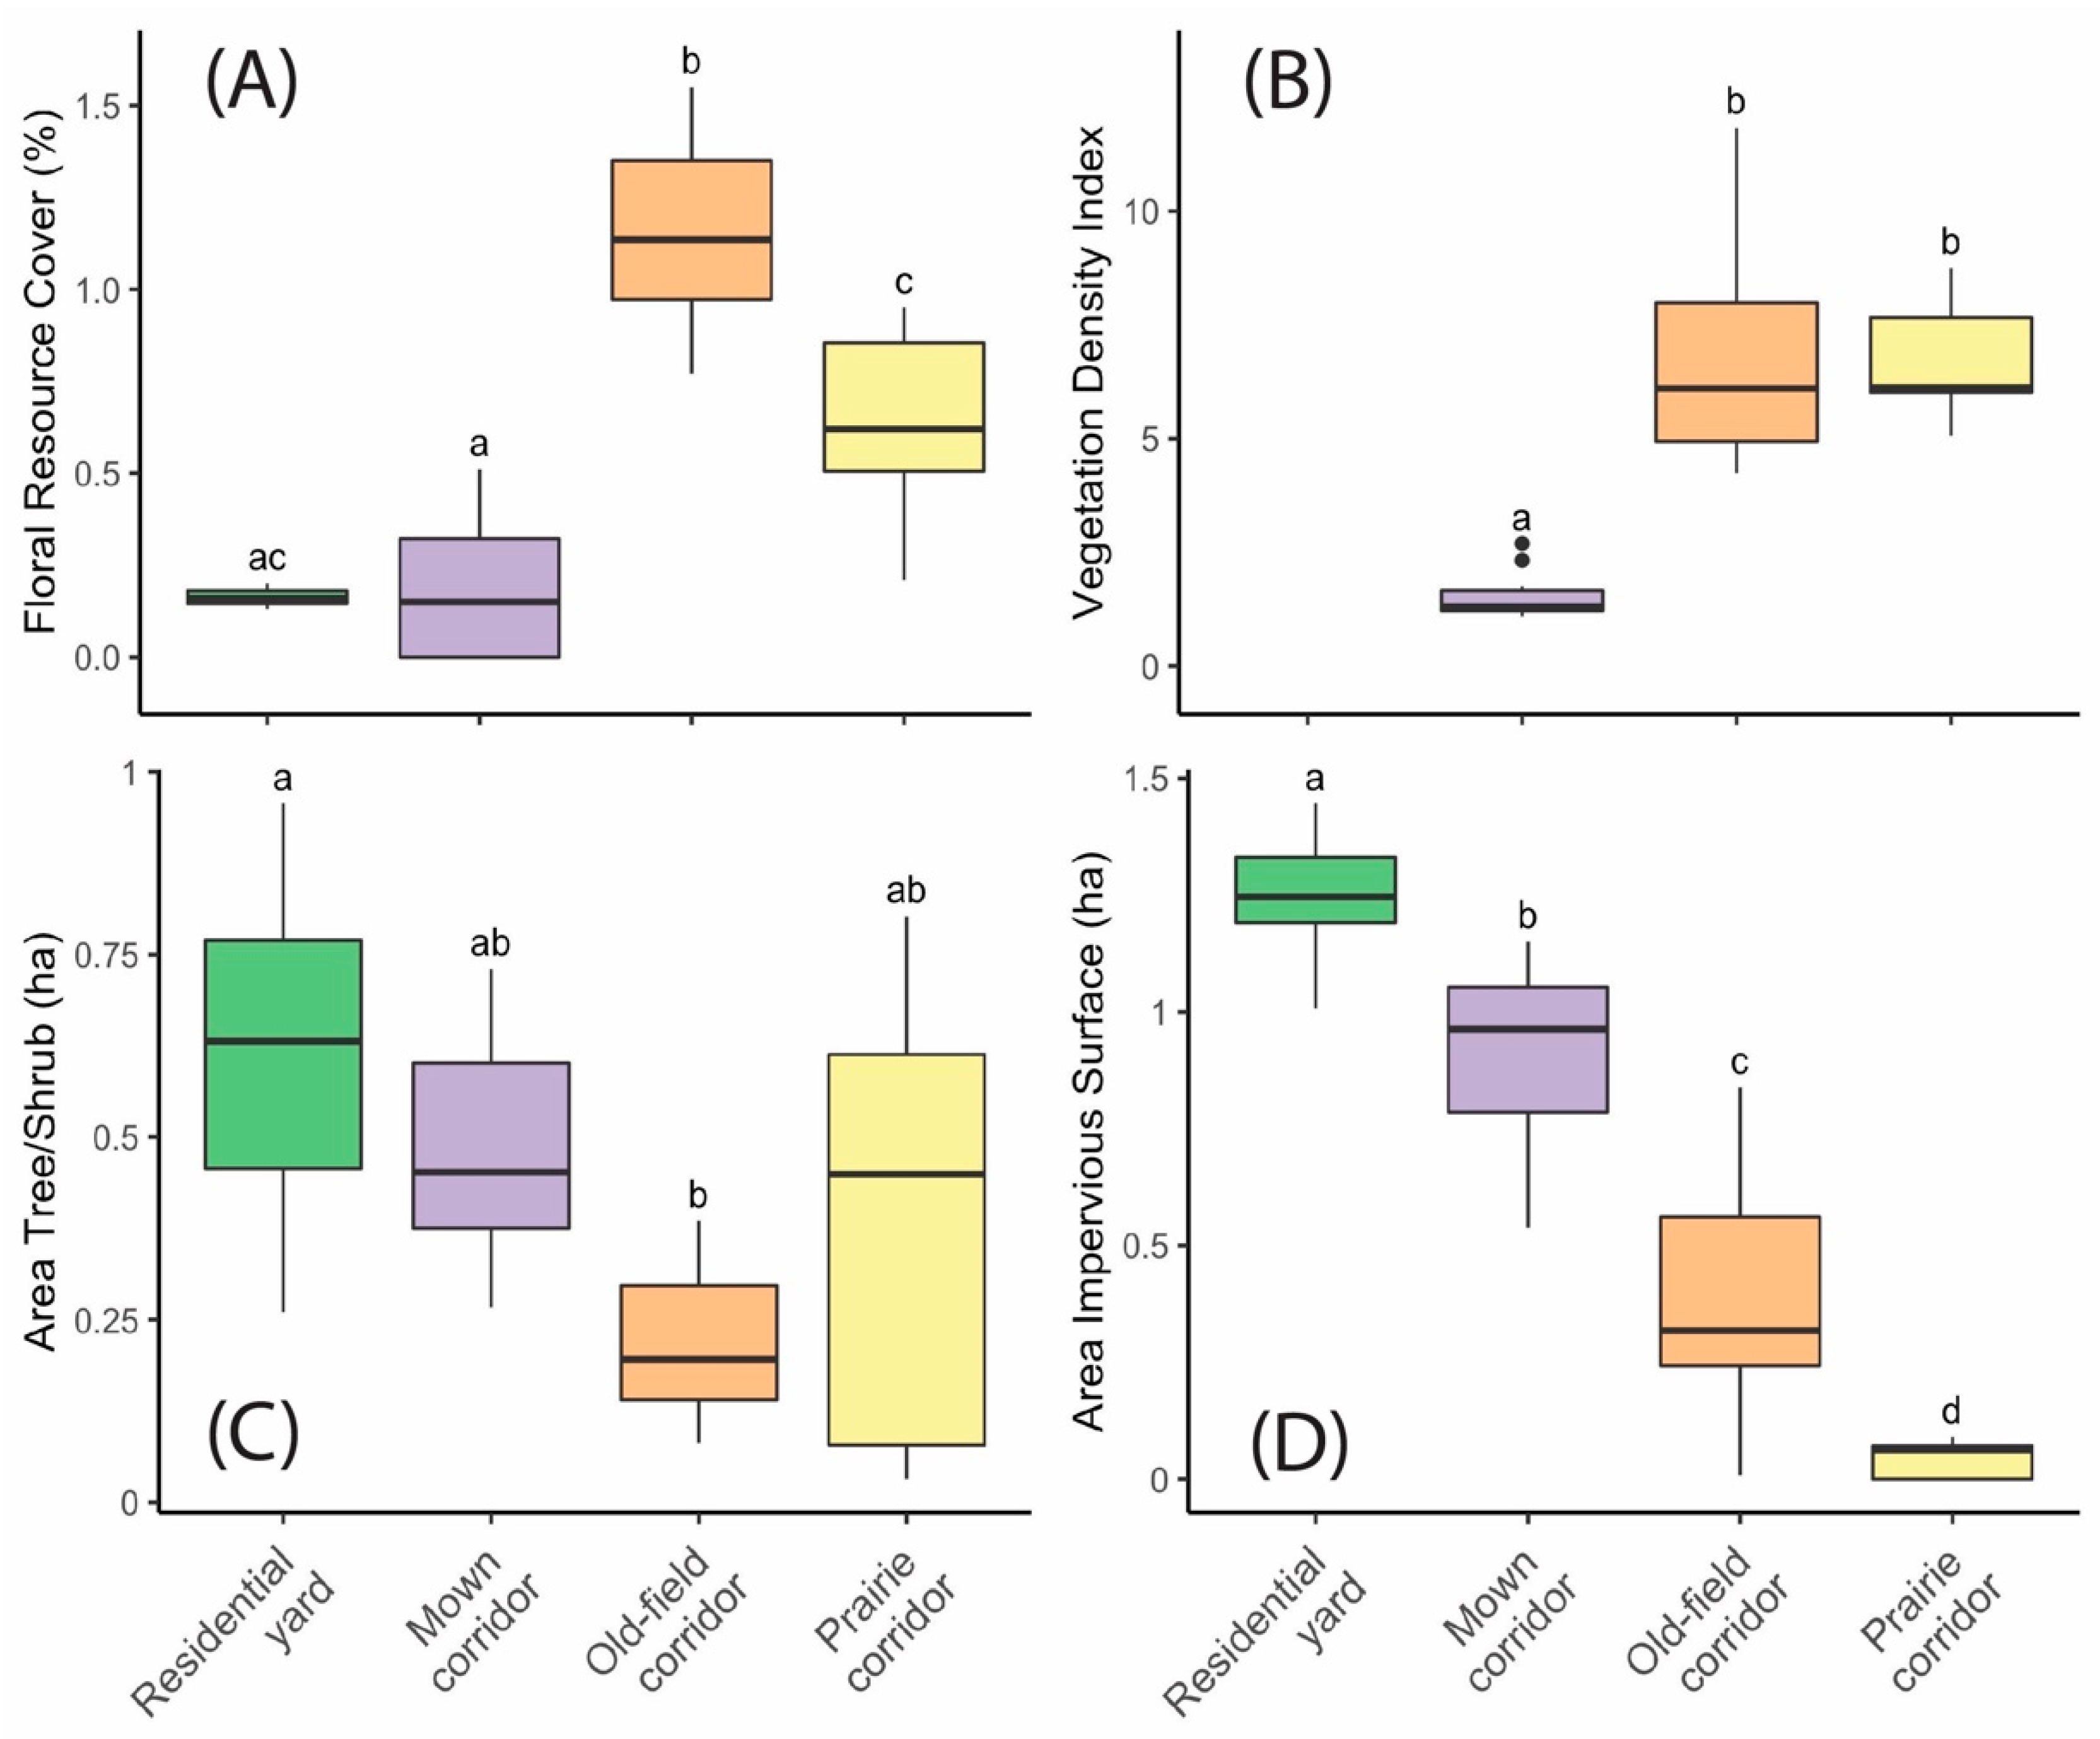
The site types varied significantly (p < 0.05) across all four environmental variables (Figure 2A–D). The old-field corridor sites had the highest floral resource cover, and both prairie and old-field corridor sites had a significantly higher vegetation density index than the mown corridor sites. Residential bird comparison sites tended to have more tree/shrub cover and more impervious surface cover nearby than corridor sites, and residential insect pollinator comparison sites had low levels of floral resource cover.
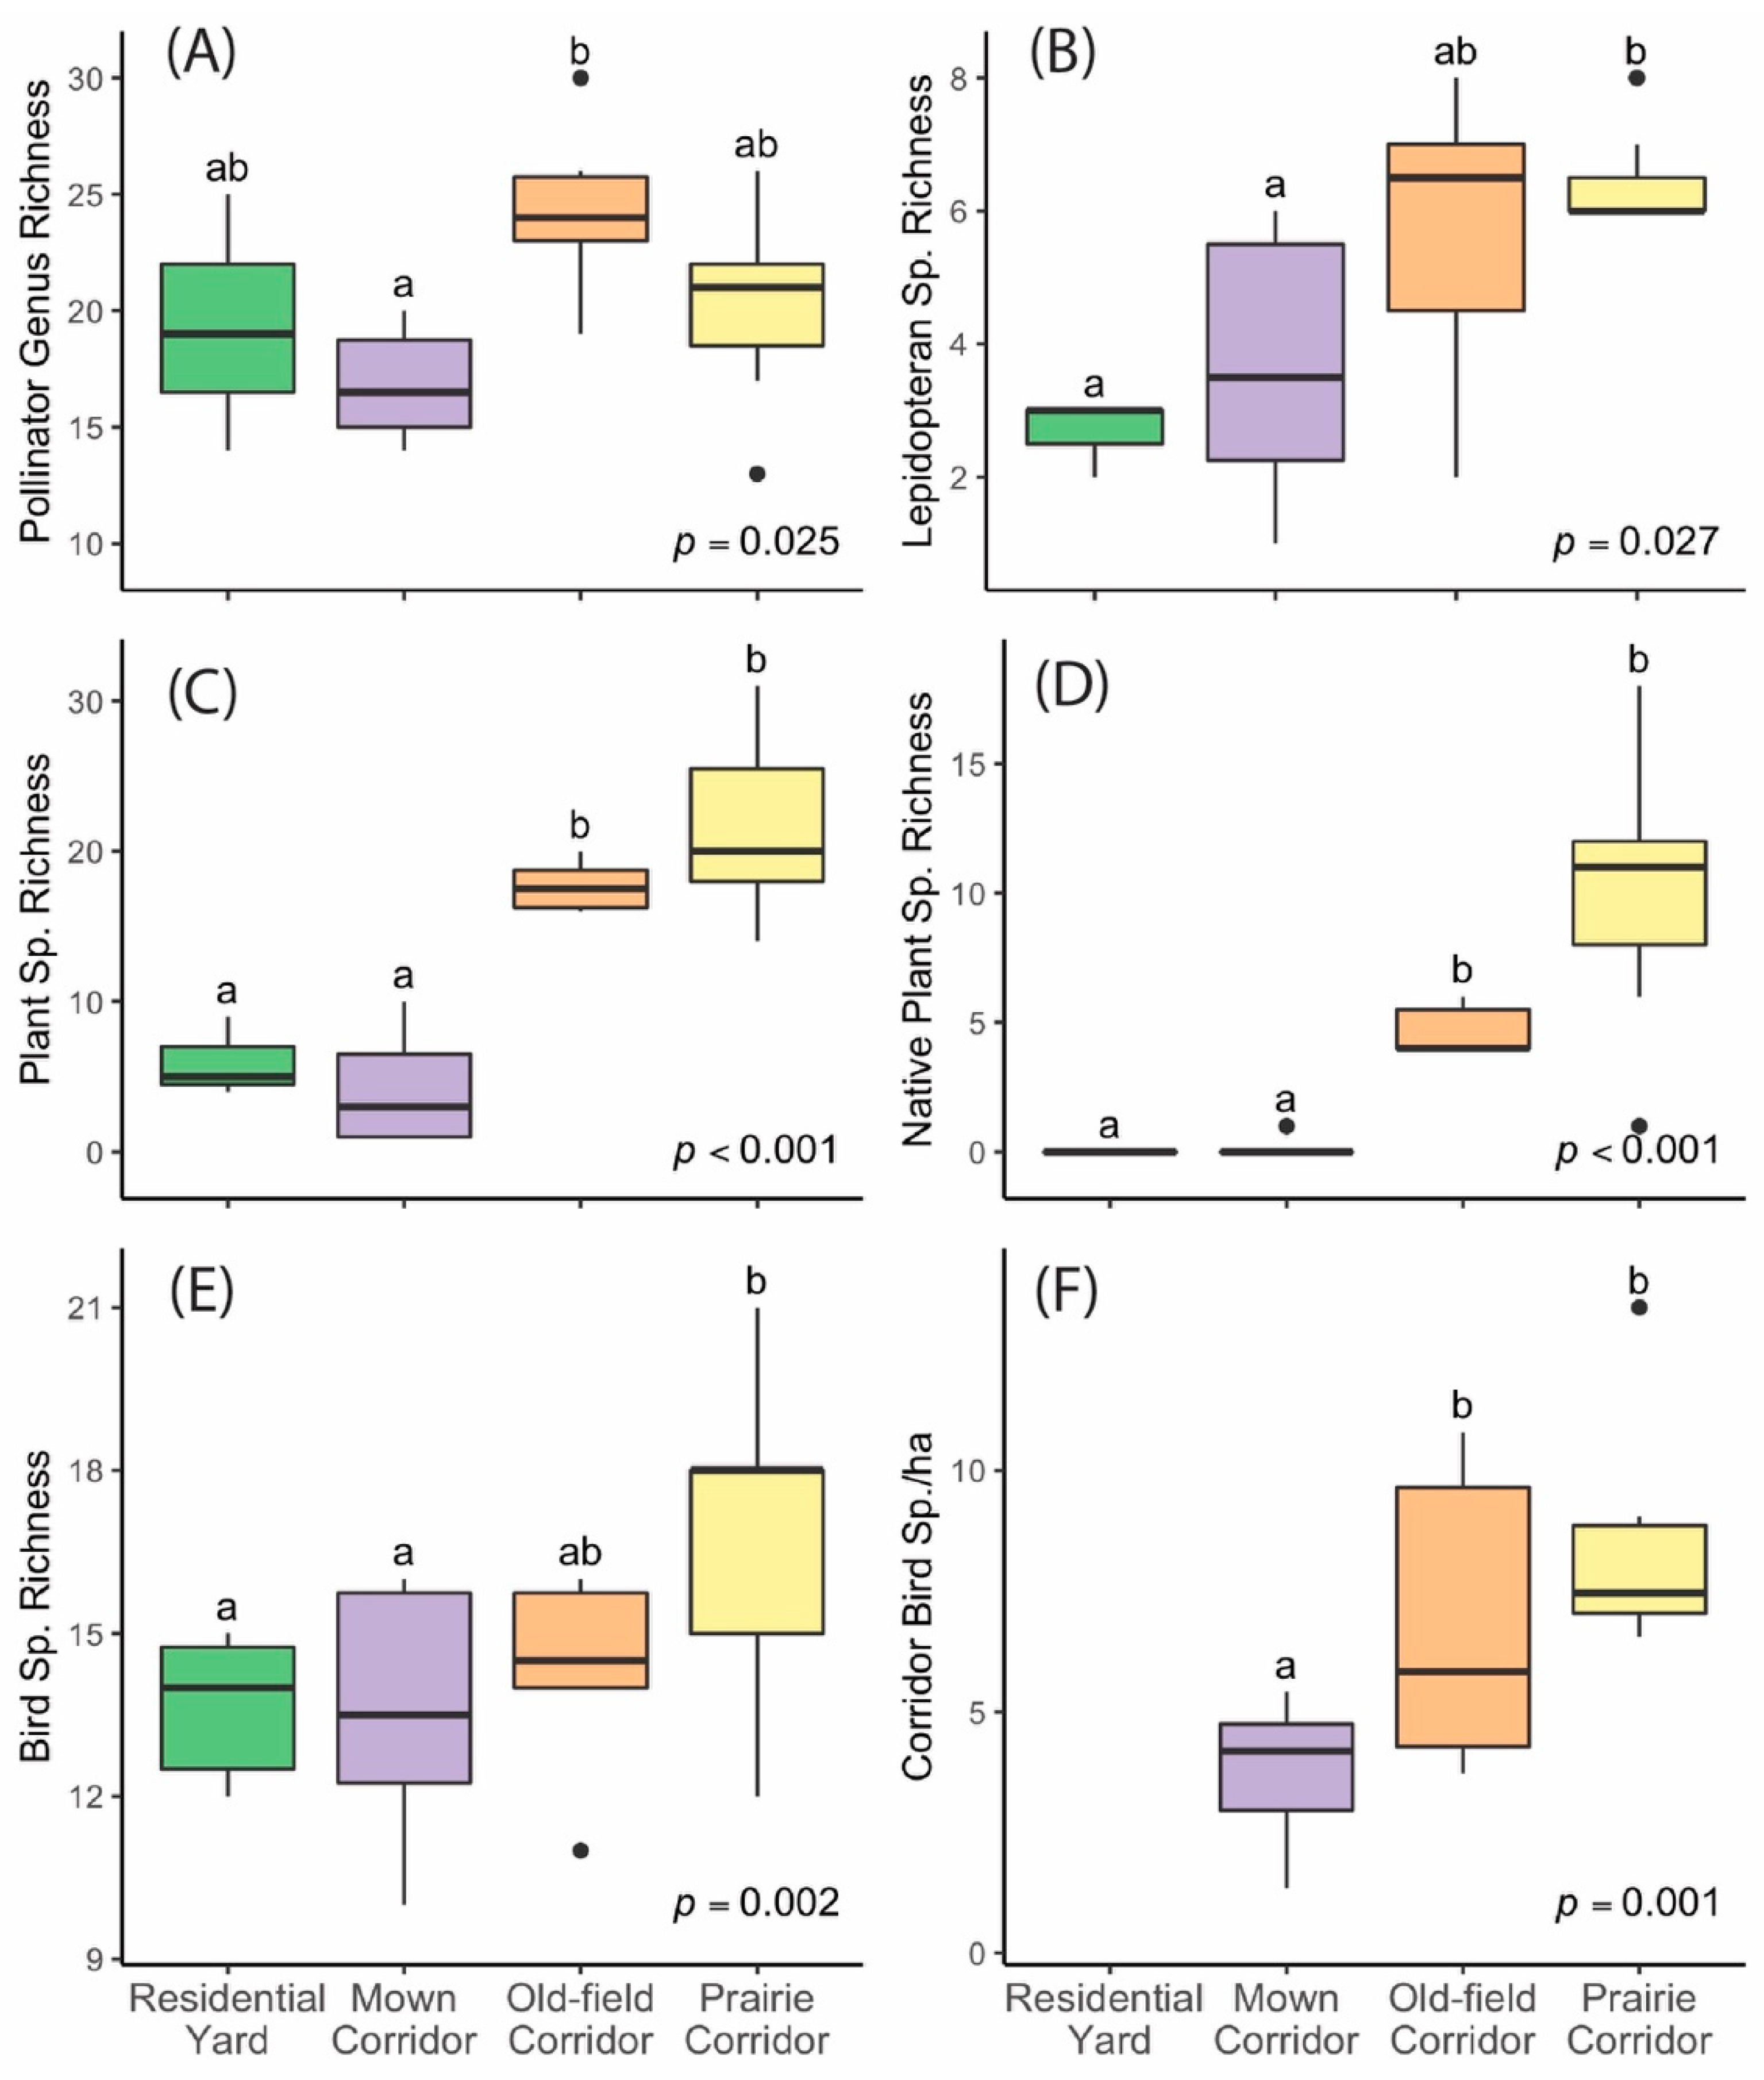
All biodiversity response variables varied significantly contingent on site type (Figure 3). For plants, there was a striking difference between prairie and old-field sites versus the residential and mown corridors, with the former having significantly higher species richness (Figure 3C,D). For birds and insect pollinators, the differences were a little less pronounced, but the richnesses were higher in the prairie and/or old-field corridors than in the mown or residential sites (Figure 3A,B,E,F).
Floral cover was the best predictor variable of both insect pollinator genus richness and lepidopteran species richness (Table 1). In both cases, richness significantly increased with maximum floral cover. Although the site type was included in a model of lepidopteran species richness that was within ΔAICc < 2 of the top model, the 95% confidence intervals for that variable overlapped with zero, and it was, therefore, not a significant predictor. The most parsimonious model of total bird species richness included site type, plant density index, and area of tree/shrub cover as predictor variables. In contrast, the most parsimonious model of corridor bird species richness included only the plant density index as a predictor variable (Table 1). For both bird species richness variables, richness significantly increased with the plant density index.
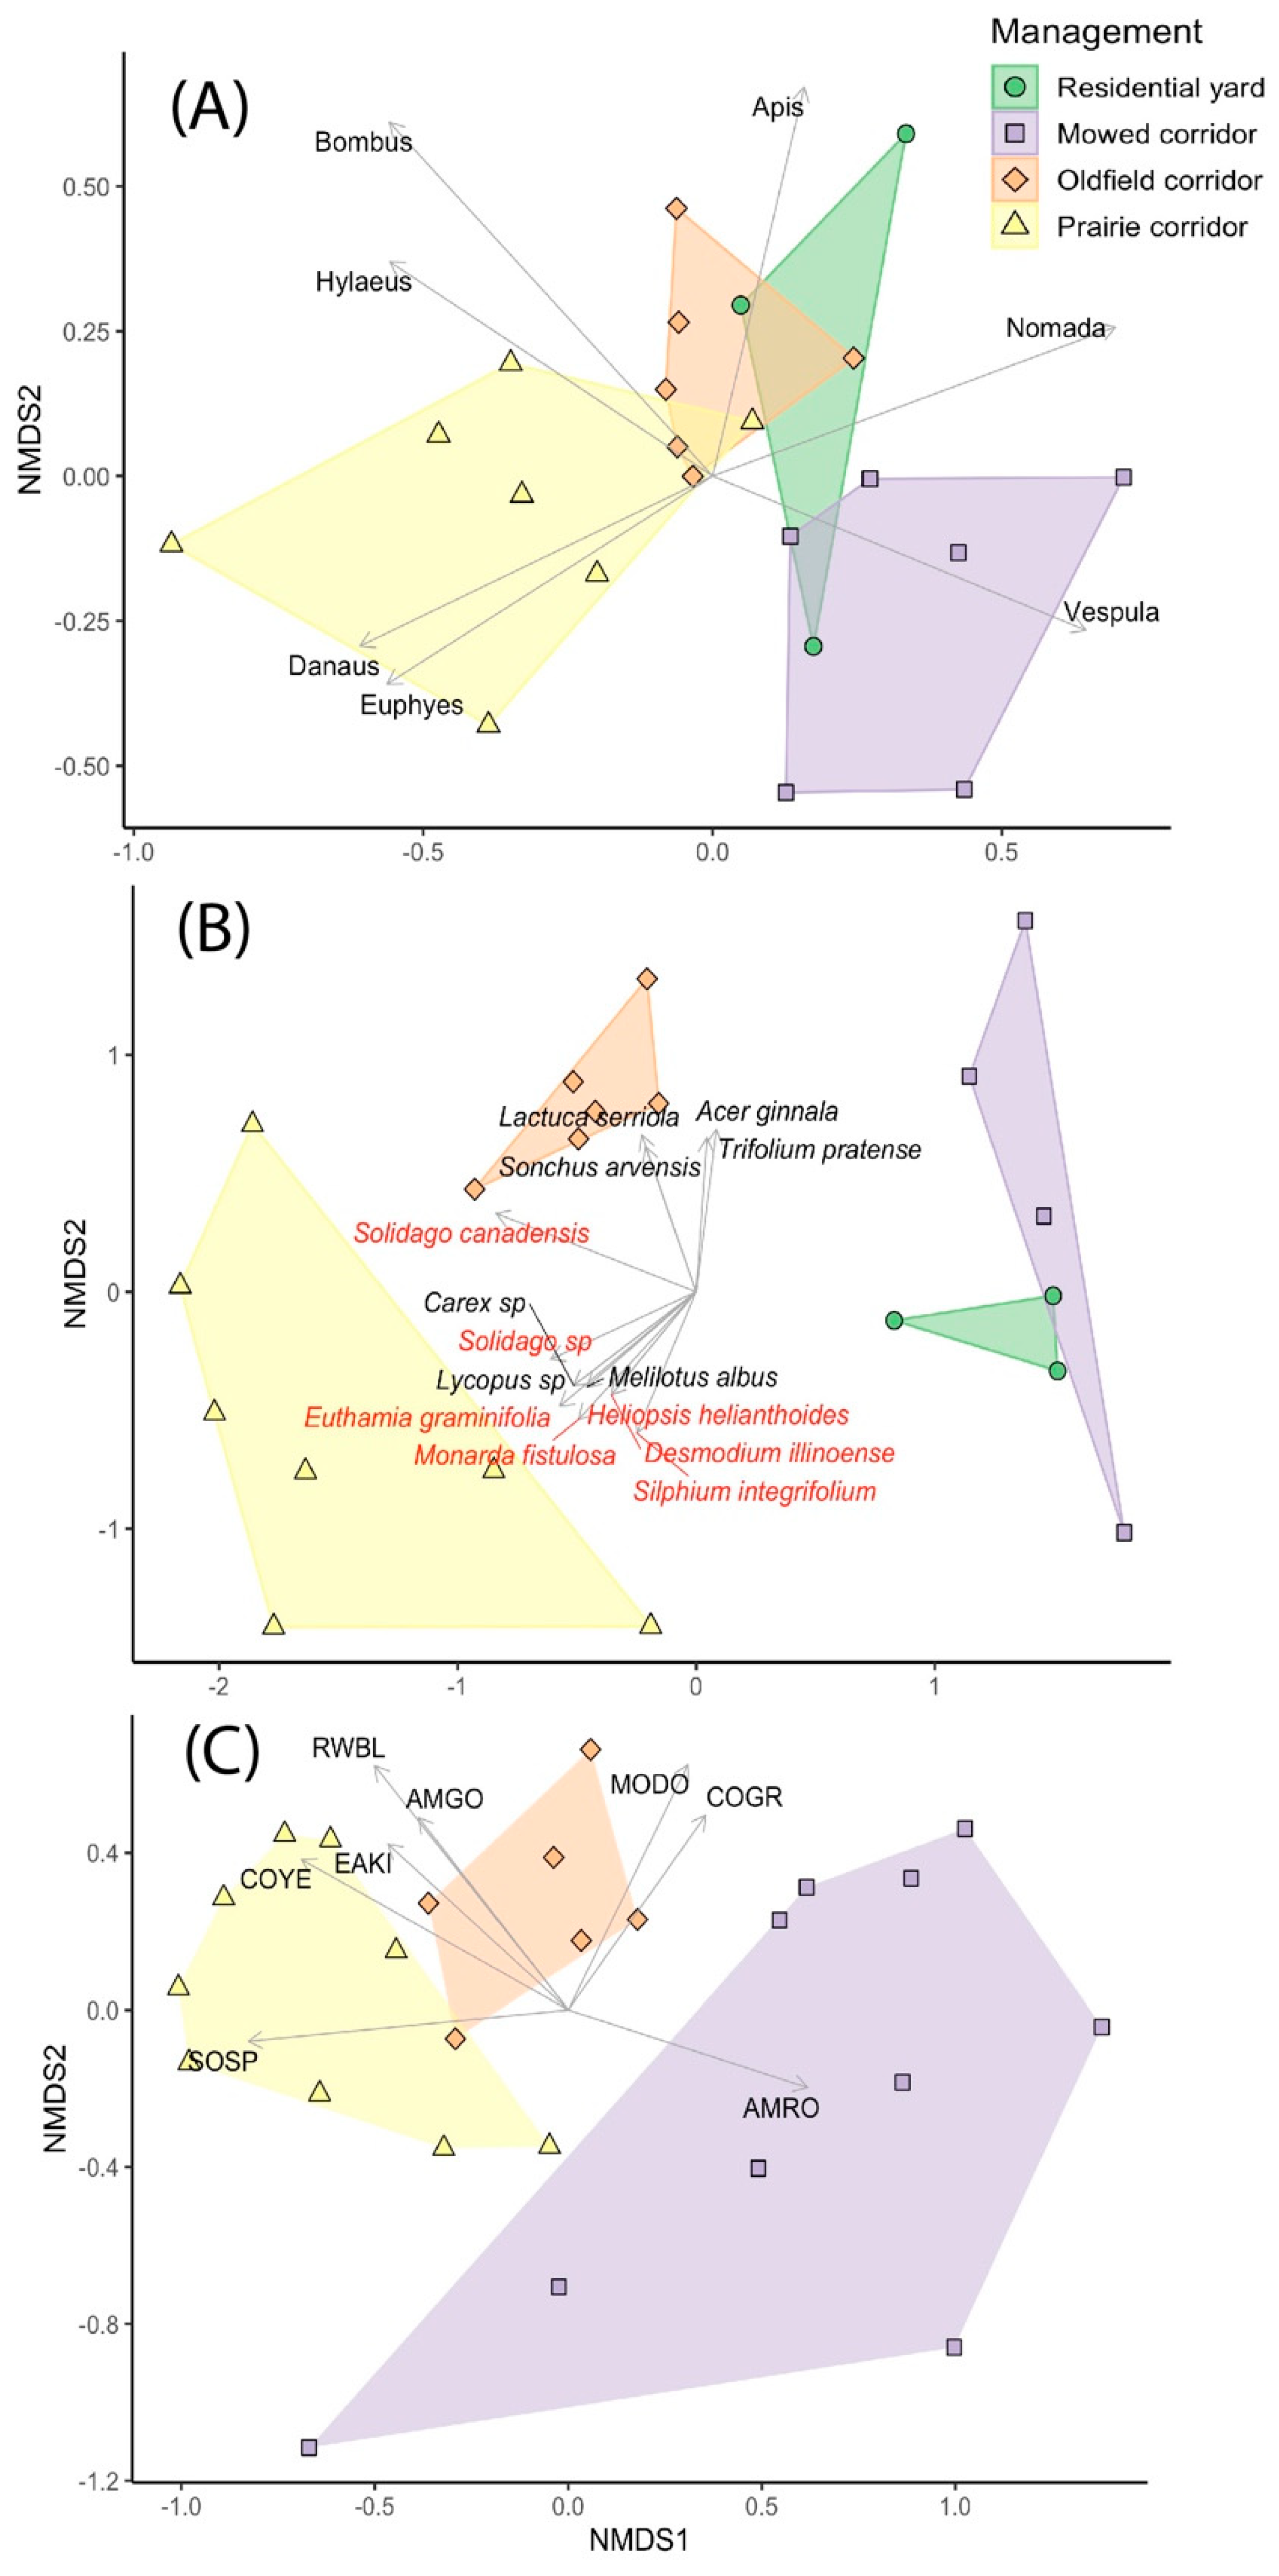
The NMDS plots showed that ecological communities tended to cluster by site type (Figure 4). Insect pollinator communities in prairie and old-field corridor sites were more similar to each other than to those in mown sites, while those in residential comparison sites showed similarities to those in both mown and old-field sites. Mown site communities were dominated by a wasp genus Vespula (ground-dwelling yellowjackets), while prairie sites were associated with Monarch butterflies (Danaus plexippus, the only species we detected in the genus Danaus), a genus of skippers (Euphyes), and bumblebees and yellow-faced bees (Bombus and Hylaeus, Figure 4A). Plant communities in mown sites were similar to those in residential yards, but were clustered separately from those of prairie and old-field sites; old-field site communities were dominated by several non-native plant species, while significant species vectors in the prairie sites were mainly native species (Figure 4B). Finally, within-corridor bird communities in mown sites tended to be dominated by American Robins (Turdus migratorius), and old-field sites were dominated by Mourning Doves (Zenaida macroura) and Common Grackles (Quiscalus quiscula). In contrast, prairie communities were characterized by species such as Song Sparrows (Melospiza melodia), Common Yellowthroats (Geothlypis trichas), and Eastern Kingbirds (Tyrannus tyrannus; Figure 4C), although these species were found in old-field sites as well.
4. Discussion
Our study demonstrates that, given proper vegetation management, powerline corridors can add ecological value to suburban landscapes in the Midwest region of the United States by supporting different and, often, more diverse communities with respect to the surrounding residential matrix. To our knowledge, this is the first modern study to explicitly compare biodiversity within a corridor to that found in the most commonly occurring suburban greenspace, residential yards (however, see [47]). Our results further demonstrate that how vegetation is managed within suburban powerline corridors strongly impacts the biodiversity of insect pollinators, plants, and birds. We found that species or genus richness of birds, insect pollinators, and plants tended to be higher in prairie and/or old-field corridor sites than in mown corridor and/or residential comparison sites (Figure 3). Prairie and old-field corridors, therefore, may be important sources of habitats for multiple taxa within developed landscapes. While prairies are native ecosystems in our study region, prairie-managed corridors are certainly not universally applicable. Therefore, we suggest that future studies should explore powerline corridors that are managed similarly to the dominant native low-structure ecosystems in other regions of the world to determine if our conclusions generally hold.
Several previous studies have similarly demonstrated that powerline corridors, often kept as an early successional habitat type, can support different types of communities from the surrounding landscape for groups such as bees (e.g., [48,49]) and birds (e.g., [26]). These studies differ from ours, however, in that they compared powerline corridors to surrounding natural habitats, such as forest or grassland. In contrast, we compared powerline corridors to surrounding residential suburban yards maintained with lawns and gardens. As in other studies, we found that that non-mowed corridors are a novel (or uncommon) habitat type within these landscapes. It thus makes sense that we found different communities in prairie and old-field corridors from those in residential comparison sites (Figure 4). Mown corridors, on the other hand, had roughly the same species richness as the lawn in residential comparison sites for all three taxa, and indeed, the plant communities and floral resource availability were similar. This suggests that, at least from an ecological standpoint, mown corridors alone do not add significant ecological value to suburban landscapes. However, we note that had we sampled the vegetation in ornamental gardens in the backyards, we may have found an increased level of plant species richness, although likely not in native plant species richness because few native species were planted as ornamentals in our residential study sites.
Surprisingly, we found no significant difference in either total or native plant richness between prairie and old-field sites, although there was a trend toward higher plant richness in prairies (Figure 3C,D). While the prairie corridor sites were managed to increase native plant species, they were not necessarily high-quality prairies, and the number of native plant species we detected per quadrat was much lower than that found in quadrats of the same size in another study of high-quality Illinois prairies [50]. However, our prairie sites supported more plant species of conservation interest than the old-field sites, which were dominated by non-native and often invasive plant species (Figure 4B). This pattern held for insect pollinator communities as well; for example, insect pollinator communities in old-field sites were characterized by non-native Apis bees (European honeybee), while prairie communities were dominated by native lepidopterans, including the Monarch butterfly. Despite the prevalence of some non-native species, the old-field sites did show an increase in biodiversity over that found in mown corridors and residential sites. This may reflect the “unkempt” nature of these old-field corridors [51] and suggests that both prairies and old-field sites provide novel habitats to the residential landscape.
Another unexpected finding was that old-field sites had significantly higher floral resources than prairie sites (Figure 2A). Our old-field study sites tended to be dominated by weedy flowering plants that can produce many inflorescences late in the season, such as Prickly Lettuce (L. serriola, Figure 4B) [52]. While we attempted to capture peak bloom at all of our sites by measuring floral resources in both early and mid/late summer, it is possible that many prairie corridor plants were very early season bloomers; this would mean that due to our study design, we were unable to capture the full floral resource availability at sites throughout the entire season. Alternatively, if prairies begin blooming very early in the spring and continue throughout the entire summer, they may have more temporally consistent floral resources throughout the season, despite having fewer floral resources at any given time. We recommend that future research should measure floral resource availability more frequently throughout the growing season to ensure the capture of potentially transient flowering phenologies.
We found that the species richness of lepidopterans was significantly higher in prairie sites than in mown and residential sites, but the genus richness of bees, wasps, and lepidopterans together differed significantly only between old-field and mown sites. Our linear mixed-effects models indicated that insect pollinator and lepidopteran richness were driven by floral availability, as we had hypothesized based on the well-documented relationship between insect pollinators and floral resources [53]. We had not hypothesized, however, that floral resources would be higher in old-field than in prairie corridors. The differences in patterns that we detected between the entire insect pollinator community and the lepidopteran subset may result from lepidopterans needing host plants to support their larval caterpillar life stage in addition to floral resources for adults [54,55]. For instance, we detected seven species of lepidopterans in prairies that were absent from old-field sites, and several of those require native grasses or forbs as larval hosts. Other pollinators, such as bees, may not have these same requirements. Prairie sites, which are characterized by more native plant species, may, therefore, be better for lepidopterans in particular if they are able to provide both floral resources and larval host plants. Old-field sites, on the other hand, may provide more bare ground and be better suited for providing nesting habitats for ground-nesting bees [56].
We found that the bird species richness within the corridors was significantly lower in mown than in old-field and prairie sites (Figure 3). The insectivorous birds in our study are generalist consumers and, thus, are not dependent on any particular insects or their plant hosts, so the native plant species in prairie corridors may not provide particular benefits. Instead, as hypothesized due to the strong links between birds and vegetation structure [41,57], bird richness was strongly correlated with the vegetation density index within each site (Table 1). The vegetation density at old-field sites tended to be higher than in prairie sites, although not significantly so. This could be related to the time since brush-mowing at our old-field sites; because young trees and shrubs are removed on a five-year cycle, vegetation density should differ within old-field sites based on their position within the management cycle. In contrast, vegetation density in prairie sites may be more consistent across years (although this would depend on prairie management practices). Unfortunately, we did not have enough old-field sites at different stages within the management cycle to test this. Because of the strong relationship between bird richness and vegetation density, we might expect that bird richness across years may fluctuate more in old-field corridors while remaining more consistent in prairie corridors. We recommend that future research should consider the effect of temporal variation in this system in response to cyclical management practices.
One important limitation of our study was that we were unable to examine the effect of the larger landscape context on the biodiversity within our sites. Several studies have shown that landscape context may be an important factor in determining communities of plants, birds, and pollinators (e.g., [13,17,44]). Unfortunately, in our study system, most prairie-managed corridors were located within forest preserves or, otherwise, surrounded by natural habitats. Similarly, most mown and old-field corridors were found in developed areas. This is due to the fact that stakeholders with property near a powerline corridor often have some say in how the corridor is managed. Because of these land-use patterns, we are unable to say how biodiversity levels might differ if the prairie sites were embedded in a residential matrix like the other corridor types. It is possible that prairie sites had high species richness only because they were surrounded by natural habitats. However, the fact that the variables describing surrounding tree cover and impervious surface cover were important only in the model of total bird (but not corridor bird) richness suggests that landscape context (at least at the scale we examined) is not the most important predictor of bird species richness in this system. Nonetheless, we hypothesize that even if prairie sites within a residential matrix are less diverse than those embedded in natural areas, they would still be more diverse than mown sites due to the increased vegetation density and floral resource availability found in prairie sites. We also recommend that future studies be conducted in areas where prairie-managed corridors are located outside of forest preserves in order to fully elucidate the effects of landscape context on corridor biodiversity.
Our study shows that, given appropriate vegetation management, powerline corridors can enhance biodiversity in suburban landscapes by providing novel habitat types that support many species that are not found in surrounding residential areas. Because powerline corridors encompass such a large land area both across the United States and globally, this represents a major opportunity for increasing biodiversity in developed landscapes. We recommend that, whenever possible, suburban powerline corridors should not be maintained as lawns. Both old-field and prairie corridors can support much higher levels of biodiversity, though prairie sites supported a greater variety of native species of conservation interest. We thus suggest that managers in the Midwest region of the United States looking specifically to support native and/or grassland specialist species should manage sites in transmission line corridors as prairies whenever possible.
Supplementary Materials
The following supporting information can be downloaded at: https://www.mdpi.com/article/10.3390/su14127113/s1, Table S1: AICc ranking of a priori model sets describing four biodiversity response variables; Table S2: Bird species detected across all study sites; Table S3: Plant species detected across all study sites; Table S4: Insect pollinator genera detected across all study sites.
Author Contributions
Conceptualization, M.G., S.H., C.W. and E.M.; methodology, M.G., S.H., C.W. and E.M.; formal analysis, M.G.; investigation, M.G. and S.H.; writing—original draft preparation, M.G.; writing—review and editing, M.G., C.W. and E.M.; visualization, M.G.; funding acquisition, C.W. and E.M. All authors have read and agreed to the published version of the manuscript.
Funding
This research and the APC were funded by a grant from the Commonwealth Edison company.
Institutional Review Board Statement
The study was conducted with the approval of University of Illinois at Chicago’s Institutional Animal Care and Use Committee (ACC protocol 20-104, 16 June 2020).
Informed Consent Statement
Not applicable.
Data Availability Statement
The data presented in this study are openly available in FigShare at https://doi.org/10.6084/m9.figshare.19674645.v1.
Acknowledgments
We thank Kaylin Morris for her help in digitizing the land cover surrounding our study sites. We also thank the generous homeowners who allowed us to conduct research in their backyards. Finally, we thank Amy Flansburg and Aaron Feggestad of Stantec and Sara Race of ComEd for providing information on the extent and the past management of the powerline corridors in our study system.
Conflicts of Interest
This research was funded by a grant from the Commonwealth Edison company to study the ecology of electric transmission powerline corridors. The funders allowed the authors research access to powerline corridors that they operate, but had no role in the study design, data collection or analysis, or in the writing of this paper.
References
- Beninde, J.; Veith, M.; Hochkirch, A. Biodiversity in Cities Needs Space: A Meta-Analysis of Factors Determining Intra-Urban Biodiversity Variation. Ecol. Lett. 2015, 18, 581–592. [Google Scholar] [CrossRef] [PubMed]
- Gardiner, M.M.; Burkman, C.E.; Prajzner, S.P. The Value of Urban Vacant Land to Support Arthropod Biodiversity and Ecosystem Services. Environ. Entomol. 2013, 42, 1123–1136. [Google Scholar] [CrossRef]
- Bonthoux, S.; Brun, M.; Di Pietro, F.; Greulich, S.; Bouché-Pillon, S. How Can Wastelands Promote Biodiversity in Cities? A Review. Landsc. Urban Plan. 2014, 132, 79–88. [Google Scholar] [CrossRef]
- Rupprecht, C.D.D.; Byrne, J.A.; Garden, J.G.; Hero, J.-M. Informal Urban Green Space: A Trilingual Systematic Review of Its Role for Biodiversity and Trends in the Literature. Urban For. Urban Green. 2015, 14, 883–908. [Google Scholar] [CrossRef] [Green Version]
- Senapathi, D.; Goddard, M.A.; Kunin, W.E.; Baldock, K.C.R. Landscape Impacts on Pollinator Communities in Temperate Systems: Evidence and Knowledge Gaps. Funct. Ecol. 2017, 31, 26–37. [Google Scholar] [CrossRef] [Green Version]
- U.S. Department of Energy. Transforming U.S. Energy Infrastructures in a Time of Rapid Change: The First Installment of the Quadrennial Energy Review; U.S. Department of Energy: Washington, DC, USA, 2015.
- Russell, K.N.; Ikerd, H.; Droege, S. The Potential Conservation Value of Unmowed Powerline Strips for Native Bees. Biol. Conserv. 2005, 124, 133–148. [Google Scholar] [CrossRef]
- Ituen, I.; Sohn, G.; Jenkins, A. A case study: Workflow analysis of powerline systems for risk management. Int. Arch. Photogramm. Remote Sens. Spat. Inf. Sci. 2008, 37, 331–336. [Google Scholar]
- Appelt, P.J.; Beard, A. Components of an Effective Vegetation Management Program (2006 IEEE Rural Electric Power Conference). In Proceedings of the 2006 IEEE Rural Electric Power Conference, Albuquerque, NM, USA, 9–11 April 2006; pp. 1–8. [Google Scholar]
- Vosloo, H.F.; Shunmagum, E.; Bruce, G. Transmission Vegetation Management Guideline; 2006; Available online: https://www.eskom.co.za/OurCompany/SustainableDevelopment/EnvironmentalImpactAssessments/Documents/6_ESKOM_Transmission_Vegetation_Management_Guideline.pdf (accessed on 17 December 2021).
- Nationwide Candidate Conservation Agreement for Monarch Butterfly on Energy and Transportation Lands 2020. Cardno, Inc. Available online: http://rightofway.erc.uic.edu/wp-content/uploads/Final_CCAA_040720_Fully-Executed.pdf (accessed on 1 June 2022).
- Russo, L.; Stout, H.; Roberts, D.; Ross, B.D.; Mahan, C.G. Powerline Right-of-Way Management and Flower-Visiting Insects: How Vegetation Management Can Promote Pollinator Diversity. PLoS ONE 2021, 16, e0245146. [Google Scholar] [CrossRef] [PubMed]
- Askins, R.A.; Folsom-O’Keefe, C.M.; Hardy, M.C. Effects of Vegetation, Corridor Width and Regional Land Use on Early Successional Birds on Powerline Corridors. PLoS ONE 2012, 7, e31520. [Google Scholar] [CrossRef] [PubMed]
- Marshall, J.S.; Vandruff, L.W. Impact of Selective Herbicide Right-of-Way Vegetation Treatment on Birds. Environ. Manag. 2002, 30, 801–806. [Google Scholar] [CrossRef] [PubMed]
- Russell, K.N.; Russell, G.J.; Kaplan, K.L.; Mian, S.; Kornbluth, S. Increasing the Conservation Value of Powerline Corridors for Wild Bees through Vegetation Management: An Experimental Approach. Biodivers. Conserv. 2018, 27, 2541–2565. [Google Scholar] [CrossRef] [Green Version]
- Çoban, S.; Balekoğlu, S.; Özalp, G. Change in Plant Species Composition on Powerline Corridor: A Case Study. Environ. Monit. Assess. 2019, 191, 200. [Google Scholar] [CrossRef]
- Leston, L.F.V.; Koper, N. Managing Urban and Rural Rights-of-Way as Potential Habitats for Grassland Birds. Avian Conserv. Ecol. 2017, 12, art4. [Google Scholar] [CrossRef] [Green Version]
- Berg, Å.; Bergman, K.-O.; Wissman, J.; Żmihorski, M.; Öckinger, E. Power-Line Corridors as Source Habitat for Butterflies in Forest Landscapes. Biol. Conserv. 2016, 201, 320–326. [Google Scholar] [CrossRef]
- Leston, L.; Koper, N. Urban Rights-of-Way as Reservoirs for Tall-Grass Prairie Plants and Butterflies. Environ. Manag. 2016, 57, 543–557. [Google Scholar] [CrossRef]
- Dániel-Ferreira, J.; Bommarco, R.; Wissman, J.; Öckinger, E. Linear Infrastructure Habitats Increase Landscape-Scale Diversity of Plants but Not of Flower-Visiting Insects. Sci. Rep. 2020, 10, 21374. [Google Scholar] [CrossRef] [PubMed]
- Loram, A.; Tratalos, J.; Warren, P.H.; Gaston, K.J. Urban Domestic Gardens (X): The Extent & Structure of the Resource in Five Major Cities. Landsc. Ecol. 2007, 22, 601–615. [Google Scholar] [CrossRef]
- Lin, B.B.; Philpott, S.M.; Jha, S. The Future of Urban Agriculture and Biodiversity-Ecosystem Services: Challenges and next Steps. Basic Appl. Ecol. 2015, 16, 189–201. [Google Scholar] [CrossRef]
- Anderson, S.H.; Mann, K.; Shugart, H.H. The Effect of Transmission-Line Corridors on Bird Populations. Am. Midl. Nat. 1977, 97, 216. [Google Scholar] [CrossRef]
- Chasko, G.G.; Gates, E.J. Avian Habitat Suitability along a Transmission-Line Corridor in an Oak-Hickory Forest Region. Wildl. Monogr. 1982, 82, 40. [Google Scholar]
- Clarke, D.J.; Pearce, K.A.; White, J.G. Powerline Corridors: Degraded Ecosystems or Wildlife Havens? Wildl. Res. 2006, 33, 615. [Google Scholar] [CrossRef]
- Hrouda, J.; Brlík, V. Birds in Power-Line Corridors: Effects of Vegetation Mowing on Avian Diversity and Abundance. J. Vertebr. Biol. 2021, 70, 21027-1-7. [Google Scholar] [CrossRef]
- Wagner, D.L.; Ascher, J.S.; Bricker, N.K. A Transmission Right-of-Way as Habitat for Wild Bees (Hymenoptera: Apoidea: Anthophila) in Connecticut. Ann. Entomol. Soc. Am. 2014, 107, 1110–1120. [Google Scholar] [CrossRef]
- Blumenberg, E.; Brown, A.; Ralph, K.; Taylor, B.D.; Turley Voulgaris, C. A Resurgence in Urban Living? Trends in Residential Location Patterns of Young and Older Adults since 2000. Urban Geogr. 2019, 40, 1375–1397. [Google Scholar] [CrossRef]
- USDA National Agricultural Statistics Service. Available online: http://www.nass.usda.gov/ (accessed on 3 November 2021).
- Orme, A.R. (Ed.) The Physical Geography of North America; Oxford Regional Environments; Oxford University Press: Oxford, UK; New York, NY, USA, 2002; ISBN 978-0-19-511107-1. [Google Scholar]
- Wang, Y.; Moskovits, D.K. Tracking Fragmentation of Natural Communities and Changes in Land Cover: Applications of Landsat Data for Conservation in an Urban Landscape (Chicago Wilderness). Conserv. Biol. 2001, 15, 835–843. [Google Scholar] [CrossRef]
- Ralph, C.J.; Droege, S.; Sauer, J.R. Managing and Monitoring Birds Using Point Counts: Standards and Applications; Monitoring Bird Populations By Point Counts; U.S. Department of Agriculture, Forest Service, Pacific Southwest Research Station: Albany, CA, USA, 1995; pp. 161–168.
- Pollard, E. A Method for Assessing Changes in the Abundance of Butterflies. Biol. Conserv. 1977, 12, 115–134. [Google Scholar] [CrossRef]
- Arduser, M. Bees of the Tallgrass Prairie Region and Greater Midwest. Available online: https://conservationresearchinstitute.org/files/keys/ (accessed on 21 January 2022).
- Brock, J.P.; Kaufman, K.; Brock, J.P. Kaufman Field Guide to Butterflies of North America; Houghton Mifflin: New York, NY, USA, 2003; ISBN 978-0-618-76826-4. [Google Scholar]
- Milne, L.; Milne, M. National Audubon Society Field Guide to Insects and Spiders; Knopf: New York, NY, USA, 1980. [Google Scholar]
- BugGuide.Net: Identification, Images, & Information For Insects, Spiders & Their Kin For the United States & Canada. Available online: https://bugguide.net/ (accessed on 10 January 2021).
- USDA NRCS The PLANTS Database. Available online: http://plants.usda.gov (accessed on 22 December 2021).
- Robel, R.J.; Briggs, J.N.; Dayton, A.D.; Hulbert, L.C. Relationships between Visual Obstruction Measurements and Weight of Grassland Vegetation. J. Range Manag. 1970, 23, 295. [Google Scholar] [CrossRef] [Green Version]
- Jackson, R.D.; Paine, L.K. Revisiting Robel’s Visual Obstruction Method for Estimation of Standing Crop in Grasslands. Forage Grazinglands 2006, 4, 1–9. [Google Scholar] [CrossRef]
- Fisher, R.J.; Davis, S.K. From Wiens to Robel: A Review of Grassland-Bird Habitat Selection. J. Wildl. Manag. 2010, 74, 265–273. [Google Scholar] [CrossRef]
- USDA National Agriculture Imagery Program (NAIP). Available online: https://datagateway.nrcs.usda.gov/GDGHome_DirectDownLoad.aspx (accessed on 6 November 2019).
- Royston, J.P. An Extension of Shapiro and Wilk’s W Test for Normality to Large Samples. Appl. Stat. 1982, 31, 115. [Google Scholar] [CrossRef]
- Lampinen, J.; Heikkinen, R.K.; Manninen, P.; Ryttäri, T.; Kuussaari, M. Importance of Local Habitat Conditions and Past and Present Habitat Connectivity for the Species Richness of Grassland Plants and Butterflies in Power Line Clearings. Biodivers. Conserv. 2018, 27, 217–233. [Google Scholar] [CrossRef]
- R Core Team. R: A Language and Environment for Statistical Computing; R Foundation for Statistical Computing: Vienna, Austria, 2019. [Google Scholar]
- Benjamini, Y.; Hochberg, Y. Controlling the False Discovery Rate: A Practical and Powerful Approach to Multiple Testing. J. R. Stat. Soc. Ser. B Methodol. 1995, 57, 289–300. [Google Scholar] [CrossRef]
- Oksanen, J.; Blanchet, F.G.; Friendly, M.; Kindt, R.; Legendre, P.; McGlinn, D.; Minchin, P.R.; O’Hara, R.B.; Simpson, G.L.; Solymos, P.; et al. Vegan: Community Ecology Package, R package version 2.5-6; 2019; Available online: https://CRAN.R-project.org/package=vegan (accessed on 9 April 2020).
- Geibert, E.H. Songbird Diversity along an Urban Powerline Right-of-Way in Rhode Island. Environ. Manag. 1980, 4, 205–213. [Google Scholar] [CrossRef]
- Wagner, D.L.; Metzler, K.J.; Frye, H. Importance of Transmission Line Corridors for Conservation of Native Bees and Other Wildlife. Biol. Conserv. 2019, 235, 147–156. [Google Scholar] [CrossRef]
- Bowles, M.; Jones, M. Testing the Efficacy of Species Richness and Floristic Quality Assessment of Quality, Temporal Change, and Fire Effects in Tallgrass Prairie Natural Areas. Nat. Areas J. 2006, 26, 17–30. [Google Scholar] [CrossRef]
- Kwok, R. News Feature: Accidental Urban Oases. Proc. Natl. Acad. Sci. USA 2018, 115, 4800–4804. [Google Scholar] [CrossRef] [Green Version]
- Weaver, S.E.; Downs, M.P. The Biology of Canadian Weeds. 122. Lactuca Serriola L. Can. J. Plant Sci. 2003, 83, 619–628. [Google Scholar] [CrossRef] [Green Version]
- Ayers, A.C.; Rehan, S.M. Supporting Bees in Cities: How Bees Are Influenced by Local and Landscape Features. Insects 2021, 12, 128. [Google Scholar] [CrossRef]
- Burghardt, K.T.; Tallamy, D.W.; Gregory Shriver, W. Impact of Native Plants on Bird and Butterfly Biodiversity in Suburban Landscapes. Conserv. Biol. 2009, 23, 219–224. [Google Scholar] [CrossRef]
- Tallamy, D.W.; Narango, D.L.; Mitchell, A.B. Do Non-native Plants Contribute to Insect Declines? Ecol. Entomol. 2021, 46, 729–742. [Google Scholar] [CrossRef]
- Antoine, C.M.; Forrest, J.R.K. Nesting Habitat of Ground-nesting Bees: A Review. Ecol. Entomol. 2021, 46, 143–159. [Google Scholar] [CrossRef]
- Willson, M.F. Avian Community Organization and Habitat Structure. Ecology 1974, 55, 1017–1029. [Google Scholar] [CrossRef]
Figure 1.
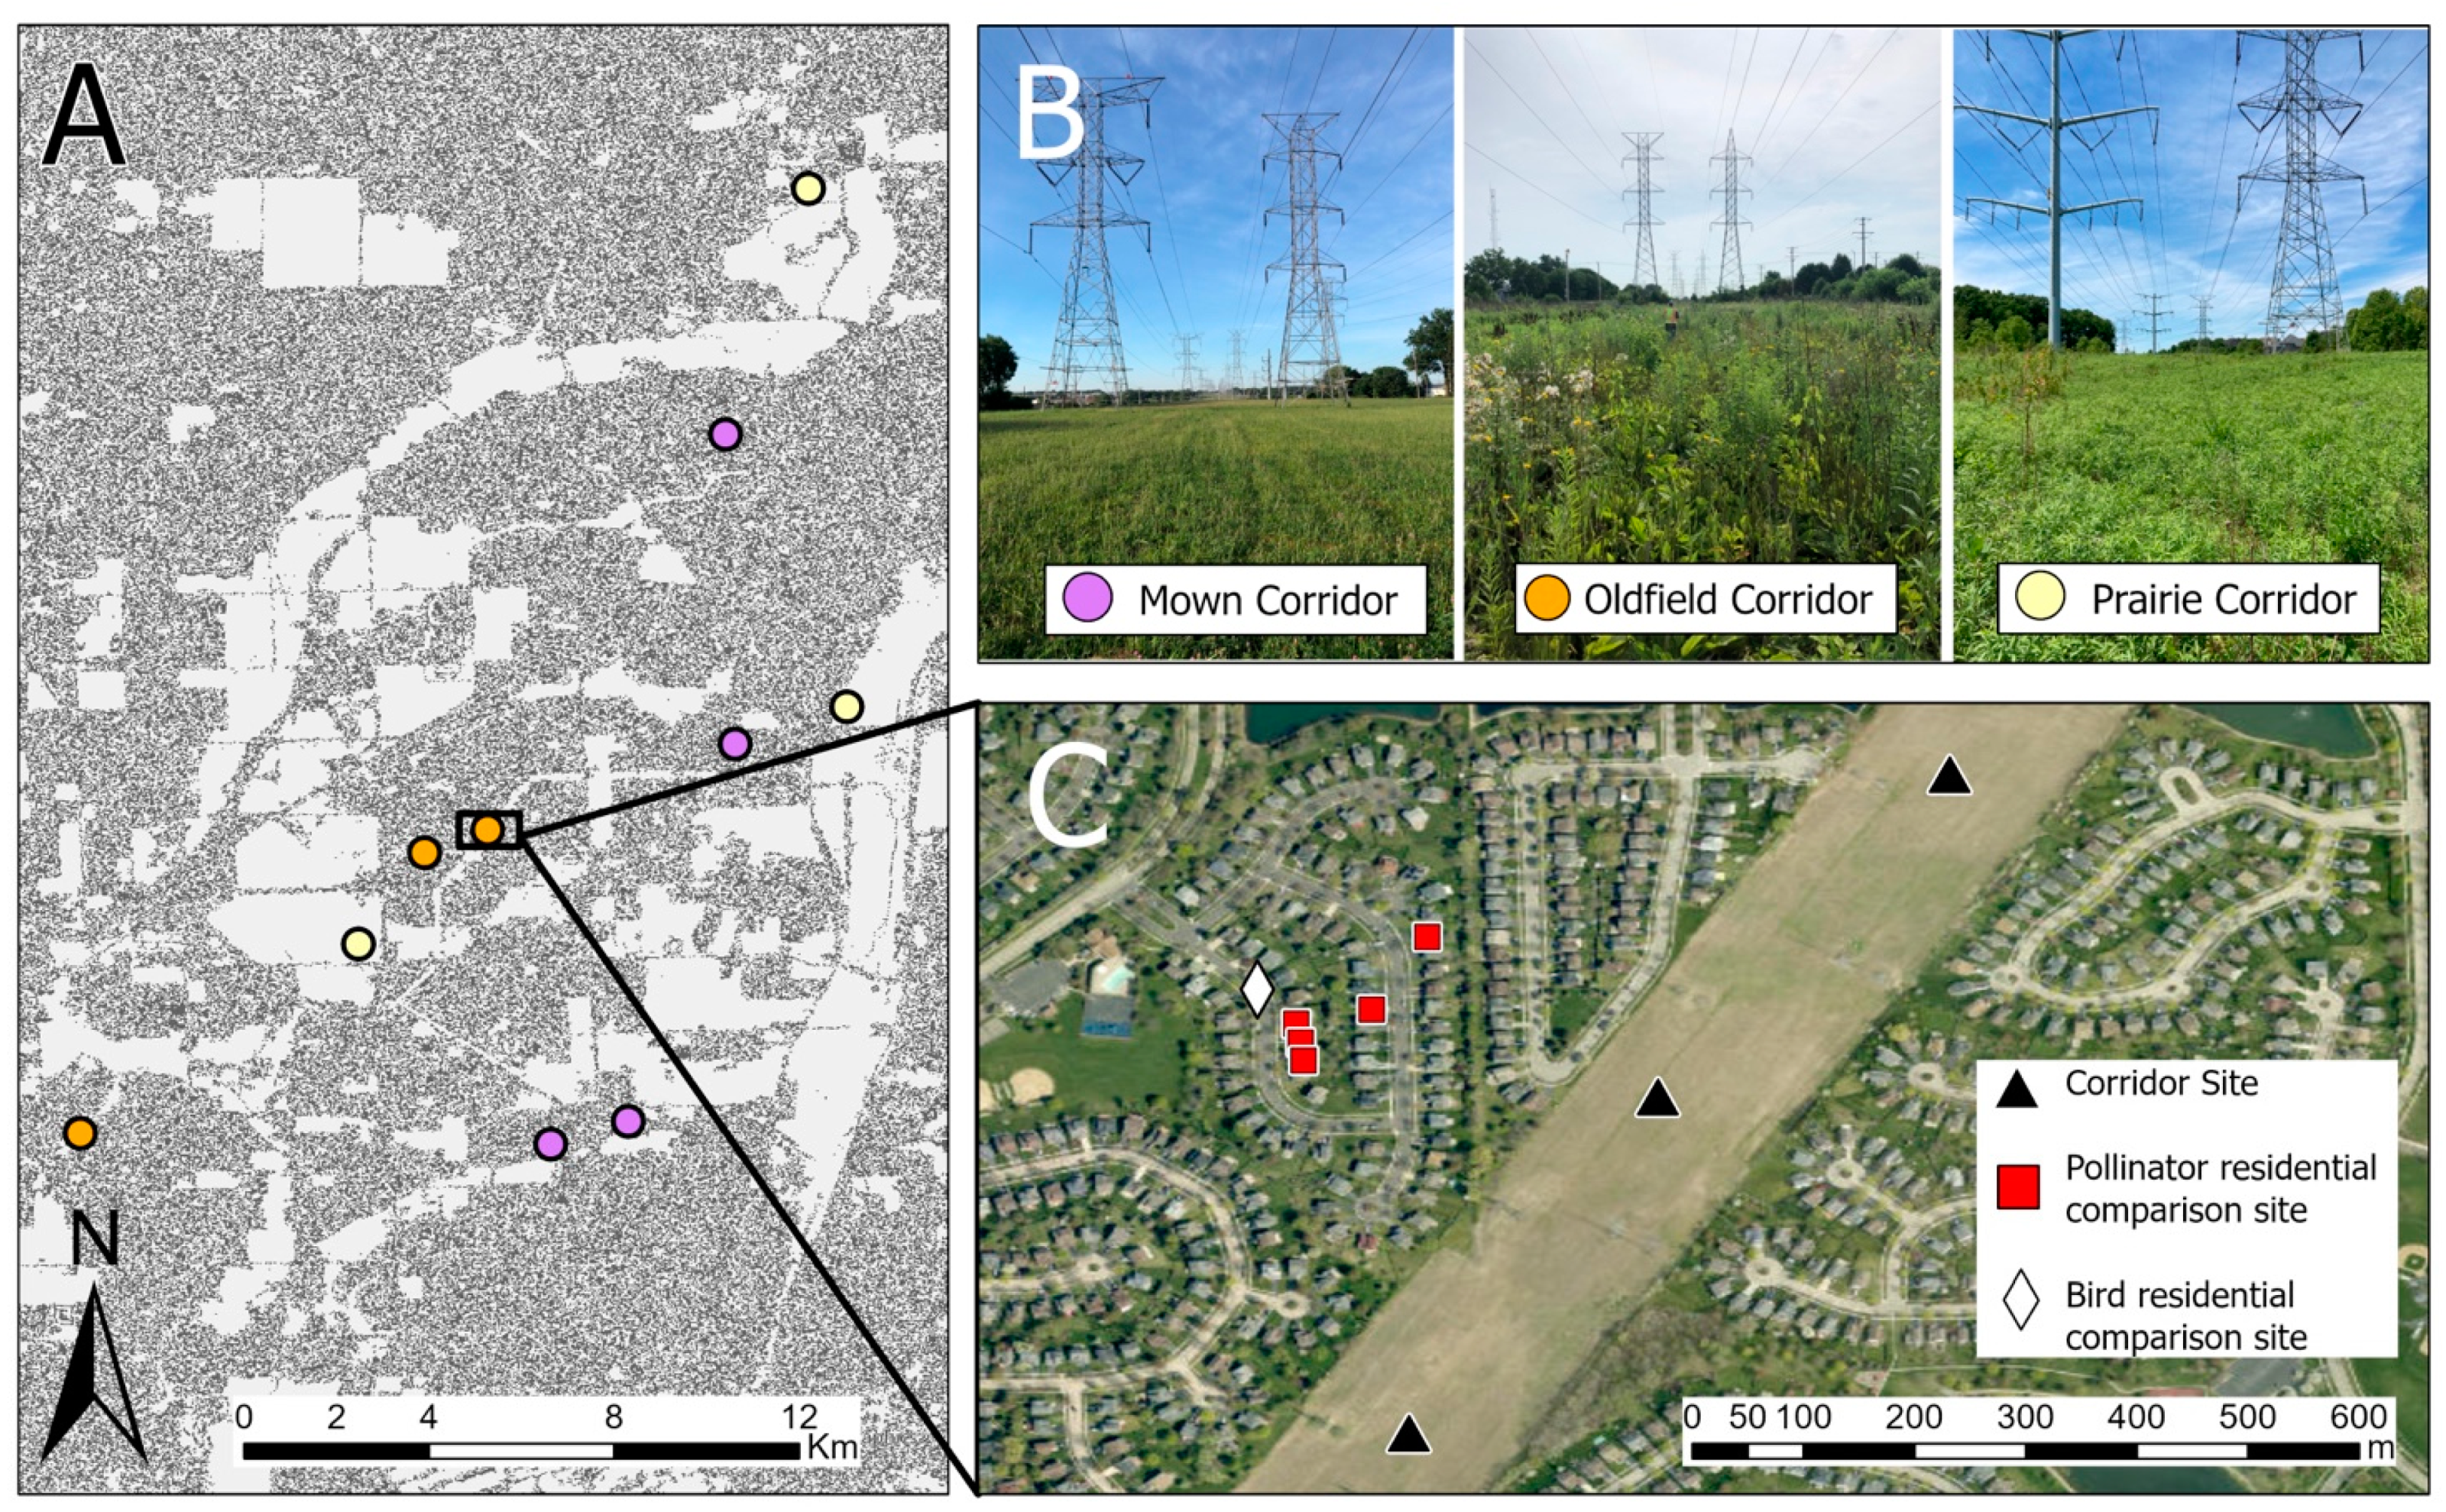
Study area in the Chicago metropolitan area, Illinois, USA. (A) We studied 10 powerline corridors that were managed in three different ways. Gray background areas on the map are impervious surfaces; (B) legend for corridor management types from (A) shown with representative images of the corridors. (C) Each study corridor was sampled at 2–4 different sites, each ~300 m from the next. Residential yard comparison sites were also studied around each mown and/or old-field corridor.
Figure 1.
Study area in the Chicago metropolitan area, Illinois, USA. (A) We studied 10 powerline corridors that were managed in three different ways. Gray background areas on the map are impervious surfaces; (B) legend for corridor management types from (A) shown with representative images of the corridors. (C) Each study corridor was sampled at 2–4 different sites, each ~300 m from the next. Residential yard comparison sites were also studied around each mown and/or old-field corridor.

Figure 2.
The four environmental variables varied significantly by site type. (A) Percent floral resource cover includes only forbes that were in bloom. The vegetation density index (B) was measured using a Robel pole and was not measured at residential yard comparison sites (see the main text). The values in (C,D) were measured within a 100 m radius surrounding each site. Lowercase letters above boxplots indicate significant differences at α = 0.05.

Figure 3.
The biodiversity of multiple taxa varied significantly by site management type. Biodiversity was measured as species richness for all taxa other than insect pollinators (A), for which it was instead measured as number of genera. Lepidopteran species richness is shown in (B), plant species richness in (C), richness of native plant species in (D), birds detected within 100 m of the point count location in (E), and birds detected within 100 m of the point count location which were also in the corridor in (F). Lowercase letters above boxplots indicate significant differences at α = 0.05.

Figure 4.
Non-metric multi-dimensional scaling (NMDS) plots of (A) insect pollinator, (B) plant, and (C) corridor bird communities by site management type. The Jaccard index was used to calculate the dissimilarity among communities. The species and genus vectors shown are those with p < 0.01. Stress = 0.150, 0.201, and 0.152, respectively. In (B), native plant species names are shown in red, while non-native or unknown species are in black. The bird species names in (C) are abbreviated by standardized alpha codes, which can be found in Table S2.


Table 1.
Estimates of important environmental predictor variables (and 95% confidence intervals) from the most parsimonious models of the four biodiversity response variables. Estimates are either model averaged from the entire model set for each response variable or presented from the top model if no other models were within 2 ΔAICc from the best supported model. When model averaging, we present only the predictor variables that were present in models within 2 ΔAICc of the best-supported model. All models were run as linear mixed-effects models with the study corridor included as a random effect.
| Response Variable | Predictor Variable | Estimate | 95% CI | # Models <Δ2AICc | Marginal * R2 | Conditional * R2 |
|---|---|---|---|---|---|---|
| Hymenopterans and Lepidopterans Combined | Intercept | 16.29 | (13.92, 18.66) | 1 | 0.48 | 0.48 |
| Floral resource cov. | 6.7 | (3.49, 9.82) | ||||
| Lepidopterans | Intercept | 3.64 | (1.63, 5.64) | 2 | 0.43 | 0.53 |
| Floral resource cov. | 3.02 | (0.61, 5.43) | ||||
| Site type: old-field | −0.43 | (−5.1, 4.23) | ||||
| Site type: prairie | 1.77 | (−1.46, 5.01) | ||||
| All Birds | Intercept | 12.91 | (11.97, 13.84) | 2 | 0.71 | 0.71 |
| Plant density index | 0.37 | (0.13, 0.61) | ||||
| Tree Cover (scaled) | 1.71 | (1.15, 2.27) | ||||
| Site type: old-field | 2.42 | (0.86, 3.98) | ||||
| Site type: prairie | 2.59 | (1.22, 3.97) | ||||
| Corridor Birds | Intercept | 3.12 | (1.44, 6.40) | 1 | 0.68 | 0.68 |
| Plant density index | 0.74 | (0.29, 1.02) |
* Marginal R2 describes the variance explained by fixed effects only, while conditional R2 describes the variance explained by the entire model.
Publisher’s Note: MDPI stays neutral with regard to jurisdictional claims in published maps and institutional affiliations. |
© 2022 by the authors. Licensee MDPI, Basel, Switzerland. This article is an open access article distributed under the terms and conditions of the Creative Commons Attribution (CC BY) license (https://creativecommons.org/licenses/by/4.0/).
Share and Cite
MDPI and ACS Style
Garfinkel, M.; Hosler, S.; Whelan, C.; Minor, E. Powerline Corridors Can Add Ecological Value to Suburban Landscapes When Not Maintained as Lawn. Sustainability 2022, 14, 7113. https://doi.org/10.3390/su14127113
AMA Style
Garfinkel M, Hosler S, Whelan C, Minor E. Powerline Corridors Can Add Ecological Value to Suburban Landscapes When Not Maintained as Lawn. Sustainability. 2022; 14(12):7113. https://doi.org/10.3390/su14127113
Chicago/Turabian StyleGarfinkel, Megan, Sheryl Hosler, Christopher Whelan, and Emily Minor. 2022. "Powerline Corridors Can Add Ecological Value to Suburban Landscapes When Not Maintained as Lawn" Sustainability 14, no. 12: 7113. https://doi.org/10.3390/su14127113
Note that from the first issue of 2016, this journal uses article numbers instead of page numbers. See further details here.