Article

Effects of Increasing Concentrations of Enrofloxacin on Co-Digestion of Pig Manure and Corn Straw

Department of Environmental Science and Engineering, Fudan University, Shanghai 200433, China
*
Author to whom correspondence should be addressed.
Sustainability 2022, 14(10), 5894; https://doi.org/10.3390/su14105894
Submission received: 2 April 2022 / Revised: 8 May 2022 / Accepted: 10 May 2022 / Published: 12 May 2022
(This article belongs to the Topic Anaerobic Digestion Processes)

Abstract

:
Enrofloxacin (ENR) is one of the most commonly used antibiotics in pig farms. In this study, using fresh pig manure and corn straw powder as substrates, the effects of different concentrations of ENR (2.5, 10, and 20 mg/L) on anaerobic digestion in completely mixed anaerobic reactors were investigated. A relatively low concentration of ENR (2.5 mg/L) increased methane production by 47.58% compared with the control group. Among the volatile fatty acids (VFAs) in the reactors, the propionic acid content was the lowest, and the concentrations of acetic acid kinase and coenzyme F420 were highest in the first seven days during peak gas production. However, methane production in the reactors with 10 mg/L and 20 mg/L ENR decreased by 8.59% and 20.25%, respectively. Furthermore, the accelerated hydrolysis of extracellular polymeric substances causes a significant accumulation of VFA levels. The microbial community in anaerobic reactors was analyzed by 16S rRNA sequencing. Proteiniphilum was the dominant bacterial genus. In addition, ENR at 2.5 mg/L effectively increased the abundance and diversity of anaerobic microorganisms, whereas a high concentration of ENR (10 and 20 mg/L) significantly decreased these parameters. This study demonstrated that different concentrations of ENR had significantly different effects on anaerobic digestion.

1. Introduction

As the world’s largest pig-breeding country, China produces a large amount of pig manure (PM) every year. These animal wastes cause serious environmental pollution unless properly treated [1]. Anaerobic digestion (AD) is widely applied in pig-farm wastewater treatment because of its high organic load tolerance and less sludge yield [2]. Furthermore, China has begun to utilize anaerobic digestion of excess sludge to achieve carbon-neutral operations goals [3]. Therefore, it is considered an economic and efficient energy recovery technology [4,5]. However, only using PM as the substrate for AD often leads to high ammonia nitrogen concentration in the system, which would make the pH value exceed 8, and then inhibit the generation of methane [6]. Therefore, by co-digestion of PM and corn straw, the carbon–nitrogen ratio (C/N) was adjusted to an appropriate proportion and ammonia inhibition was avoided [2].
Intensive pig raising on a large scale inevitably requires the frequent use of antibiotics to prevent diseases and promote animal growth. Consequently, various unabsorbed, unmetabolized antibiotics are discharged in animal feces in large amounts into the environment [7,8]. China is the world’s largest producer and consumer of antibiotics, more than half of which are used in animal feeding [9]. Excessive antibiotic use increases bacterial resistance, and their feces also contain a reservoir for antibiotic resistance genes [10,11]. Enrofloxacin (ENR) is one of the most commonly used livestock and poultry antibiotics. It has a strong, broad-spectrum bactericidal effect and its half-life in organisms is relatively long. Furthermore, its metabolite, ciprofloxacin, is also an effective antibacterial and anti-inflammatory agent [12]. However, studies have shown that antibiotics in PM significantly affect the methane production efficiency of AD systems. Sanz et al. [13] found that treating PM with small amounts of penicillin and tetracycline significantly reduced gas production, but there was no significant concentration-dependent effect. Bauer et al. [14] found that both aureomycin and ENR at 200 mg/kg impaired the AD of PM; the methane yield decreased by 49% and 44%, respectively. These studies reported that different classes and concentrations of antibiotics have varying effects on gas production in AD. Moreover, the natural degradation of ENR poses a higher environmental risk due to its slow natural degradation compared with tetracycline antibiotics [15]. In previous studies, researchers mainly investigated the effects of specific concentrations of ENR, focusing on biogas production and organic matter degradation, but overlooked the mechanisms of anaerobic co-digestion of various substrates at different concentrations of ENR [16,17,18]. Therefore, it is imperative to study the underlying mechanisms of the inhibitory effects of ENR on AD process efficiency.
Volatile fatty acids (VFAs) are some of the most important intermediates in AD, affecting not only the overall biogas production, but may also cause adverse effects or even collapse of the system due to excessive accumulation [19]. During AD, there are various metabolic pathways to the production of VFAs during acid production, which can be mainly divided into acetate-ethanol type, propionate-type, butyrate-type, and mixed acid. Different pathways lead to different product concentrations [20]. Most previous research focused on the effect of the accumulation of VFAs on the pH of the AD system [21,22,23]. Currently, there are few studies that have explained the excessive accumulation of VFAs from the perspective of hydrolysis of extracellular polymeric substances (EPS). Huang et al. [24] proved that clarithromycin promoted the destruction of EPS, which increased the yield of VFAs by 28.88%. Furthermore, some studies have shown that residual antibiotics in agricultural wastewater may affect the anaerobic microbial community by affecting the microbial diversity or reducing their activity [25]. These bacteria, including fermentation bacteria, methanogens, acetogens, and hydrogen-producing bacteria, are the major microbes involved in the AD process. Their activity and composition would significantly affect the synthesis and energy conversion efficiencies of metabolic intermediates throughout the entire biochemical reaction pathway, thereby affecting the overall efficiency of organic matter degradation [26,27]. However, different classes and concentrations of antibiotics will have different effects on the microbial composition and activity in AD systems. Therefore, it is of great significance to study the effects of ENR on microbial communities during the AD of PM, including identifying the dominant bacterial genera at different stages of the process.
Herein, four groups of reactors were built to study the effects of different concentrations of ENR on the anaerobic co-digestion of PM and corn straw powder (CSP). To elucidate the effects of different concentrations of ENR on the anaerobic co-digestion of piggery wastewater, the parameters under investigation were methane yield, VFA content, total organic carbon (TOC) content, EPS concentration, enzyme activity, and the richness and diversity of the microbial population. The study aimed to provide theoretical guidance for the AD of piggery wastewater containing antibiotics.

2. Materials and Methods

2.1. Substrates and Inoculum

The two substrates in this experiment were PM and CSP. PM was collected from the Muyuan pig farm in Zhoukou (Henan Province, China), and mechanically stirred and crushed to a uniform consistency. CSP was collected from a modern farm in Lianyungang (Jiangsu Province, China), and passed through a 0.50 mm screen. Anaerobic sludge (inoculum) was obtained from Yuexin Environmental Protection Technology Co., Ltd. (Shanghai, China). ENR was purchased from Aladdin Biochemical Technology Co., Ltd. (Shanghai, China). PM and ENR were refrigerated at 4 °C until use, and the inoculum was pre-cultured in a 37 °C water bath for five days before the formal experiment was conducted to remove endogenous biogas and acclimate the microorganisms to the habitat. The properties of the two substrates and inoculum are shown in Table S1 (Supplementary Material).

2.2. Experimental Design

The reactors used in this experiment, labeled R1–R4, were glass containers fitted with an automatic agitator (1 L total volume; 0.9 L working volume). Each reactor had a liquid sampling port sealed with a rubber plug at the bottom, a gas sampling port at the top, and an airbag (E-switch) connected at the end (Figure S1, Supplementary Material).
According to the optimal C/N ratio and sludge load for the AD [2], 168.49 g PM, 19.53 g CSP, and 500 g anaerobic inoculum were added to each reactor. The initial values of the C/N ratio and solid content were set to 26.52 and 6.41%, respectively. The stock solution (1000 mg/L) was prepared by dissolving ENR in deionized water in the dark to prevent photodegradation, before transferring it to the reactor. Subsequently, deionized water was added to each reactor to a final reaction volume of 900 mL, and the reactor was flushed with nitrogen for 5 min to ensure an anaerobic environment. Three replicates were set up in parallel to each experimental group and the control group (Table 1), and the experimental cycle lasted 30 days. During the experiment, the reactors of each group were placed in a constant-temperature water bath at 37 ± 0.5 °C, and the rotating speed of the agitator was set to 300 rpm. The airbag of each AD reactor was monitored every day to measure the output and composition of the biogas. Liquid samples were collected regularly from each reactor to determine the contents of VFAs, EPS, and coenzymes, and the solid phase was collected to evaluate microbial diversity in the reaction volume.

2.3. Analytical Methods

2.3.1. Water-Quality Indices

The pH was measured using an AS600 pH meter (Shanghai As One Trading Co., Ltd., Shanghai, China), and the contents of C and N elements in PM and CSP were measured using an organic element analyzer (Vario Micro Cube; Elementar Analysesysteme GmbH, Langselbold, Germany). TOC content was measured using a TOC-L CPH analyzer (Shimadzu, Kyoto, Japan), and volatile solids (VS), total solids (TS), and total ammoniacal nitrogen (TAN) contents were measured using the standard methods [28]. The concentrations of single VFAs (acetic acid, propionic acid, butyric acid, iso-butyric acid, valeric, and iso-valeric acid) were measured using a gas chromatograph (GC-2010 Plus; Shimadzu, Kyoto, Japan). Soluble EPS content was obtained by cryogenic centrifugation (4 °C, 4000 rpm, 10 min), and bound EPS was obtained by sample heating [29]. The specific steps are to resuspend the remaining sludge particles in the centrifuge tube to the original volume (3 mL) in 0.05% NaCl solution. The sludge suspension was heated to 60 °C for 30 min in a water bath, centrifuged at 4000 rpm for 15 min, and the supernatant was collected as the sludge-bound EPS extract. The extracted polysaccharide content was determined according to the method of Yu et al. [30]. The protein determination method we use is the protein kit to carry out the determination and it takes the bovine serum albumin as the standard [31]. The concentration of coenzyme F420 was measured according to the method of Bashiri et al. [32], while the concentration of acetic acid kinase (ACK) was measured according to the method of Luo et al. [33], and the aforementioned enzyme activities were determined via absorbance spectroscopy using a microplate reader (Synergy HTX; BioTek, Winooski, VT, USA).

2.3.2. Biogas Measurement

The volume of gas was measured using a wet gas flowmeter (FER-0.5B; Beijing Jinzhiye Instrument Equipment Co., Ltd., Bejing, China), and the methane content was analyzed using a 7890BGC system (Agilent, Santa Clara, CA, USA). Helium was used as the carrier gas, and the temperatures of the injector, detector, and oven were 120 °C, 110 °C, and 120 °C, respectively. The modified Gompertz equation [34] was used to simulate the kinetics of cumulative methane production. The formula is as follows:
  G = G max * exp [ exp ( R max * e G max ( λ t ) + 1 ) ]
where G (mL CH4/g VS) is the actual cumulative methane production at time t (day); Gmax (mL CH4/g VS) is the final methane production; Rmax (mL CH4/g VS/d) is the maximum methane yield; λ (d) is the lag time, and e is the constant (2.7183). In addition, the R2 value was used to evaluate the goodness of fit of the Gompertz equation.

2.3.3. Microbial Community Analysis

To analyze the diversity of microorganisms in the anaerobic inoculum, sediment suspensions were collected from each reactor on day 3 when gas production was obvious, and on day 30 at the end of the experimental cycle. The suspension samples were centrifuged for 15 min at 10,000 rpm and the solid phase was immediately transferred to a sterile centrifuge tube and frozen at −80 °C. High throughput sequencing of 16S rRNA was used to study microbial diversity. The structure and abundance of the microbial community were mapped and described using the online platform Personalbio Genes Cloud (www.genescloud.cn, accessed on 1 March 2022).

2.4. Statistical Analysis

Methane production data were fitted and analyzed using Origin2018 (Origin Lab Corp., Northampton, MA, USA). Graphs were constructed using GraphPad Prism 8.0.2 (GraphPad Software Inc., San Diego, CA, USA). IBM SPSS Statistics for Windows, version 23 (IBM Corp., Armonk, NY, USA) was used for the analysis of variance to compare the significant differences between treatment groups. The significance level was set at p < 0.05.

3. Results

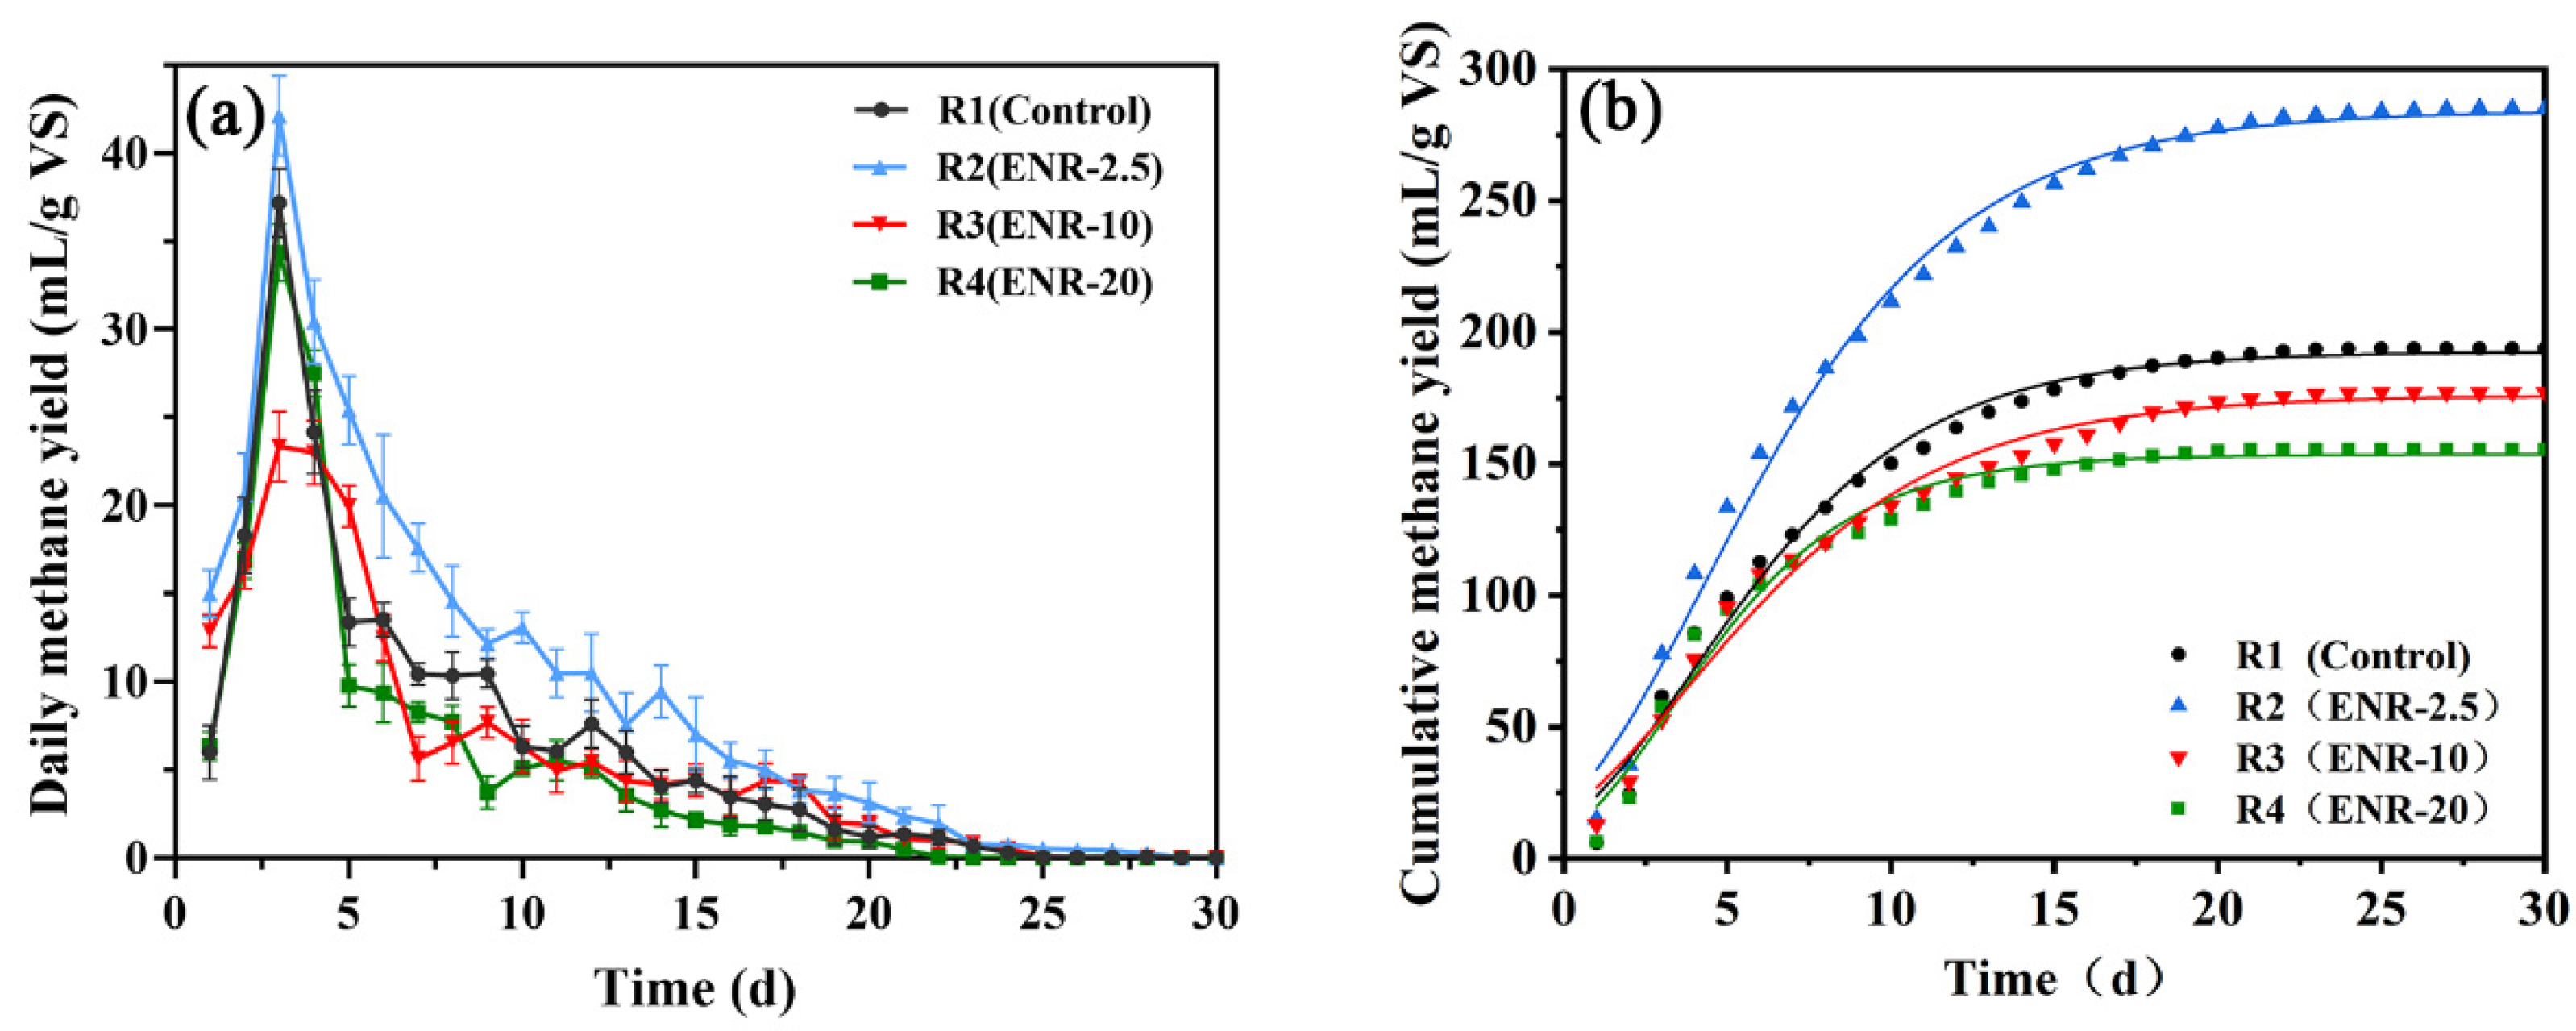
3.1. Methane Production

In our experiment, the daily methane unit yield in terms of VS (Figure 1a) reached a maximum in each of the four groups of reactors on the third day, suggesting that after the start of the experiment, the hydrolysis rate is not the main factor affecting the production of methane. The daily methane yield (42.13 mL/g VS/d) of R2 was highest, which was 13.3% higher than that of R1, the control group; the daily methane yields of R3 and R4 were 7.5% and 37.1% lower than that of R1, respectively. In each group, the peak daily gas production was followed by a rapid decline. After the thirteenth day, the daily methane production of each anaerobic reactor was less than 10 mL/g of VS, which is attributable to the gradual reduction of organic matter content available to the microorganisms in the system, preventing the AD process from proceeding as before [6].
The modified Gompertz equation and its best-fitting curve for cumulative methane yield in four groups of experiments are illustrated in Figure 1b. The key parameters of the modified equation are shown in Table 2. The R2 values of the fitting curves of each reactor were at least 0.98, indicating that the modified Gompertz equation effectively described methane generation in the different stages of the AD process. During the whole experimental cycle, the maximum potential methane production (Gmax) per unit of VS of R2 (2.5 mg/L ENR) was 47.58% higher than that of R1, which may be because this relatively low concentration of ENR enhanced the ability of microorganisms to resist the adverse effects of antibiotics, so that fermentation bacteria, acetogens, and methanogens could make better use of the matrix in the system to generate methane [35]. However, compared with the control group, the Gmax of R3 (10 mg/L ENR) and R4 (20 mg/L ENR) decreased by 8.59% and 20.25% respectively. This may be because the higher concentration of ENR inhibits the DNA gyrase of methanogens, which restricts methanogens division and growth [36].
The volume of methane biogas production is an indicator of the reaction rate and operational efficiency of AD [37]. The accumulation of VFAs would inhibit the formation of methane, which is due to the existence of ENR [14]. Moreover, it was speculated that the addition of ENR may have affected the composition of the microbial community in the reaction system, thus affecting methane generation [25]. Under the same organic load, the higher the methane yield per unit of VS, the better the operational efficiency of the AD system [38].

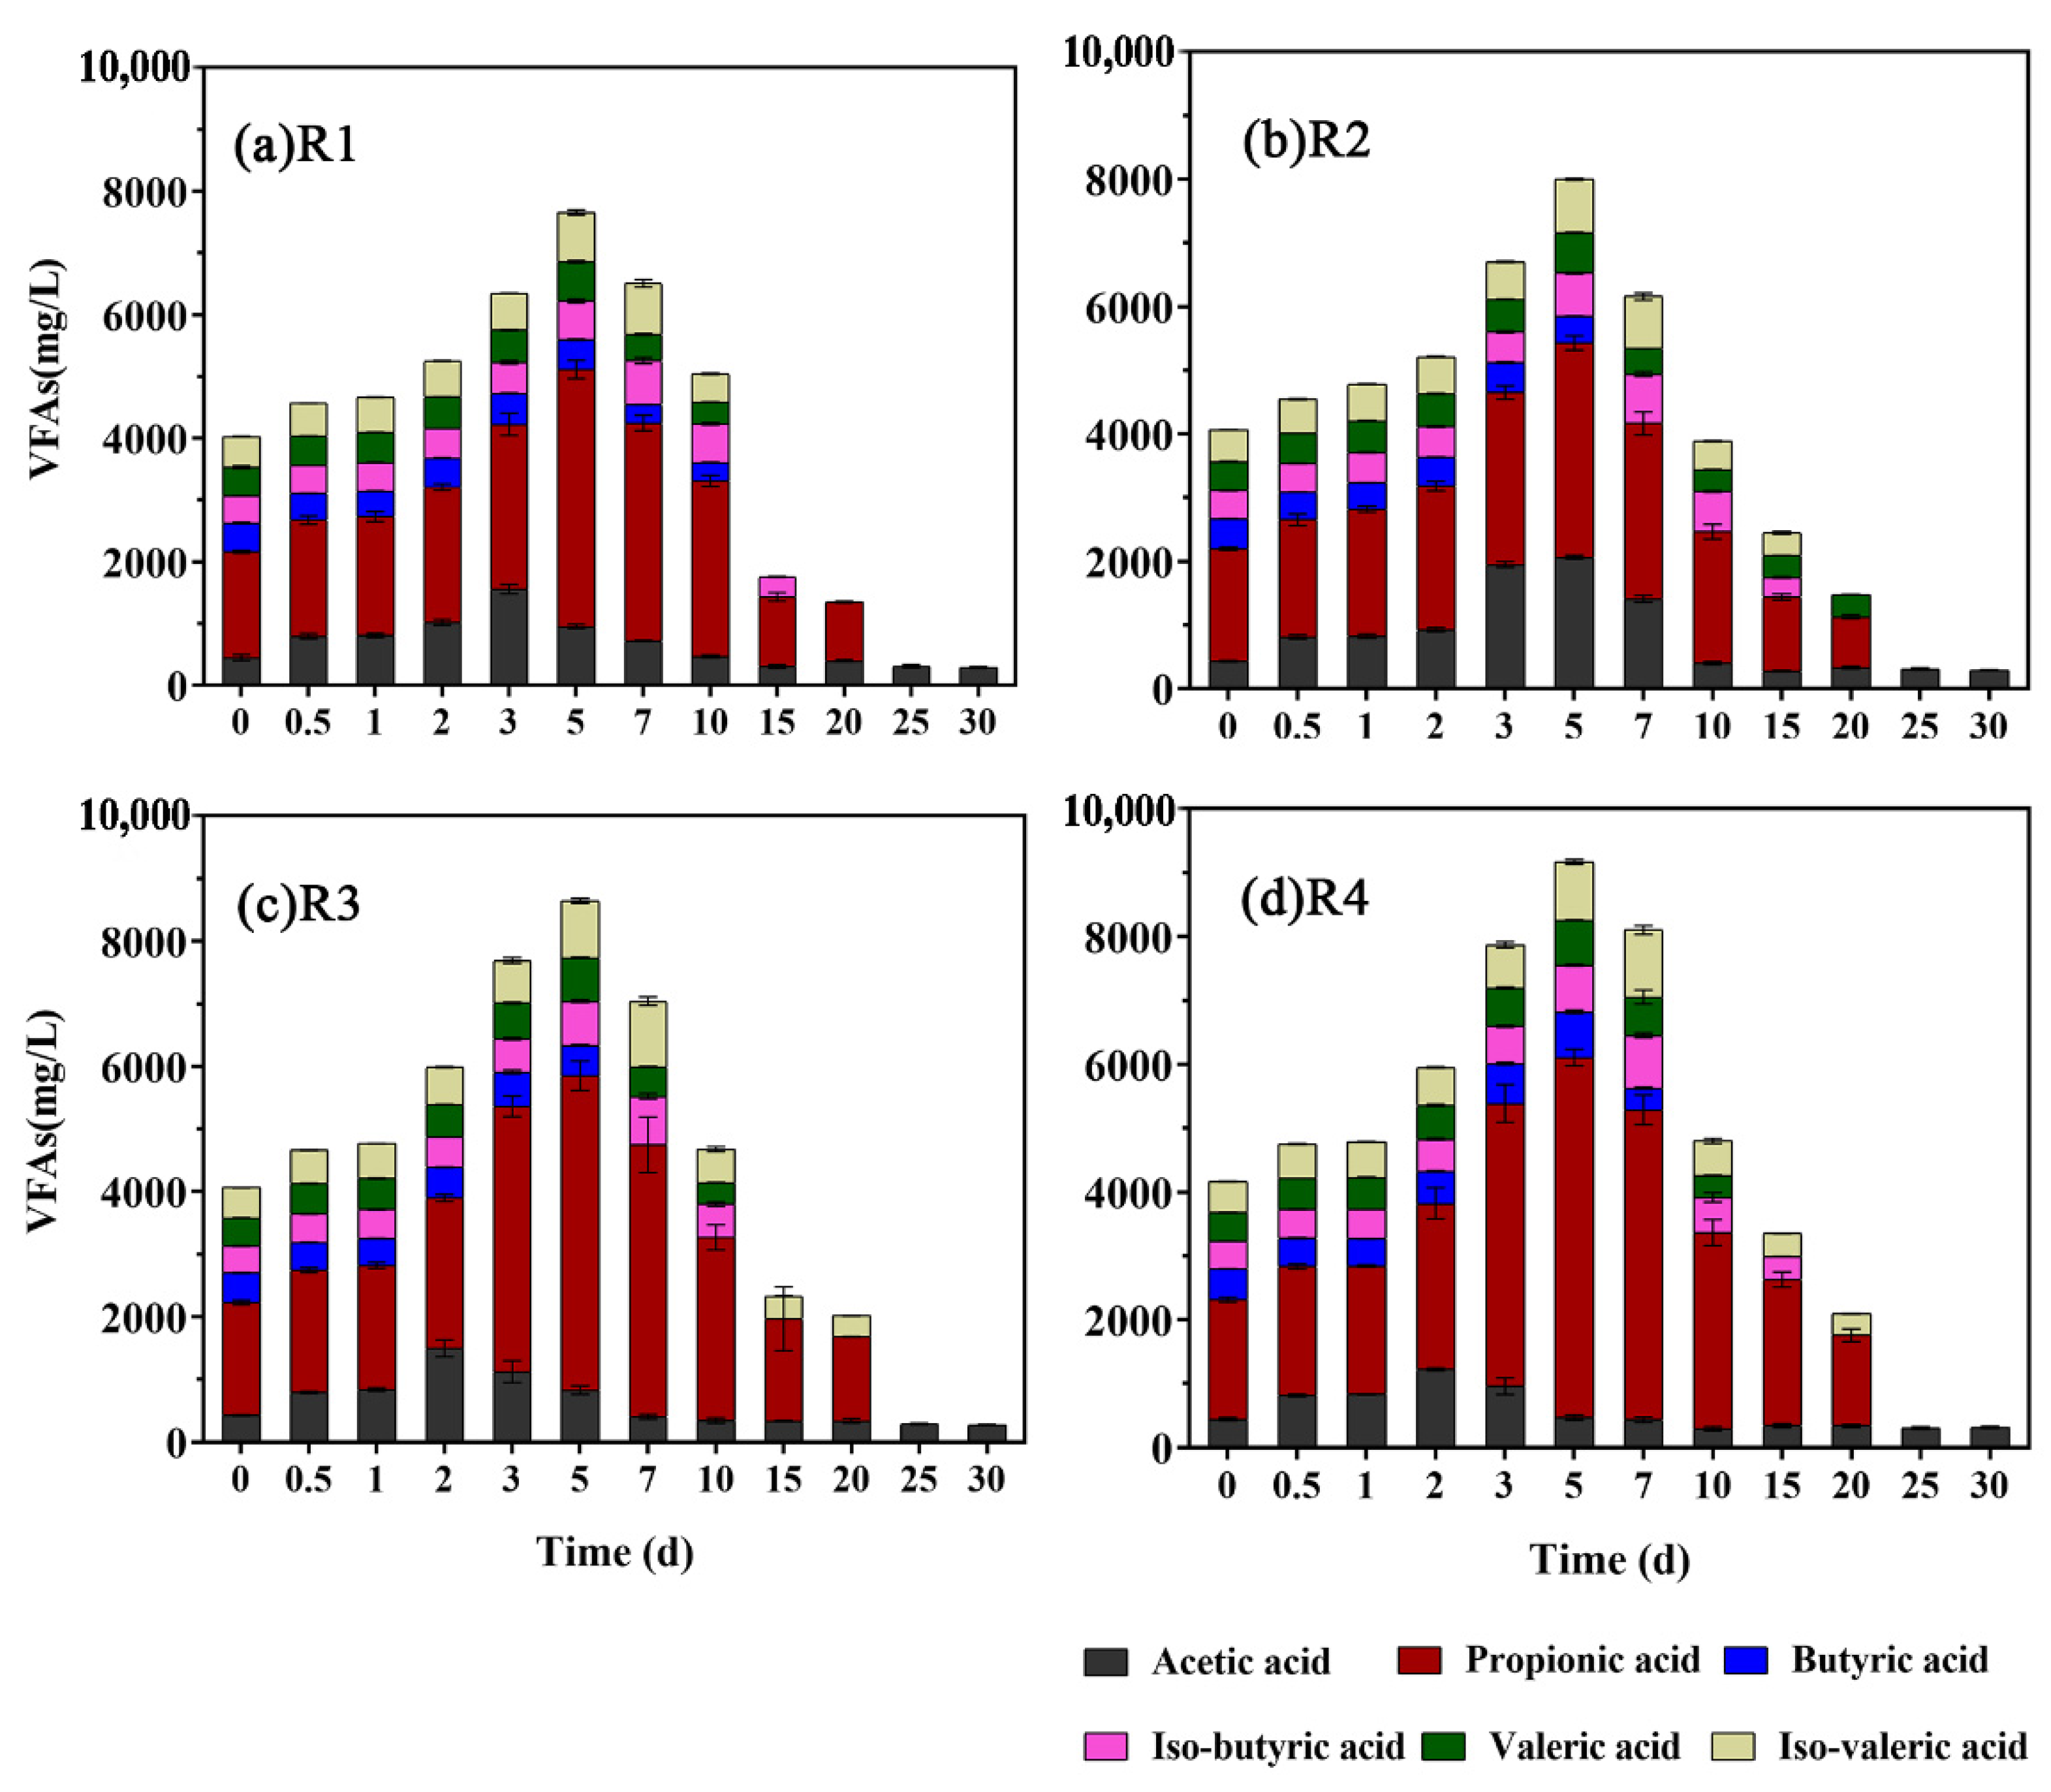
3.2. Variation in VFAs

The concentrations of six kinds of VFAs (acetic acid, propionic acid, butyric acid, isobutyric acid, valeric acid, and isovaleric acid) are shown in Figure 2. The concentration of total VFA in each reactor remained below 10,000 mg/L, the pH of each of the four groups was maintained between 7.2 and 7.9 (Figure 3a), and the total ammoniacal nitrogen (TAN) are shown in Figure 3b, indicating that the digestion system is not significantly acidified and the strategy of co-digestion of PM and CSP is feasible [39].
In the four groups, the VFA contents increased slowly from day 1 and reached the maximum on day 5, and then decreased rapidly until it was below the detection limit (10 mg/L). On day 3, at maximum gas production, the total VFA content of R2 was 6702.85 mg/L, which was not significantly different compared with the control group, R1 (6344.04 mg/L); however, the total VFA contents of R3 (7690.7 mg/L) and R4 (7871.7 mg/L) increased by 21.23% and 24.08% vs. R1, respectively. In the first seven days, marked by elevated gas production, the VFA profiles of the four groups differed mainly in the contents of acetic acid and propionic acid. In general, the acetic acid concentration of R2 was highest, followed by those of R1, R3, and R4. Gas column chromatography indicated that propionic acid accounted for more than half of the total concentration of VFAs in the four groups of reactors, and was the short-chain fatty acid that contributed most to the reaction system. On the fifth day, at the highest VFA concentration, the propionic acid concentrations of R3 and R4 were 20.66% and 35.43% higher than that of R1, respectively, whereas that of R2 was 19.07% lower vs. R1.
Acetic acid is considered the main precursor of methane generation, as it can be converted directly to methane. In a typical AD process, approximately 70% of methane is generated by acetic acid trophic methanogens via the methyl group of acetate [40]. Furthermore, its concentration in the reaction system shows a significant positive correlation with the rate of methane production [23,41], which explained the higher methane yield of R2 vs. R1. The accumulation of propionic acid in the VFA fraction is particularly undesirable. The pKa of propionic acid, derived from Ka, the ionization constant, is 4.87 at 20 °C; furthermore, propionic acid is difficult to degrade to acetic acid under low-hydrogen partial pressure [42].
VFAs are a very important intermediate product in AD, and their accumulation has a significant impact on the overall methane production efficiency [43]. According to the research of Ji et al. [44], the accumulation of VFAs is related to the decrease of the activity of methanogens, with the rate of VFA utilization decreasing, thereby acidifying the reaction system. Analysis of Figure 1 and Figure 2 showed if the consumed propionic acid is finally converted into methane, the acetic acid concentration of the R3 and R4 groups should increase significantly compared with R1 from the 3rd day to the 10th day, but the actual detected acetic acid concentration in R2 is higher than the R3 and R4 groups. At the same time, excessive propionic acid concentration will indeed reduce methane production. We speculate that not all propionic acid will be converted into acetic acid, and propionic acid has multiple metabolic pathways in the anaerobic digestion system. Low concentrations of ENR (2.5 mg/L) promoted the conversion of propionic acid to acetate, while high concentrations of ENR (10, 20 mg/L) caused the accumulation of propionic acid, and other conversion pathways (non-acetic acid) of propionic acid were enhanced.

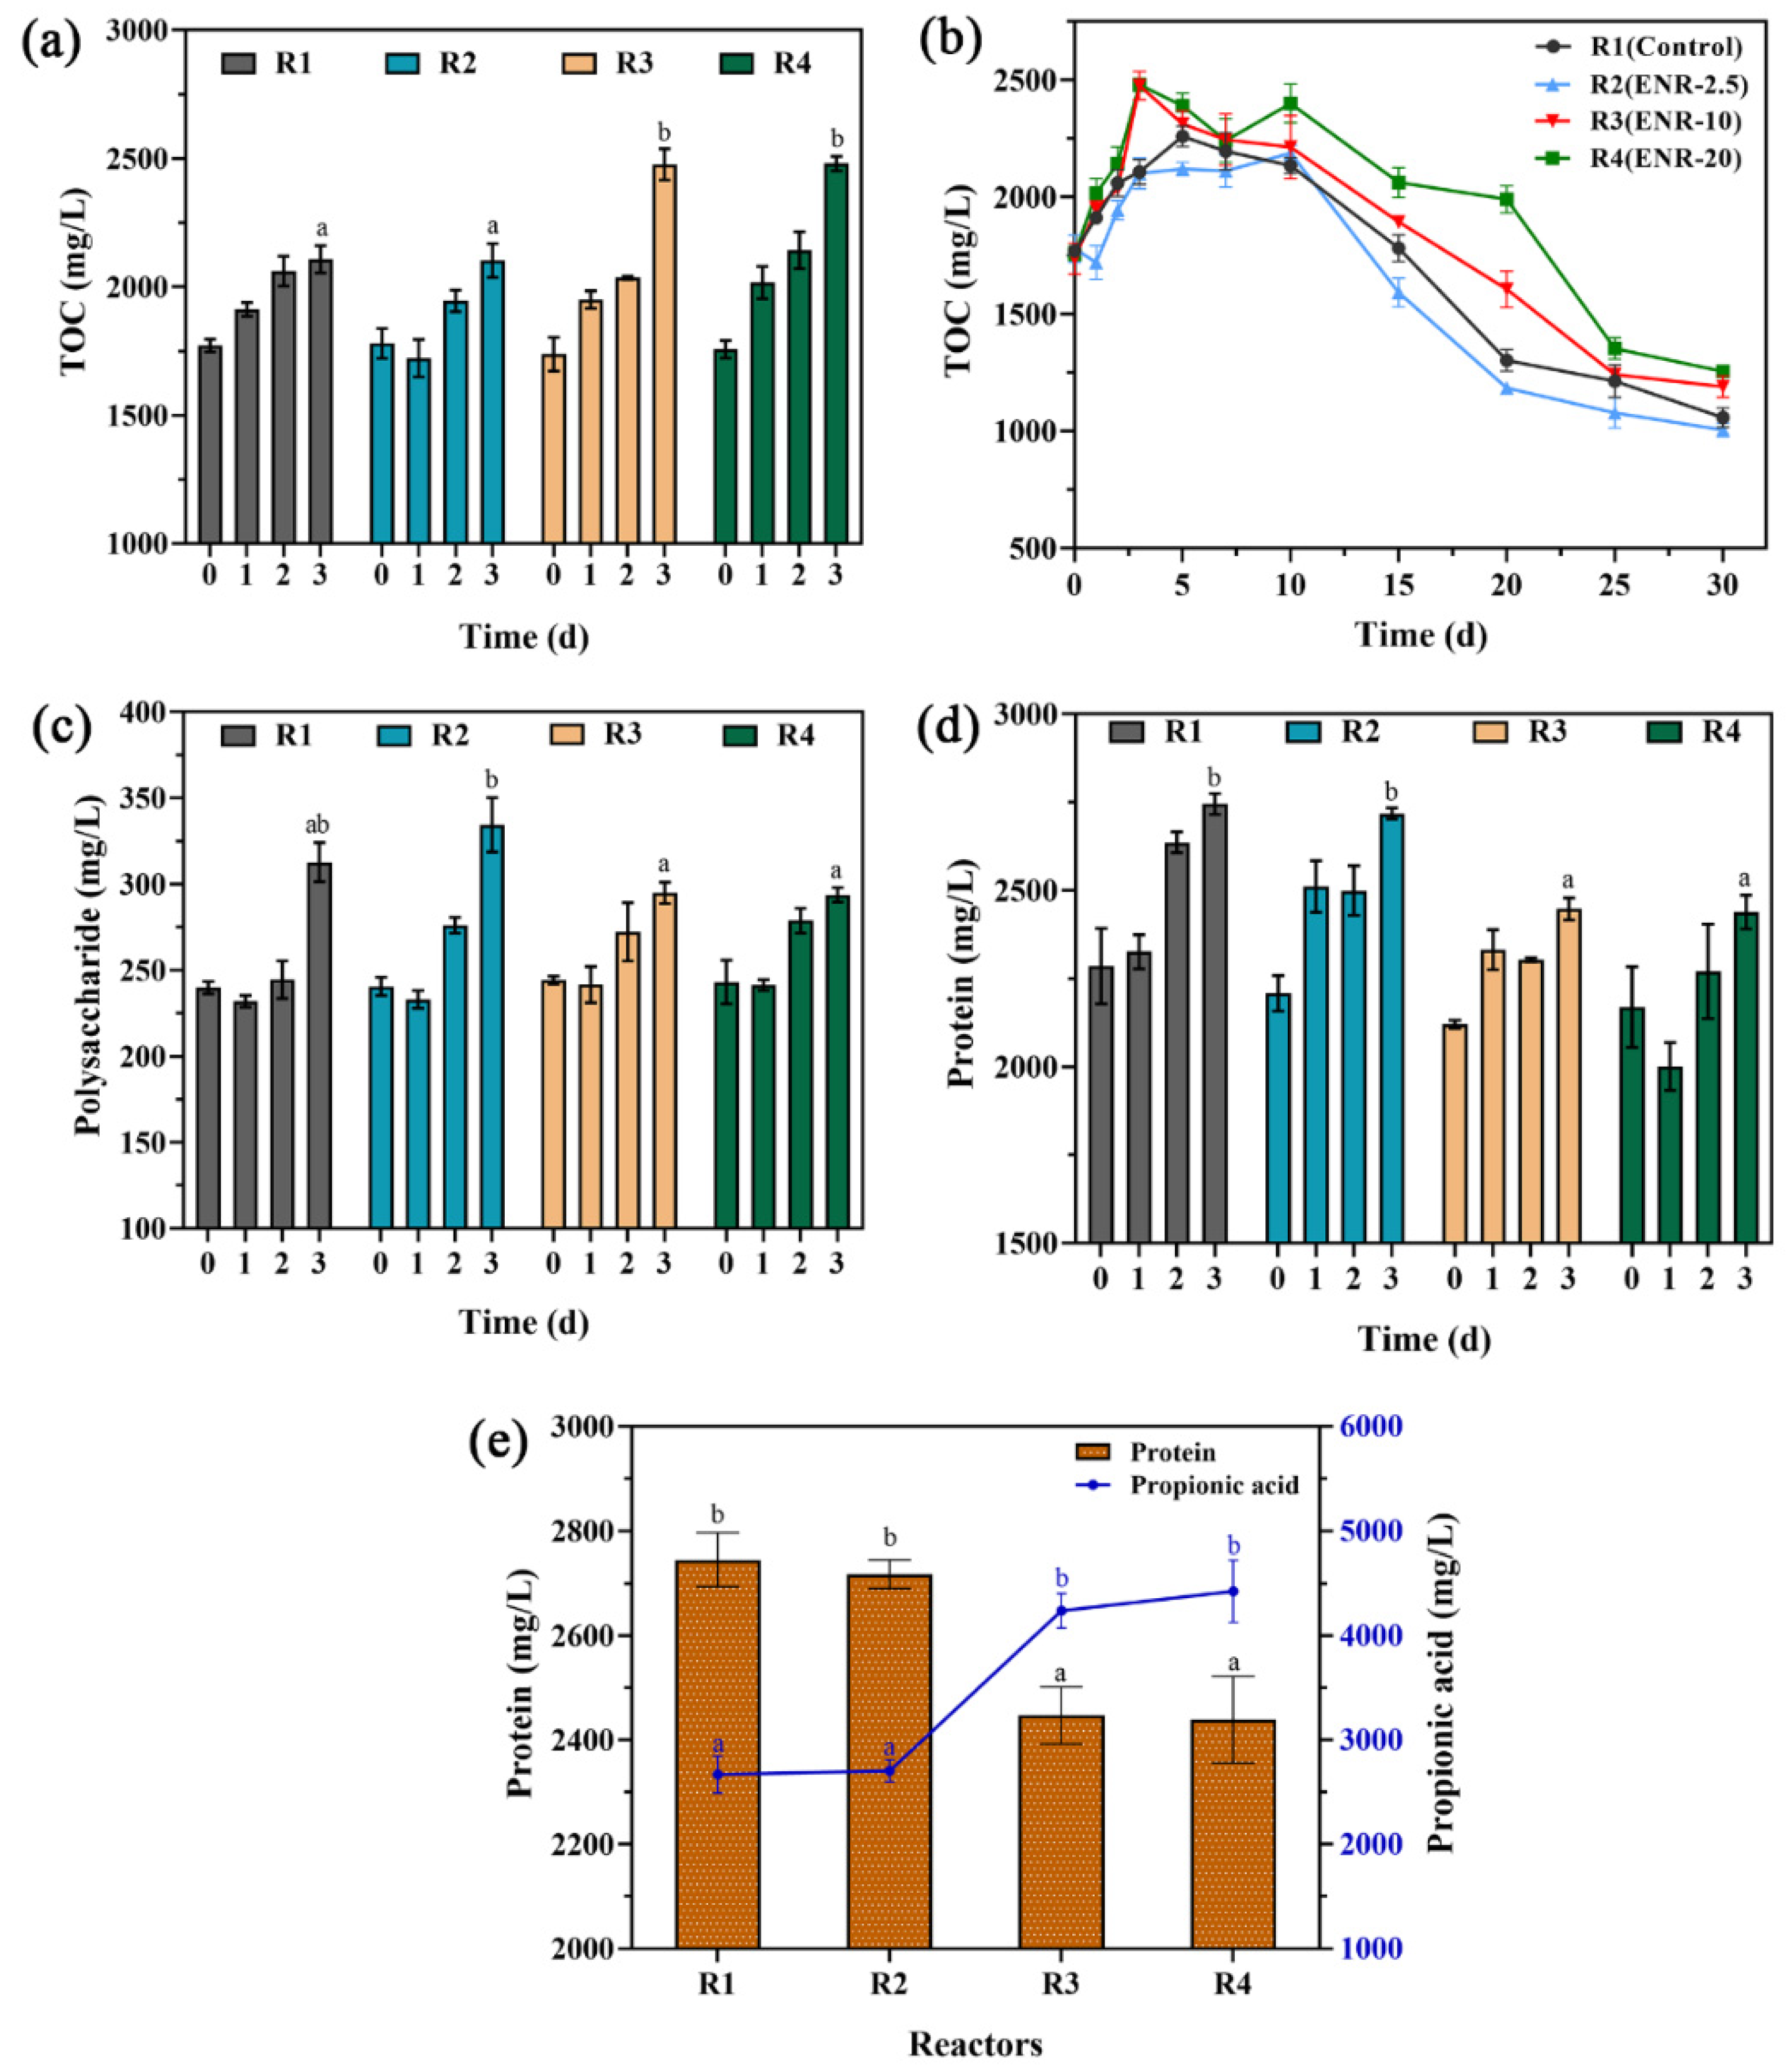
3.3. Variation in TOC and EPS Levels

The TOC concentration in wastewater is an indirect measure of the performance efficiency in an AD system [45]. The variation in TOC concentration over the first 3 days and 30 days is shown in Figure 4a,b. There was no significant difference in the initial TOC concentration of the four groups of reactors (p < 0.05). By the third day, the TOC levels in R2 and R1 (control) were similar, whereas the TOC levels in R3 and R4 were 17.54% and 17.68% higher than in R1, respectively. In the initial stage of digestion (0–3 d), some macromolecular organic matter in PM and CSP is converted to soluble, small molecular organic matter by fermentation bacteria, in a process called solubilization [46]. In this process, the concentration of dissolved organic matter in the system increases, which is reflected in the obvious increase of TOC content in the digestive solution. Throughout the experimental cycle, the TOC degradation rates of R1–R4 were 40.26%, 43.51%, 31.46%, and 28.55%, respectively. Overall, the results showed that the addition of a lower concentration of ENR (2.5 mg/L) had no obvious effect on the degradation of organic matter, but higher concentrations of ENR (10 mg/L and 20 mg/L) impaired the degradation of organic matter in the reactors in a dose-dependent manner.
EPS generally occurs in the interior and on the surfaces of anaerobic inoculum flocs, which can enrich nutrient levels in the environment, and its main components are polysaccharides and proteins [47]. In this study, the polysaccharide content of the reaction system would have increased in the initial stage of AD (Figure 4c) because of the hydrolysis of a large number of complex macromolecules supplementing the content of EPS [48]. However, on the third day, the polysaccharide contents of R3 and R4 were 5.70% and 6.07% lower than in R1, respectively, whereas the polysaccharide content of R2 was 6.94% higher than in R1. Over the first three days, the protein content of each group displayed the same trend as the polysaccharide content (Figure 4d). It could be inferred that a higher concentration of ENR promotes the hydrolysis of polysaccharides and proteins in EPS. They are degraded into small molecules by extracellular enzymes secreted by cells, and then absorbed and utilized by cells [49].
The protein in EPS and propionic acid content in four groups are shown in Figure 4e. The results verify that when the protein concentration decreased, the propionic acid content rose rapidly. This proves that the degraded EPS is largely converted into VFAs, especially propionic acid which is not easily degraded by bacteria. Huang et al. [24] found that the presence of antibiotics can promote the degradation of EPS, thereby increasing the TOC levels in the AD system. During the acidification stage of AD, these polysaccharides and proteins serve as precursors of organic acids and promote the accumulation of VFAs [50]. As the main component of EPS, protein provides attachment sites for many bacteria and archaea [51]. Protein can combine with toxic substances (such as antibiotics) to enhance microorganisms’ resistance to external adverse factors [52]. However, this ameliorative effect is limited, because increasing the ENR concentration accelerated the hydrolysis of protein, which would cause the accumulation of VFAs and slow down the degradation of organic matter.

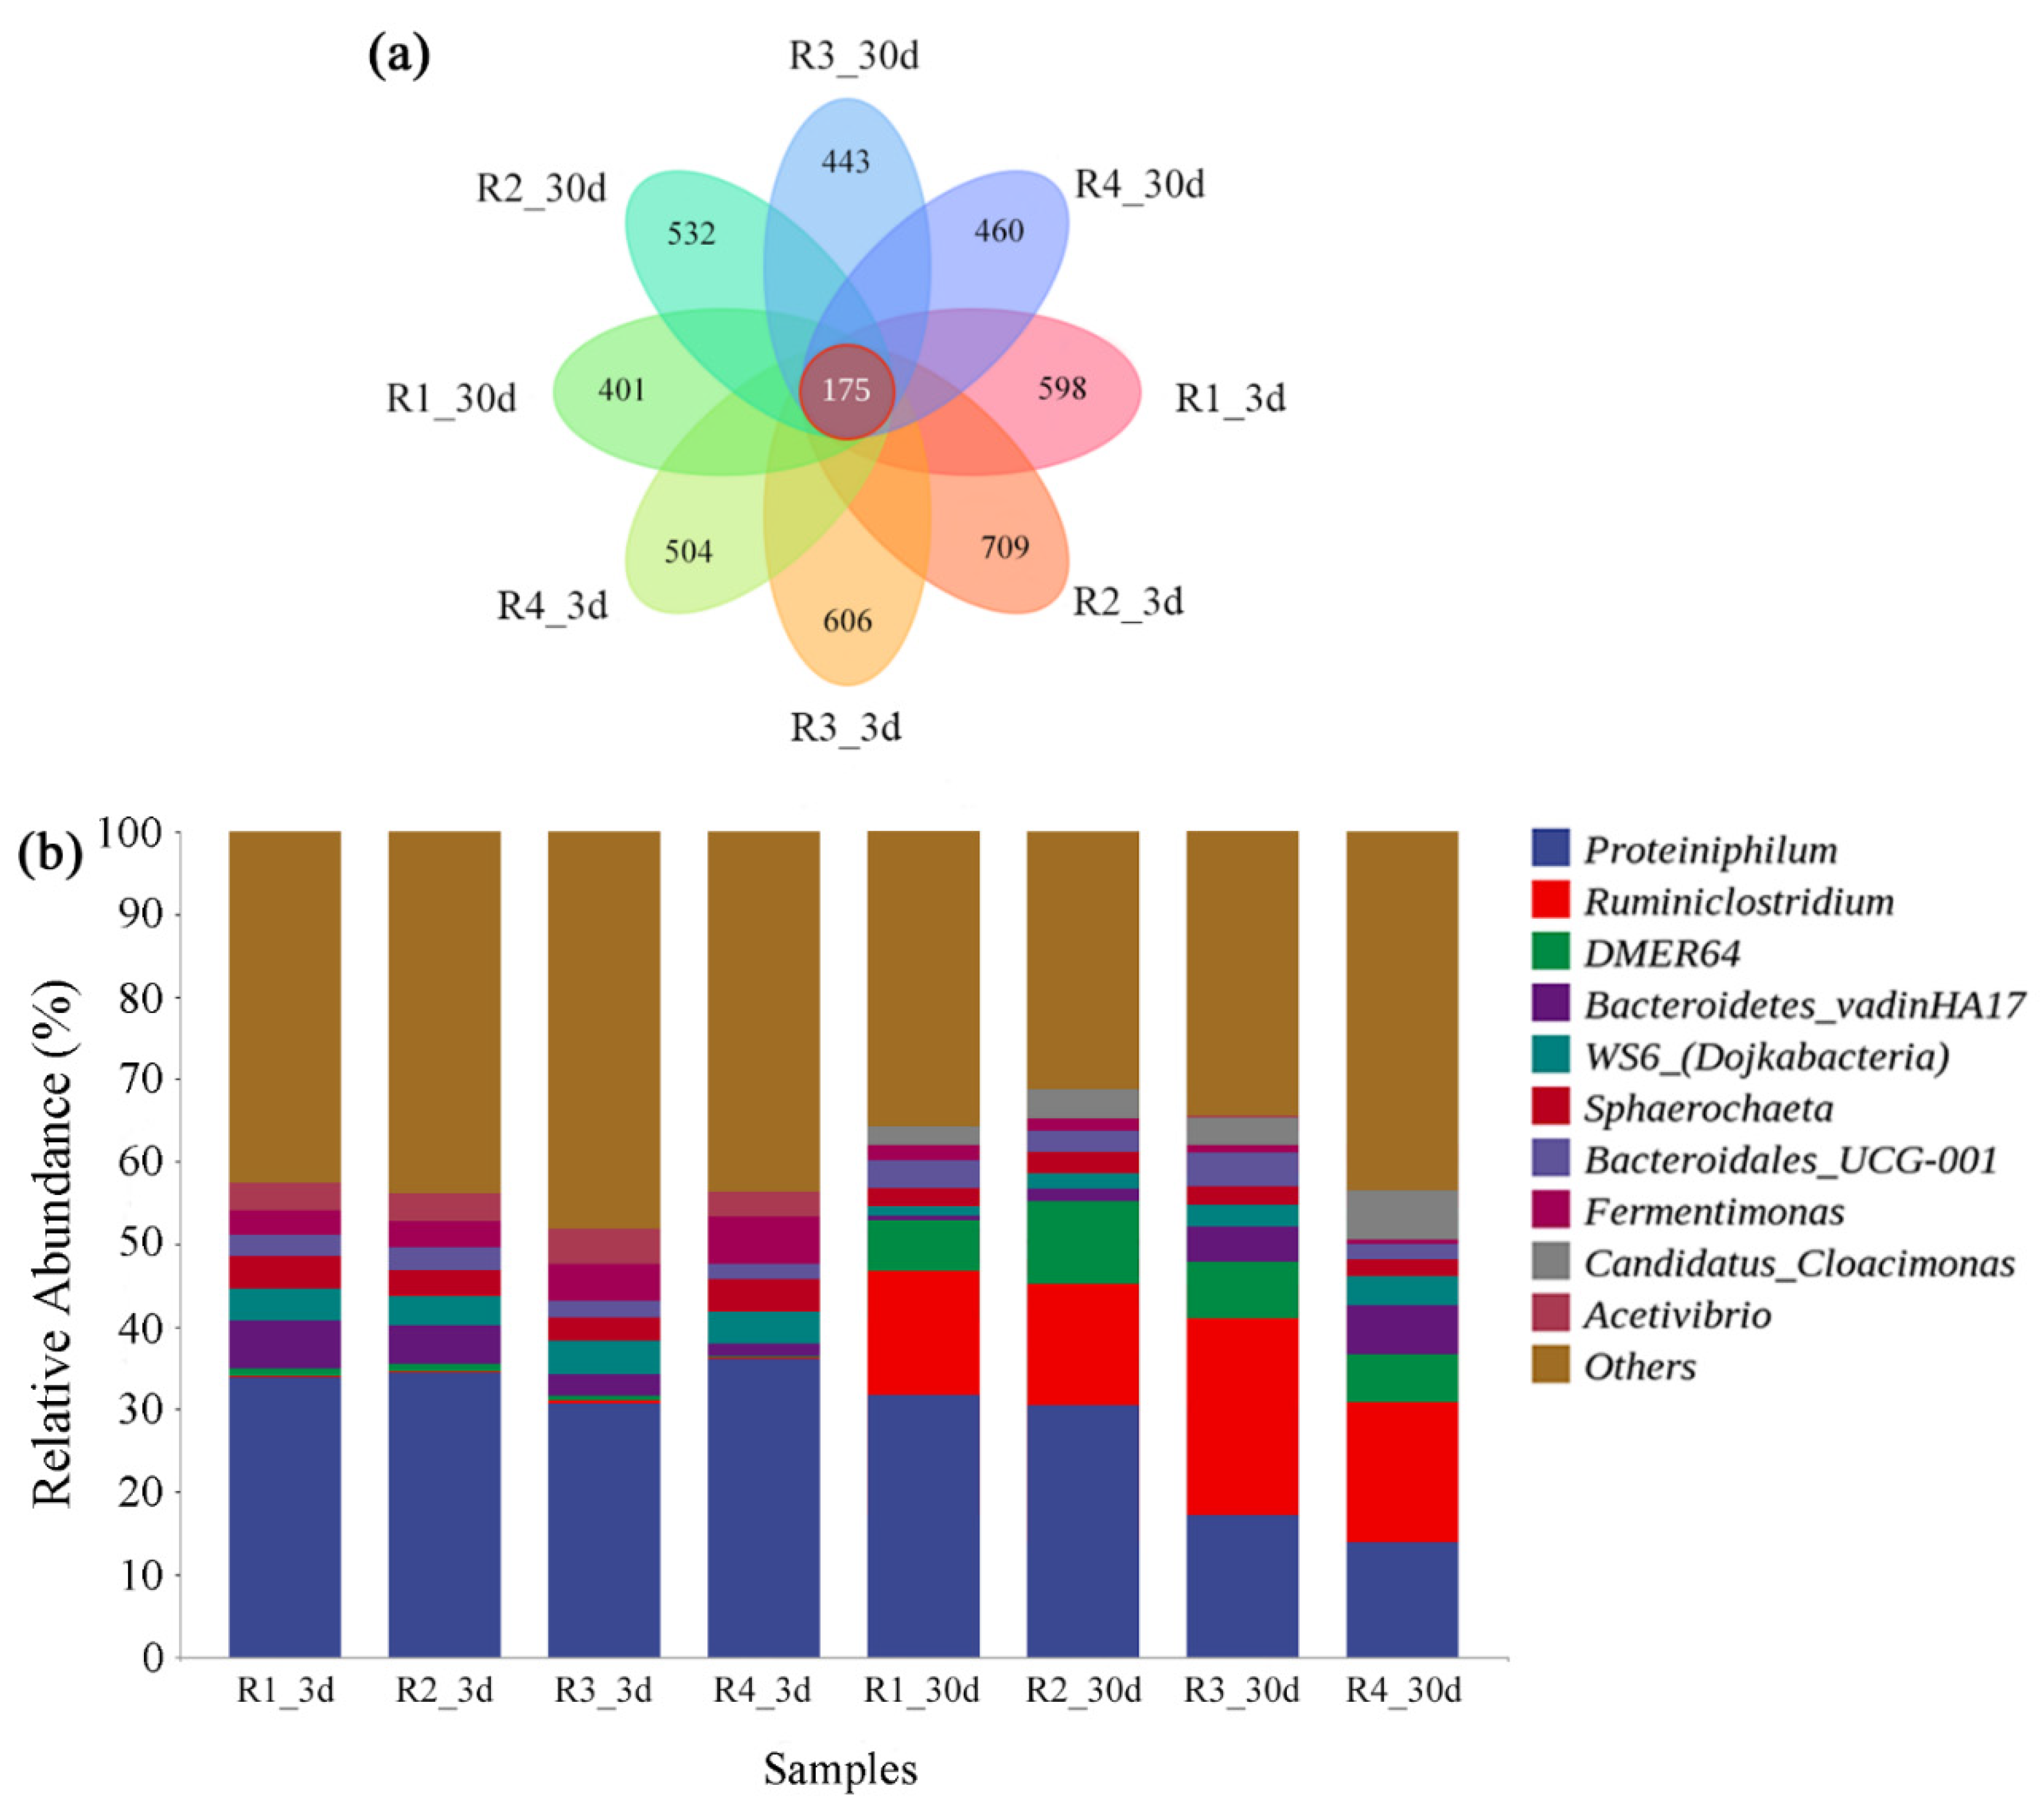
3.4. Microbial Diversity Analysis

In this study, 16S rRNA sequencing was used to analyze the microbial diversity in the anaerobic inoculum. The Chao, Shannon, and Simpson indices of the four groups decreased significantly from day 3 to day 30 (Table 3), indicating that the substrate was depleted as the reaction progressed, and the richness and diversity of the microbial community decreased to a certain extent [53]. The Chao indices at day 30 decreased in the order of R2 > R1 > R3 > R4, and the ranking of Shannon indices was as follows: R2 > R3 > R1 > R4, indicating that ENR at 2.5 mg/L increased microbial richness in the AD system, while higher concentrations of ENR (10 mg/L and 20 mg/L) significantly reduced the microbial richness in a dose-dependent manner. On day 3 and day 30, there was a significant difference between the Shannon indices of R2 and R1 (control) (p < 0.05), whereas the Shannon indices of R3 and R4 were not significantly different compared with R1 (p < 0.05), indicating that ENR at 2.5 mg/L (R2) had a positive effect on microbial community diversity, while higher concentrations of ENR (10 mg/L and 20 mg/L) had no significant effects on microbial diversity. In addition, the Good’s coverage index of each group was greater than 0.99, which showed that the sequencing results reliably reflected the diversity and richness of microbes in the current samples [54].
A Venn diagram (Figure 5a) intuitively represents the differences and overlap of microbial species in each group of samples [55]. The number of independent operational taxonomic units (OTUs) observed in eight groups showed that antibiotics significantly affected the microbial diversity in the AD systems. Furthermore, R2 displayed the highest number of independent OTUs on day 3 and day 30 of the experimental cycle.
Microbial distribution analyses of R1–R4 at the genus level (Figure 5b) showed that Proteiniphilum was the dominant bacterial genus on day 3, accounting for more than 30% of the bacterial community in each of the four groups of reactors. Studies have shown that Proteiniphilum plays a vital role in AD that most of them utilize acetate, propionate, and butyrate to reduce the accumulation of VFAs [56]. On day 30, Proteiniphilum remained the dominant genus in R1 and R2, accounting for 31.48% and 30.49% of the microbial communities, respectively, while the proportion of Proteiniphilum in R3 and R4 dropped to 17.05% and 13.83%, respectively, which indicated that a low concentration of ENR had little effect on Proteiniphilum, whereas higher concentrations of ENR significantly inhibited the growth of Proteiniphilum. This was consistent with the obvious accumulation of VFAs in R3 and R4 in the middle stage of AD. Furthermore, Ruminiclostridium is a genus of bacteria used to degrade cellulose and pectin [57], and we speculated that organic substances such as cellulose and pectin in CSP increasingly participate as substrates in AD as the reaction proceeds, enabling this kind of microorganism to gradually become dominant in the microbial community. On day 30, the abundance of Rikenellaceae was also significantly increased at the genus level; studies showed that these are typical methanogenic bacteria that utilize propionate as a substrate [58]. Herein, the proportions of Rikenellaceae in the four groups decreased in the order of R2 (9.93%) > R3 (6.91%) > R1 (6.18%) > R4 (5.61%). This once again proved that the methane production of R2 is significantly higher than that of R1, which was probably due to the proliferation of these bacteria that use propionic acid as a substrate in the AD system.
Overall, the results showed that ENR at 2.5 mg/L increased the richness and diversity of bacterial species, and promoted the growth of methanogens. Conversely, ENR at 10 mg/L and 20 mg/L had an obvious dose-dependent inhibitory effect on microorganisms, with the changes in the richness and diversity of the microbial community closely related to the concentration of ENR in the AD system.

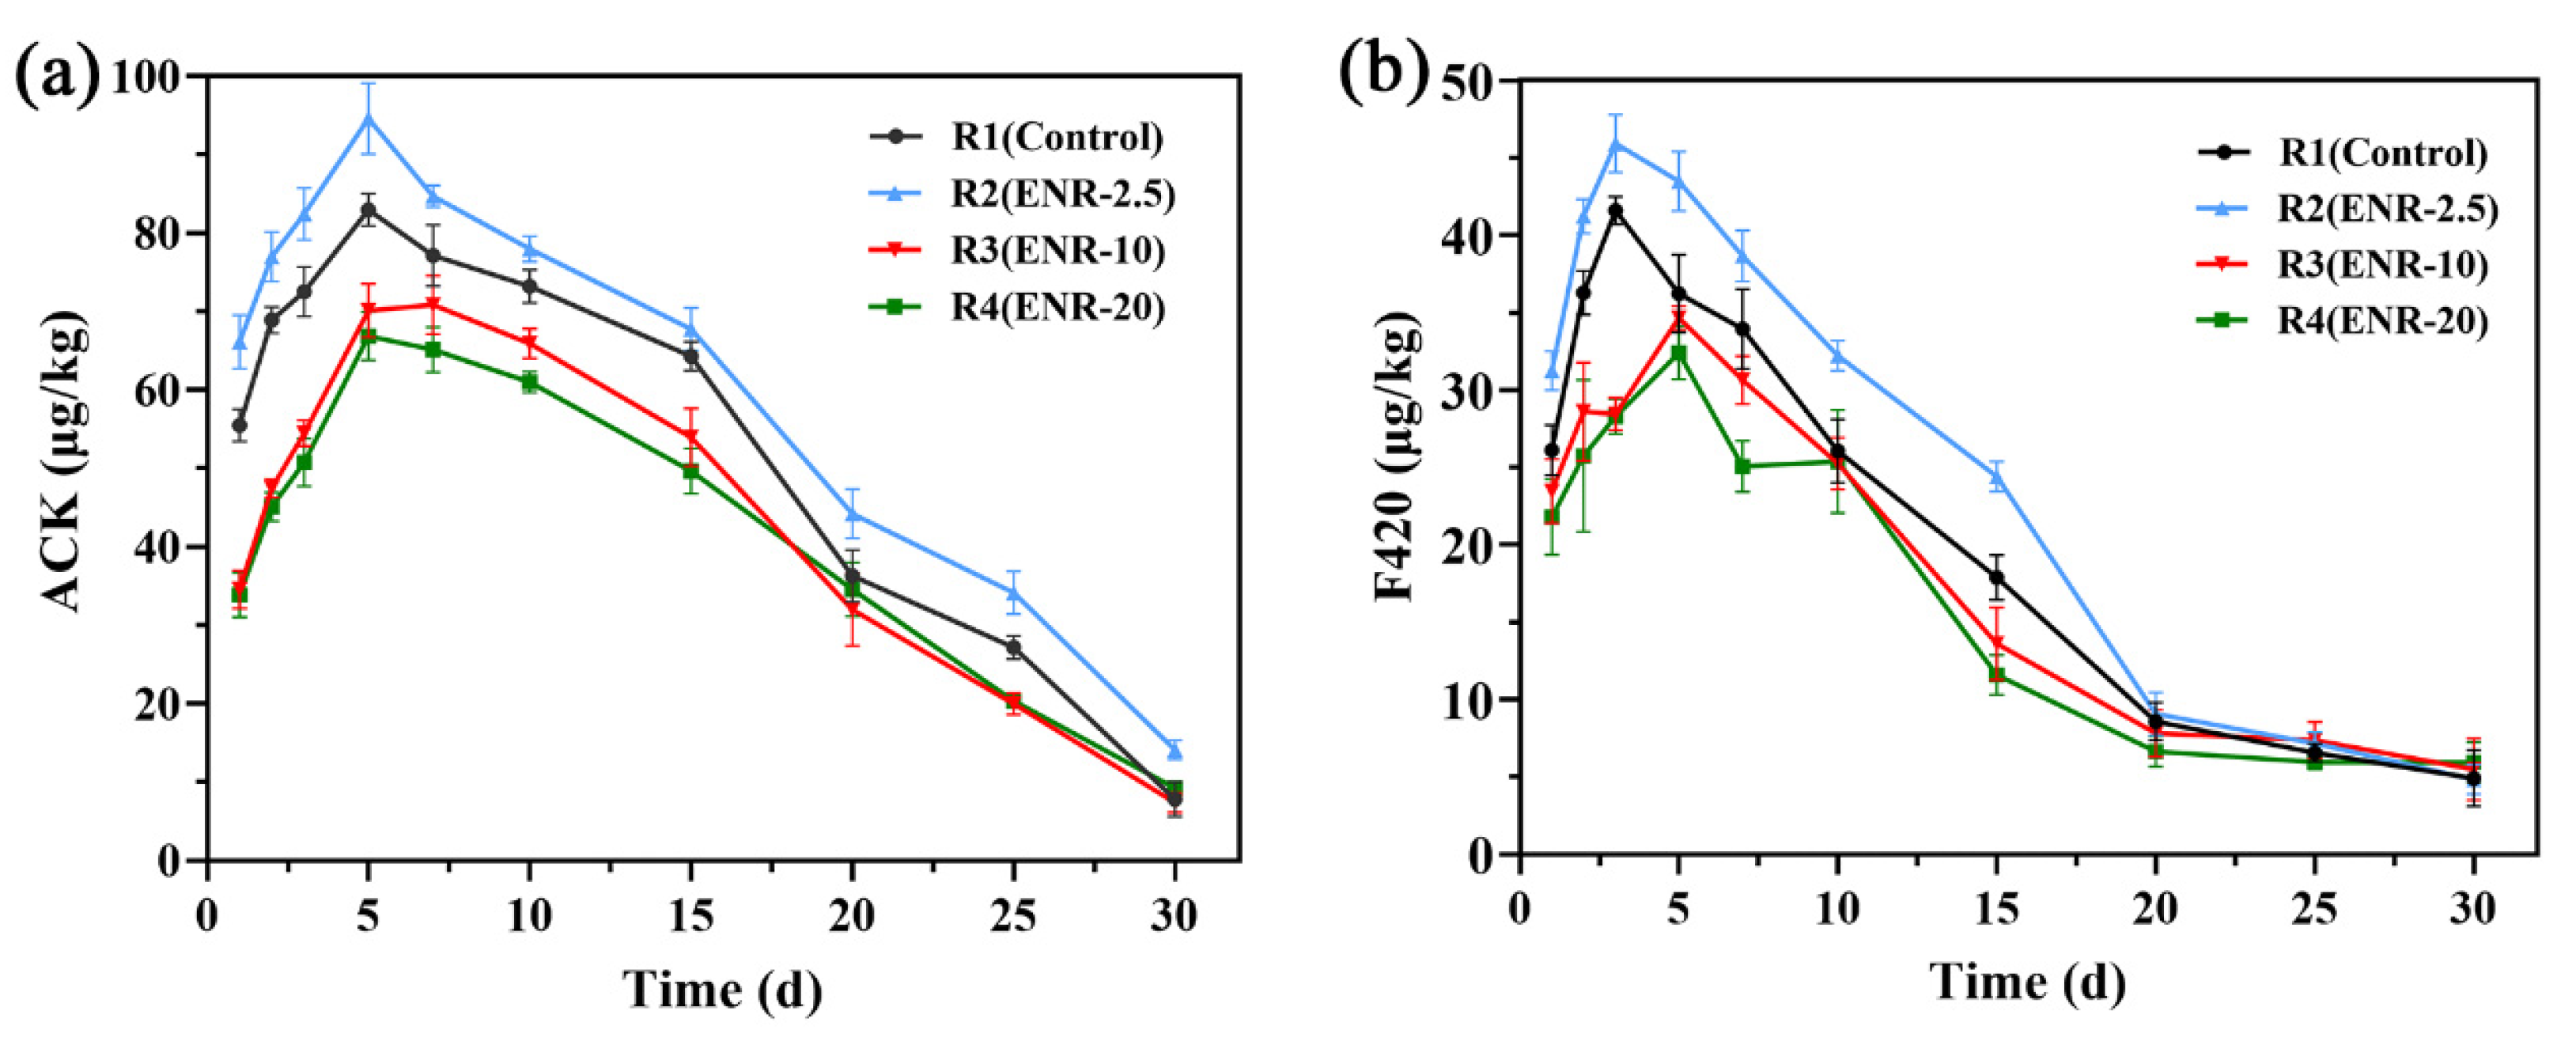
3.5. Enzyme Activity

The AD of agricultural wastewater involves a variety of microorganisms including fermentation bacteria, acid-producing bacteria, and various methanogens that produce extracellular hydrolase, ACK, and coenzyme F420 to participate in the digestion process [59]. The concentrations of the ACK and enzyme F420 in the digested sludge were measured and are shown in Figure 6.
The concentration of ACK and F420 of R2 stayed ahead for most of the time, followed by R1, and then R3 and R4. The ACK concentration of all four groups increased initially, reached the maximum on the fifth day, and then decreased. Combined with Figure 2, the ACK concentration is highly consistent with the changes in the acetic acid and propionic acid content in VFAs. On the fifth day, the concentration of acetic acid in R2 (2063.12 mg/L) was 2.2 times that of R1 (953.62 mg/L), while the content of propionic acid in R2 (3367.85 mg/L) was reduced by 19.41% compared to R1 (4179.02 mg/L). Moreover, the changing trend of F420 concentration was consistent with that of the ACK levels, the difference is that it reaches its maximum value on the third day. The rapid increase in daily CH4 yield (Figure 1a) was associated with a rapid increase in the concentration of coenzyme F420. At the peak of methane production (day 3), R2 (45.93 μg/kg) was significantly higher than R3 (28.45 μg/kg) and R4 (28.28 μg/kg), and the concentration of F420 increased by 61.44% and 63.41%, respectively.
The levels of ACK in an AD system could indicate the acidification rate of organic matter as well as the methane conversion rate of acetic acid [60,61]. The ACK concentration of R2 remained highest throughout the entire experimental cycle, further supporting the notion that a low level of ENR in the system (2.5 mg/L) promoted the activities of ACK, which was consistent with the observation of R2 displaying the highest proportion of acetic acid during the period of peak gas production. Conversely, higher concentrations of ENR (10 mg/L and 20 mg/L) inhibited the activity of acetogens, resulting in decreased acetic acid and methane production rates. Coenzyme F420, an electron carrier, occurs in various methanogenic archaea and is mainly involved in methane synthesis in the methanogenic stage; therefore, it can be used as an index of AD process efficiency. Thus, methane production was positively correlated with the coenzyme F420 concentration; the higher the activity of coenzyme F420, the higher the rate of methane production, i.e., the higher the AD process efficiency [62].
The change in enzyme activity confirmed that the addition of ENR stimulated the activity of key enzymes. Low concentrations of ENR promoted enzyme production and significantly increased methane production, while high concentrations of ENR inhibited this process, and as the concentration increased, the inhibitory effect increased.

4. Conclusions

ENR had a dose-dependent effect on the anaerobic co-digestion of PM and CSP. The low concentration of ENR (2.5 mg/L) significantly improved the operational efficiency of AD, which proved to be a 47.58% increase in total methane production. In addition, Rikenellaceae is a genus that specifically degrades propionate, and the abundance of R2 (9.93%) was significantly higher than that of R1 (6.18%), helping to alleviate the adverse effects of propionate accumulation. The accumulation of propionic acid was the lowest in the first 10 days of the experiment, the levels of ACK and coenzyme F420 were the highest, and the organic matter degradation rate in R2 (43.51%) was also higher than that in control R1 (40.26%). However, ENR at 10 mg/L and 20 mg/L was detrimental to AD because the increase in ENR concentration led to excessive protein hydrolysis in EPS, which in turn resulted in a marked increase in propionic acid content in the R3 and R4 groups and suppressed methane production. Furthermore, ENR of 2.5 mg/L had a positive effect on microbial community diversity. The species and proportion of dominant bacteria genera in R1 (control) and R2 (2.5 mg/L ENR) were highly similar. Proteiniphilum was the dominant bacterial genus, displaying significantly higher abundance in R2 (30.49%) than in R3 (17.05%) and R4 (13.83%). These results provide a theoretical basis and reference for the further study of anaerobic co-digestion of agricultural wastewater containing ENR. Considering the environmental risk of ENR, future work should focus on the degradation products of ENR and clarify the specific pathways in which ENR participates in metabolism.

Supplementary Materials

The following supporting information can be downloaded at: https://www.mdpi.com/article/10.3390/su14105894/s1, Figure S1. Detailed diagram of experimental reactors. Figure S2. Changes in polysaccharide concentration (day 1–30) of R1 (control group); R2 (with 2.5 mg/L ENR addition); R3 (with 10 mg/L ENR addition); R4 (with 20 mg/L ENR addition). Figure S3. Changes in protein concentration (day 1–30) of R1 (control group); R2 (with 2.5 mg/L ENR addition); R3 (with 10 mg/L ENR addition); R4 (with 20 mg/L ENR addition). Table S1. Main properties of substrates and inoculum.

Author Contributions

Q.S.: methodology, conceptualization, software, data curation, writing—original draft, visualization. H.C.: methodology, software, investigation. X.C.: software, methodology. J.W.: software, validation. Z.D.: software. J.H.: investigation. Z.Z.: writing—review and editing X.L.: supervision, writing—review and editing, conceptualization. All authors have read and agreed to the published version of the manuscript.

Funding

The research was financially supported by the National Major Science and Technology Program for Water Pollution Control and Treatment (Grant No. 2017ZX07602-001) and a donation from ABA chemicals.

Institutional Review Board Statement

Not applicable.

Informed Consent Statement

Not applicable.

Data Availability Statement

Not applicable.

Conflicts of Interest

The authors declare no conflict of interest.

References

  1. Cheng, D.L.; Ngo, H.H.; Guo, W.S.; Liu, Y.W.; Zhou, J.L.; Chang, S.W.; Nguyen, D.D.; Bui, X.T.; Zhang, X.B. Bioprocessing for elimination antibiotics and hormones from swine wastewater. Sci. Total Environ. 2018, 621, 1664–1682. [Google Scholar] [CrossRef] [PubMed]
  2. Mao, C.L.; Feng, Y.Z.; Wang, X.J.; Ren, G.X. Review on research achievements of biogas from anaerobic digestion. Renew. Sustain. Energy Rev. 2015, 45, 540–555. [Google Scholar] [CrossRef]
  3. Hao, X.D.; Liu, R.B.; Huang, X. Evaluation of the potential for operating carbon neutral WWTPs in China. Water Res. 2015, 87, 424–431. [Google Scholar] [CrossRef] [PubMed]
  4. Guo, M.X.; Song, W.P.; Buhain, J. Bioenergy and biofuels: History, status, and perspective. Renew. Sustain. Energy Rev. 2015, 42, 712–725. [Google Scholar] [CrossRef]
  5. Sui, Q.W.; Zhang, J.Y.; Tong, J.; Chen, M.X.; Wei, Y.S. Seasonal variation and removal efficiency of antibiotic resistance genes during wastewater treatment of swine farms. Environ. Sci. Pollut. Res. 2017, 24, 9048–9057. [Google Scholar] [CrossRef]
  6. Yin, F.B.; Dong, H.M.; Zhang, W.Q.; Zhu, Z.P.; Shang, B. Antibiotic degradation and microbial community structures during acidification and methanogenesis of swine manure containing chlortetracycline or oxytetracycline. Bioresour. Technol. 2018, 250, 247–255. [Google Scholar] [CrossRef]
  7. Tao, C.W.; Hsu, B.M.; Ji, W.T.; Hsu, T.K.; Kao, P.M.; Hsu, C.P.; Shen, S.M.; Shen, T.Y.; Wan, T.J.; Huang, Y.L. Evaluation of five antibiotic resistance genes in wastewater treatment systems of swine farms by real-time PCR. Sci. Total Environ. 2014, 496, 116–121. [Google Scholar] [CrossRef]
  8. Zheng, W.; Zhang, Z.Y.; Liu, R.; Lei, Z.F. Removal of veterinary antibiotics from anaerobically digested swine wastewater using an intermittently aerated sequencing batch reactor. J. Environ. Sci. 2018, 65, 8–17. [Google Scholar] [CrossRef]
  9. Zhang, Q.Q.; Ying, G.G.; Pan, C.G.; Liu, Y.S.; Zhao, J.L. Comprehensive Evaluation of Antibiotics Emission and Fate in the River Basins of China: Source Analysis, Multimedia Modeling, and Linkage to Bacterial Resistance. Environ. Sci. Technol. 2015, 49, 6772–6782. [Google Scholar] [CrossRef]
  10. Aydin, S.; Ince, B.; Ince, O. Assessment of anaerobic bacterial diversity and its effects on anaerobic system stability and the occurrence of antibiotic resistance genes. Bioresour. Technol. 2016, 207, 332–338. [Google Scholar] [CrossRef]
  11. Zhang, J.Y.; Wang, Z.Y.; Wang, Y.W.; Zhong, H.; Sui, Q.W.; Zhang, C.P.; Wei, Y.S. Effects of graphene oxide on the performance, microbial community dynamics and antibiotic resistance genes reduction during anaerobic digestion of swine manure. Bioresour. Technol. 2017, 245, 850–859. [Google Scholar] [CrossRef] [PubMed]
  12. Zhao, L.; Dong, Y.H.; Wang, H. Residues of veterinary antibiotics in manures from feedlot livestock in eight provinces of China. Sci. Total Environ. 2010, 408, 1069–1075. [Google Scholar] [CrossRef] [PubMed]
  13. Sanz, J.L.; Rodriguez, N.; Amils, R. The action of antibiotics on the anaerobic digestion process. Appl. Microbiol. Biotechnol. 1996, 46, 587–592. [Google Scholar] [CrossRef] [PubMed]
  14. Bauer, A.; Lizasoain, J.; Nettmann, E.; Bergmann, I.; Mundt, K.; Klocke, M.; Rincon, M.; Amon, T.; Piringer, G. Effects of the antibiotics chlortetracycline and enrofloxacin on the anaerobic digestion in continuous experiments. Bioenergy Res. 2014, 7, 1244–1252. [Google Scholar] [CrossRef]
  15. Xie, W.Y.; Shen, Q.; Zhao, F.J. Antibiotics and antibiotic resistance from animal manures to soil: A review. Eur. J. Soil Sci. 2018, 69, 181–195. [Google Scholar] [CrossRef] [Green Version]
  16. Burboa-Charis, V.A.; Alvarez, L.H. Methane production from antibiotic bearing swine wastewater using carbon-based materials as electrons’ conduits during anaerobic digestion. Int. J. Energy Res. 2020, 44, 10996–11005. [Google Scholar] [CrossRef]
  17. Koniuszewska, I.; Harnisz, M.; Korzeniewska, E.; Czatzkowska, M.; Jastrzebski, J.P.; Paukszto, L.; Bajkacz, S.; Felis, E.; Rusanowska, P. The effect of antibiotics on mesophilic anaerobic digestion process of cattle manure. Energies 2021, 14, 1125. [Google Scholar] [CrossRef]
  18. Madariaga, S.T.; Marin, S.L. Sanitary and environmental conditions of aquaculture sludge. Aquac. Res. 2017, 48, 1744–1750. [Google Scholar] [CrossRef]
  19. Beneragama, N.; Lateef, S.A.; Iwasaki, M.; Yamashiro, T.; Umetsu, K. The combined effect of cefazolin and oxytertracycline on biogas production from thermophilic anaerobic digestion of dairy manure. Bioresour. Technol. 2013, 133, 23–30. [Google Scholar] [CrossRef]
  20. Zhou, M.M.; Yan, B.H.; Wong, J.W.C.; Zhang, Y. Enhanced volatile fatty acids production from anaerobic fermentation of food waste: A mini-review focusing on acidogenic metabolic pathways. Bioresour. Technol. 2018, 248, 68–78. [Google Scholar] [CrossRef]
  21. Cetecioglu, Z.; Ince, B.; Gros, M.; Rodriguez-Mozaz, S.; Barcelo, D.; Ince, O.; Orhon, D. Biodegradation and reversible inhibitory impact of sulfamethoxazole on the utilization of volatile fatty acids during anaerobic treatment of pharmaceutical industry wastewater. Sci. Total Environ. 2015, 536, 667–674. [Google Scholar] [CrossRef] [PubMed]
  22. Gou, M.; Wang, H.H.; Li, J.; Sun, Z.Y.; Nie, Y.; Nobu, M.K.; Tang, Y.Q. Different inhibitory mechanisms of chlortetracycline and enrofloxacin on mesophilic anaerobic degradation of propionate. Environ. Sci. Pollut. Res. 2020, 27, 1406–1416. [Google Scholar] [CrossRef] [PubMed]
  23. Dreher, T.M.; Mott, H.V.; Lupo, C.D.; Oswald, A.S.; Clay, S.A.; Stone, J.J. Effects of chlortetracycline amended feed on anaerobic sequencing batch reactor performance of swine manure digestion. Bioresour. Technol. 2012, 125, 65–74. [Google Scholar] [CrossRef] [PubMed]
  24. Huang, X.D.; Xu, Q.X.; Wu, Y.X.; Wang, D.B.; Yang, Q.; Chen, F.; Wu, Y.; Pi, Z.J.; Chen, Z.; Li, X.M.; et al. Effect of clarithromycin on the production of volatile fatty acids from waste activated sludge anaerobic fermentation. Bioresour. Technol. 2019, 288, 121598. [Google Scholar] [CrossRef]
  25. Loftin, K.A.; Henny, C.; Adams, C.D.; Surampali, R.; Mormile, M.R. Inhibition of microbial metabolism in anaerobic lagoons by selected sulfonamides, tetracyclines, lincomycin, and tylosin tartrate. Environ. Toxicol. Chem. 2005, 24, 782–788. [Google Scholar] [CrossRef]
  26. McInerney, M.J.; Sieber, J.R.; Gunsalus, R.P. Syntrophy in anaerobic global carbon cycles. Curr. Opin. Biotechnol. 2009, 20, 623–632. [Google Scholar] [CrossRef] [Green Version]
  27. Venkiteshwaran, K.; Bocher, B.; Maki, J.; Zitomer, D. Relating anaerobic digestion microbial community and process function. Microbiol. Insights 2015, 8, 37–44. [Google Scholar] [CrossRef] [Green Version]
  28. American Public Health Association (APHA): Washington DC, USA, 2012. 22nd Edition. Available online: https://www.scirp.org/(S(351jmbntvnsjt1aadkposzje))/reference/ReferencesPapers.aspx?ReferenceID=1982598 (accessed on 1 March 2022).
  29. Li, X.Y.; Yang, S.F. Influence of loosely bound extracellular polymeric substances (EPS) on the flocculation, sedimentation and dewaterability of activated sludge. Water Res. 2007, 41, 1022–1030. [Google Scholar] [CrossRef]
  30. Yu, H.R.; Qu, F.S.; Sun, L.P.; Liang, H.; Han, Z.S.; Chang, H.Q.; Shao, S.L.; Li, G.B. Relationship between soluble microbial products (SMP) and effluent organic matter (EfOM): Characterized by fluorescence excitation emission matrix coupled with parallel factor analysis. Chemosphere 2015, 121, 101–109. [Google Scholar] [CrossRef]
  31. Frolund, B.; Griebe, T.; Nielsen, P.H. Enzymatic-Activity in the activated-sludge floc matrix. Appl. Microbiol. Biotechnol. 1995, 43, 755–761. [Google Scholar] [CrossRef]
  32. Bashiri, G.; Rehan, A.M.; Greenwood, D.R.; Dickson, J.M.; Baker, E.N. Metabolic engineering of cofactor F420 production in Mycobacterium smegmatis. PLoS ONE 2010, 5, e15803. [Google Scholar] [CrossRef] [PubMed] [Green Version]
  33. Luo, J.Y.; Chen, Y.G.; Feng, L.Y. Polycyclic Aromatic Hydrocarbon Affects Acetic Acid Production during Anaerobic Fermentation of Waste Activated Sludge by Altering Activity and Viability of Acetogen. Environ. Sci. Technol. 2016, 50, 6921–6929. [Google Scholar] [CrossRef] [PubMed]
  34. Linton, R.H.; Carter, W.H.; Pierson, M.D.; Hackney, C.R. Use of a modified Gompertz Equation to model nonlinear survival curves for Listeria Monocytogenes Scott A. J. Food Prot. 1995, 58, 946–954. [Google Scholar] [CrossRef] [PubMed]
  35. Angenent, L.T.; Mau, M.; George, U.; Zahn, J.A.; Raskin, L. Effect of the presence of the antimicrobial tylosin in swine waste on anaerobic treatment. Water Res. 2008, 42, 2377–2384. [Google Scholar] [CrossRef]
  36. Kohanski, M.A.; Dwyer, D.J.; Collins, J.J. How antibiotics kill bacteria: From targets to networks. Nat. Rev. Microbiol. 2010, 8, 423–435. [Google Scholar] [CrossRef] [Green Version]
  37. Boe, K.; Batstone, D.J.; Steyer, J.P.; Angelidaki, I. State indicators for monitoring the anaerobic digestion process. Water Res. 2010, 44, 5973–5980. [Google Scholar] [CrossRef]
  38. Lu, M.Q.; Niu, X.J.; Liu, W.; Zhang, J.; Wang, J.; Yang, J.; Wang, W.Q.; Yang, Z.Q. Biogas generation in anaerobic wastewater treatment under tetracycline antibiotic pressure. Sci. Rep. 2016, 6, 28336. [Google Scholar] [CrossRef] [Green Version]
  39. Wang, W.; Xie, L.; Luo, G.; Zhou, Q.; Lu, Q. Optimization of biohydrogen and methane recovery within a cassava ethanol wastewater/waste integrated management system. Bioresour. Technol. 2012, 120, 165–172. [Google Scholar] [CrossRef]
  40. Stams, A.J.M.; Sousa, D.Z.; Kleerebezem, R.; Plugge, C.M. Role of syntrophic microbial communities in high-rate methanogenic bioreactors. Water Sci. Technol. 2012, 66, 352–362. [Google Scholar] [CrossRef]
  41. Stone, J.J.; Clay, S.A.; Zhu, Z.W.; Wong, K.L.; Porath, L.R.; Spellman, G.M. Effect of antimicrobial compounds tylosin and chlortetracycline during batch anaerobic swine manure digestion. Water Res. 2009, 43, 4740–4750. [Google Scholar] [CrossRef]
  42. Lin, C.Y.; Chou, J.; Lee, Y.S. Heavy metal-affected degradation of butyric acid in anaerobic digestion. Bioresour. Technol. 1998, 65, 159–161. [Google Scholar] [CrossRef]
  43. Lins, P.; Reitschuler, C.; Illmer, P. Impact of several antibiotics and 2-bromoethanesulfonate on the volatile fatty acid degradation, methanogenesis and community structure during thermophilic anaerobic digestion. Bioresour. Technol. 2015, 190, 148–158. [Google Scholar] [CrossRef] [PubMed]
  44. Ji, J.Y.; Xing, Y.J.; Ma, Z.T.; Zhang, M.; Zheng, P. Acute toxicity of pharmaceutical wastewaters containing antibiotics to anaerobic digestion treatment. Chemosphere 2013, 91, 1094–1098. [Google Scholar] [CrossRef] [PubMed]
  45. Steyer, J.P.; Bouvier, J.C.; Conte, T.; Gras, P.; Harmand, J.; Delgenes, J.P. On-line measurements of COD, TOC, VFA, total and partial alkalinity in anaerobic digestion processes using infra-red spectrometry. Water Sci. Technol. 2002, 45, 133–138. [Google Scholar] [CrossRef]
  46. Luo, J.Y.; Zhang, Q.; Zha, J.N.; Wu, Y.; Wu, L.J.; Li, H.; Tang, M.; Sun, Y.Q.; Guo, W.; Feng, Q.; et al. Potential influences of exogenous pollutants occurred in waste activated sludge on anaerobic digestion: A review. J. Hazard. Mater. 2020, 383, 121176. [Google Scholar] [CrossRef]
  47. Li, X.; Dai, X.; Takahashi, J.; Li, N.; Jin, J.; Dai, L.; Dong, B. New insight into chemical changes of dissolved organic matter during anaerobic digestion of dewatered sewage sludge using EEM-PARAFAC and two-dimensional FTIR correlation spectroscopy. Bioresour. Technol. 2014, 159, 412–420. [Google Scholar] [CrossRef]
  48. Xu, Q.X.; Liu, X.R.; Zhao, J.W.; Wang, D.B.; Wang, Q.L.; Li, X.M.; Yang, Q.; Zeng, G.M. Feasibility of enhancing short-chain fatty acids production from sludge anaerobic fermentation at free nitrous acid pretreatment: Role and significance of Tea saponin. Bioresour. Technol. 2018, 254, 194–202. [Google Scholar] [CrossRef]
  49. Ma, Y.Q.; Gu, J.; Liu, Y. Evaluation of anaerobic digestion of food waste and waste activated sludge: Soluble COD versus its chemical composition. Sci. Total Environ. 2018, 643, 21–27. [Google Scholar] [CrossRef]
  50. Wang, Y.L.; Wang, D.B.; Liu, Y.W.; Wang, Q.L.; Chen, F.; Yang, Q.; Li, X.M.; Zeng, G.M.; Li, H.L. Triclocarban enhances short-chain fatty acids production from anaerobic fermentation of waste activated sludge. Water Res. 2017, 127, 150–161. [Google Scholar] [CrossRef]
  51. Sheng, G.P.; Yu, H.Q.; Li, X.Y. Extracellular polymeric substances (EPS) of microbial aggregates in biological wastewater treatment systems: A review. Biotechnol. Adv. 2010, 28, 882–894. [Google Scholar] [CrossRef]
  52. Zhang, H.Q.; Jia, Y.Y.; Khanal, S.K.; Lu, H.; Fang, H.T.; Zhao, Q. Understanding the role of extracellular polymeric substances on ciprofloxacin adsorption in aerobic sludge, anaerobic sludge, and sulfate-reducing bacteria sludge systems. Environ. Sci. Technol. 2018, 52, 6476–6486. [Google Scholar] [CrossRef] [PubMed]
  53. Sharp, C.E.; Brady, A.L.; Sharp, G.H.; Grasby, S.E.; Stott, M.B.; Dunfield, P.F. Humboldt’s spa: Microbial diversity is controlled by temperature in geothermal environments. ISME J. 2014, 8, 1166–1174. [Google Scholar] [CrossRef] [PubMed] [Green Version]
  54. Huang, S.Z.; Song, Q.X.; Li, Q.; Zhang, H.; Luo, X.Z.; Zheng, Z. Damage of heavy metals to Vallisneria natans (V. natans) and characterization of microbial community in biofilm. Aquat. Toxicol. 2020, 225, 105515. [Google Scholar] [CrossRef] [PubMed]
  55. Cheng, Z.; Hu, X.; Sun, Z.R. Microbial community distribution and dominant bacterial species analysis in the bio-electrochemical system treating low concentration cefuroxime. Chem. Eng. J. 2016, 303, 137–144. [Google Scholar] [CrossRef]
  56. Ariesyady, H.D.; Ito, T.; Okabe, S. Functional bacterial and archaeal community structures of major trophic groups in a full-scale anaerobic sludge digester. Water Res. 2007, 41, 1554–1568. [Google Scholar] [CrossRef] [PubMed]
  57. Deng, Y.Y.; Huang, Z.X.; Ruan, W.Q.; Miao, H.F.; Shi, W.S.; Zhao, M.X. Enriching ruminal polysaccharide-degrading consortia via co-inoculation with methanogenic sludge and microbial mechanisms of acidification across lignocellulose loading gradients. Appl. Microbiol. Biotechnol. 2018, 102, 3819–3830. [Google Scholar] [CrossRef]
  58. Lee, J.; Koo, T.; Yulisa, A.; Hwang, S. Magnetite as an enhancer in methanogenic degradation of volatile fatty acids under ammonia-stressed condition. J. Environ. Manag. 2019, 241, 418–426. [Google Scholar] [CrossRef]
  59. Whiteley, C.G.; Enongene, G.; Pletschke, B.I.; Rose, P.; Whittington-Jones, K. Co-digestion of primary sewage sludge and industrial wastewater under anaerobic sulphate reducing conditions: Enzymatic profiles in a recycling sludge bed reactor. Water Sci. Technol. 2003, 48, 129–138. [Google Scholar] [CrossRef]
  60. Miao, H.F.; Lu, M.F.; Zhao, M.X.; Huang, Z.X.; Ren, H.Y.; Yan, Q.; Ruan, W.Q. Enhancement of Taihu blue algae anaerobic digestion efficiency by natural storage. Bioresour. Technol. 2013, 149, 359–366. [Google Scholar] [CrossRef]
  61. Mu, H.; Chen, Y.G.; Xiao, N.D. Effects of metal oxide nanoparticles (TiO2, Al2O3, SiO2 and ZnO) on waste activated sludge anaerobic digestion. Bioresour. Technol. 2011, 102, 10305–10311. [Google Scholar] [CrossRef]
  62. Zhang, M.; Fan, Z.J.; Hu, Z.D.; Luo, X.Z. Enhanced anaerobic digestion with the addition of chelator-nickel complexes to improve nickel bioavailability. Sci. Total Environ. 2021, 759, 143458. [Google Scholar] [CrossRef] [PubMed]
Figure 1. Effect of R1 (Control group), R2 (with 2.5 mg/L ENR addition), R3 (with 10 mg/L ENR addition), and R4 (with 20 mg/L ENR addition) on (a) daily CH4 yield; (b) cumulative CH4 yield and the line used to fit the modified Gompertz equation.
Sustainability 14 05894 g001
Figure 2. Changes of volatile fatty acids (VFAs) components in (a) R1 (Control group); (b) R2 (with 2.5 mg/L ENR addition); (c) R3 (with 10 mg/L ENR addition); (d) R4 (with 20 mg/L ENR addition).
Sustainability 14 05894 g002
Figure 3. Changes in (a) pH and (b) total ammoniacal nitrogen (TAN) of R1 (control group); R2 (with 2.5 mg/L ENR addition); R3 (with 10 mg/L ENR addition); R4 (with 20 mg/L ENR addition).
Sustainability 14 05894 g003
Figure 4. Changes in total organic carbon (a) (TOC) concentration (days 1–3); (b) TOC concentration (days 1–30); (c) protein concentration (days 1–3); (d) polysaccharide concentration (days 1–3), and (e) concentration of protein and propionic acid (day 3) in four groups. (a, b in (a,ce) indicate whether there is a significant difference).
Sustainability 14 05894 g004
Figure 5. Microbial community analysis: (a) Venn diagram of the distribution of OTUs in different groups, and (b) percent of community abundance on genus level.
Sustainability 14 05894 g005
Figure 6. Changes of coenzymes throughout the reaction: (a) acetic acid kinase (ACK); (b) F420.
Sustainability 14 05894 g006
Table 1. Experimental design.
ReactorInoculum and SubstratesENR (mg/L)Abbreviation
R1+Control
R2+2.5ENR-2.5
R3+10ENR-10
R4+20ENR-20
Note: +: addition, −: no addition.
Table 2. Kinetic parameters were obtained from the modified Gompertz equation for methane production.
ReactorGmax
(mL CH4/g VS)
Rmax
(mL CH4/g VS/d)
λ (d)R2
R1 (Control)193.88 ± 1.3217.91 ± 0.870.21 ± 0.080.9850
R2 (ENR-2.5)284.55 ± 2.1123.87 ± 0.880.35 ± 0.140.9912
R3 (ENR-10)176.57 ± 1.8814.74 ± 0.720.12 ± 0.040.9841
R4 (ENR-20)153.84 ± 1.6318.02 ± 1.150.42 ± 0.260.9882
Table 3. Summary of microbial α diversity indices of the samples.
ReactorChaoShannonSimpsonGood’s Coverage
R1_3d1701.116.9300.97880.9955
R2_3d1891.877.3820.98540.9952
R3_3d1720.226.9830.98360.9957
R4_3d1619.776.8740.98260.9953
R1_30d1464.686.4100.94280.9968
R2_30d1526.696.8580.94350.9954
R3_30d1289.756.4660.93380.9955
R4_30d1209.176.4030.93120.9955
Publisher’s Note: MDPI stays neutral with regard to jurisdictional claims in published maps and institutional affiliations.

