Article

Identifying the Daily Activity Spaces of Older Adults Living in a High-Density Urban Area: A Study Using the Smartphone-Based Global Positioning System Trajectory in Shanghai

College of Architecture and Urban Planning, Tongji University, Shanghai 200092, China
*
Author to whom correspondence should be addressed.
Sustainability 2021, 13(9), 5003; https://doi.org/10.3390/su13095003
Submission received: 27 February 2021 / Revised: 20 April 2021 / Accepted: 22 April 2021 / Published: 29 April 2021
(This article belongs to the Special Issue Sustainable Transportation Planning and Policy)

Abstract

:
The characteristics of the built environment and the configuration of public facilities can affect the health and well-being of older adults. Recognizing the range of daily activities and understanding the utilization of public facilities among older adults has become essential in planning age-friendly communities. However, traditional methods are unable to provide large-scale objective measures of older adults’ travel behaviors. To address this issue, we used the smartphone-based global positioning system (GPS) trajectory to explore the activity spaces of 76 older adults in a high-density urban community in Shanghai for 102 consecutive days. We found that activity spaces are centered around older adults’ living communities, with 46.3% within a 1.5 km distance. The older adults’ daily activities are within a 15 min walking distance, and accessibility is the most important factor when making a travel choice to parks and public facilities. We also found that the travel range and spatial distribution of points of interest are different between age and gender groups. In addition, we found that using a concave hull with Alpha shape algorithm is more applicable and robust than the traditional convex hull algorithm. This is a unique case study in a high-density urban area with objective measures for assessing the activity spaces of older adults, thus providing empirical evidence for promoting healthy aging in cities.

1. Introduction

Activity space refers to the geographic coverage of individual daily travel behavior, and describes the places that people frequently visit and the routes people prefer to take [1]. This concept provides an objective measure of the spatial environment that individuals are exposed to and interact with [2]. Since a well-designed neighborhood can encourage older adults to engage in more outdoor activities, identifying activity spaces for these adults has become an essential part of the urban planning and design process. Activity space has been used not only in its traditional fields such as travel behavior, geography [3], and behavior science [4], but also in new fields including urban planning, criminology [5], health [6], and environmental exposure assessment [7]. A fundamental question in all those fields is how to accurately measure the range of activity [8].
Previous studies have used artificial borders, such as administrative units, census tracts, or traffic zones, for the aggregated analysis of activity space. By using this method, individuals are restricted to a certain geographic area for predicting their travel or activity demands. The discrepancies among the results from previous studies could be partly explained by the different unit areas [9]. For example, using a residential buffer with a manually defined radius (0.5 or 1 mile) [10] has been a prevalent approach in describing activity space [11], and can provide the approximate range of residents’ environmental exposure [12]. In addition, a street network buffer (within 0.5 and 1 km), based on walkability, was used to better reflect real daily activities [13,14,15]. Compared with home range buffers [16], individualized models are more effective for studying the association between space (e.g., green space) and health [12]. Previously, activity space was investigated by using self-report activity log diaries [17] and retrospective self-reported data [18]. However, this approach may lead to a low response rate and recall bias, especially among older adults [19]. Recently, data from mobile phone carriers were applied to analyze human mobility across a large district through information and communication technologies (ICTs) [20].
With the development of global positioning system (GPS) technology, the recording of individual movements is becoming increasingly popular for human behavior studies [21,22,23,24]. Since methods for GPS data collection and the identification of trajectories have become increasingly advanced, many researchers are now interested in using this technology for modeling travel behaviors. The Federal Communications Commission (FCC) of the United States required mobile phone operators to provide location services for users as early as in 1996. Since then, positioning technology in mobile phones has developed rapidly, accumulating massive travel data from mobile phone users. These travel data can be categorized into two types: mobile signaling data and GPS trajectory data. Specifically, mobile signaling data have been used to analyze large-scale spatial characteristics, such as travel behavior and employment distribution, among large populations. GPS trajectory data have advantages in precisely recording individuals’ behaviors, providing real-time location information, simulating travel routes, and predicting Points of Interest (POIs) [25]. The most commonly visited POIs are important in the planning and design process because they not only feature public service facilities that meet older adults’ daily needs but also include places that attract people to stay, such as green spaces, road corners, playgrounds, and entrances to communities. Understanding the use of POIs would be helpful to plan supporting facilities of a reasonable type with a reasonable scale and site selection that can encourage more healthy behaviors among older adults. However, POIs have not been widely used in urban planning and urban studies because of the challenges in big-data collection, analysis, and application.
The urban system is complicated. Planners needs to take social, economic, and environmental governance into consideration when designing spaces. Beyond following existing standards to distribute infrastructure (e.g., roads and public facilities), planners should also focus on people, by prioritizing their needs and expectations. Traditional planning processes usually feature limited considerations of age and gender differences, leading to the possibility that the planned service performance may not be guaranteed. Therefore, identifying built environment issues by analyzing individuals’ travel behaviors and spatial utilizations is essential. However, traditional travel surveys using questionnaires or interviews, as well as field observations, have limitations in terms of reflecting the spatial and temporal changes in some specific environmental factors, such as urban form and density, land use, and street design [26]. Innovative data collection and analysis methods are urgently needed.
In addition, the methods mentioned above should be adapted to older adults, who may have limited access to new technologies in their daily lives, to address their specific needs and challenges. For example, planners could optimize the allocation of space and infrastructure by understanding and predicting the daily activities and behaviors of older adults in their community. Moreover, planners could adjust the distribution of public services for older adults by determining the preferences among this age group. Using those evidence-based planning interventions, we will develop forward-looking and smart solutions for elderly-oriented facilities that promote healthy aging. A previous study showed that the aging population is more sensitive to the built environment than young people when deciding to walk or engage in other physical activities [27]. Another study in Beijing, China indicated that older adults mainly rely on walking for transportation in high-density urban areas [28]. Therefore, this research aims to identify the activity spaces and mobility needs among retired older adults via GPS tracking data and to determine what environmental factors contribute to the daily outdoor activities.

2. Methods

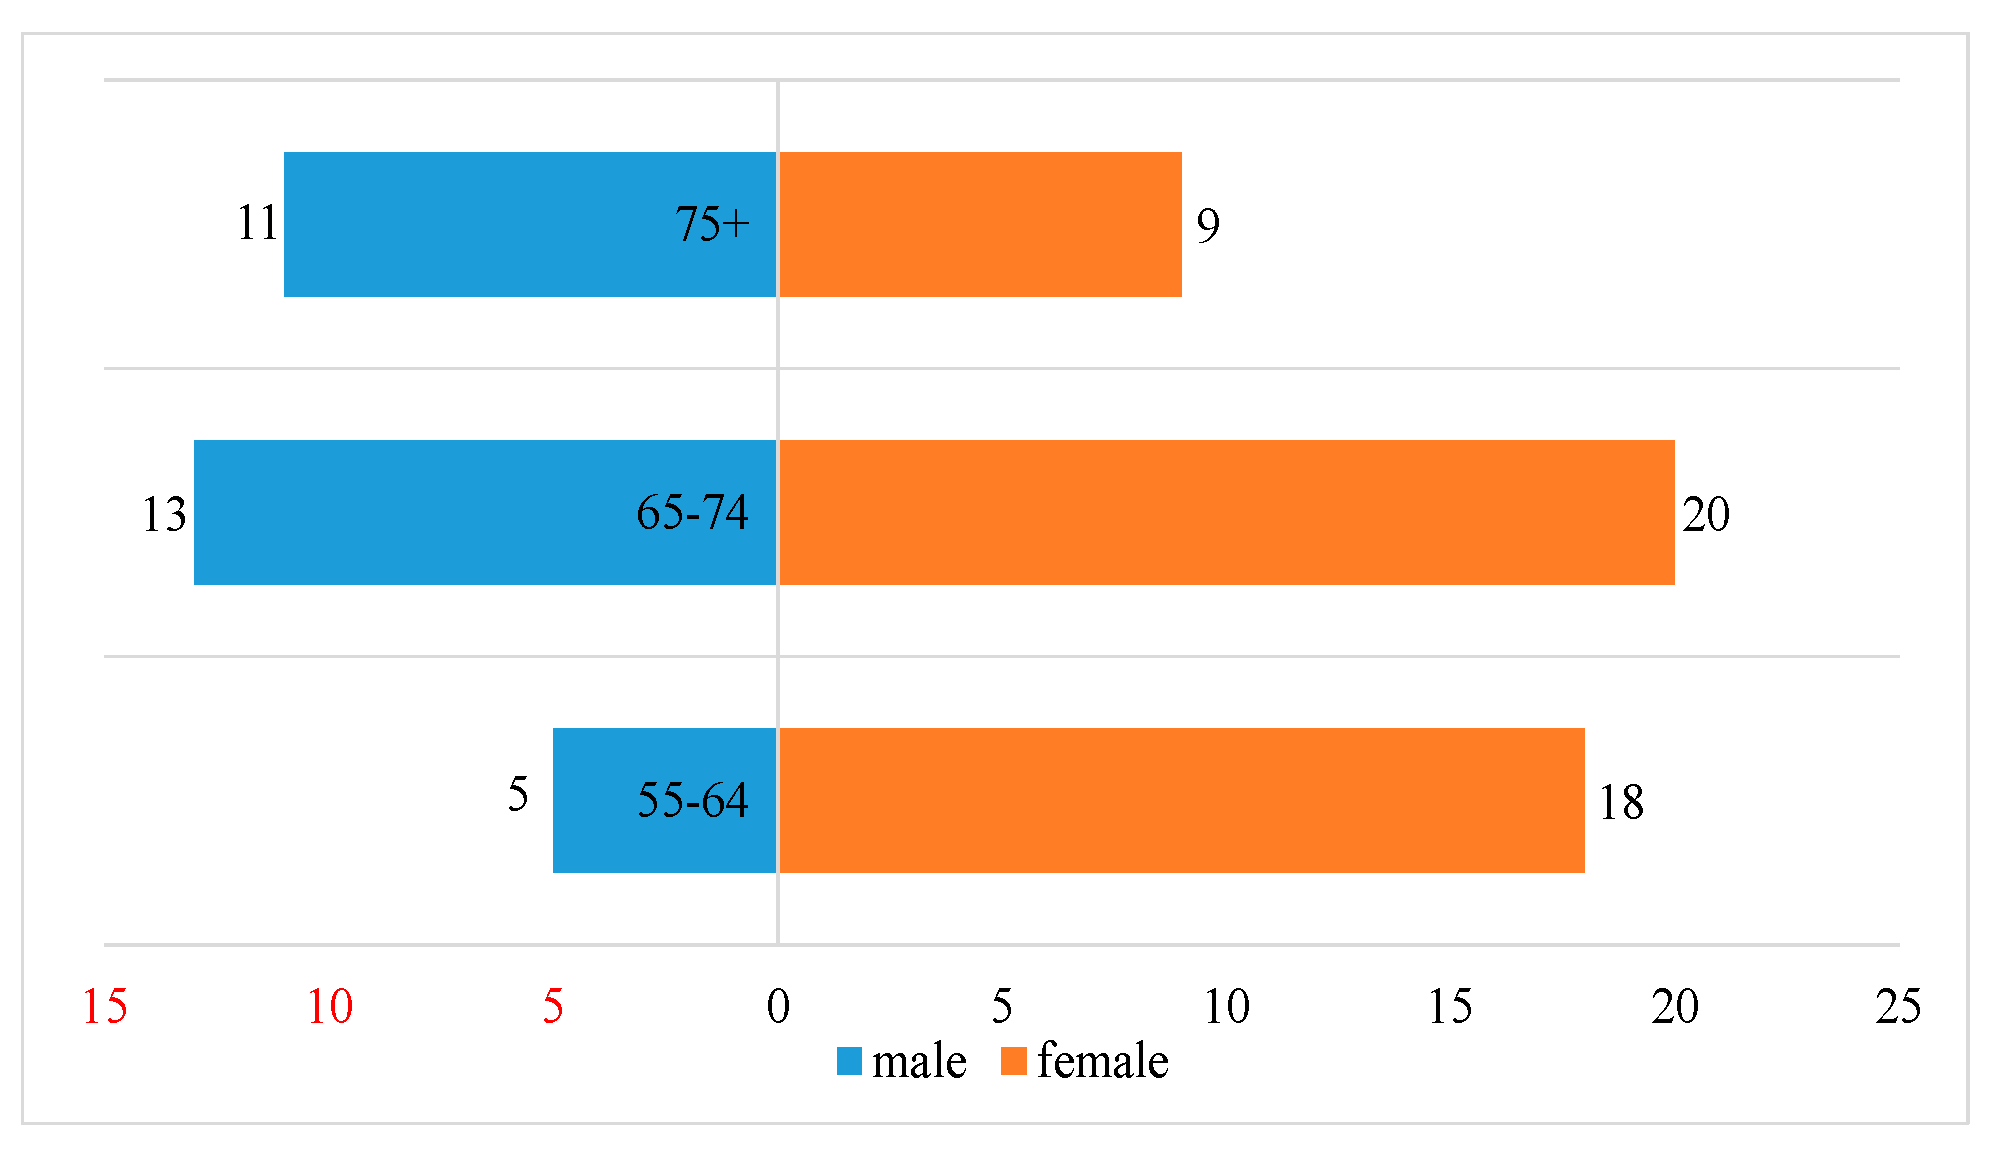
2.1. Study Site and Population

We selected the TJ New Village in Yangpu District, Shanghai (Figure 1) as the study site for the following four reasons. Firstly, this area is a typical public housing community that adopted a standardized housing design and community planning system. This type of community was built in large quantities across China from the 1950s to 1980s, laying the foundation to broaden the applicability of our findings. Secondly, these public houses have become the main targets of elderly-oriented renovations in Chinese urban communities since resident aging increased over the last half a decade. For example, more than one third (38%) of the residents are 60 years or older in our study site. Thirdly, the social and economic statuses of residents living in this community are very similar, which could reduce the socio-economic confounding factors that affect their travel behaviors and activity spaces. Finally, the study site is located in the high-density central area in Shanghai with sufficient support facilities in the surrounding environment. Therefore, older adults living in this community have more travel options, which increases the variation in our study outcomes.
We used the convenient sampling method to enroll as many participants as possible. We first sent enrollment information to each retired participant through the neighborhood committee. Then, potential participants were divided into groups by age and gender to represent different age and gender groups. Finally, we fully considered the building unit they are living within to make sure our participants are spatially evenly distributed in the community. Since we organized several meetings with the neighborhood committee to recruit participants in each building, older adults who frequently engaged with the neighborhood committee were more likely to be enrolled in this study. We invited 80 volunteers (55+) using the stratified random sampling approach. We chose the age of 55 because this is the retirement age for most Chinese workers. Four participants from different age/gender groups dropped out the experiment due to sickness, travel, or other personal reasons. Ultimately, we analyzed data from 76 participants (mean age = 70.1, SD = 7.7) (Figure 2). To test the interaction between older adults and their living built environment, we focused on older adults active in our study site and did not involve those who had physical disability, mental disorder or ill in bed. The study was conducted in accordance with the Declaration of Helsinki, and the protocol was approved by the Ethics Committee of Tongji University (Reference number: 2015yxy112).

2.2. Equipment for Data Collection

We used a Redmi Smartphone (Xiaomi Corporation, China) running the Android operating system to collect the data. By using the phone’s GPS+A-GPS location function, we developed software called “Community Residents’ Behavior Monitoring Software V1.0” (software copyright of National Copyright Administration of the People’s Republic of China: 201610014870.3) to record the activity trajectory of the participants. This software can receive GPS satellite location information and acquire location data in real time (Figure 3). Specifically, this software has two functional modules: (1) the GPS data acquisition and storage module, which records and stores location data and (2) a module to upload the stored GPS location data to the server. This software was pilot-tested and calibrated before the experiment.

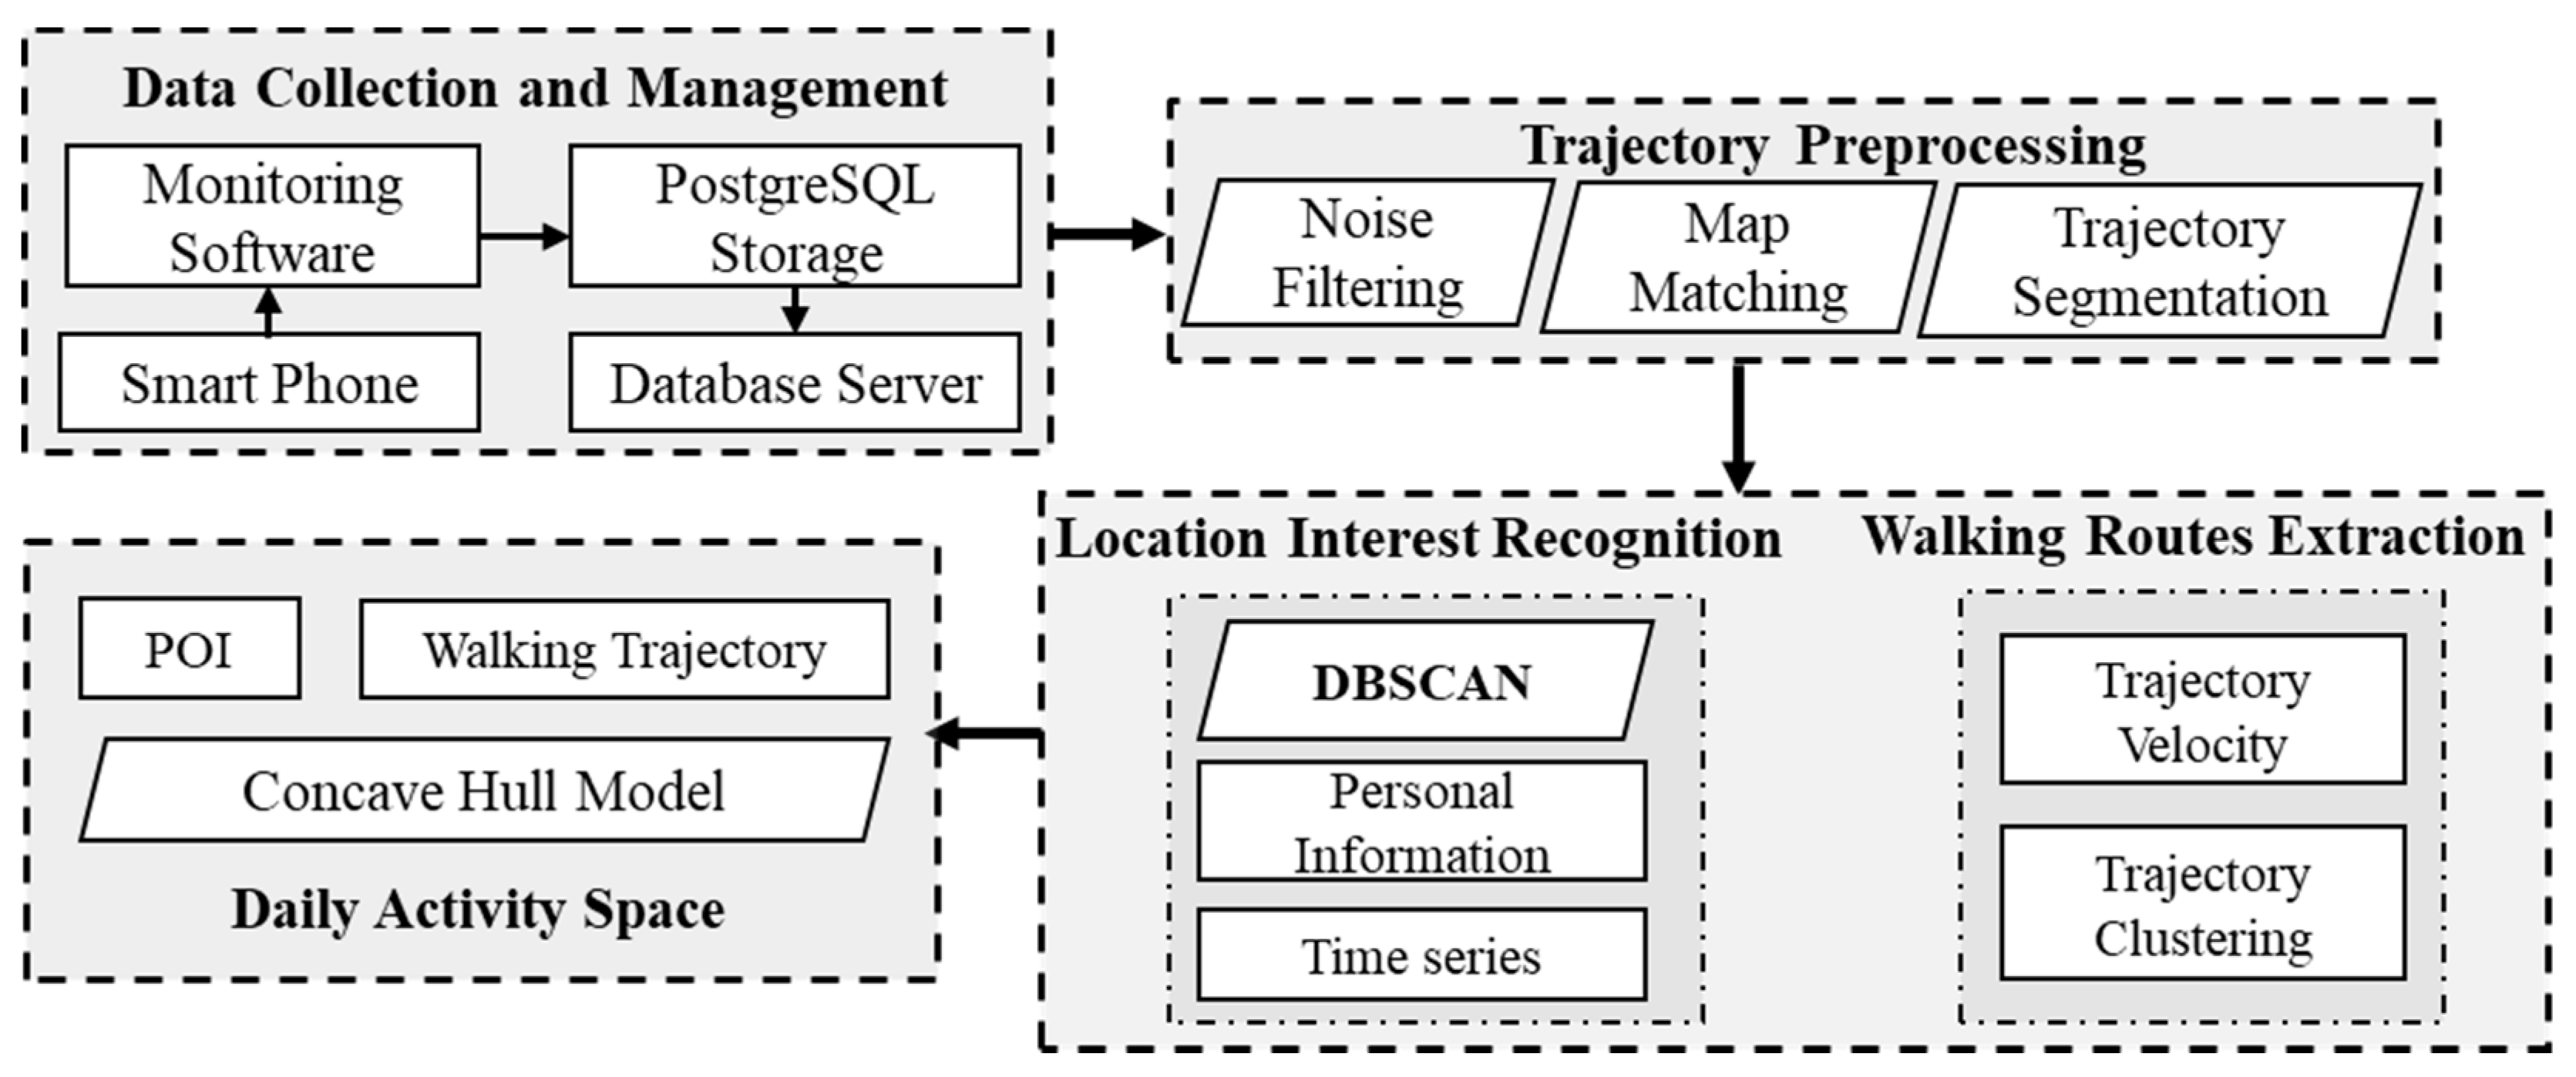
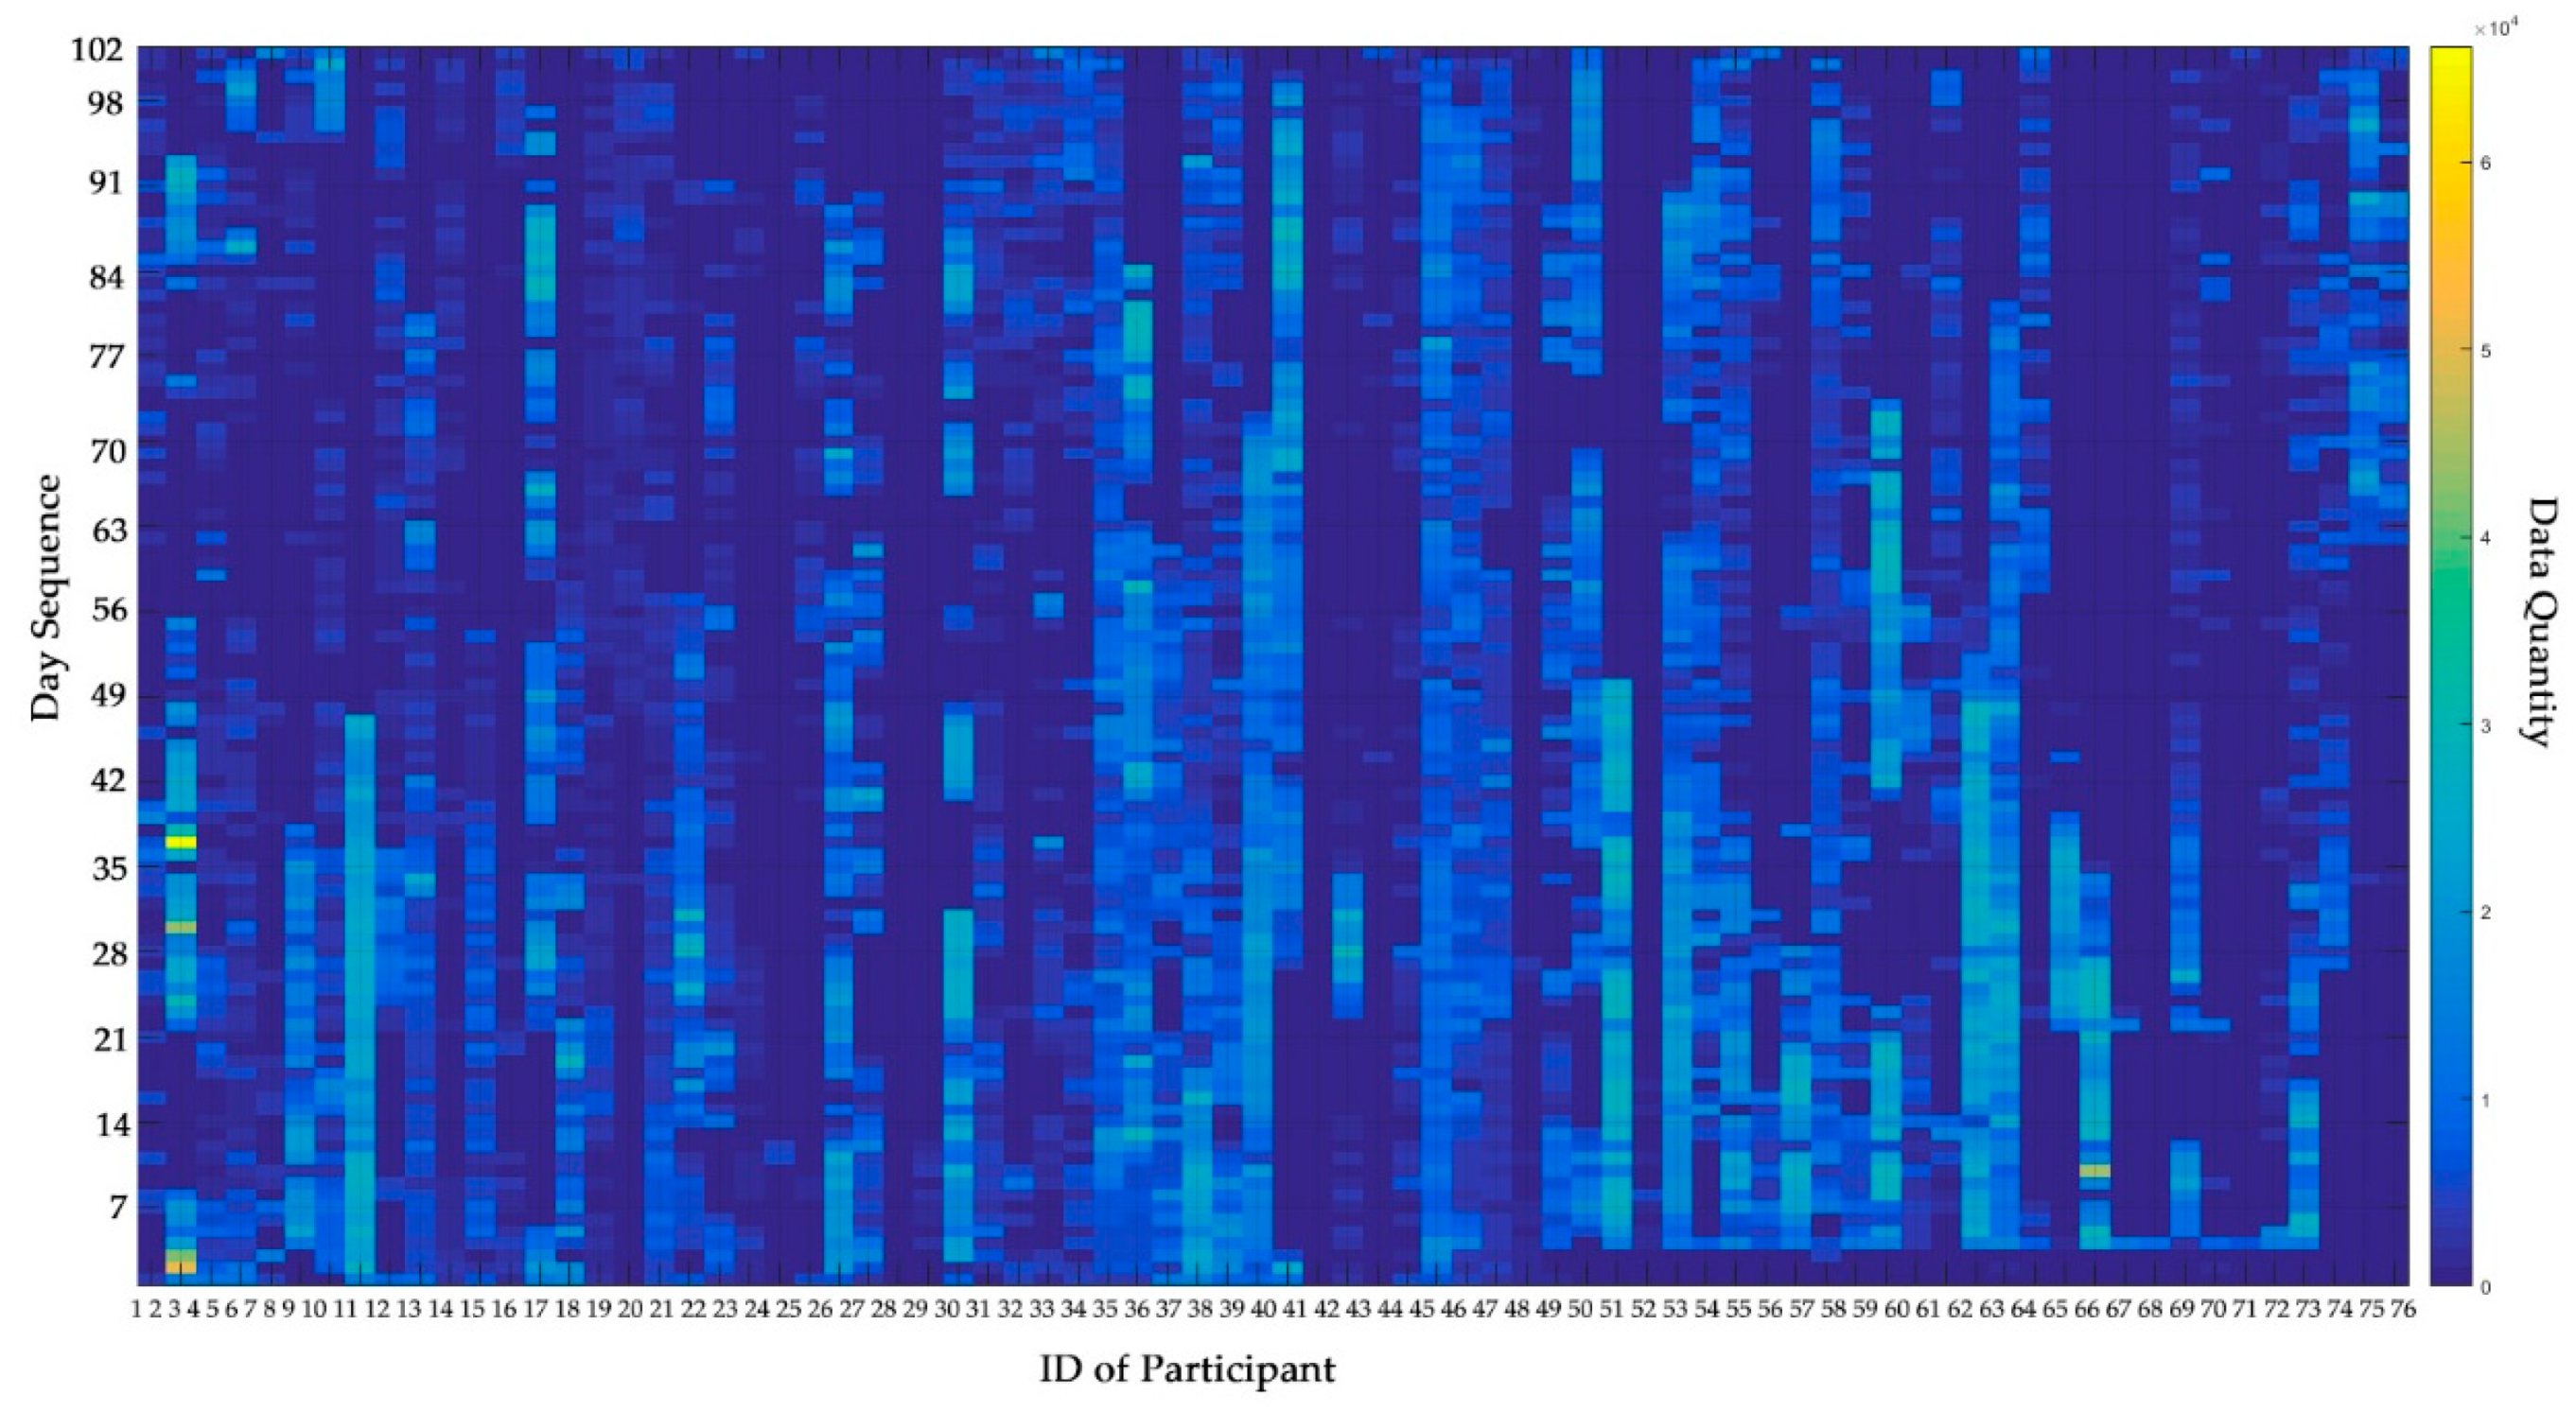
2.3. Data Collection and Processing

We established a novel framework to investigate participants’ activity spaces based on successive long-term GPS trajectories. This framework includes data collection and management, trajectory preprocessing, location of interest recognition, walking route extraction, and daily activity space identification (Figure 4). We operated all processes using PostgreSQL, the QGIS platform, and the Python 3.6 programming language.
Our participants were asked to carry the Redmi Smartphone from 18 September to 28 December 2015. The sampling rate of the GPS loggers was three seconds per point and the positioning accuracy was four meters. GPS points was generated by the smart phones, recording the spatial–temporal information in real time (i.e., longitude, latitude, and timestamps) and uploading that information to the PostgreSQL database service with the GiST (combine R-Tree) index for data management [29,30]. This index is suitable for optimizing nearest-neighbor searching and enhancing computing efficiency. We also established a personal information file for each participant, including their demographic information (i.e., age, gender, family composition, length of residence, and socio-economic situation) and related information on the corresponding equipment (i.e., smartphone serial numbers).
At the data management stage, the trajectory data were cleaned and compressed, and then combined with multi-source data, such as POI data and auxiliary geographic data. By the end of the experiment, we had collected 37.2 million GPS points data from 76 participants covering a period of over 102 days (Figure 5). Additionally, we obtained the POI dataset from Gaode Map (a Chinese map service and location-based service provider), and the road and public transport datasets from Open Street Map (OSM).
The trajectory preprocessing stage included three steps: noise filtering, map matching, and route segmentation. First, noise filtering was performed to remove GPS outliers from the trajectory points caused by the poor satellite signals in urban canyons or indoor spaces. The cosine similarity of the trajectory vector was used to identify the noise points. Second, map matching was used for affine transforming each point of a trajectory onto a corresponding road segment. Third, trajectory segmentation was used to divide a trajectory into fragments based on moving speed (such as walking, cycling, or using vehicles) for further processes like clustering and classification [31]. GPS data can correct the misreporting problems from self-reported travel dairies, and improve the accuracy of describing travel behavior accordingly. In this study, the results of our smartphone app testing showed that the average position domain accuracy was less than 4.8 m with a 95% horizontal error. In addition, the app had high frequency sampling with a time transfer resolution of three seconds at a time. Outliers in the dataset were removed via a denoising algorithm to scientifically improve the data quality. Therefore, we accurately identified walking segments by calculating instantaneous velocity between 0.5 and 1.8 m per second and the successive direction through our continuous fine-grained GPS trajectories data [32]. In addition, we returned to the study site several times afterwards to observe the activities and space uses, including direct questioning and verification with the older adults who participated in the experiment, in an effort to make the data reveal understandable phenomena and valid patterns. Two main types of defects in the initial processed GPS trajectories were smoothed via spatial–temporal interpolation of the sequence: outliers and missing segments of routes. Linear interpolation of missing movement data was performed between consecutive GPS points if less than half an hour had passed between the collection of both points matching the street network, or GPS signal dropped on the metro, or if two points were more than 100 m apart [33]. Specifically, the outliers contained noise in static and moving points. For static noise points, the outliers calculated the correct position based on their neighborhoods which had higher similarity to points in a cluster. Outliers were fixed by using time-series flatness for smoothing. For noise points on movement, the cosine similarity of two adjacent coordinate points was used to construct a seamless walking trajectory. If cosine value of a GPS point were more than 30 degrees from a previous point, this point would be labeled as an outlier. The average position of the two points before and after would replace the original value for smoothing noise.
To identify POIs and walking trajectories, which are two key components of daily activity spaces, we needed to determine the location of interest and extract the walking routes. Specifically, we used the staying point detection algorithm to identify the locations where each participant remained for a period, with these locations carrying greater semantic meaning than other points in the trajectory. Density-based spatial clustering of applications with noise (DBSCAN) is a classical non-supervised machine learning approach for detecting individual stops and requires two parameters: the distance between neighboring points and the minimum number of neighboring points around the core point [34]. In this study, personal temporal-DBSCAN (PT-DBSCAN) aided the DBSCAN algorithm by integrating individual info and time factors for recognizing personally meaningful places (Figure 6). These characteristics involved three parts: (1) personal identity—i.e., the participants living in the study site; (2) time discontinuity—the temporal extent of two stops that do not overlap with each other; and (3) spatial density, with a higher density indicating the formation of a cluster.
A circular buffer with a radius of R = 9 m (two-times the GPS location error of 4.5 m [35]) was created around each labeled POI. The Euclidian distance D between the POI and the centroid of detected places should be less than or equal to R. Through this process, 88 clusters were matched to the given POIs from Gaode Map 2015.
To represent the daily mobility range, previous studies at the neighborhood level used GPS-based activity spaces as an individual measure of spatial behavior. There are three main approaches for estimating home ranges [36,37]: (1) the standard deviation ellipse (SDE), which is widely used for overall activity space measurements; (2) kernel-density estimation (KDE), which is based on disaggregated data and mostly used for home range computations [38]; (3) minimum convex polygon (MCP), which contains the activity locations visited by an individual [39]. However, a prominent problem is that the activity space defined by the convex hull includes areas that do not reflect real arrivals and are intensively affected by outliers (Figure 7). Alternatively, the concave hull model based on the Alpha shape algorithm [40,41] considers internal spatial heterogeneity, which could be a solution for some real-world problems (e.g., finding the reasonable boundary of a city). It is derived from three main components: stationary points, active points distributed freely in AOI (Area of Interest), and walking points along the streets. Since our fine-grained, consecutive movement GPS data could represent the daily trip, including spaces for passing and staying, using concave hull approach, which fully takes into account of the distribution of spatial behavior data, would be suitable for this study. Therefore, we used the concave hull model for analyzing the tracking data characteristics in our study.
Figure 8 presents examples based on convex hull and concave hull methods. Comparing with convex hull (A), concave hull (B) delineated the ideal envelope boundary, which could represent the spatial distribution of trajectory data objectively. Meanwhile, convex hull may include a large of redundant area that may bias the identification of activity spaces.

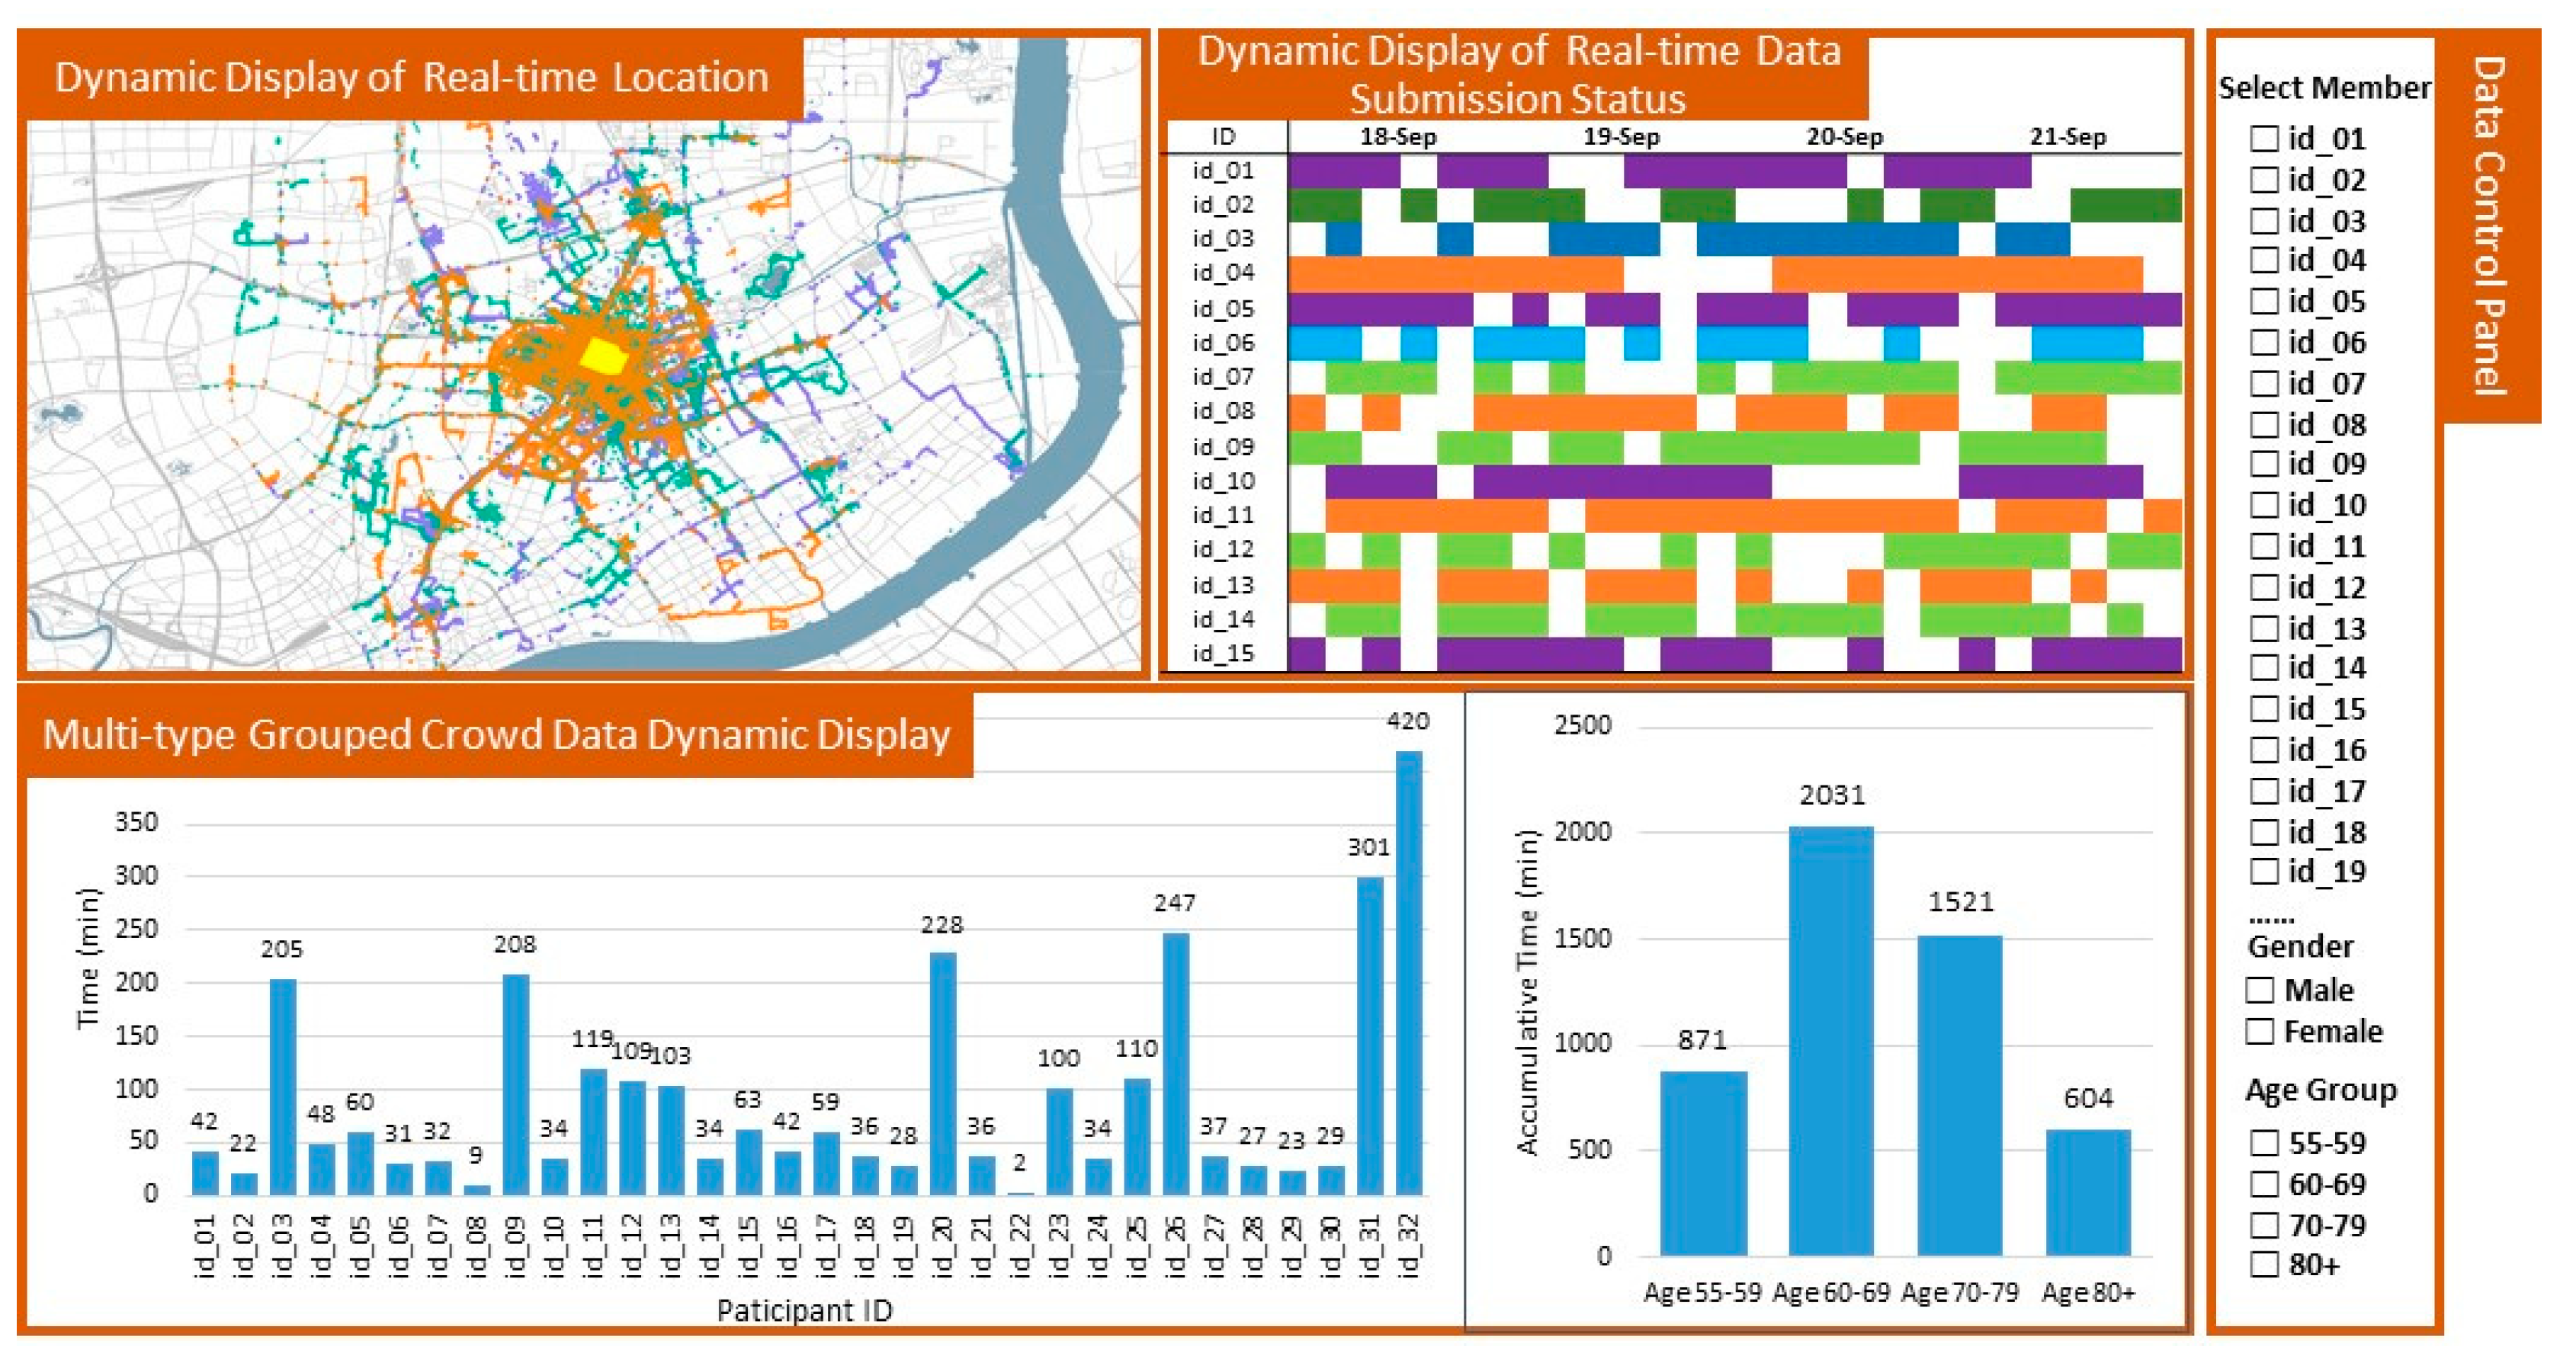
2.4. Data Visualization and Analysis

After identifying walking routes, we overlaid the trajectory layers of four age groups, 55 to 64, 65 to 74, 75 to 84, and more than 85, respectively. In addition, we overlapped the daily travel range of individuals to demonstrate their overall activity range on the GIS map. Then, we used the walking trajectory data as the source and provided a more accurate algorithm recognition models and visualizing the results by using PostgreSQL database and FME spatial analysis platform. Firstly, we identified the spatial trajectory based on PostgreSQL database, and calculated the average walking speed of ≤ 6.5 km/h and the fastest walking speed of ≤ 9 km through GPS spatial data. Secondly, we used the Alpha Shape algorithm from the FME Concave hull module to generate the walking range polygons.
In this study, the POIs on GIS base-map, have been obtained from Gaode Map 2015. Then, we use the travel trajectory data through clustering analysis to obtain a Heatmap within the daily activity space. By comparing these two sets of data, we can filter the exact locations of the most visited POIs by older adults. Specifically, most visited POIs had the superior frequency of arrival. The semantic annotation of stay points as POIs was divided into two steps. Firstly, the stay points needed to be estimated in terms of whether they were within the AOI (Area of interests). If so, stay points inherited the spatial semantic information of AOI. Then, we used nearest neighbor approach to assign the spatial semantic info of POI to the remaining stay points. Additionally, we conducted a further analysis on POIs within the maximum walking distance of 60 min.

3. Results

3.1. Daily Activity Spaces of Older Adults

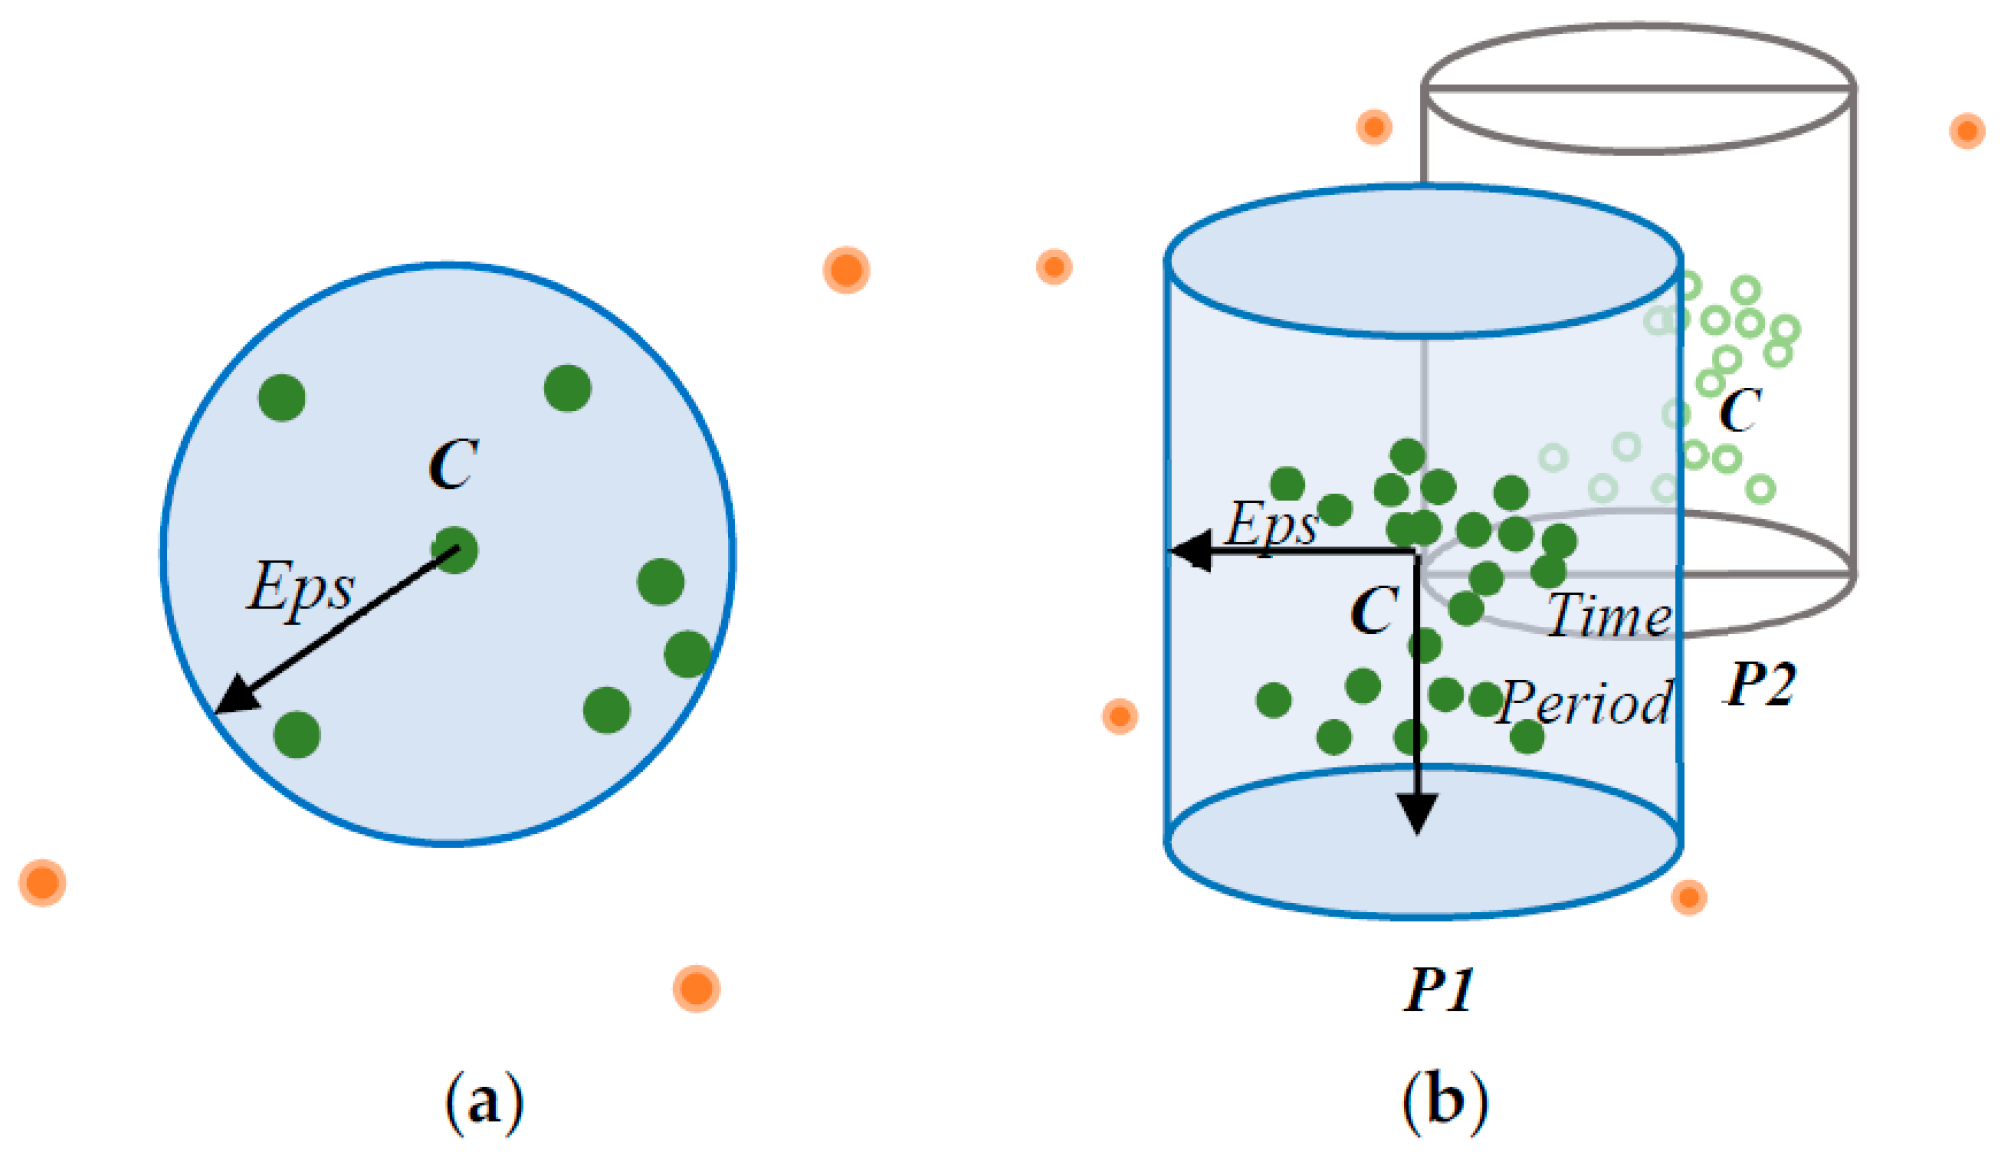
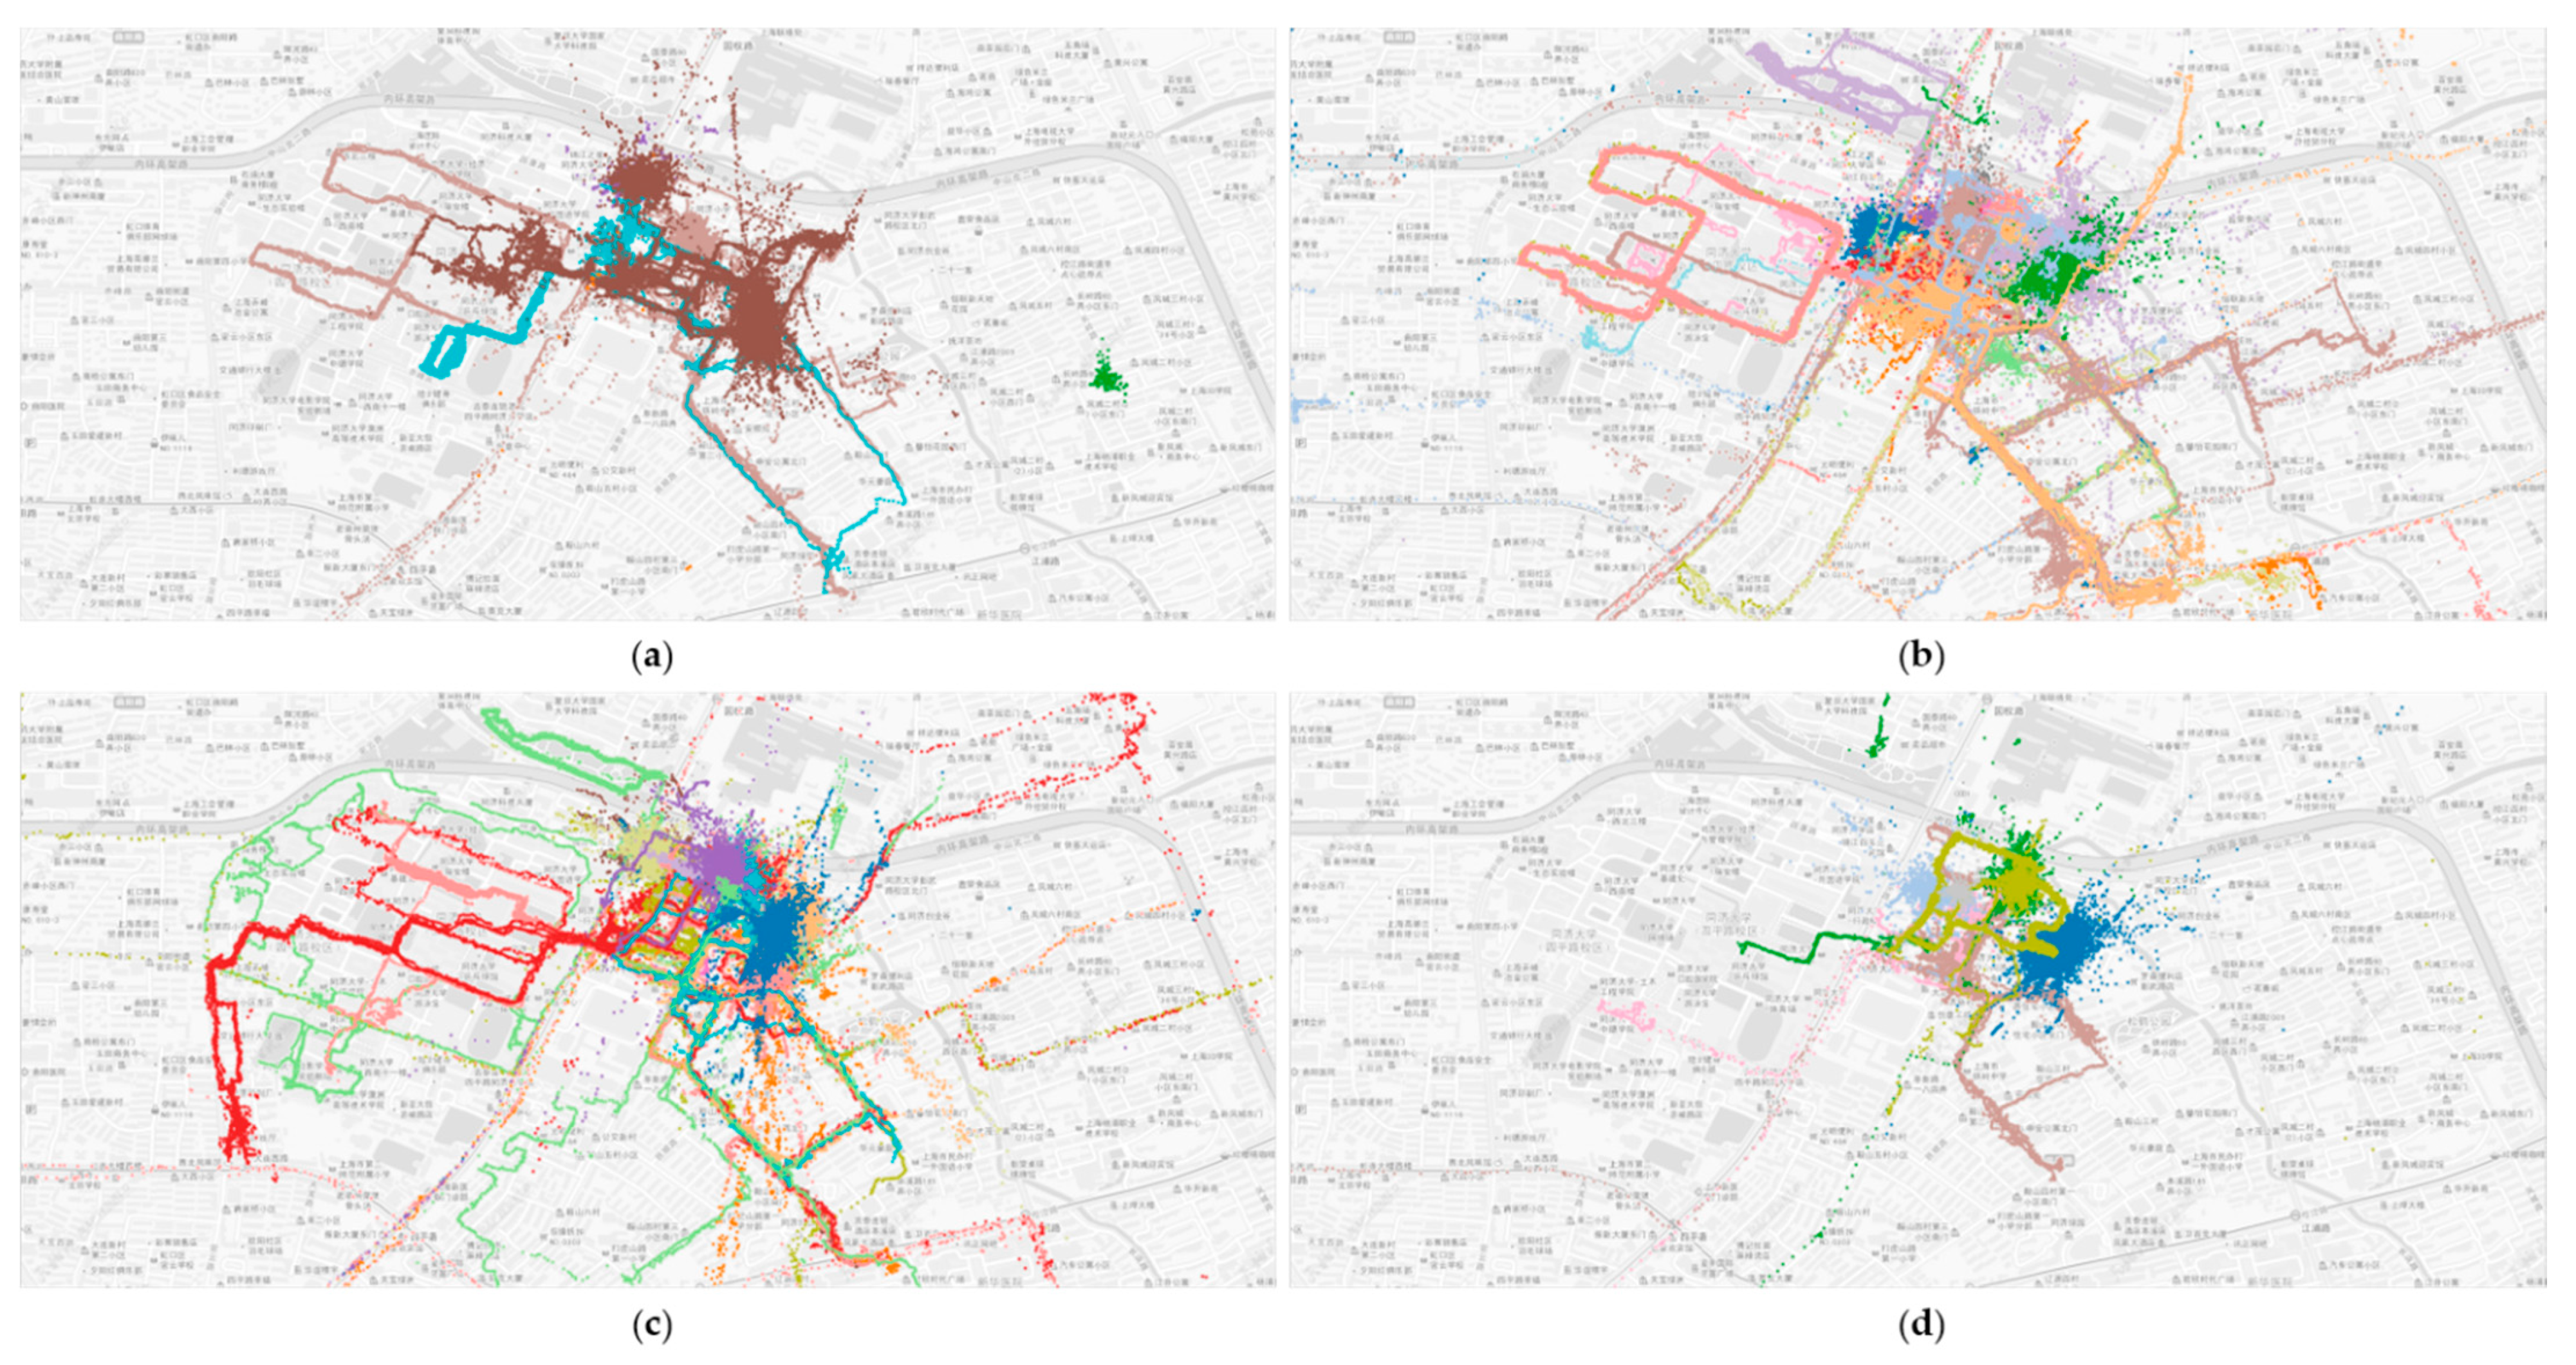
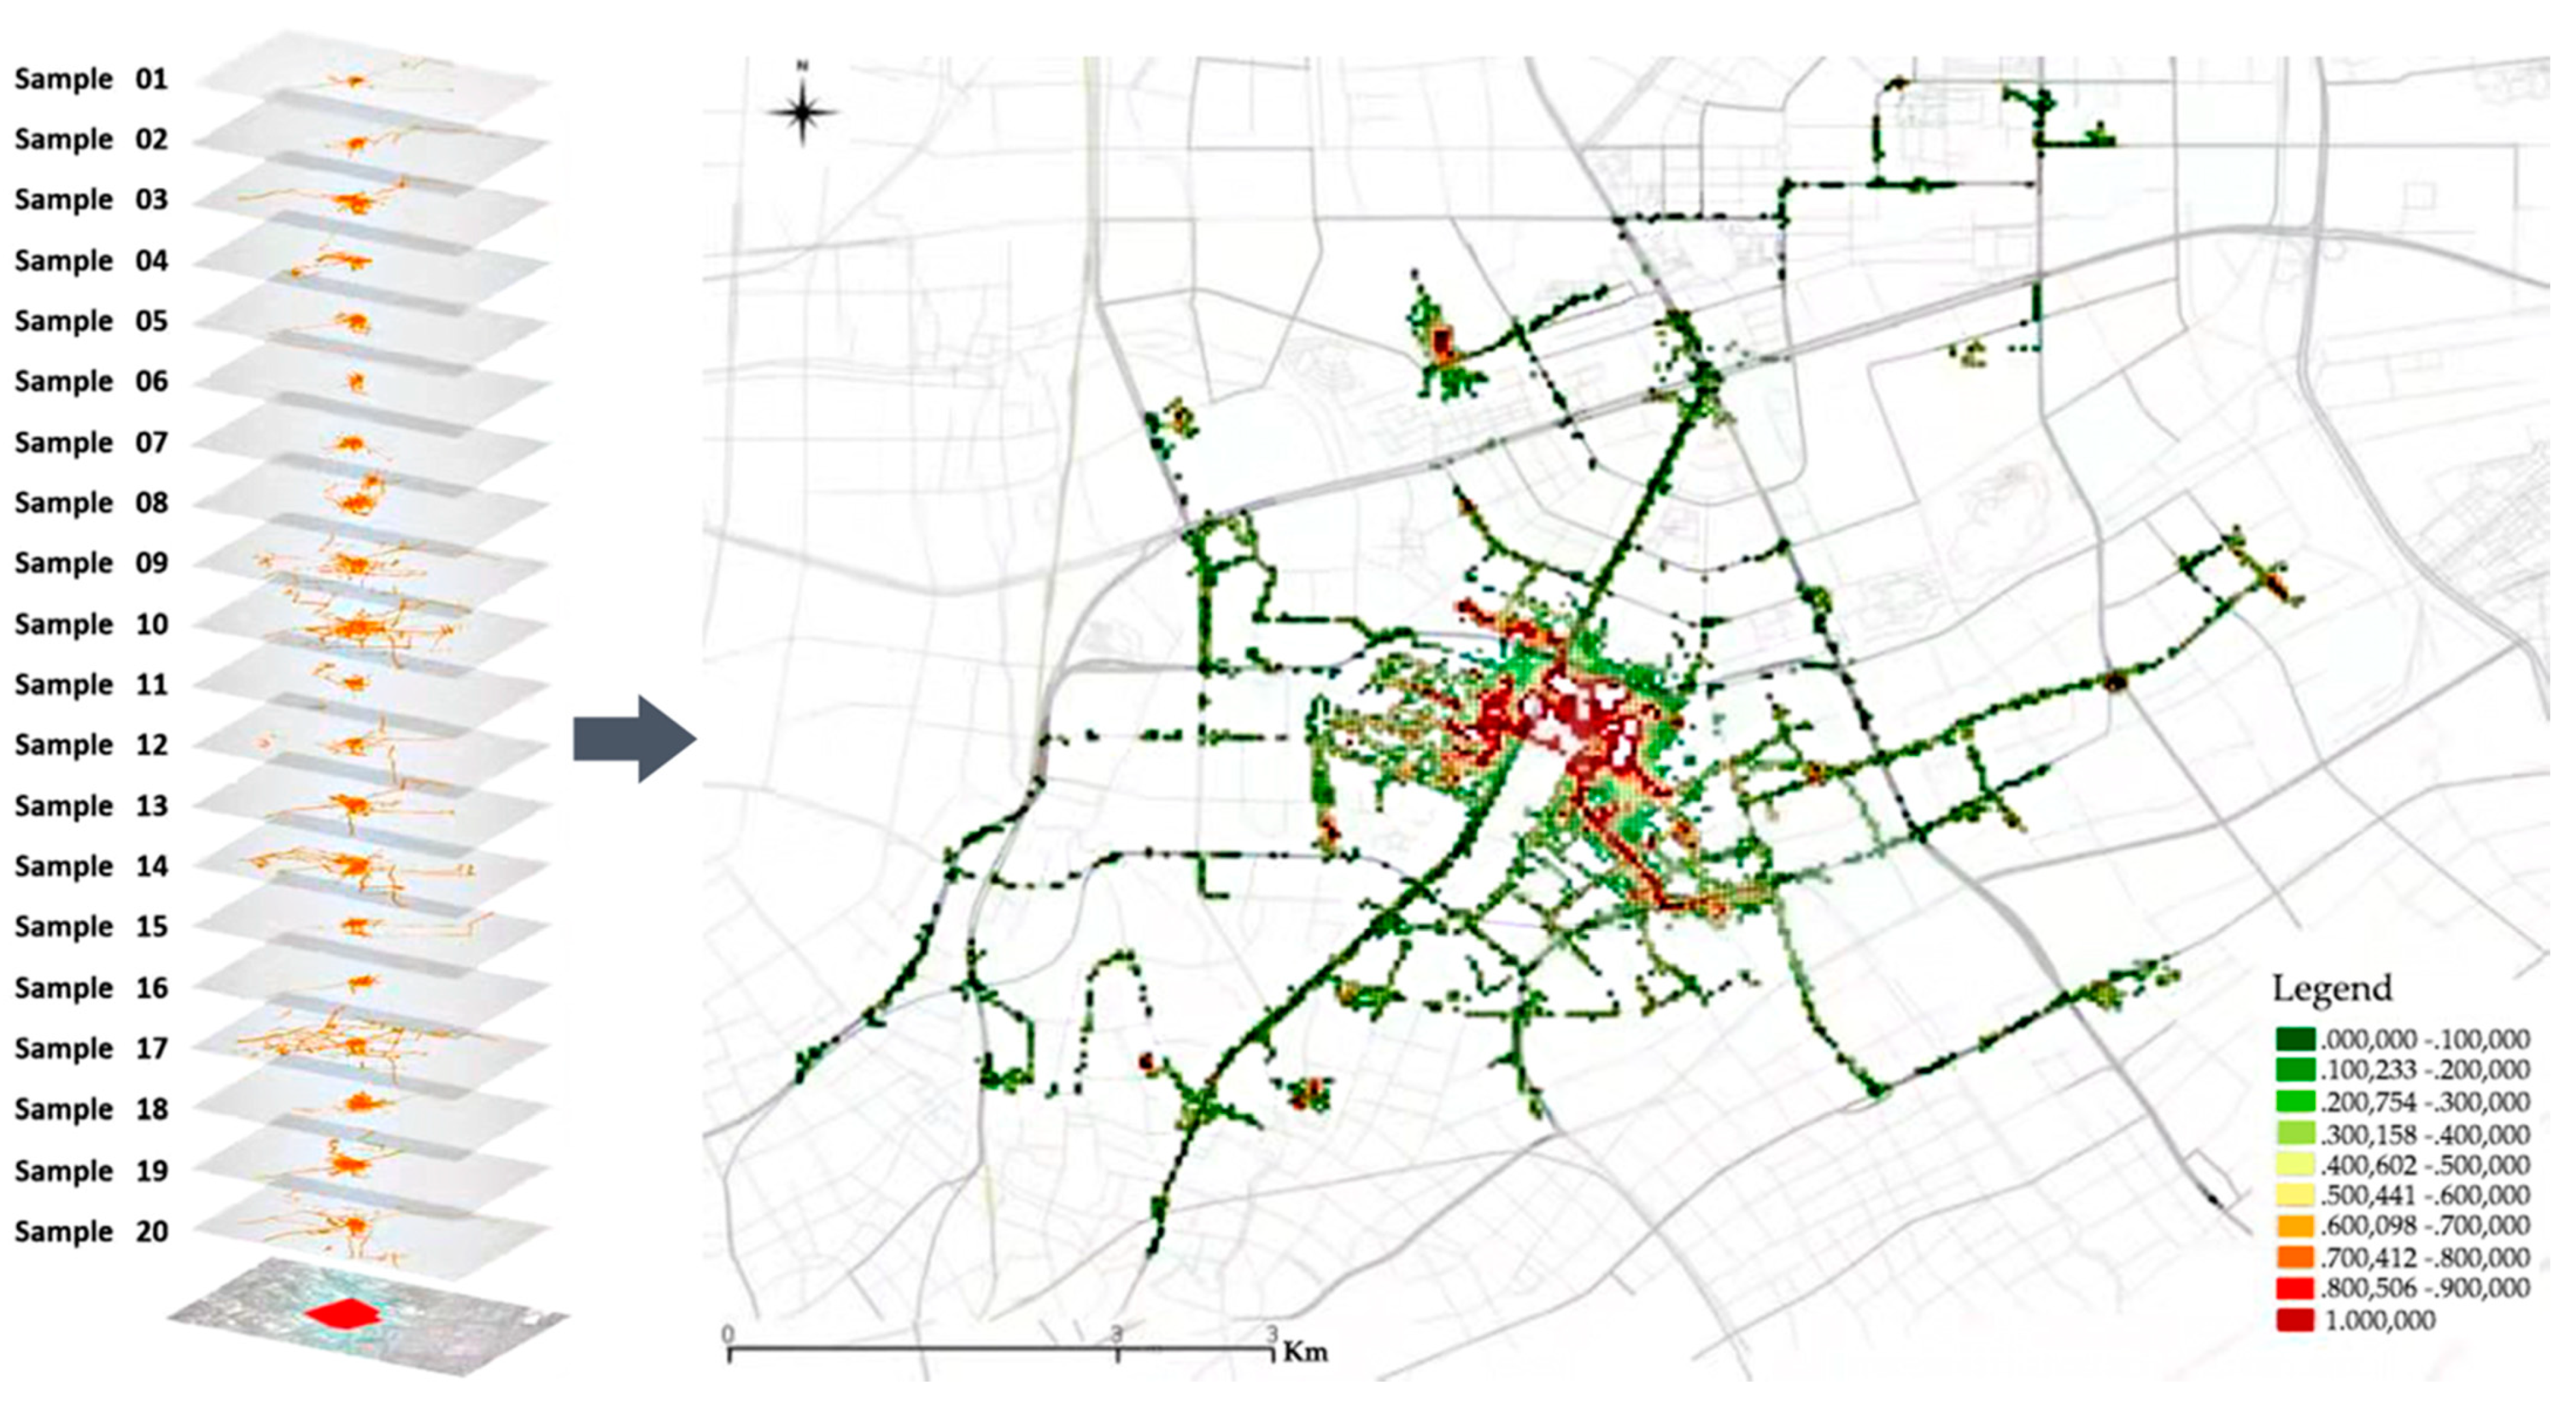
3.1.1. Travel Range—Trajectory Clustering

We found that those in the age group of 75 to 84 had the widest walking range, followed by those aged 65 to 74. Both groups had wider walking ranges than those aged 55–64. This result does not follow the commonsense supposition that the range of activities will be inversely associated with increased age due to decreased physical mobility. Considering the participants’ socioeconomic status and the survey results, we found that most of our participants were ex-staff from Tongji University (22.4%). Some of them, especially in the younger age group (i.e., ages 55–64), were still doing some paid work for the university, even though they had retired. Therefore, these participants had a pendulum travel pattern between home and campus. In addition, we found that more participants in the younger group took care of their grandchildren than those in the older group. As a result, their daily travel ranges were limited around their houses (Figure 9).
The gradient from green to red in Figure 10 shows the superposition intensity of the individual trajectory data. We found that daily activities of our participants mainly occurred in and around the community. The destinations with a high frequency of visits were distributed along urban roads. However, participant travel seldom occurred in the north of the community, which is adjacent to the inner ring road (i.e., North Zhongshan Road), suggesting that busy traffic is the main barrier for older adults’ daily travel. We also found that 09:00 to 10:00, 15:00 to 16:00 and 18:00 to 19:00 were the main periods for taking a long walk. Meanwhile, female’s travel distance was two times more than that of male (Figure 11).

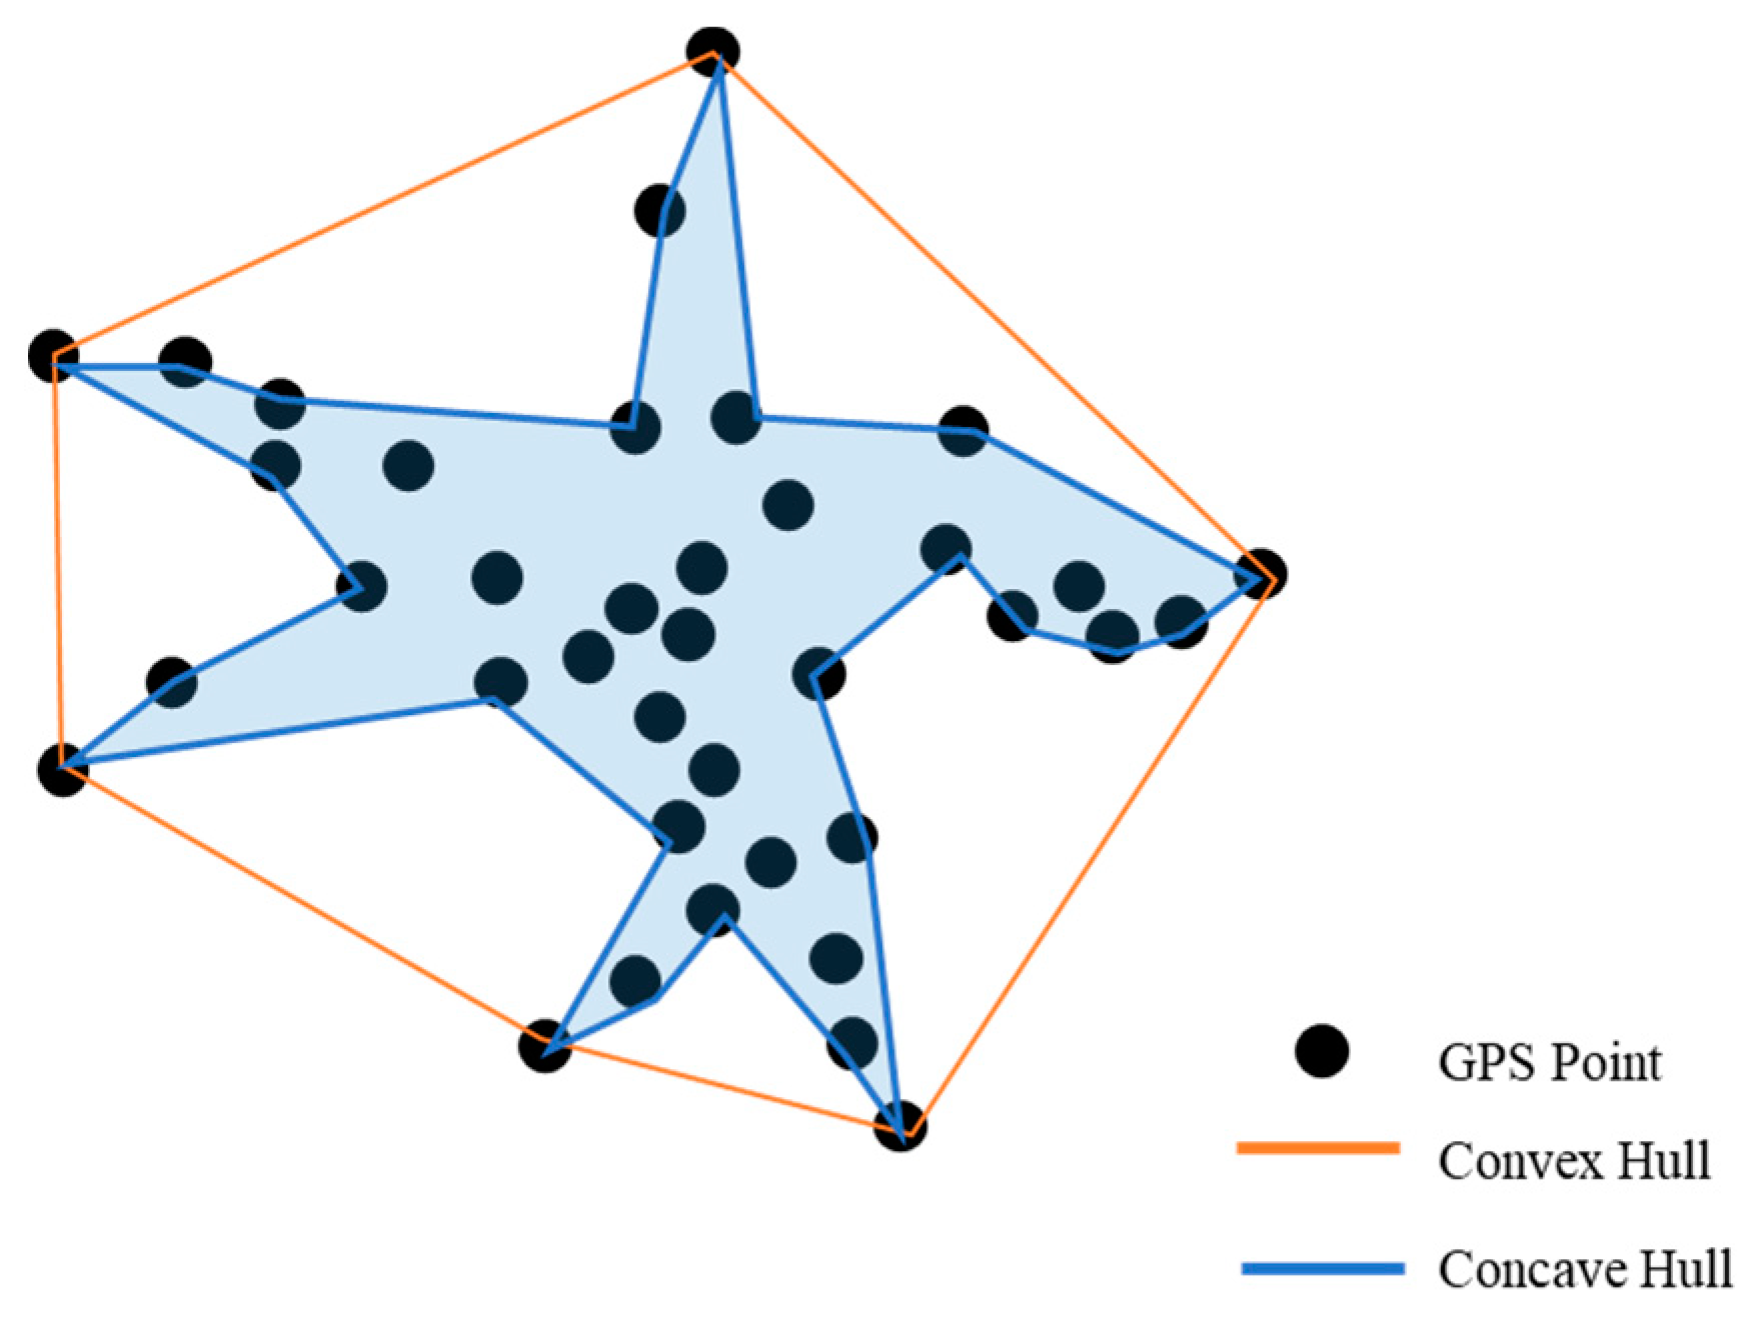
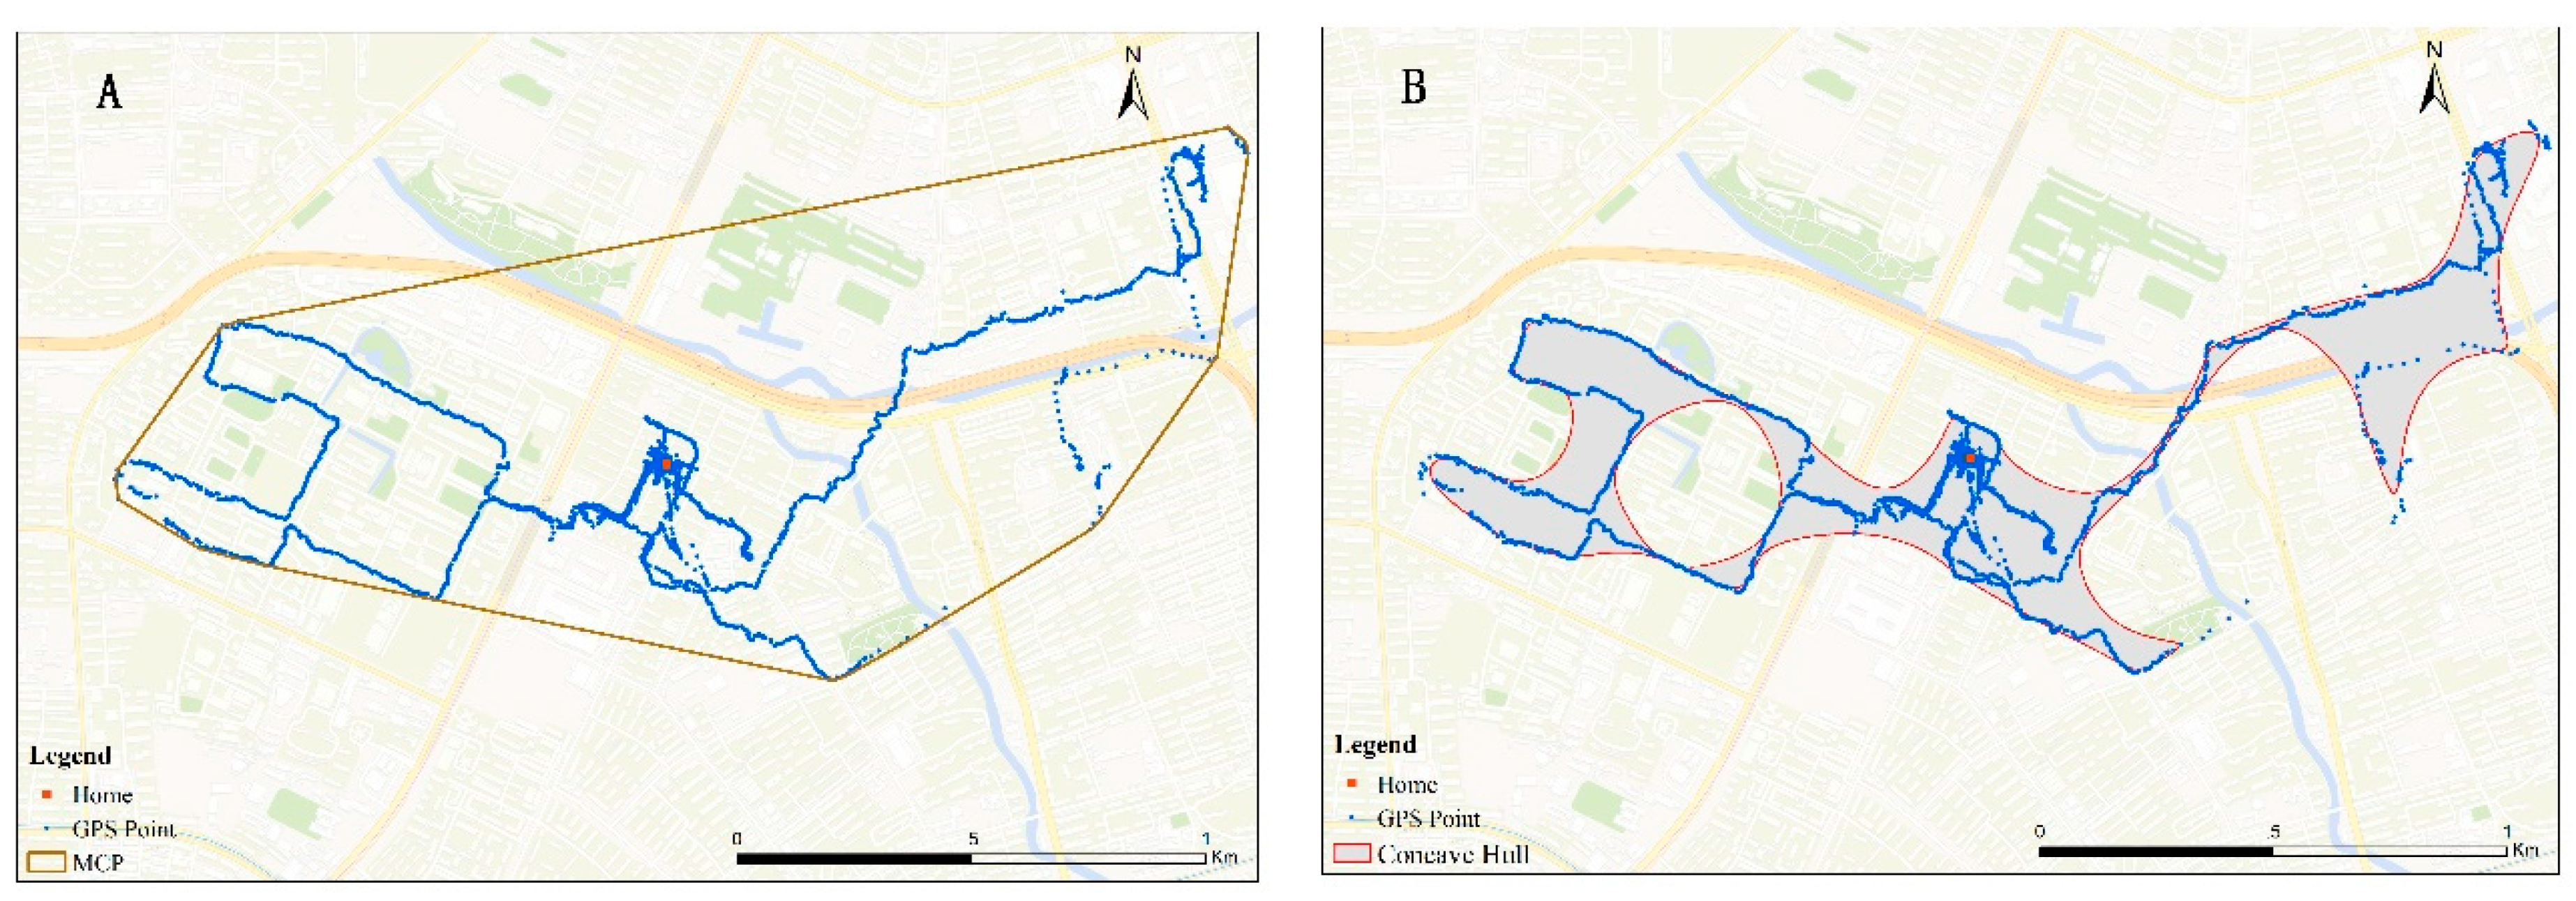
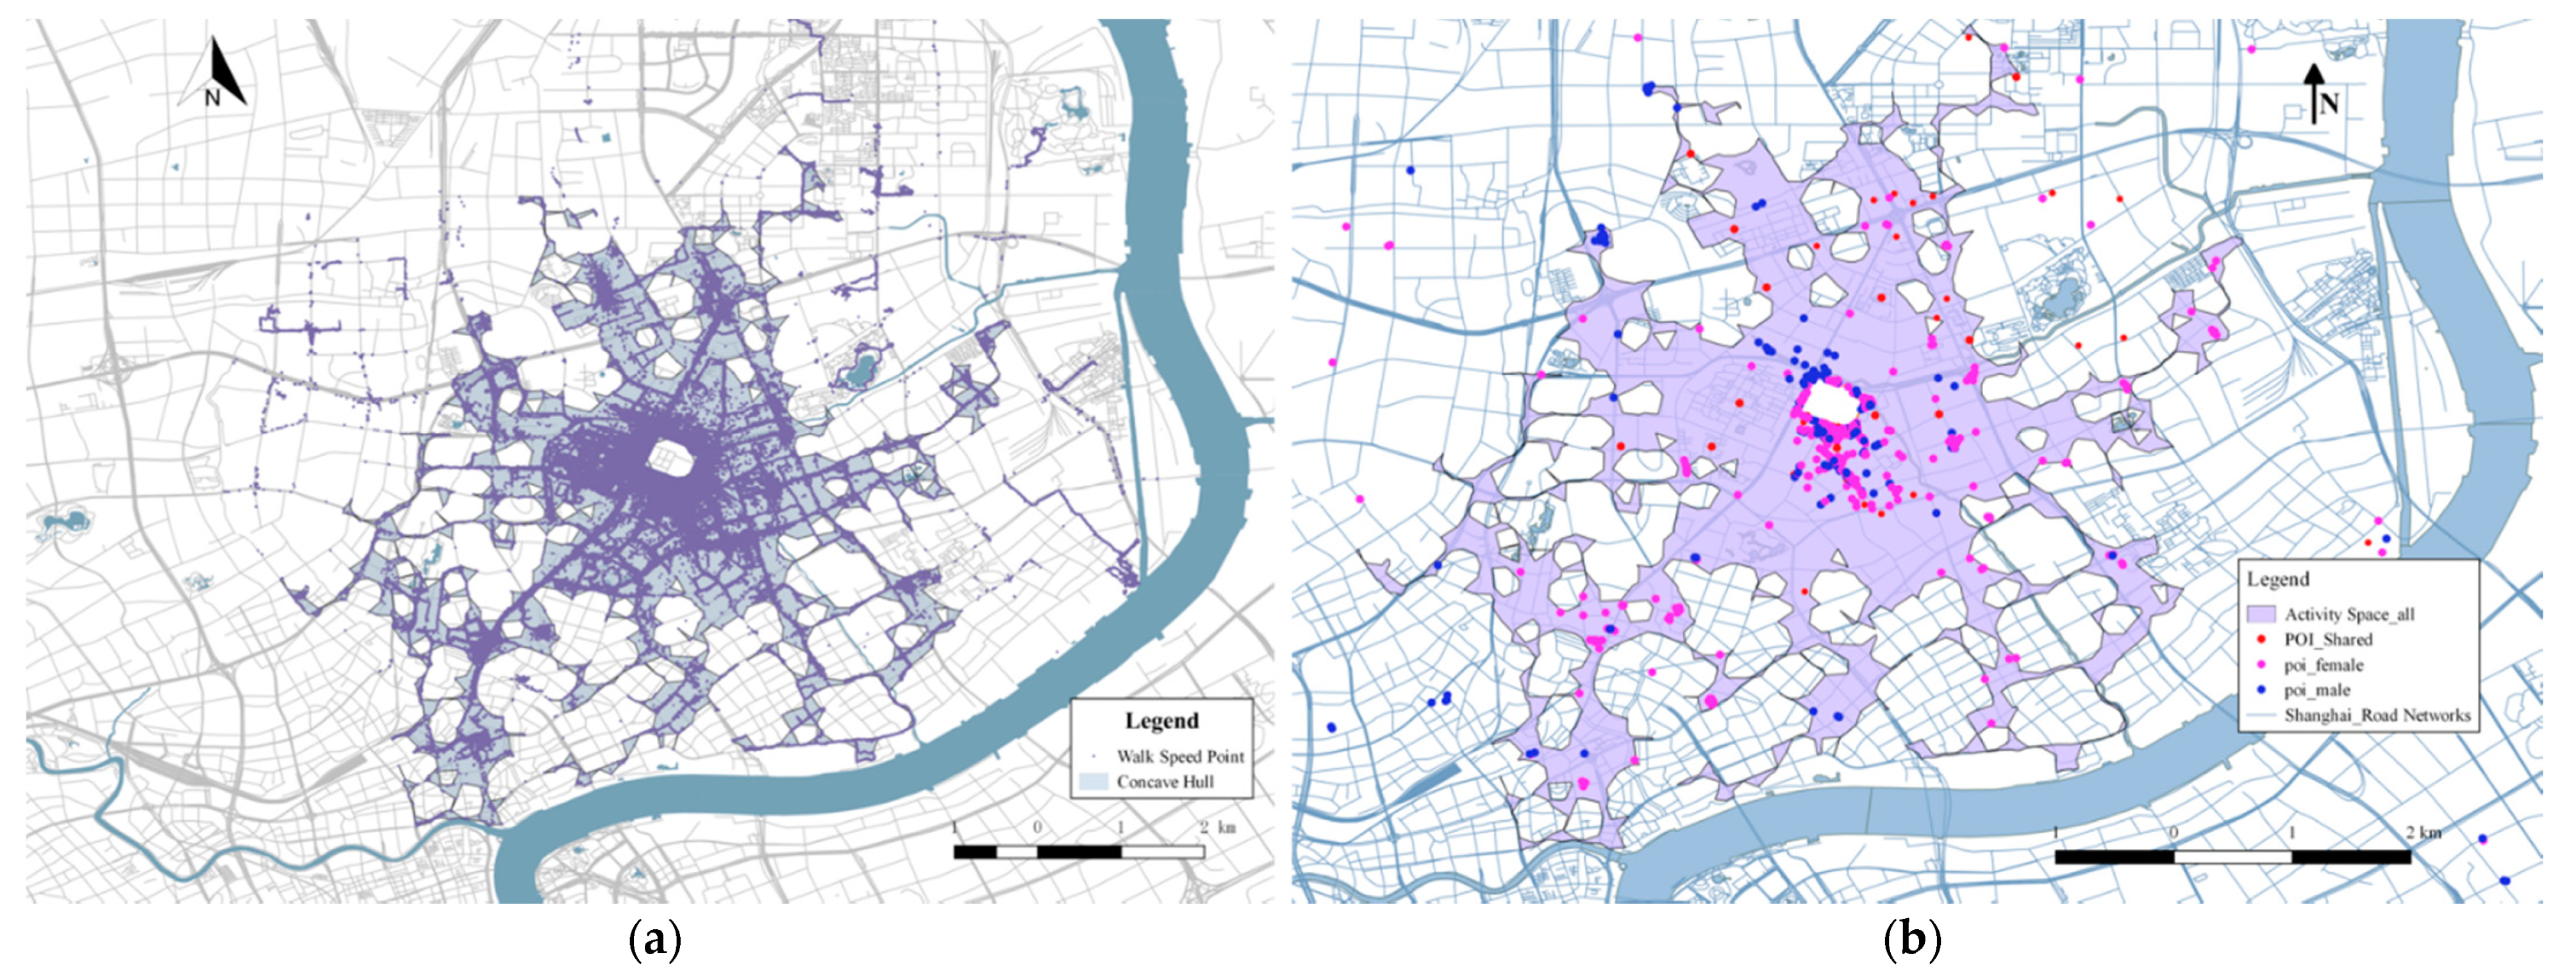
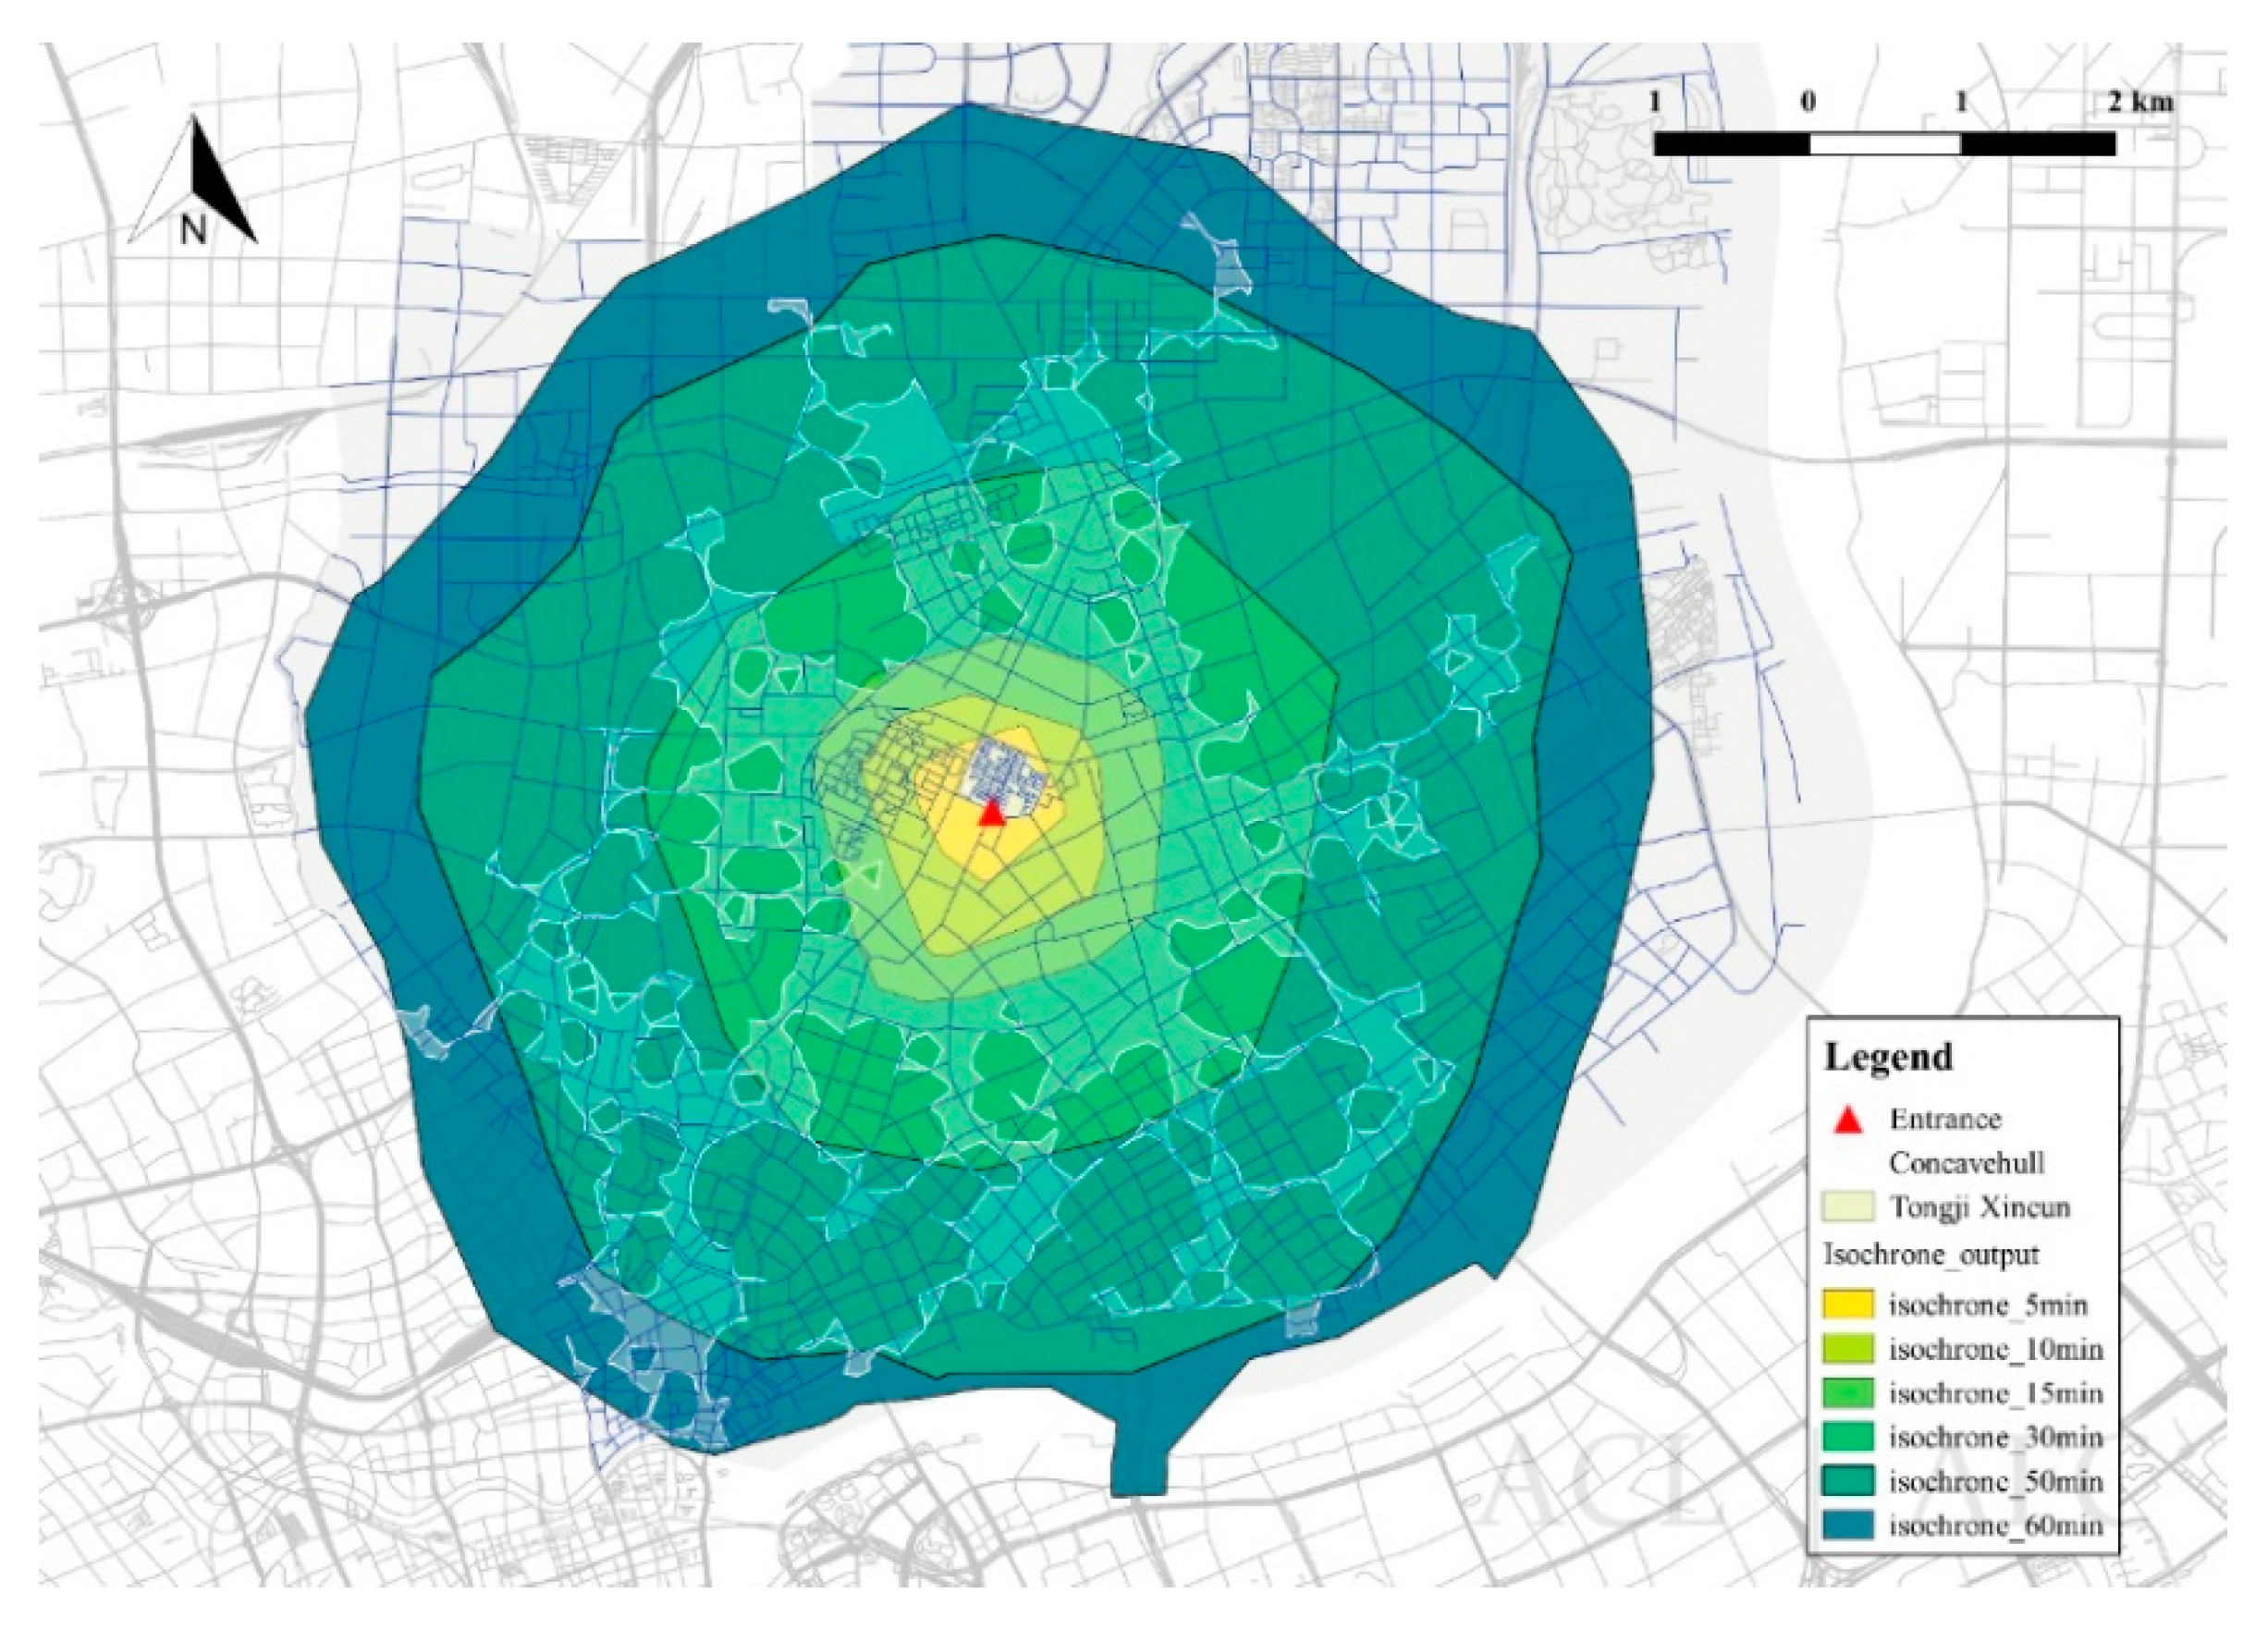
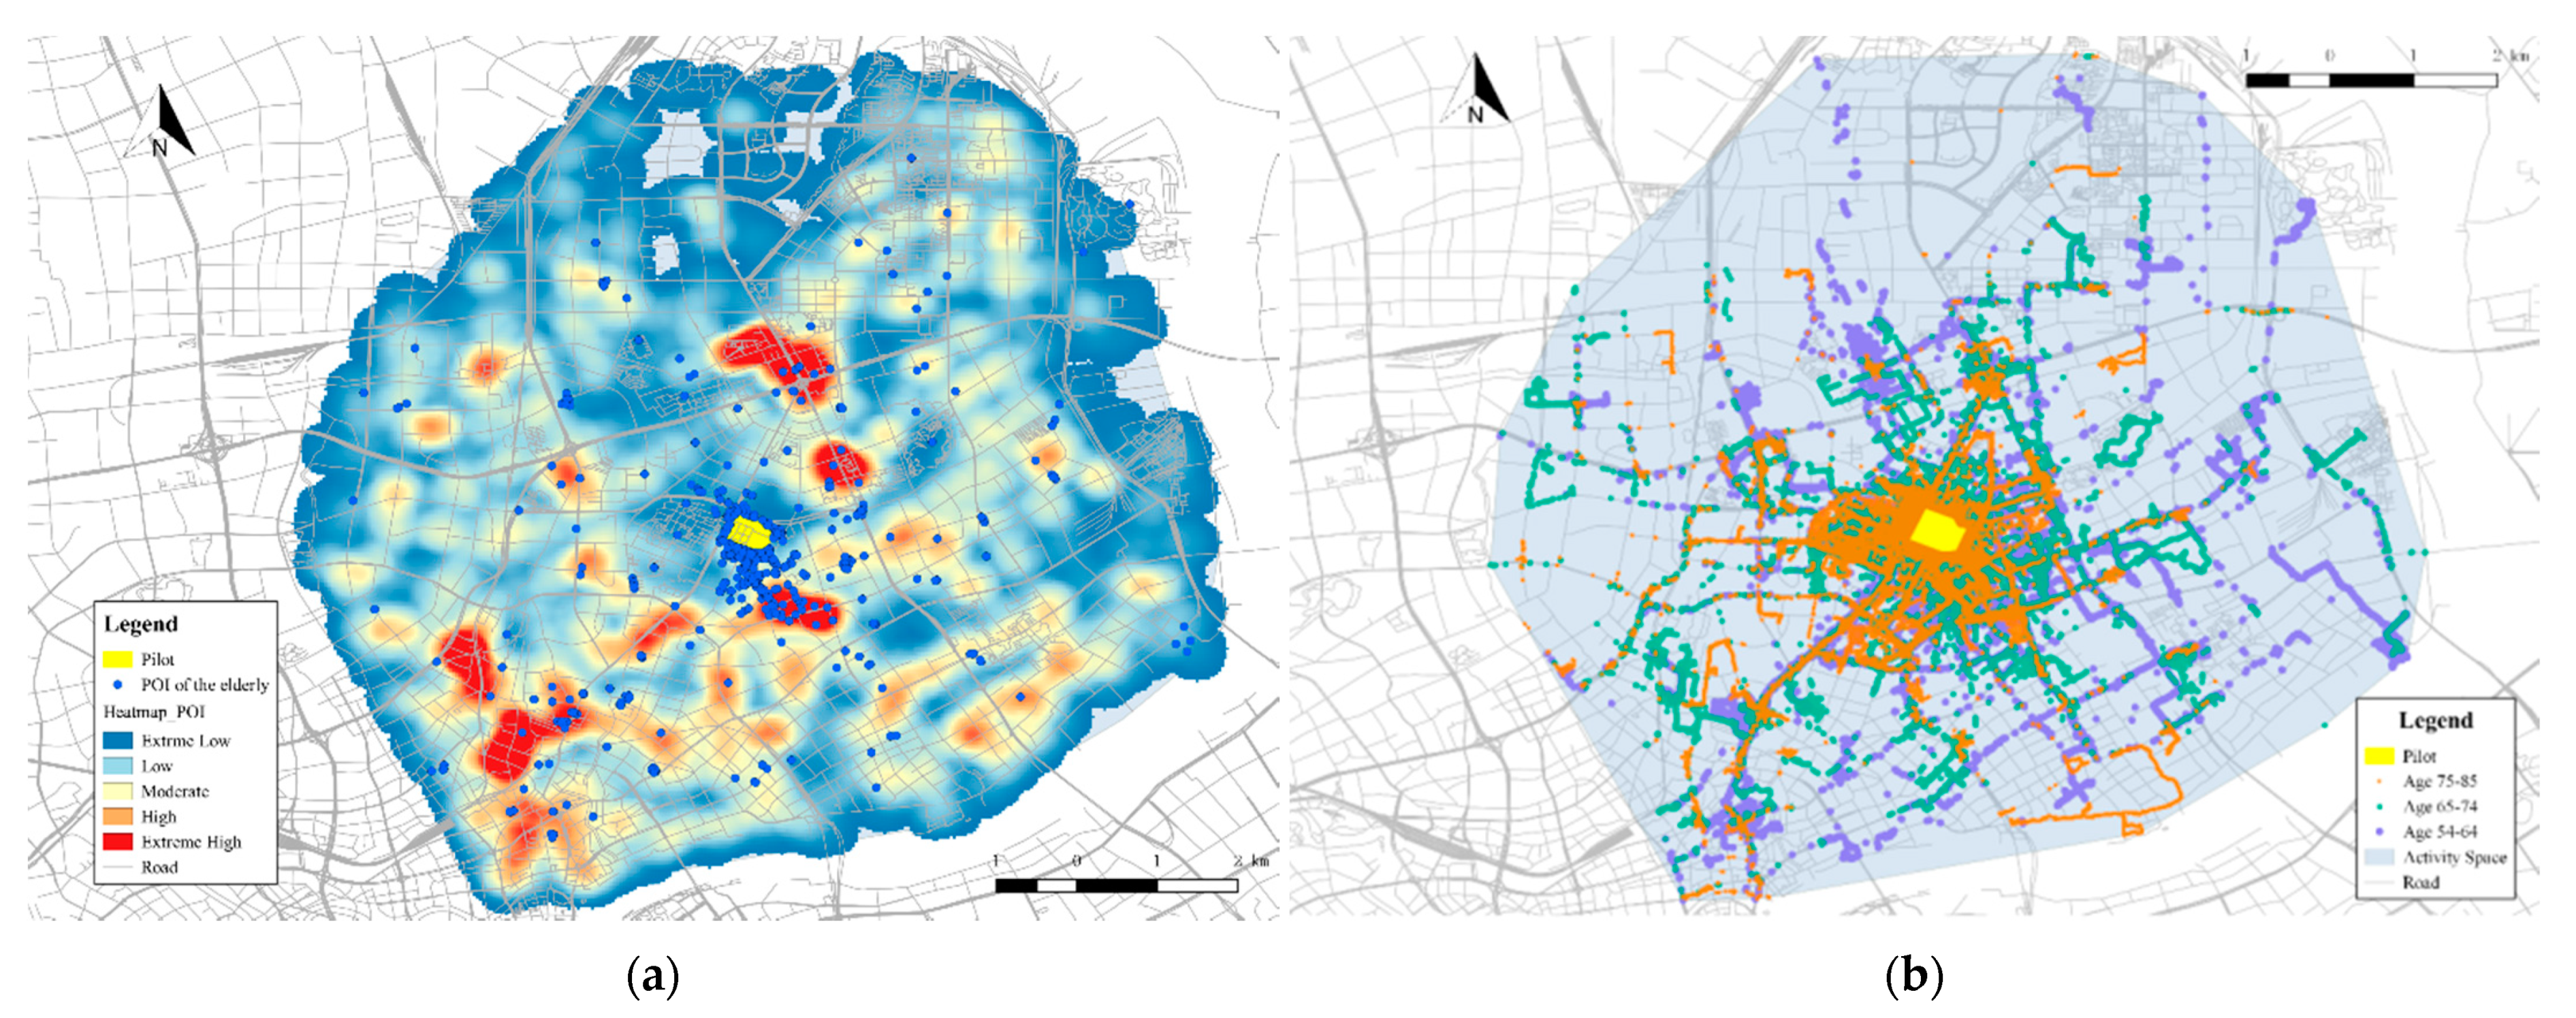
3.1.2. Activity Space—Concave Hull

We found that the concave hull algorithm was significantly better than the commonly used convex hull algorithm in terms of processing GPS data to identify the travel scope. The concave hull algorithm effectively reduced the impacts from abnormal GPS data points, which the convex hull algorithm is easily affected by. In addition, the boundary of the space generated by the concave hull algorithm was clearer than that generated by the convex hull algorithm. We found that the activity space was centered around the community and extended through the urban streets. The whole range of activity space of our study population was 1512 ha, with 46.3% of the body area located within 1.5 km walking distance. The mean of walking distance was 2.12 km with the standard deviation of 2.13 km. Branch areas were mostly located along the street network. The far-end nodes included supermarkets, hospitals, and sports facilities (Figure 12a). We noticed that the POIs visited by males were near the participants’ houses and in the boundary of the activity space. However, the POIs visited by females were more evenly distributed in space (Figure 12b). Compared to men, female older adults’ travel destinations were further away from their neighborhoods of residence. Using the concave hull approach, the polygon (Figure 12a) depicts the activity space based on overlayed walking trajectory GPS points. As the branches of activity space extend further away from the geometric center, the spatial coverage gradually shrinks. The far ends of the branches are bounded by one or more POIs (Figure 12b). According to Figure 13 and Table 1, the activity space of age group one (ages 55–64) was centered on the neighborhood of residence. Females showed a wider range of activity space than males in this group. Group two (ages 65–74) featured evenly matched activity spaces between males and females. For Group three (ages ≥ 75), the size of the activity space decreased prominently, especially for females.
On the branches of the activity space, the POIs visited by males were distributed in the west of the neighborhood. Here, the far end of the activity space was dominated by females. In addition, we found that the maximum walking time for a single trip was 60 min and observed a significant decline in activities ranging between 30 and 50 min. Most participants had a continuous walking time within 15 min, especially around 5–10 min (Figure 14).

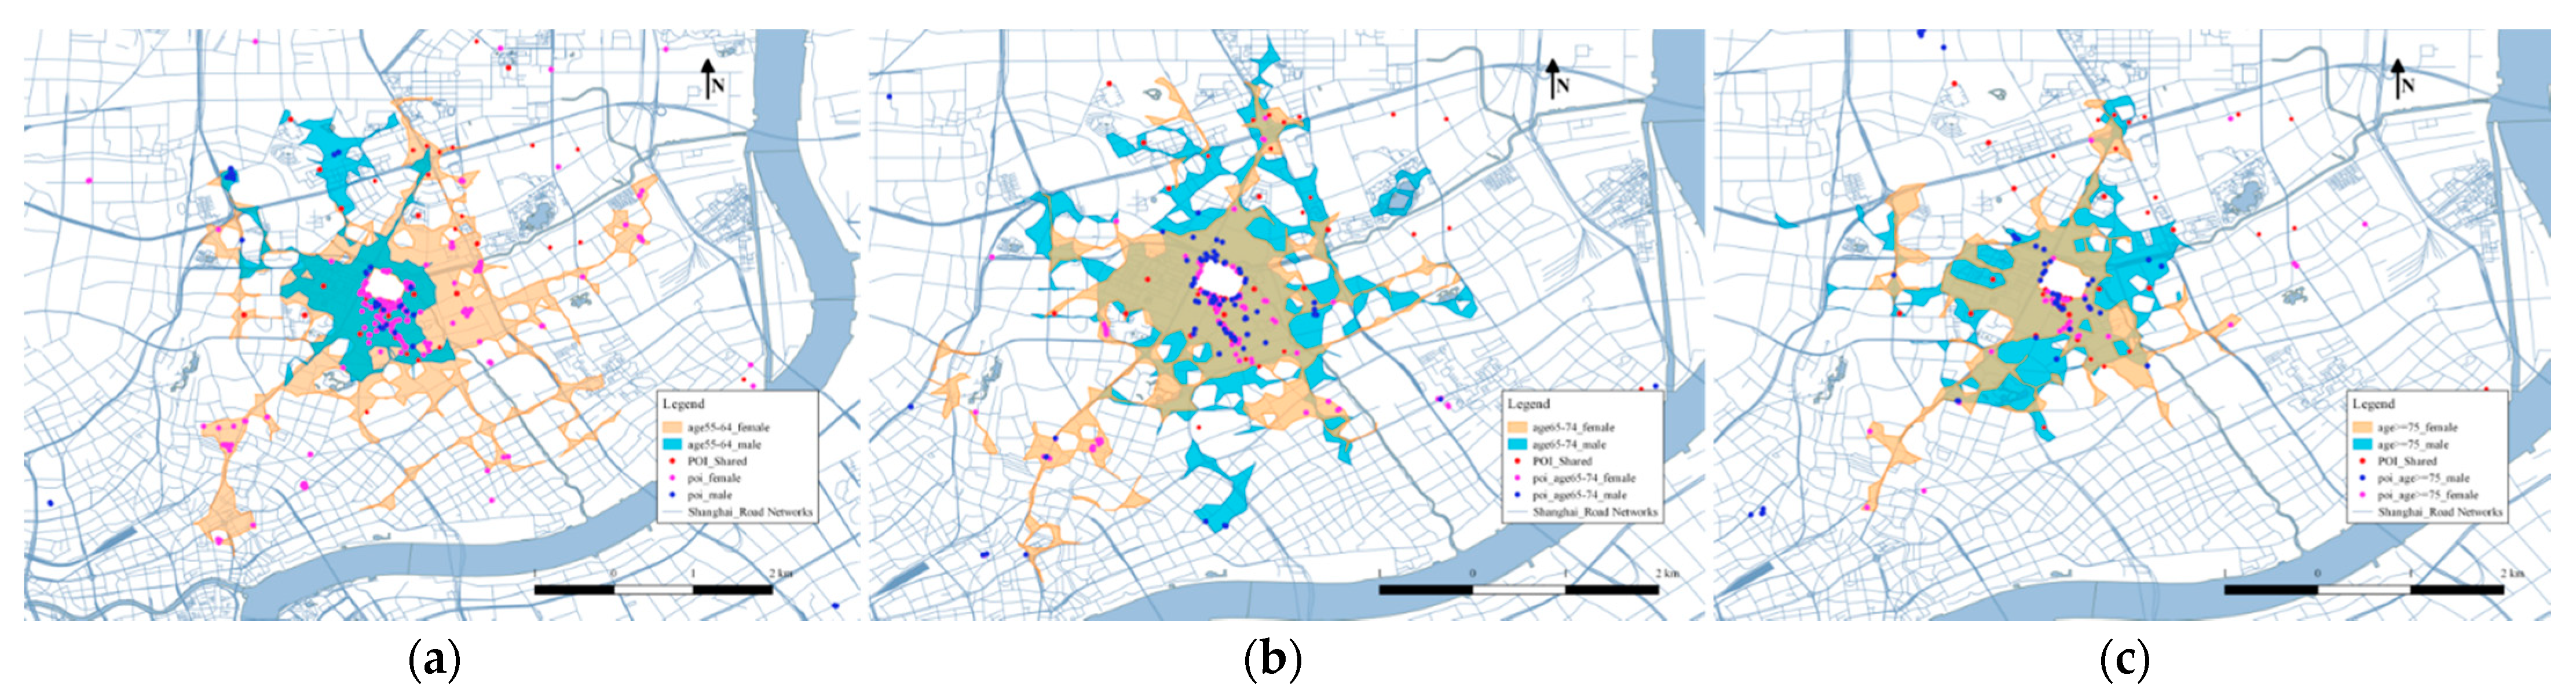
3.2. Points of Interest (POIs) in the Activity Space

3.2.1. Daily Point of Interest

We found that the most commonly visited POIs of our participants were radially distributed around the study site. The radial direction is related to the location of community entrances, as well as the surrounding road network (Figure 15). In addition, we found that travel distance is the main factor that influences participants’ preference for POIs, especially when participants are given multiple choices. The most commonly visited POIs within a 5-min walking distance included nearby green spaces, community centers, outdoor fitness spaces, convenience stores, and restaurants. The most commonly visited POIs within a 10-min walking distance included: banks, markets, drug stores, sports facilities, and community hospitals. Integrating the travel trajectories of older adults with their actual living environments can intuitively indicate the characteristics of the travel paths and the places where the older adults most often stay.

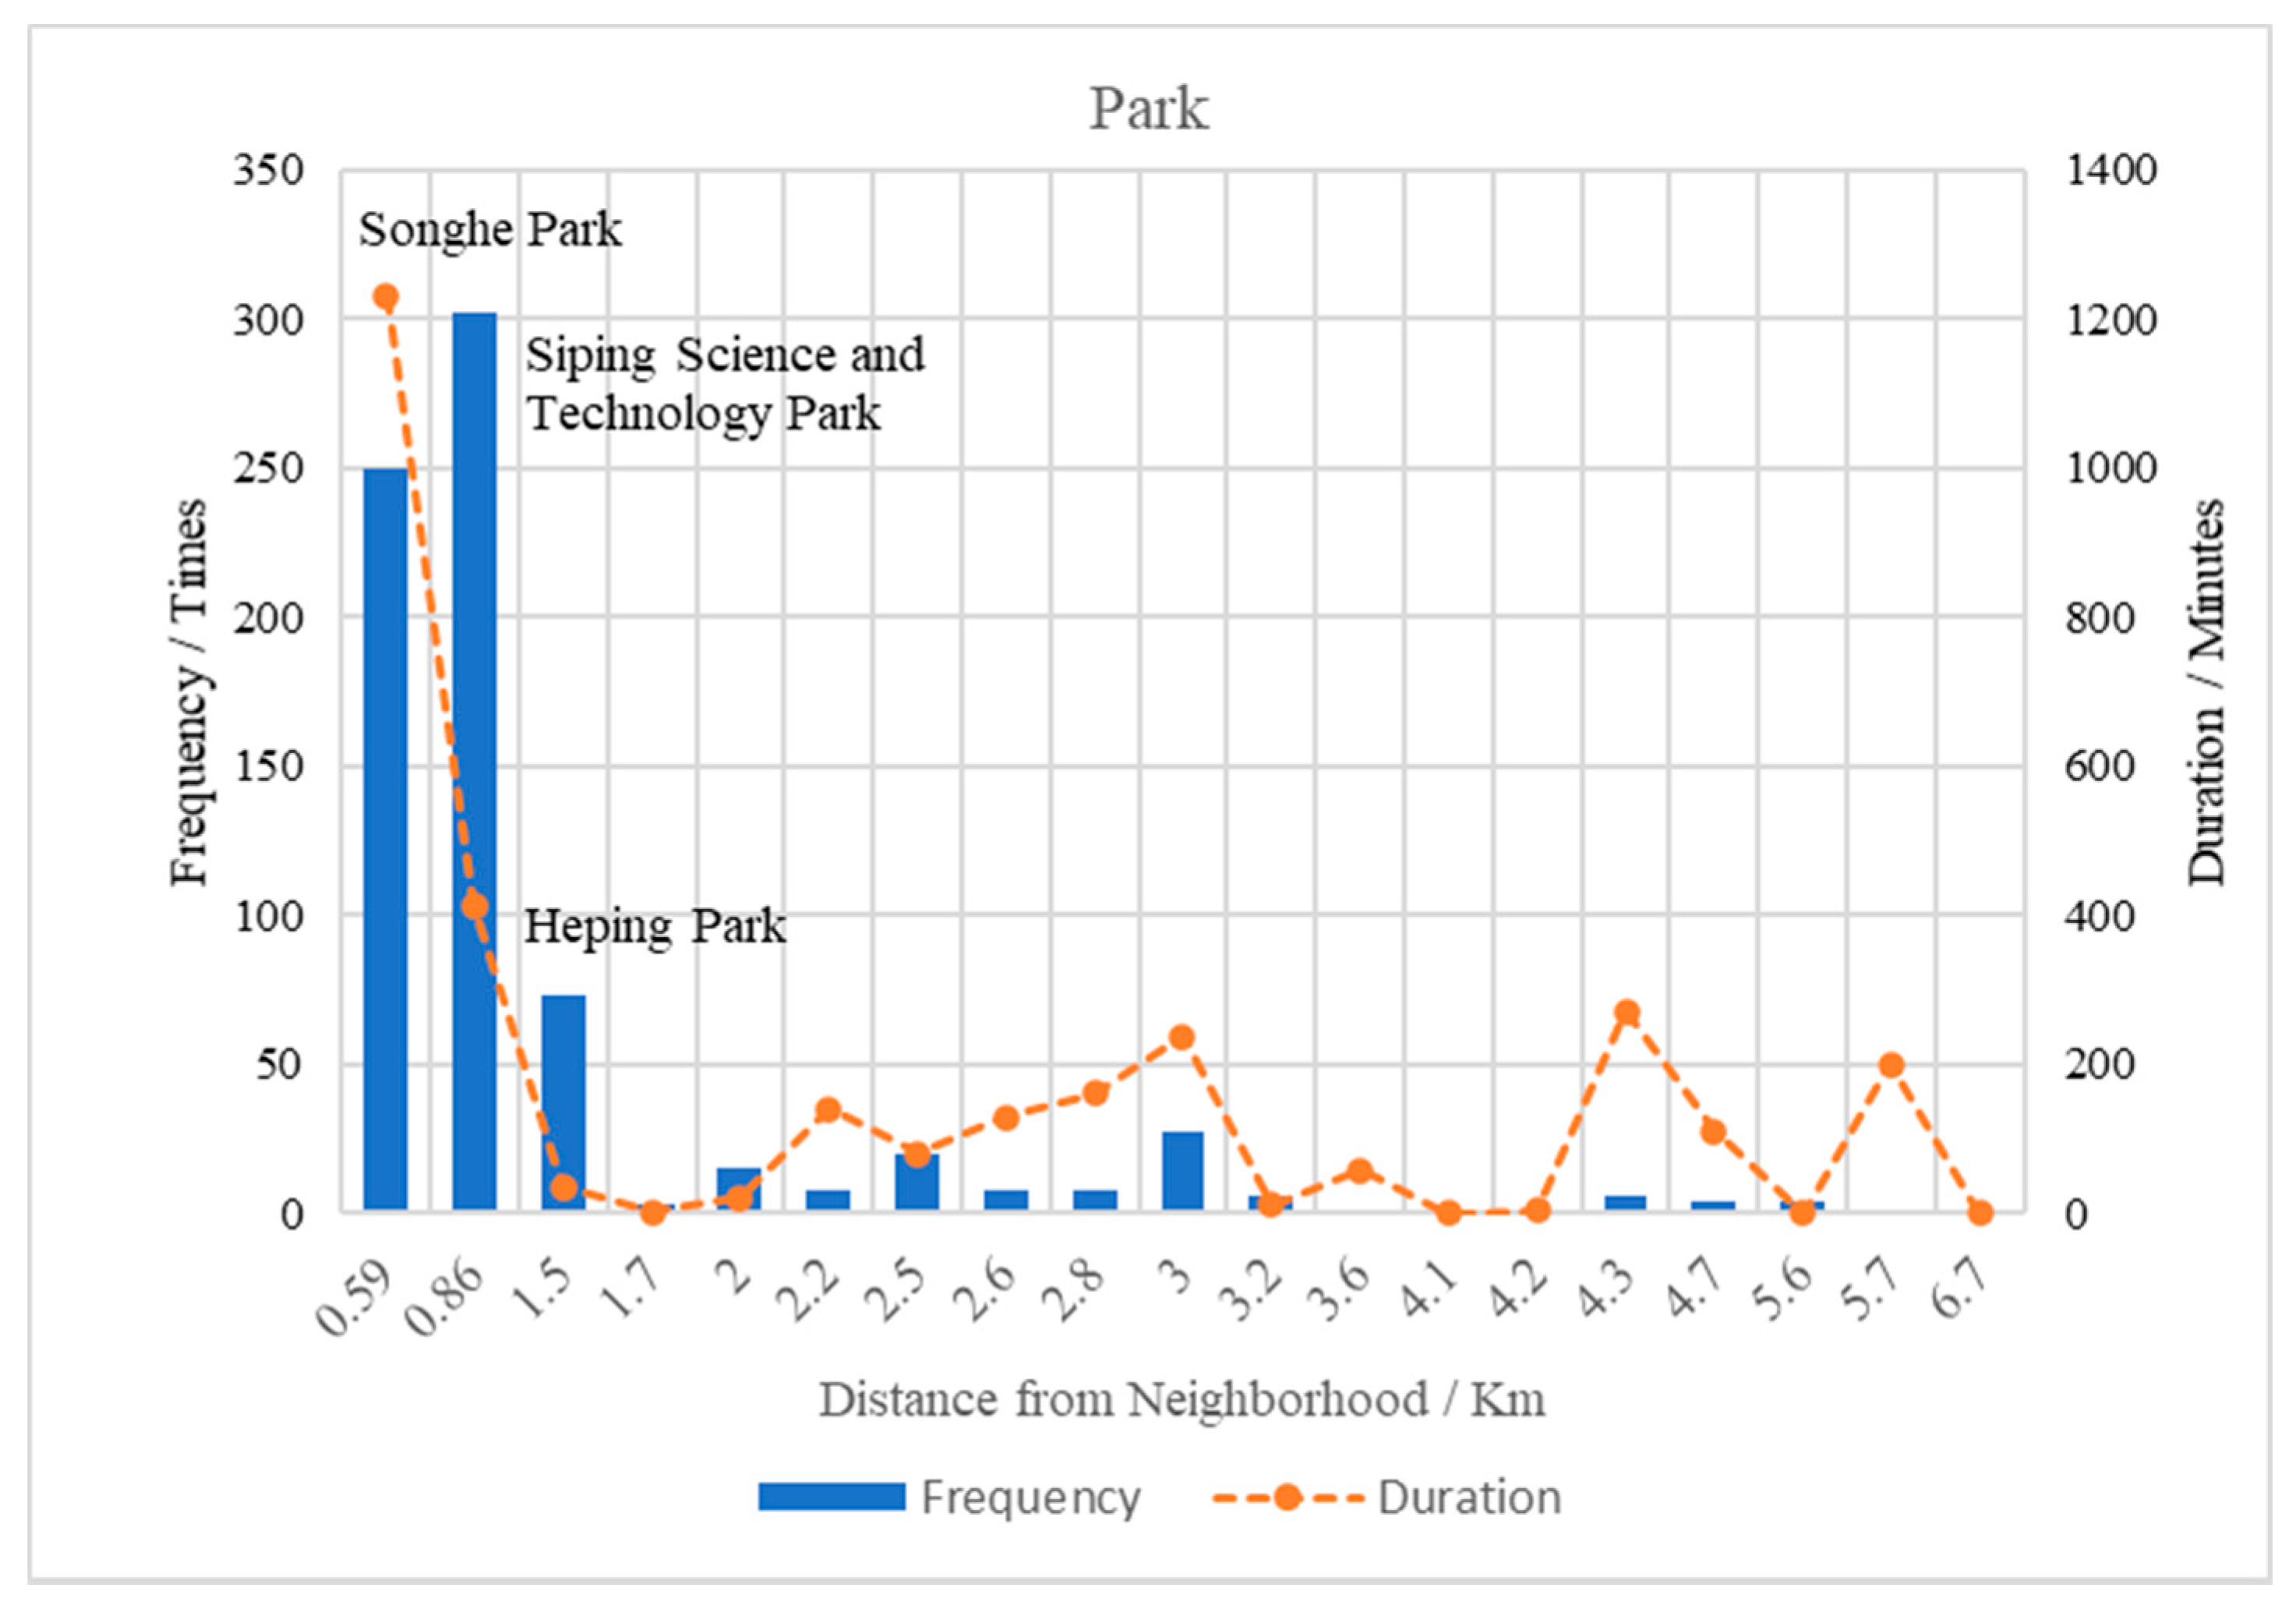
3.2.2. Utility of Public Service Facilities

We found the types of POIs visited by participants on a daily basis mainly included green spaces and public service, commercial, and medical facilities. These POIs were frequently located within a 60 min walking distance. We also found that the accessibility and safety of these facilities were essential for older adults to make their travel behavior choices. For example, our clustering analysis over 102 days of accumulation indicated that the parks most frequently visited by participants included Siping Science and Technology Park and Songhe Park, which were close to our study site despite their small scales. In addition, the quality of spaces affected the duration of stay in the parks. For example, there were fewer shaded areas in the Siping Science and Technology Park than that in the Songhe Park, leading to the shorter time staying in the Siping Science and Technology Park during the summertime (Figure 16).

4. Discussion

This study contributes to our understanding of how older adults living in a high-density urban area use existing public services in the built environment. We used the dynamic and refined GPS data of older adults’ daily activities and established a trajectory database using GIS. This database presents the spatial structure of the activity space of older adults, which is essential to optimize the built environment to facilitate older adults’ daily activities and travel behaviors. Our results indicate that activity space is centered around our study site, 46.3% of participants’ walking trajectories were less than 1.5 km. Most of our participants carried out their daily activities within a 15-min walking distance, especially a 5–10 min walking distance. Accessibility was found to be the most important factor for our participants to choose parks and public facilities. A wide road with heavy traffic was a critical barrier reducing accessibility. In addition, our results reveal that even a homogeneous group of older adults with similar socio-economic statuses and living environmental conditions may still engage in different daily activities. Specifically, older adults in the younger age group (55–64 years old) had a comparatively smaller travel range than those in the older age groups (i.e., 65–74 and 75–84 years of age), partially due to their working affiliation with the nearby university or helping to take care of their grandchildren. Furthermore, our male and female participants had different spatial patterns in their POIs, with male participants visiting more POIs close to their homes and around the boundary of activity space, while the POIs visited by female participants were more evenly distributed. Those differences indicate that new age-friendly construction and renewal of the built environment should not only focus on older adults’ common needs between age/gender groups but also consider the differentiated features within the group to increase the applicability and safety of public facilities. Although we did not involve older adults with self-care and mobility difficulties in this experiment, we believe that providing targeted social services and support to those adults is equally important.
Another contribution of this study is its use of the innovative methods for data collection and analysis. Although micro-data investigation has attracted increasing attention since the beginning of this century, the main tools adopted in urban planning to date are still limited to behavior blogs and investigations. By using real-time individual GPS trajectory data based on the PostgreSQL and data visualization platforms, we obtained objective measures of older adults’ daily travel behaviors and were able to identify activity spaces for the participants, as well as analyze the functions of spaces that the participants were interested in visiting. Specifically, we described the spatial range of the older adults’ daily activities in the community using the innovative concave hull algorithm. Moreover, by using information on the commonly visited POIs and the trajectory data, we investigated how supporting facilities and routes affect travel behaviors. This new method measured not only specific travel behaviors, such as commuting and shopping, but also many repeated and seemingly irregular daily travel behaviors, thus providing a comprehensive picture of older adults’ daily lives. With the advent of digitization of personal behavior, fine-grained individual trajectory data would become more available. To make the most of this opportunity, concave hull has the potential for better measuring people’s daily exposure in the built environment for health-related research.
By identifying the activity space of older adults, this study provides an empirical basis for further investigating the mechanism of how the built environment affect older adults’ daily activities and travel behaviors. This study also provides an actionable direction for tailoring the elderly-oriented design in the community. In summary, the implications of this study include: (a) evaluating the allocation of public resources based on usage; (b) providing a new measurement method for individual accessibility based on spatial constraints; (c) transforming static substantial spatial planning into dynamic life-based space planning and guiding community planning to focus more on the needs of individual residents; (d) matching the schedules and promoting the activity arrangements of various public service facilities in the city to help elderly individuals to choose appropriate times for medical treatment, fitness, and other activities, thereby enables those individuals to receive the greatest service benefits by coordinating time and resources.

5. Conclusions

There is increasing interest in examining the influence of the built environment on activity space to promote health. This paper provided a specific case study in Shanghai, China that used advance technology to identify the activity space of older adults. This study lays a solid data foundation for building an aging-friendly environment and provides ideas for improving the community’s livability for aging-in-place through an evidence-based approach. By establishing and accumulating a high-resolution spatiotemporal behavior database with the community as a unit, we provided evidence for service allocation decisions. We also formed a flexible mechanism that offers timely responses and expands the effects of simulations and predictions. The technological routes, innovative algorithms, and partial results provided in this study could be applied to examine the extent to which the selection of spatial elements influences the health outcomes among older adults. Therefore, those methods and results could contribute to the development of age-friendly cities, smart cities, and healthy cities by providing more targeted services for older adults, improving the efficiency of space and social resources, and advancing the relevant management models.

Author Contributions

Conceptualization, Y.Y.; methodology, J.B.; software, J.B.; formal analysis, J.B.; investigation, J.B., Y.Y. and Y.Z.; data curation, J.B.; writing—original draft preparation, Y.Y. and J.Y.; writing—review and editing, J.Y.; visualization, J.B.; supervision, Y.Y.; project administration, Y.Y.; funding acquisition, Y.Y. All authors have read and agreed to the published version of the manuscript.

Funding

This research was funded by the National Natural Science Foundation of China (grant number 51878456.

Institutional Review Board Statement

The study was conducted according to the guidelines of the Declaration of Helsinki, and approved by the Institutional Ethics Committee of Tongji University (protocol code NO.2015yxy112 and 31 December 2015).

Informed Consent Statement

Not applicable.

Data Availability Statement

Informed consent was obtained from all subjects involved in the study. The data are not publicly available due to privacy concerns.

Acknowledgments

We thank Tongji University for the technical support. We also thank the neighborhood committee of Tongji New Village for supporting our field works.

Conflicts of Interest

The authors declare no conflict of interest.

References

  1. Hirsch, J.A.; Winters, M.; Clarke, P.; McKay, H. Generating GPS activity spaces that shed light upon the mobility habits of older adults: A descriptive analysis. Int. J. Health Geogr. 2014, 13, 51. [Google Scholar] [CrossRef] [Green Version]
  2. Zenk, S.N.; Schulz, A.J.; Matthews, S.A.; Odoms-Young, A.; Wilbur, J.; Wegrzyn, L.; Gibbs, K.; Braunschweig, C.; Stokes, C. Activity space environment and dietary and physical activity behaviors: A pilot study. Health Place 2011, 17, 1150–1161. [Google Scholar] [CrossRef] [PubMed] [Green Version]
  3. Vich, G.; Marquet, O.; Miralles-Guasch, C. Suburban commuting and activity spaces: Using smartphone tracking data to understand the spatial extent of travel behaviour. Geogr. J. 2017, 183, 426–439. [Google Scholar] [CrossRef]
  4. Silm, S.; Ahas, R.; Mooses, V. Are younger age groups less segregated? Measuring ethnic segregation in activity spaces using mobile phone data. J. Ethn. Migr. Stud. 2018, 44, 1797–1817. [Google Scholar] [CrossRef] [Green Version]
  5. Lampoltshammer, T.J.; Kounadi, O.; Sitko, I.; Hawelka, B. Sensing the public’s reaction to crime news using the ‘Links Correspondence Method’. Appl. Geogr. 2014, 52, 57–66. [Google Scholar] [CrossRef]
  6. Vallée, J.; Cadot, E.; Roustit, C.; Parizot, I.; Chauvin, P. The role of daily mobility in mental health inequalities: The interactive influence of activity space and neighbourhood of residence on depression. Soc. Sci. Med. 2011, 73, 1133–1144. [Google Scholar] [CrossRef] [Green Version]
  7. Patterson, Z.; Farber, S. Potential Path Areas and Activity Spaces in Application: A Review. Transp. Rev. 2015, 35, 679–700. [Google Scholar] [CrossRef]
  8. Wang, J.; Kwan, M.-P.; Chai, Y. An Innovative Context-Based Crystal-Growth Activity Space Method for Environmental Exposure Assessment: A Study Using GIS and GPS Trajectory Data Collected in Chicago. Int. J. Environ. Res. Public Health 2018, 15, 703. [Google Scholar] [CrossRef] [PubMed] [Green Version]
  9. Kwan, M.-P.; Weber, J. Scale and accessibility: Implications for the analysis of land use–travel interaction. Appl. Geogr. 2008, 28, 110–123. [Google Scholar] [CrossRef]
  10. Holliday, K.M.; Howard, A.G.; Emch, M.; Rodríguez, D.A.; Evenson, K.R. Are buffers around home representative of physical activity spaces among adults? Health Place 2017, 45, 181–188. [Google Scholar] [CrossRef] [Green Version]
  11. Perchoux, C.; Chaix, B.; Brondeel, R.; Kestens, Y. Residential buffer, perceived neighborhood, and individual activity space: New refinements in the definition of exposure areas—The RECORD Cohort Study. Health Place 2016, 40, 116–122. [Google Scholar] [CrossRef] [PubMed]
  12. Laatikainen, T.E.; Hasanzadeh, K.; Kyttä, M. Capturing exposure in environmental health research: Challenges and opportunities of different activity space models. Int. J. Health Geogr. 2018, 17, 29. [Google Scholar] [CrossRef] [PubMed]
  13. Sallis, J.F.P.; Cerin, E.P.; Conway, T.L.P.; Adams, M.A.P.; Frank, L.D.P.; Pratt, M.P.; Salvo, D.P.; Schipperijn, J.P.; Smith, G.M.A.; Cain, K.L.M.A.; et al. Physical activity in relation to urban environments in 14 cities worldwide: A cross-sectional study. Lancet 2016, 387, 2207–2217. [Google Scholar] [CrossRef] [Green Version]
  14. Cerin, E.; Mitáš, J.; Cain, K.L.; Conway, T.L.; Adams, M.A.; Schofield, G.; Sarmiento, O.L.; Reis, R.S.; Schipperijn, J.; Davey, R.; et al. Do associations between objectively-assessed physical activity and neighbourhood environment attributes vary by time of the day and day of the week? IPEN adult study. Int. J. Behav. Nutr. Phys. Act. 2017, 14, 34. [Google Scholar] [CrossRef] [PubMed] [Green Version]
  15. Adams, M.A.; Frank, L.D.; Schipperijn, J.; Smith, G.; Chapman, J.; Christiansen, L.B.; Coffee, N.; Salvo, D.; du Toit, L.; Dygrýn, J.; et al. International variation in neighborhood walkability, transit, and recreation environments using geographic information systems: The IPEN adult study. Int. J. Health Geogr. 2014, 13, 43. [Google Scholar] [CrossRef] [PubMed] [Green Version]
  16. Leal, C.; Chaix, B. The influence of geographic life environments on cardiometabolic risk factors: A systematic review, a methodological assessment and a research agenda. Obes. Rev. 2011, 12, 217–230. [Google Scholar] [CrossRef]
  17. Calastri, C.; Hess, S.; Daly, A.; Carrasco, J.A. Does the social context help with understanding and predicting the choice of activity type and duration? An application of the Multiple Discrete-Continuous Nested Extreme Value model to activity diary data. Transp. Res. Part A Policy Pract. 2017, 104, 1–20. [Google Scholar] [CrossRef] [Green Version]
  18. Klepeis, N.E.; Nelson, W.C.; Ott, W.R.; Robinson, J.P.; Tsang, A.M.; Switzer, P.; Behar, J.V.; Hern, S.C.; Engelmann, W.H. The National Human Activity Pattern Survey (NHAPS): A resource for assessing exposure to environmental pollutants. J. Expo. Anal. Environ. Epidemiol. 2001, 11, 231–252. [Google Scholar] [CrossRef] [Green Version]
  19. Bolt, E.E.; van der Heide, A.; Onwuteaka-Philipsen, B.D. Reducing questionnaire length did not improve physician response rate: A randomized trial. J. Clin. Epidemiol. 2014, 67, 477–481. [Google Scholar] [CrossRef]
  20. Gonzalez, M.C.; Hidalgo, C.A.; Barabasi, A.-L. Understanding individual human mobility patterns. Nature 2008, 453, 779–782. [Google Scholar] [CrossRef]
  21. Preisler, H.K.; Ager, A.A.; Johnson, B.K.; Kie, J.G. Modeling animal movements using stochastic differential equations. Environmetrics 2004, 15, 643–657. [Google Scholar] [CrossRef]
  22. Shih, D.-H.; Shih, M.-H.; Yen, D.C.; Hsu, J.-H. Personal mobility pattern mining and anomaly detection in the GPS era. Cartogr. Geogr. Inf. Sci. 2016, 43, 55–67. [Google Scholar] [CrossRef]
  23. Turchin, P. Quantitative Analysis of Movement: Measuring and Modeling Population Redistribution in Animals and Plants; Sinauer Associates: Sunderland, MA, USA, 1998. [Google Scholar]
  24. Reininger, M.; Miller, S.; Yanyan, Z.; Cappos, J. A First Look at Vehicle Data Collection via Smartphone Sensors; IEEE: Piscataway, NJ, USA, 2015; pp. 1–6. [Google Scholar] [CrossRef]
  25. Byon, Y.; Shalaby, A.; Abdulhai, B. Travel time collection and traffic monitoring via GPS technologies. In Proceedings of the 2006 IEEE Intelligent Transportation Systems Conference, Toronto, ON, Canada, 17–20 September 2006; pp. 677–682. [Google Scholar]
  26. Kim, H.J.; Heinrich, K.M. Built Environment Factors Influencing Walking to School Behaviors: A Comparison between a Small and Large US City. Front. Public Health 2016, 4, 77. [Google Scholar] [CrossRef] [Green Version]
  27. Forsyth, A.; Michael Oakes, J.; Lee, B.; Schmitz, K.H. The built environment, walking, and physical activity: Is the environment more important to some people than others? Transp. Res. Part D Transp. Environ. 2009, 14, 42–49. [Google Scholar] [CrossRef]
  28. Liu, W.; Lu, H.; Sun, Z.; Liu, J. Elderly’s Travel Patterns and Trends: The Empirical Analysis of Beijing. Sustainability 2017, 9, 981. [Google Scholar] [CrossRef] [Green Version]
  29. Hwang, S.; Kwon, K.; Cha, S.K.; Lee, B.S. Performance evaluation of main-memory R-tree variants. In Proceedings of the International Symposium on Spatial and Temporal Databases, Santorini Island, Greece, 24–27 July 2003; pp. 10–27. [Google Scholar]
  30. Wittmann, M.; Lohrer, J.; Betz, J.; Jäger, B.; Kugler, M.; Klöppel, M.; Waclaw, A.; Hann, M.; Lienkamp, M. A holistic framework for acquisition, processing and evaluation of vehicle fleet test data. In Proceedings of the 2017 IEEE 20th International Conference on Intelligent Transportation Systems (ITSC), Yokohama, Japan, 16–19 October 2017; pp. 1–7. [Google Scholar]
  31. Magtoto, J.; Roque, A. Real-time traffic data collection and dissemination from an Android Smartphone using proportional computation and freesim as a practical transportation system in Metro Manila. In Proceedings of the TENCON 2012 IEEE Region 10 Conference, Cebu, Philippines, 19–22 November 2012; pp. 1–5. [Google Scholar]
  32. Prins, R.G.; Pierik, F.; Etman, A.; Sterkenburg, R.P.; Kamphuis, C.B.M.; van Lenthe, F.J. How many walking and cycling trips made by elderly are beyond commonly used buffer sizes: Results from a GPS study. Health Place 2014, 27, 127–133. [Google Scholar] [CrossRef] [PubMed] [Green Version]
  33. Kestens, Y.; Thierry, B.; Shareck, M.; Steinmetz-Wood, M.; Chaix, B. Integrating activity spaces in health research: Comparing the VERITAS activity space questionnaire with 7-day GPS tracking and prompted recall. Spat. Spatio-Temporal Epidemiol. 2018, 25, 1–9. [Google Scholar] [CrossRef] [PubMed]
  34. Ester, M.; Kriegel, H.-P.; Sander, J.; Xu, X. A density-based algorithm for discovering clusters in large spatial databases with noise. In Proceedings of the KDD-96, Portland, OR, USA, 2–4 August 1996; pp. 226–231. [Google Scholar]
  35. GPS Product Team. Global Positioning System (GPS) Standard Positioning Service (SPS) Performance Analysis Report; GPS Product Team: Washington, DC, USA, 2014.
  36. Powell, R.A.; Mitchell, M.S. What is a home range? J. Mammal. 2012, 93, 948–958. [Google Scholar] [CrossRef] [Green Version]
  37. Van Winkle, W. Comparison of several probabilistic home-range models. J. Wildl. Manag. 1975, 39, 118–123. [Google Scholar] [CrossRef]
  38. Walter, W.D.; Fischer, J.W.; Baruch-Mordo, S.; VerCauteren, K.C. What is the proper method to delineate home range of an animal using today’s advanced GPS telemetry systems: The initial step. Mod. Telem. 2011, 68. [Google Scholar] [CrossRef] [Green Version]
  39. Fan, Y.; Khattak, A.J. Urban Form, Individual Spatial Footprints, and Travel: Examination of Space-Use Behavior. Transp. Res. Rec. 2008, 2082, 98–106. [Google Scholar] [CrossRef]
  40. Edelsbrunner, H.; Kirkpatrick, D.; Seidel, R. On the shape of a set of points in the plane. IEEE Trans. Inf. Theory 1983, 29, 551–559. [Google Scholar] [CrossRef] [Green Version]
  41. Asaeedi, S.; Didehvar, F.; Mohades, A. α-Concave hull, a generalization of convex hull. Theor. Comput. Sci. 2017, 702, 48–59. [Google Scholar] [CrossRef]
Figure 1. Study site: (a) map of the study site; (b) photo of the study site.
Sustainability 13 05003 g001
Figure 2. Age and gender structure of the participants.
Sustainability 13 05003 g002
Figure 3. Dashboard of Community Residents’ Behavior Monitoring Software V1.0. Note: the upper left module shows the real-time location of the participants; the upper right module indicates the continuity of the data acquisition; the lower left module shows the accumulated time of using smartphone from each participant and by different age groups; the right module is the panel for data visualization: users could examine the data by ID, gender and age group.
Sustainability 13 05003 g003
Figure 4. Framework for processing and analyzing data.
Sustainability 13 05003 g004
Figure 5. Distribution of trajectory data generated by 76 participants in 102 days. Note: The x axis represents the IDs of participant from smallest to largest. The y axis represents the data size, and the number of GPS points. The color transition from blue to yellow represents a gradual increase in the data quantity. Specifically, blue represents a small number of GPS points, while bright colors, such as yellow, represent large quantities.
Sustainability 13 05003 g005
Figure 6. Cluster, core point and noise between Density-based spatial clustering of applications with noise (DBSCAN) and (personal temporal-DBSCAN) PT-DBSCAN. (a) standard DBSCAN cluster; (b) PT-DBSCAN cluster.
Sustainability 13 05003 g006
Figure 7. Convex hull and concave hull with the Alpha shape algorithm.
Sustainability 13 05003 g007
Figure 8. Examples of two different approaches to delineate activity space. (A): convex hull (minimum convex polygon), (B): concave hull.
Sustainability 13 05003 g008
Figure 9. Travel range by age groups. (a) 55–64; (b) 65–74; (c) 75–84; (d) 85+.
Sustainability 13 05003 g009
Figure 10. Superposition of daily activity space of participants.
Sustainability 13 05003 g010
Figure 11. Hourly walking distances by gender (km).
Sustainability 13 05003 g011
Figure 12. Range of older adults’ daily activities: (a) concave hull; (b) activity space.
Sustainability 13 05003 g012
Figure 13. Activity spaces of male and female participants among different age groups: (a) group 1: ages 55–64; (b) group 2: ages 65–74; (c) group 3: ages ≥75.
Sustainability 13 05003 g013
Figure 14. Scope of older adults’ activities.
Sustainability 13 05003 g014
Figure 15. POIs and walking trajectories: (a) five categories of POIs from Gaode map; (b) walking trajectories of three age groups.
Sustainability 13 05003 g015
Figure 16. Use of POIs of the urban green space type.
Sustainability 13 05003 g016
Table 1. Summary of daily travel time, frequency, and distance (mean ± standard deviation (SD)) among older adults in different age groups.
Age GroupTravel TimeTravel FrequencyTravel Distance
(minutes)(times/day)(kilometers)
Ages 55–6426.0 ± 24.82.6 ± 2.22.4 ± 2.3
Ages 65–7419.2 ± 18.52.1 ± 1.61.9 ± 1.7
Ages ≥ 7520.7 ± 23.71.8 ± 1.22.0 ± 2.4
Publisher’s Note: MDPI stays neutral with regard to jurisdictional claims in published maps and institutional affiliations.

