
Measuring the Urban Forms of Shanghai’s City Center and Its New Districts: A Neighborhood-Level Comparative Analysis


_Chen.png)
1
Department of Urban Planning and Design, Xi’an Jiaotong-Liverpool University, Suzhou 215123, China
2
Urban and Regional Studies and Planning Program, L. Douglas Wilder School of Government and Public Affairs, Virginia Commonwealth University, Richmond, VA 23284, USA
3
Urban Form Lab, University of Washington, Seattle, WA 98195, USA
*
Author to whom correspondence should be addressed.
Sustainability 2021, 13(15), 8481; https://doi.org/10.3390/su13158481
Submission received: 15 June 2021
/
Revised: 15 July 2021
/
Accepted: 25 July 2021
/
Published: 29 July 2021
(This article belongs to the Special Issue Sustainable Transportation Planning and Policy)
Abstract
:Rapid urban expansion has radically transformed the city centers and the new districts of Chinese cities. Both areas have undergone unique redevelopment and development over the past decades, generating unique urban forms worthy of study. To date, few studies have investigated development patterns and land use intensities at the neighborhood level. The present study aims to fill the gap and compare the densities of different types of developments and the spatial compositions of different commercial uses at the neighborhood level. We captured the attributes of their built environment that support instrumental activities of daily living of 710 neighborhoods centered on the public elementary schools of the entire Shanghai municipality using application programming interfaces provided in Baidu Map services. The 200 m neighborhood provided the best fit to capture the variations of the built environment. Overall, city center neighborhoods had significantly higher residential densities and housed more daily routine destinations than their counterparts in the new districts. Unexpectedly, however, the total length of streets was considerably smaller in city-center neighborhoods, likely reflecting the prominence of the wide multilane vehicular roads surrounding large center city redevelopment projects. The findings point to convergence between the city center’s urban forms and that of the new districts.
1. Introduction
Pre-1979 Chinese cities were compact [1]. Since the 1980s, the rapid expansion of built-up areas has transformed Chinese urban landscapes [1]. As the gateway to China’s modernity [2] and the financial center for socialist China [3], Shanghai exemplifies these transformations.
In the early 20th century, Shanghai was composed of compact, crowded, and multifunctional neighborhoods where people conducted most of their daily activities near their homes, and where almost all daily needs could be met within walking distance [4]. Between the 1950s and 1970s, new workers’ villages or integral residential communities with schools, retail, and other public service facilities were built at the fringes of the existing city [5,6]. The planning and design of workers’ new villages generally followed principles similar to those of Perry’s neighborhood unit [5,7,8]. These urban forms continue to affect travel behavior today; walking and biking account for more than half of travel mode share for subsistence and maintenance trips in Shanghai’s city center [9].
The economic reform starting in 1978 brought significant urban and economic development in Chinese cities [10,11]. In already developed urban areas, redevelopment took place following the ten years of stagnation experienced during the Cultural Revolution (1966 to 1976) [12]. Like other Chinese cities, Shanghai city center went through staggering transformations [13,14] as old buildings were demolished and replaced with commercial blocks and multistory dwellings [15].
There was also massive urban development beyond existing cities. In Shanghai, the urban area grew from 832.46 km2 in 1990 to 2968.01 km2 in 2009, an astonishing 257% increase [16]. Much of the urban expansion took place on converted arable land [17,18]. New districts in Shanghai, such as Minhang, Pudong, Baoshan, Jiading, Qingpu, Songjiang, and Jinshan, were created in counties that were rural in the 1990s. Development was done on a project by project basis, using relatively low-density schemes that leapfrogged each other within the large zones that had been slated for the new development [11,19]. In these new urban forms, walking and biking trips only now account for 10% of travel mode share for subsistence and maintenance trips [20]. The city center and the new urban districts of Shanghai have experienced different development patterns and intensity of land uses.
The neighborhood has been a basic spatial unit to examine the physical form of cities and towns [7]. The neighborhood is a self-contained spatial unit, and its center has been defined around schools, community centers, parks, or retail services [8,21,22]. Schools are essential neighborhood elements because they exert essential influence on residential location decisions and area-specific housing demand [23,24]. As such, they are one of the most ubiquitous institutions shaping the city and regional ecology, policy, and everyday experience [25]. In China particularly, education has always been a vital means of personal advancement and Chinese parents place a strong emphasis on the role of schools and teachers in the education of their children [26]. The importance of school is coincident with Perry’s (1929) position that the elementary school is the central institution to which families with young children were related, and neighborhoods should, accordingly, be built around elementary schools [27]. Hence, elementary schools are an especially relevant factor determining Chinese households’ residential location choice. The enrollment of school-age children to public elementary schools in Chinese cities is proximity-based [28]. Housing values in Shanghai and other Chinese cities are in great part based on access to schools [29,30]. As for children, schools and the environment around schools have been found to impact on how children commute to school [31], their food choices [32], and physical activity [33]. It follows that considering a school, and in particular, a public elementary school, as the center of a neighborhood makes sense since it will capture an area that will be the center of a household’s everyday life.
Most previous studies that investigated physical changes of Chinese cities since the economic reform of 1978 were conducted either at the macro level, from the perspective of regional expansion [34,35,36,37,38,39], or at the micro level, focusing on buildings as agents of urban form transformation [19,40,41,42,43,44,45]. However, less is known on the magnitude of and differences in development patterns and land use intensities at the neighborhood level. Access to public data has been a significant challenge for Chinese scholars, especially for those specialized in the humanities and social sciences [46]. Meanwhile, web mapping services such as Baidu Maps, a Chinese version of Google Maps, have rapidly developed and are widely used. Land use information can be obtained as online points of interest (POI) data using application programming interfaces (APIs) provided by Baidu online mapping services [47]. Baidu Maps APIs now yield such current land use data as detailed commercial activity at the building level and land-use intensity at the neighborhood level of Chinese cities. Online mapping with APIs thus offers an alternative approach to acquire built environment data on Chinese cities.
In recent years, urban open data such as OpenStreetMap data and online POIs data start to be used in studies on urban form and functions in Chinese cities [48,49,50,51,52]. Liu and colleagues summarized urban open data available in China and introduced studies using OpenStreetMap and online POI data at the 1 km by 1 km grid and subdistrict level to investigate Chinese urbanization [48]. Long and colleagues used urban open data to identify natural cities in China [49]. A recent study applied POIs data to identify live-work-play centers in 285 Chinese cities [50]. Other studies examined the density, diversity, and accessibility of road networks in Chinese cities [51,52].
The present study aims to fill the gap and to investigate neighborhood-level densities of different types of development and the spatial compositions of different commercial land uses, which past research has shown to be related to residents’ daily life [40]. Specifically, the objective of the study is to probe into differences in the built environment of the city center, which has been redeveloped, and of the newly developed areas to understand the known differences in the travel behaviors of the two areas.
The novelty of the study lies in taking advantage of the recent availability of online mapping services and advanced GIS techniques in China, which make it possible to conduct systematic investigations of urban form and the built environment at the neighborhood level. The present novel approach can be generalized and applied to objectively measuring the built environment of other Chinese cities.
2. Materials and Methods
2.1. Study Area
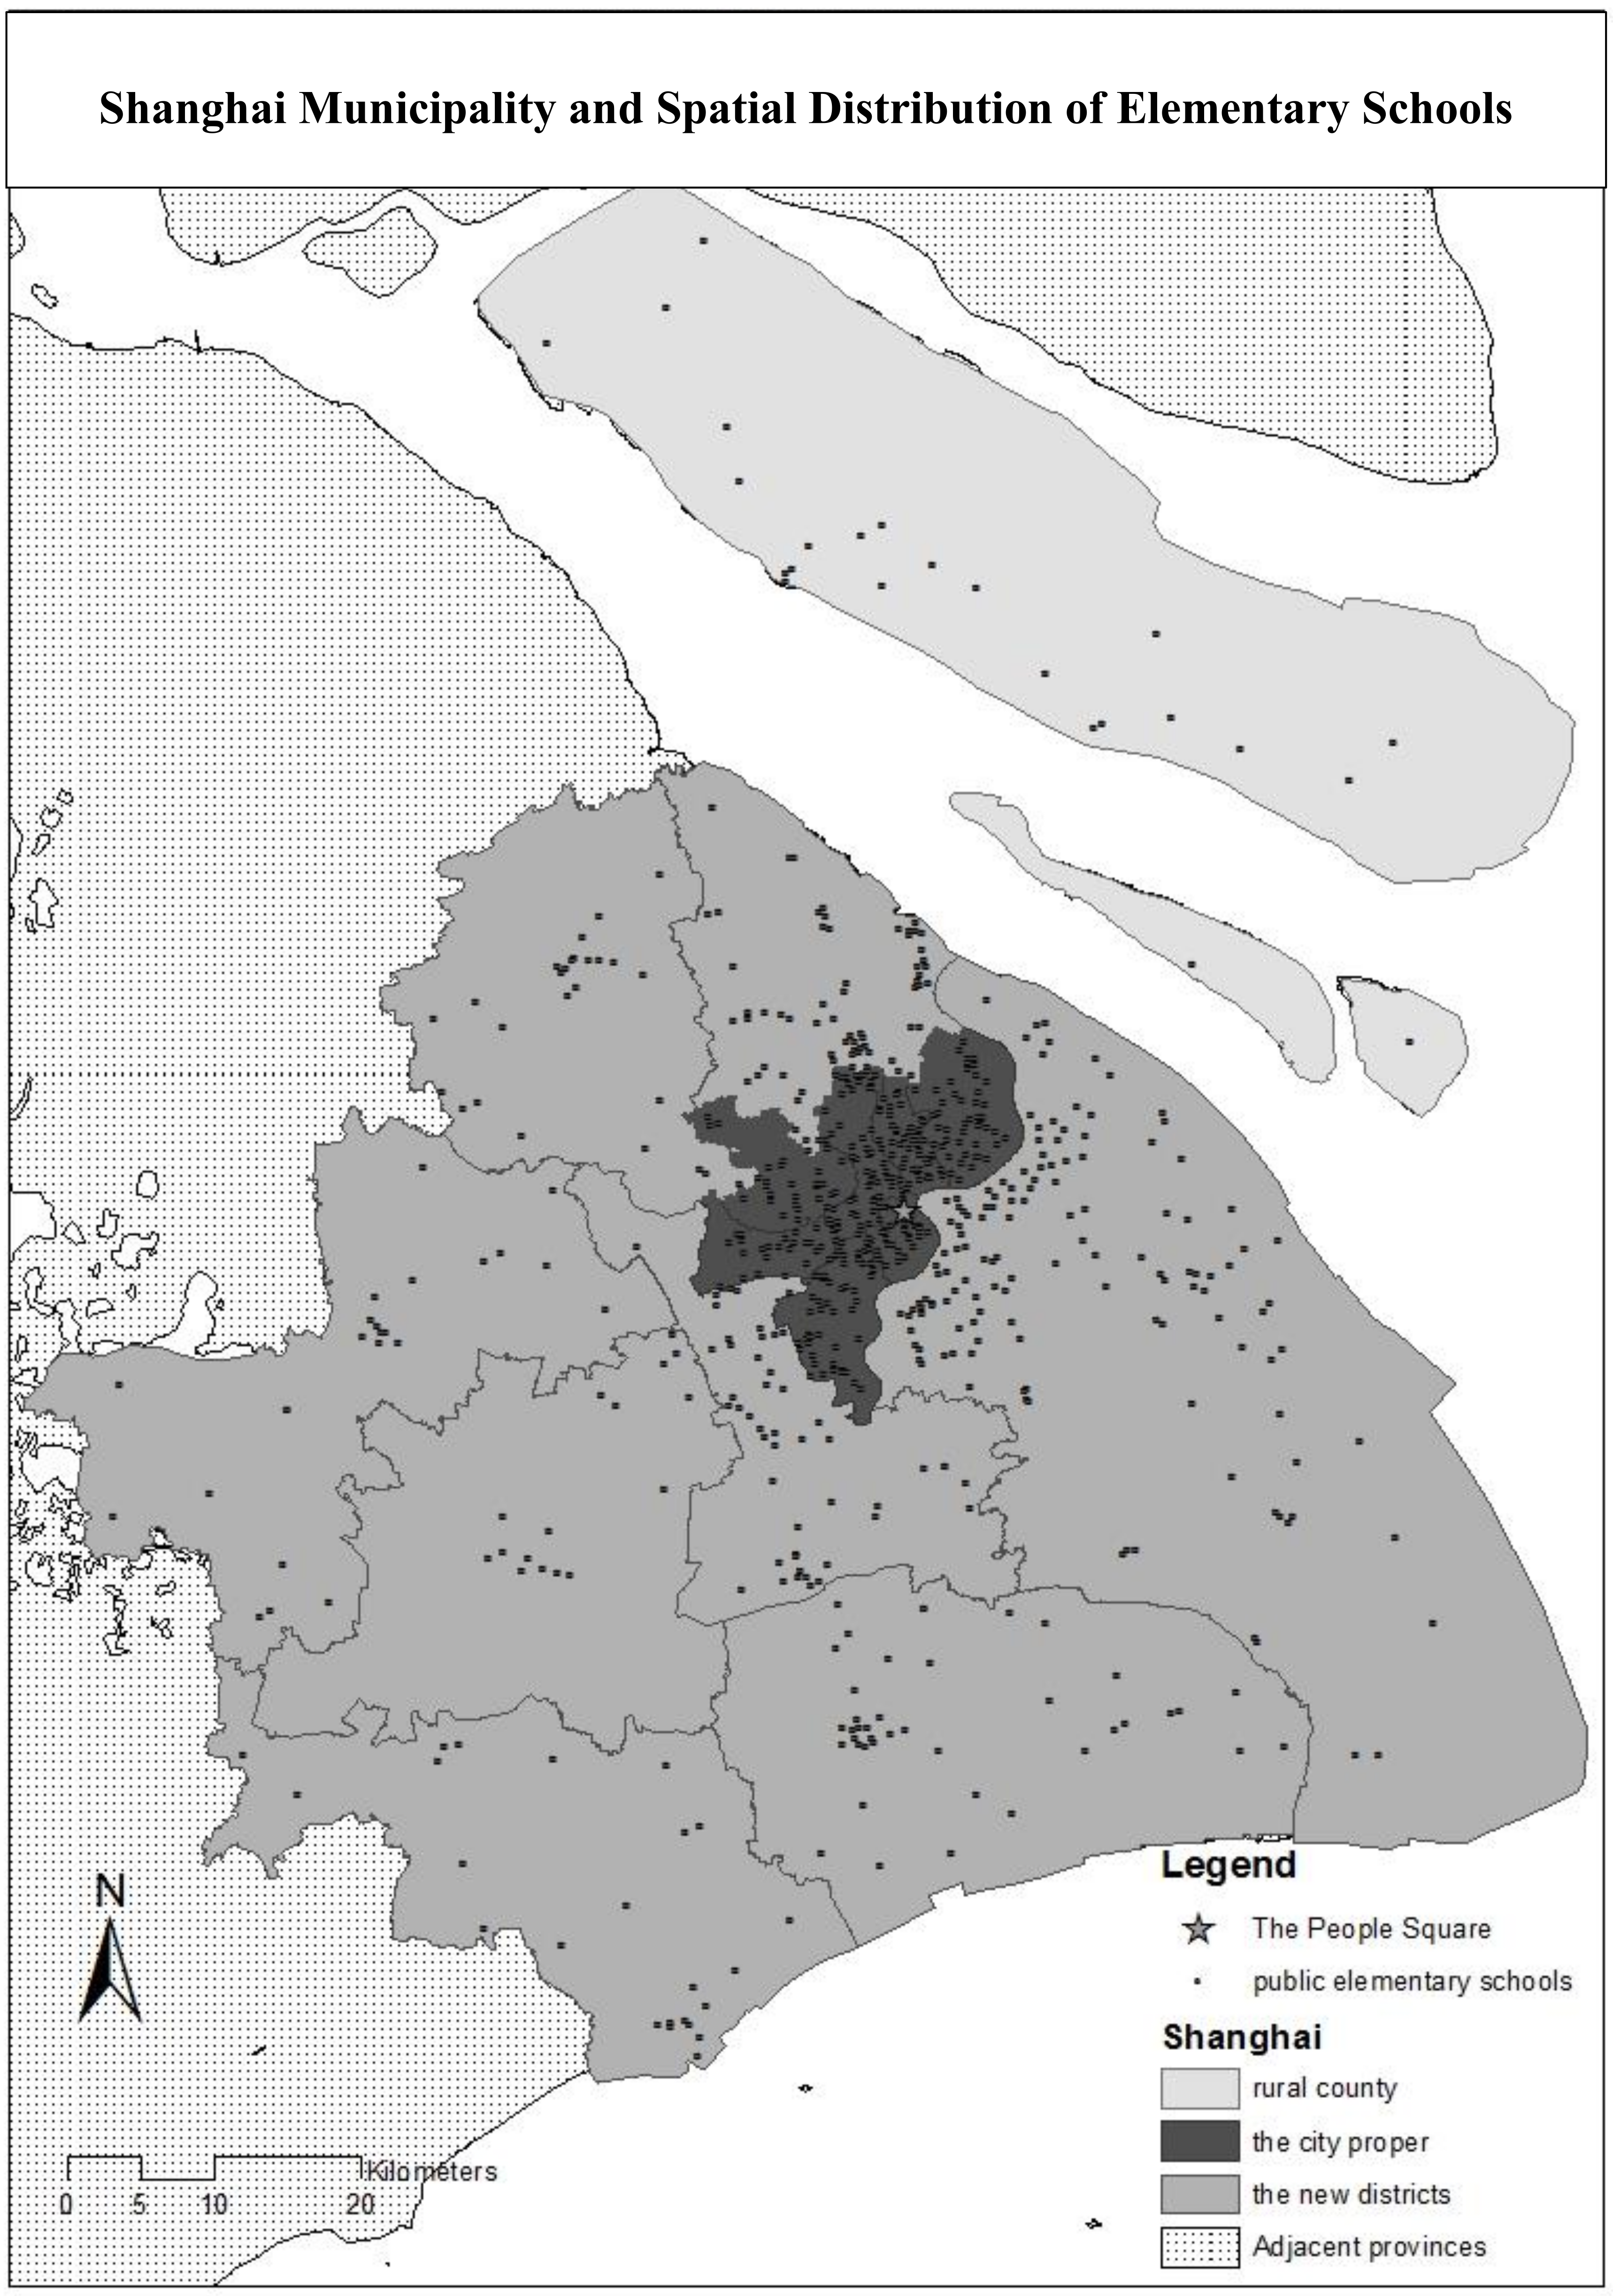
Located in the Yangtze river delta with a population of 24 million and a total land area of 6,340.5 square kilometers [53], Shanghai is the most developed city in China in terms of gross domestic product (GDP). There are 15 districts and one rural county in Shanghai (Figure 1). Among those 15 districts, seven (Yangpu, Hongkou, Putuo, Changning, Xuhui, Jing’an, and Huangpu) comprise the Puxi area, or the city center located west of the Huangpu river (dark color in Figure 1). The remaining districts are the new districts, which were developed after the 1980s.
2.2. Data
A total of 715 public elementary school addresses were obtained from the Shanghai Municipal Education Commission in 2014. Of those, 710 (99%) were geocoded using Baidu Maps, the desktop and mobile web mapping service application provided by Baidu (a Chinese web services company). In 2014, Shanghai street network data of 2010 (the latest data available at that time) were purchased from AutoNavi Software Co., Ltd., a corporation of web mapping content and navigation, and location-based solutions in China. Figure 1 displays the spatial distribution of public elementary schools in Shanghai.
2.3. Built Environment Attributes
The built environment attributes of school-centered neighborhoods were captured using application programming interfaces (APIs) provided by Baidu Maps. There seems to be no consensus on what constitutes an appropriate size of an urban neighborhood. Perry’s neighborhood unit was contained within the area defined roughly by a 400 m radius [54]. Similarly, a conventional transit-oriented development (TOD) district was defined as a circle centered at the transit station within a 400–500 m radius [55]. Meanwhile, walkability studies have suggested that a half-mile (about 800 m) or a 10-min walk is appropriate in today’s mobility standards, and used 800 m to define walkable neighborhoods [56,57].
Subsequently, several buffer sizes were used to define the school-centered neighborhoods to include the 100 m and 200 m radii used to test variations of physical characteristics; the 400 m buffer radius originally used in Perry’s neighborhood unit, and the 800 m buffer defining the neighborhood area that can be accessed in a 10-minute walk to and from school. Table 1 lists attributes of the built environment measures, which were captured in 2015 and selected based on locations and facilities that support instrumental activities of daily living (IADL) used in public health profession and defined as those activities that allow a senior to live independently in a community [58,59,60,61]. IADL include activities such as shopping, cooking, use of transportation, managing money, managing medication, etc. [59]. Specifically, land uses such as retail stores, supermarkets, and farmer’s markets could support for daily shopping, regular restaurants and fast-food restaurants could be substituted for cooking, transportation facilities such as bus stops, subway stations, gas stations, train stations, parking lots, and street intersections are for use of transportation, banks for managing money, and drug stores and hospitals for managing medication. Measuring residential and office buildings was to acquire information such as density and the predominant land use type in the neighborhood. Parks, green open space, are important for resident’s physical activity and mental wellbeing [62,63]. Education uses are to acquire information on additional educational uses such as kindergarden, middle school, and high school. Euclidean distance was calculated from each elementary school to People’s Square, Shanghai’s current political and economic center and the location of Shanghai municipal government headquarters, which replaced the 1862 horse racing track in 1949 [64], as a measure of the regional location to capture distance to the city’s primary center. Total street network length was summed up for all four buffers as well, excluding streets and roads that only allow automobile access such as highways and therefore do not contribute to everyday life within the neighborhood. The rest of the built environment attributes were also tallied individually for all four buffers. Of note, information on building size, height, or total floor area was not available in Baidu Maps.
2.4. Regression Model Development
To identify built environment attributes that are associated with whether a school is located in the city center or the new districts of Shanghai, four sets of binary logistic regression models were developed for built environment attributes measured in the four buffers, respectively. Built environment measures that were significantly correlated with each other, and specifically those correlated with residential building counts, were excluded from the regression models to avoid multicollinearity. Residential density (measured in this study as residential building counts in the different buffers) being a distinct dimension of urban form [65,66,67,68,69], was retained in all regression models for its theoretical significance. To address spatial autocorrelation, the Euclidean distance from a school to the city center was included as the autocovariate [70], which is an indicator of an endogenous process where distance is reversely associated with being located in the city center. As the built environment attributes were measured in four buffers, four regression models were developed accordingly, with built environment attributes from the same buffer in the same model.
2.5. Models Selection
Models were selected using the goodness of fit. The goodness of fit of different models was assessed using two penalized model selection criteria: the Bayesian information criterion (BIC) and the Akaike information criterion (AIC) [71]. Preferred models would have lower values of BIC and AIC:
where p denotes the number of parameters used in models; and n denotes the number of observations.
BIC = −2 log likelihood + ln (n)*p
AIC = −2 log likelihood +2p
3. Results
3.1. Descriptive and Bivariate Statistics
Of the 710 elementary schools that could be geocoded, 289 (40.7%) were located in the city center and 421 (59.3%) were in the new districts. Table 2 summarizes descriptive statistics of residential and office buildings and transportation facilities and Table 3 presents the descriptive summaries of different land use in the four neighborhood buffers by the city center and new districts. P-values of bivariate analyses between each built environment attribute and whether a school was located in the city center or new districts were included in the tables as well. Most of the built environment attributes showed a significant difference between the city center and new districts, except for six transportation facility attributes (counts of bus stops in the 100 m buffer, counts of metro stations in the 200 m buffer, counts of gas stations in the 100 and 200 m buffers, street network length in the 100 m buffer, and counts of street intersections in the 200 m buffer), and seven land use attributes (counts of hotels in the 200 m buffer, counts of supermarkets in the 100 and 200 m buffers, counts of farmer’s markets in the 100 and 200 m buffers, counts of drug stores in the 200 m buffer, and counts of parks in the 200 m buffer). Counts of residential buildings, office buildings, and parking lots in all four buffers are significantly different between the city center and new districts. As for land use attributes, counts of regular restaurants, fast-food restaurants, retail stores, banks, hospitals, and education use in all four buffers also exhibited significant differences between the city center and new districts.
Shanghai has many regular restaurants and fast-food restaurants. Specifically, 44% of schools (312) had at least one regular restaurant and 39% (278 schools) had at least one fast-food restaurant within 100 m, and 33% (234 schools) had more than 100 regular restaurants and 22% had more than 100 fast-food restaurants within 800 m.
Residential buildings measured in the 100 m, 200 m, 400 m, and 800 m buffers were significantly correlated with office buildings, parking lots, regular restaurants, fast-food restaurants, hotels, supermarkets, farmer’s markets, banks, hospitals, and drug stores that were measured within the same buffers (results are shown in the Supplementary Table S1). Except for counts of farmer’s markets and hospitals in the 200 m buffer, and banks and hospitals in the 100 m buffer, the tallies of regular restaurants, fast-food restaurants, hotels, retail stores, supermarket, farmer’s markets, banks, hospitals, and drug stores within the four buffers were correlated with each other. As expected, total street network length measured in the four buffers was significantly and positively associated with counts of street intersections in the corresponding buffers. Except for a few variables, however, most of the built environment attributes were not associated with street network length or street intersections.
3.2. Binary Logistic Regression Results
Distance to the city center was included in all models as were residential building counts. Built environment variables that were correlated with residential building counts were excluded. If a built environment variable was not correlated with residential building counts but correlated with other independent variables included in the models, the variable was excluded as well. For the model using the 100 m buffer measures, the two attributes chosen were bus stop and total street network length. The 200 m model included street network length and educational use. The 400 m model included bus stop and street network length, and the 800 m model included street network length.
Table 4 shows the results of binary logistic regression models for all four buffers estimating the likelihood of a school to be located in the city center or a new district. As expected, the distance to the city center was consistently significantly negatively associated with a school being located in the city center. In the 100 m model, residential buildings counts exhibited a strong and significant positive association with a neighborhood being located in the city center, but total street network length and counts of bus stops were not significant (Table 4).
Similarly, in the 200 m model, residential buildings significantly positively associated with a school located in the city center. Meanwhile, total street network length and counts of education land use were significantly but negatively associated with a school located in the city center (Table 4).
In the 400 m model, a school was more likely to be located in Shanghai’s new districts if, controlling for other variables, it had one to ten residential buildings within the buffer. In the same model, the total street network length consistently showed a significant negative association with a school located in the city center. The count of bus stops was not significant (Table 4).
In the 800 m model, a school was more likely to be located in the city center if, controlling for other variables, it had more than 100 residential buildings within the buffer. Similar to the results of the 200 m and 400 m models, the total street network length showed a significant negative association with a school being located in the city center (Table 4).
BIC and AIC indicators were calculated to compare goodness of fit of different regression models (Table 5). The 200 m model, which included four independent variables, distance to the city center, counts of the residential building, total street network length, and counts of educational uses had the lowest BIC and AIC values.
4. Discussion
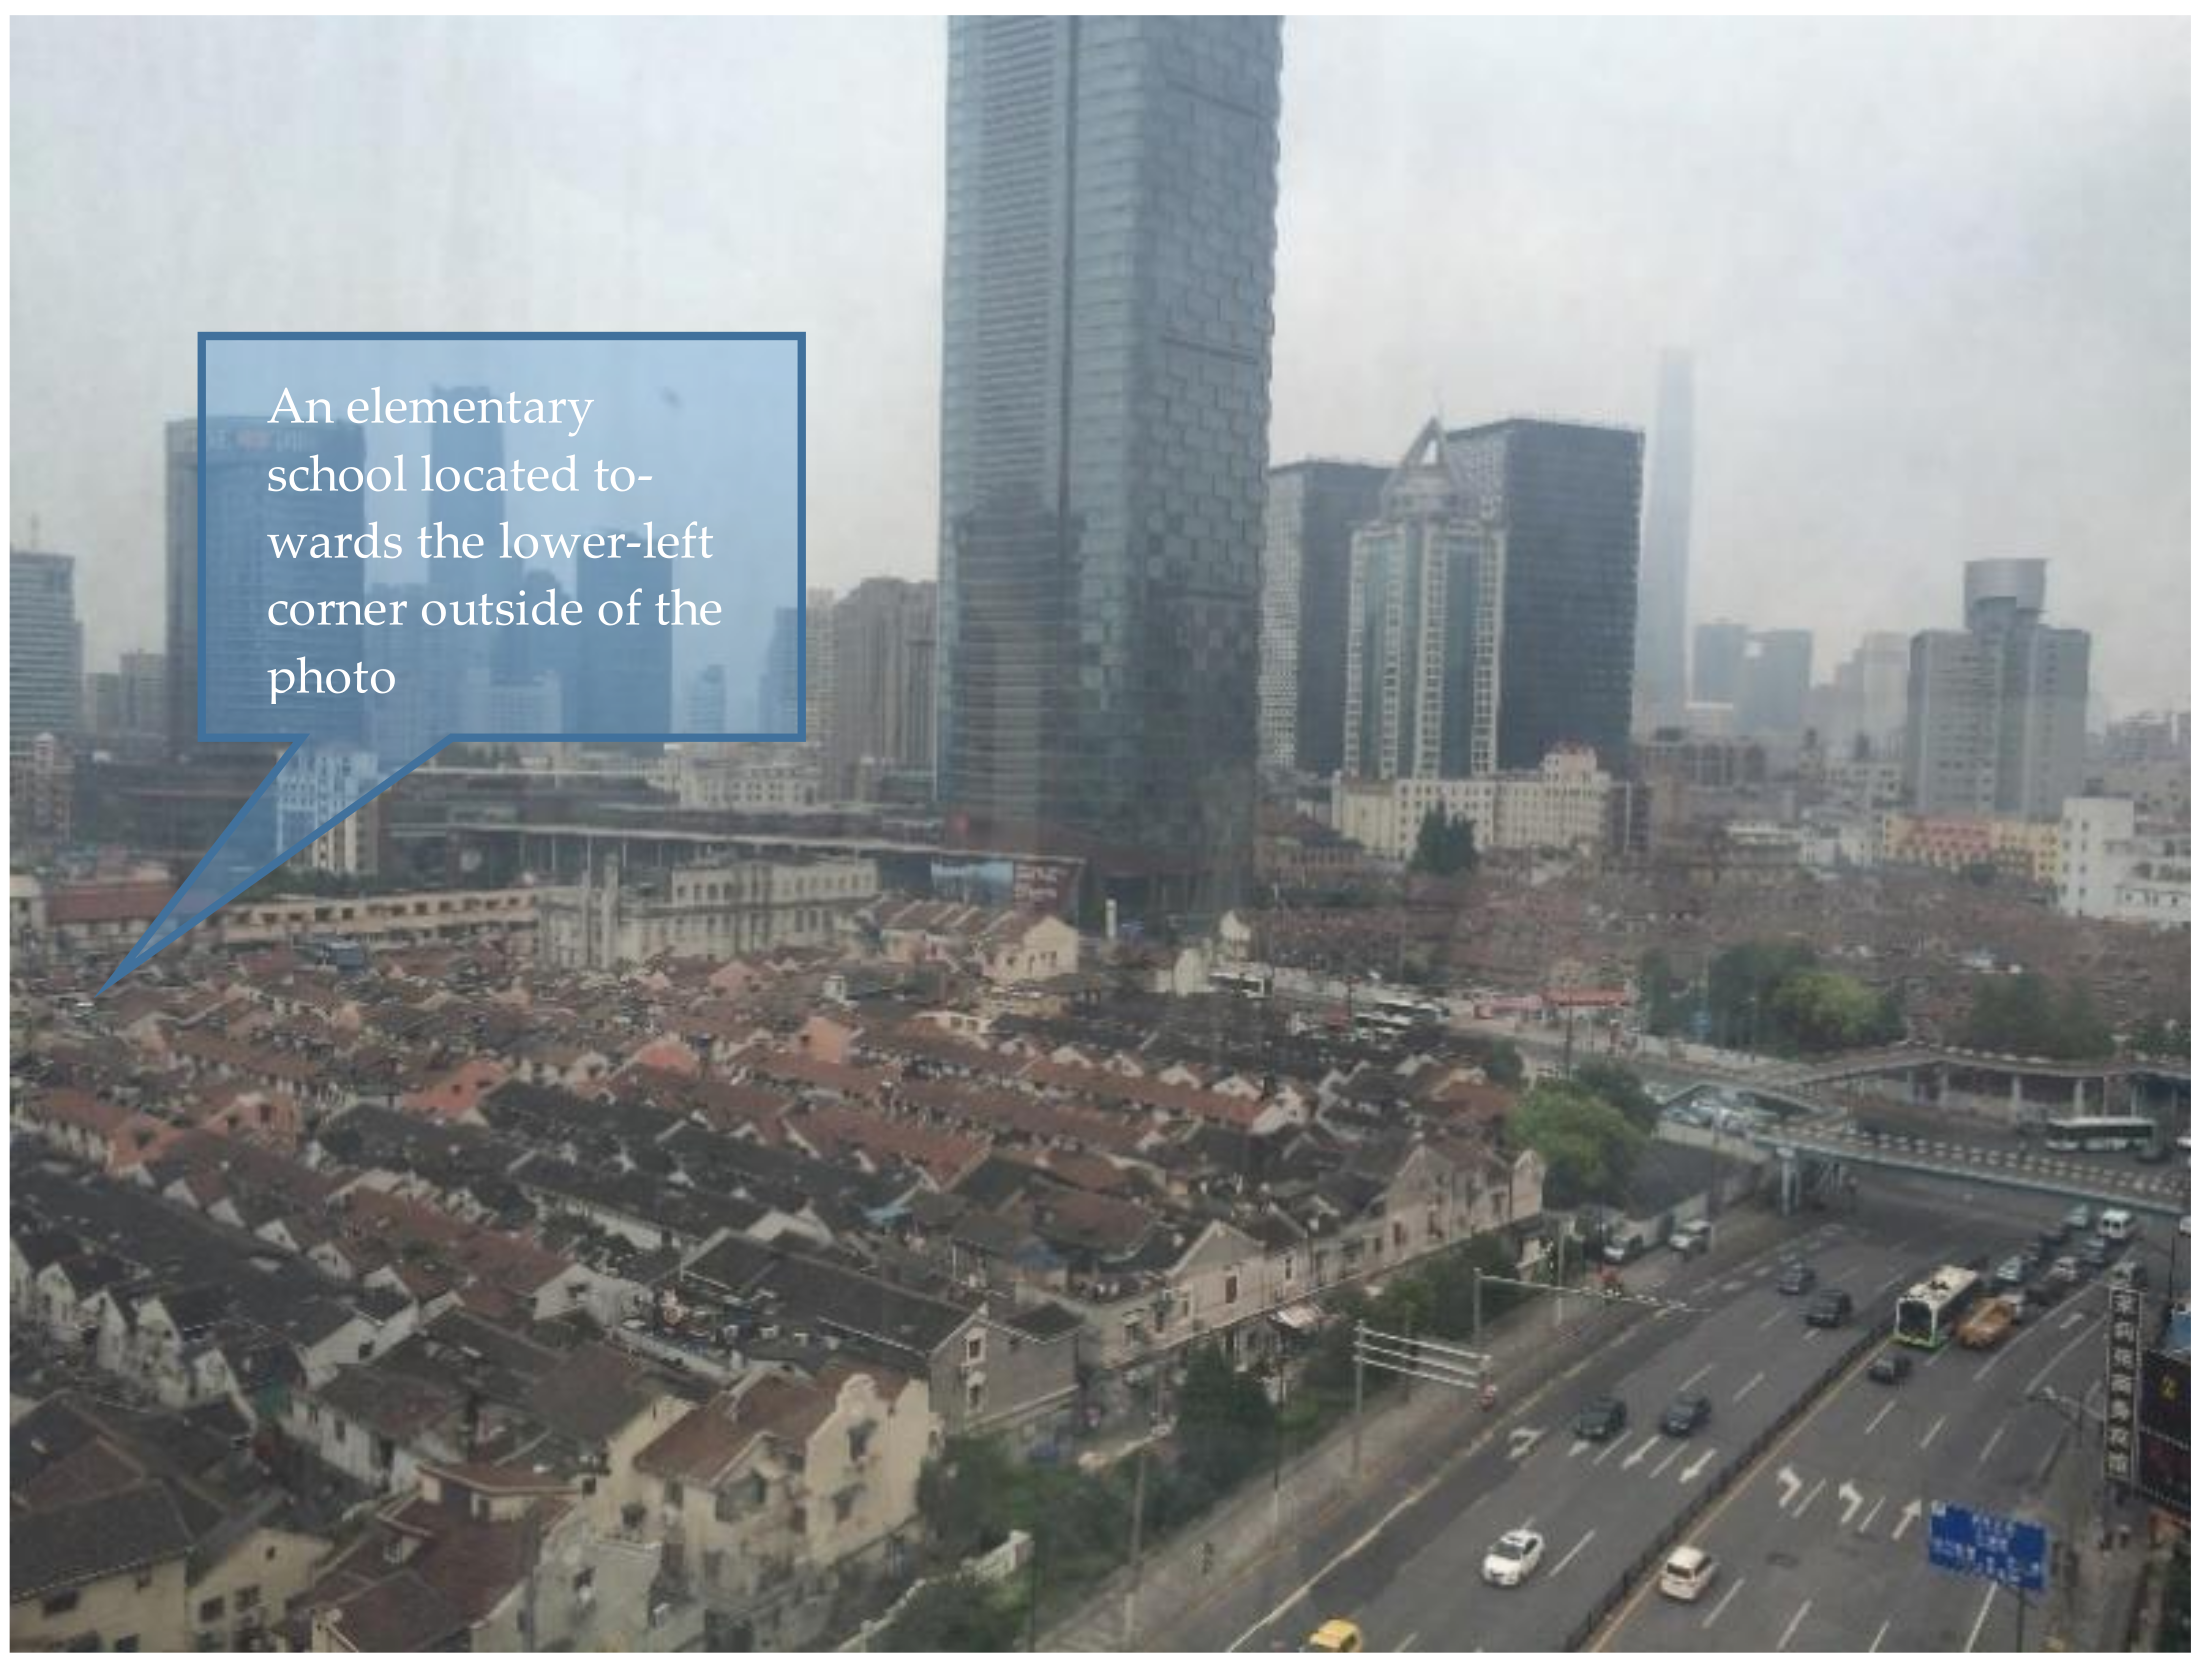
Chinese cities have experienced rapid urban expansion, suburbanization, and urban sprawl since the 1980s [72,73,74,75]. Our findings showed that school-centered neighborhoods in Shanghai’s new urban districts had a lower intensity of residential and commercial development than their city center counterparts. Few land uses that are known to be associated with neighborhood-level activities were eventually included in the models because of their strong correlation with counts of residential buildings. Only in the 200 m model did tallies of educational uses display a significant negative association with a neighborhood being located in the city center, indicating that educational facilities (including, but not limited to elementary schools) tended to cluster more in Shanghai’s new districts. However, correlations between residential building counts and daily routine destinations showed that the latter tended to cluster spatially near higher-density residential areas. City-center neighborhoods not only had higher residential density but were also equipped with more daily routine destinations than their counterparts in the new districts. These findings are consistent with previous studies of the compactness of the pre-1979 areas of Chinese cities [1,4,19]. Figure 2 illustrates a neighborhood near Haining Road and Henan N Road in the city center of Shanghai, located about 2 km northeast of People’s Square.
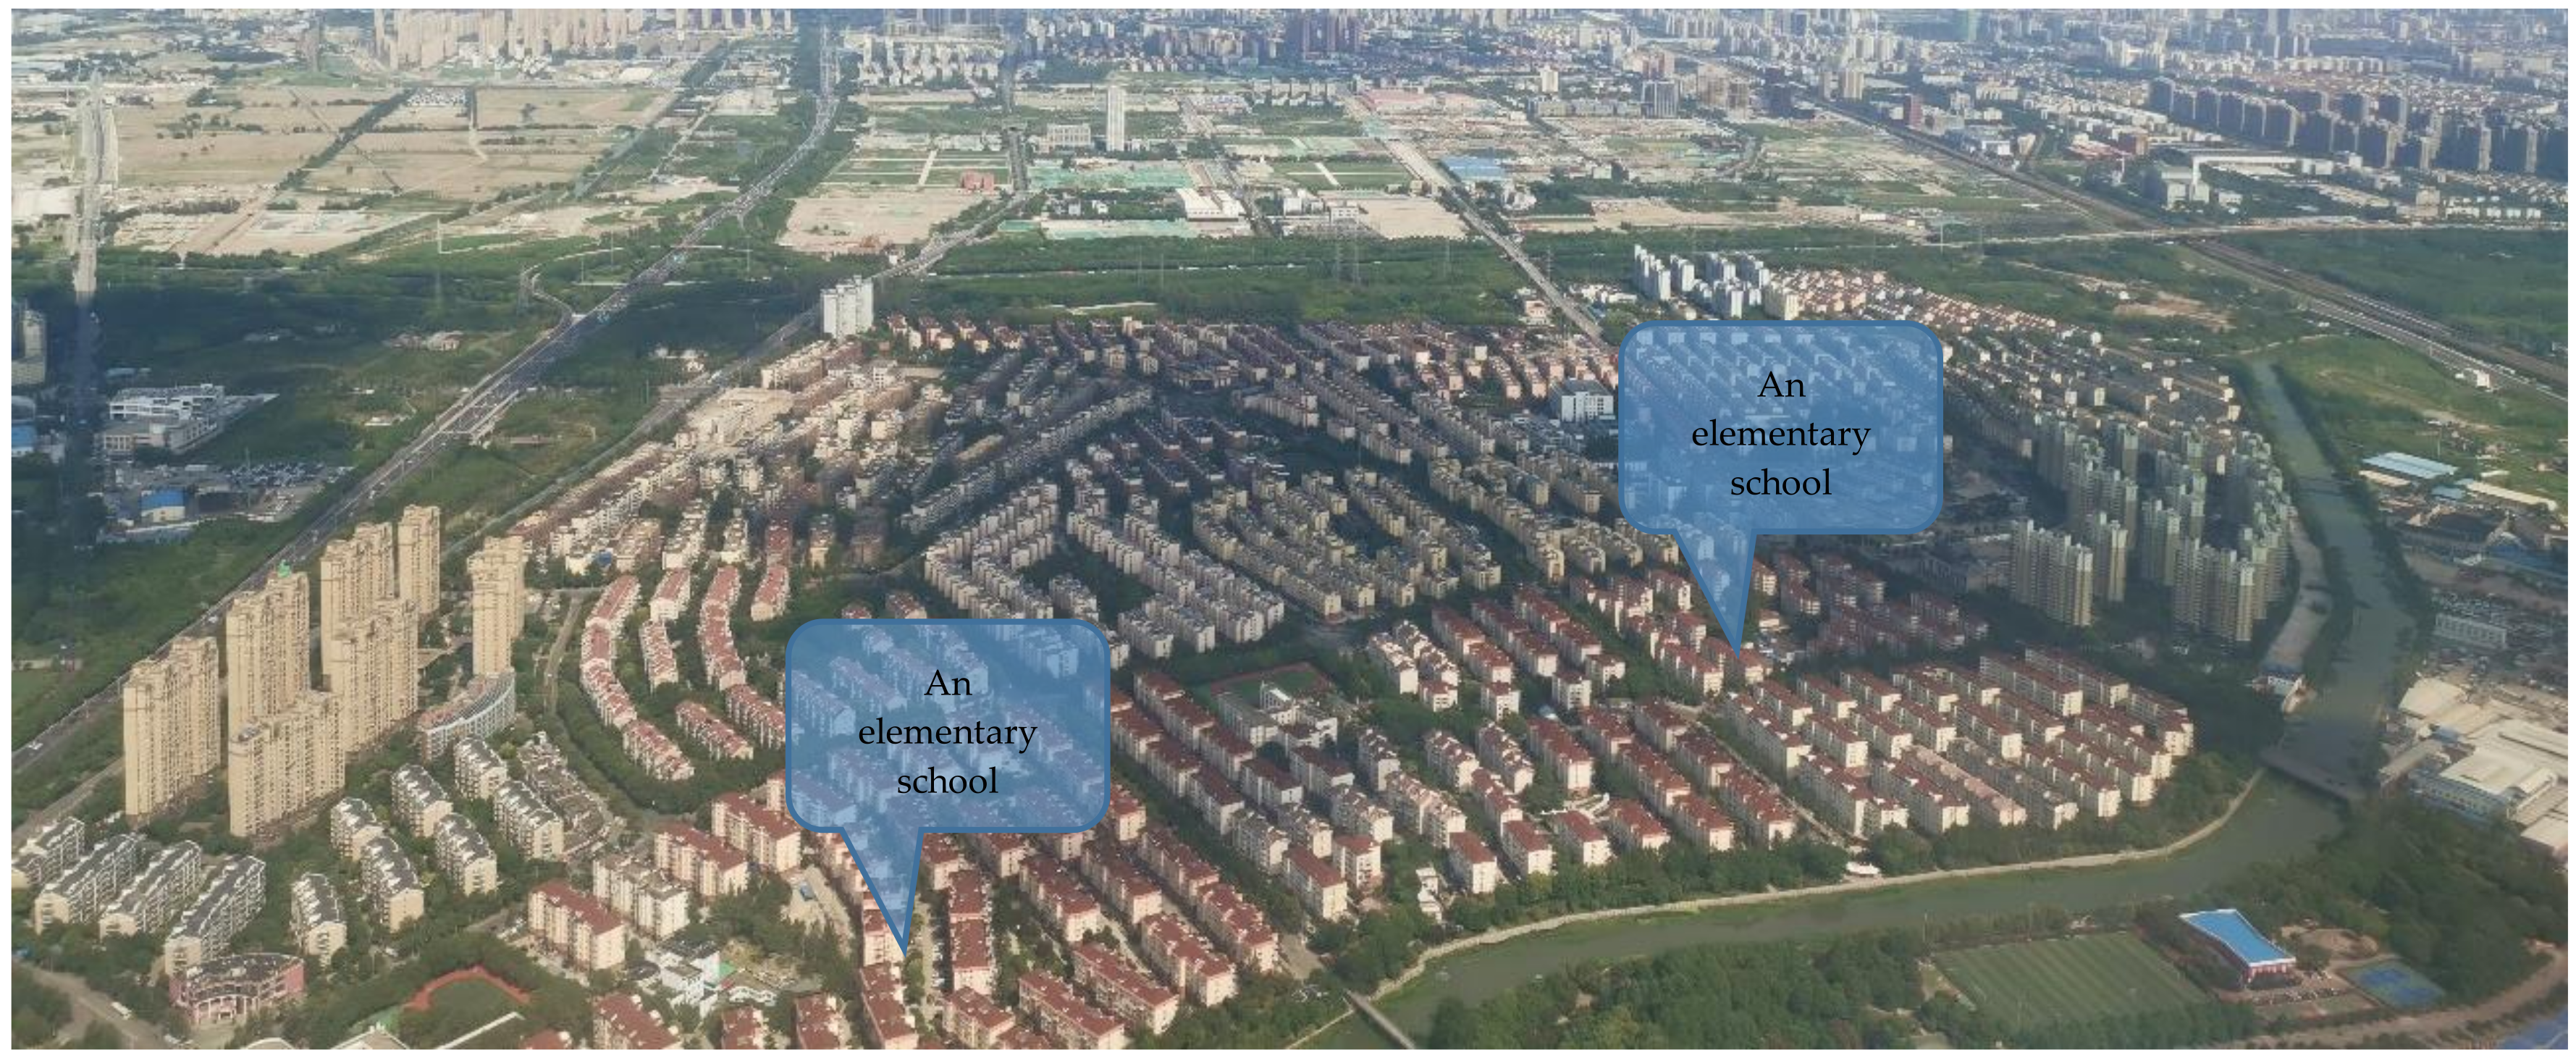
A surprising result was the consistently negative association found between street network length and neighborhoods being located in the city center. Urban built environment studies of cities in China and other countries have shown that downtown and city center neighborhoods have denser street networks, because they were originally designed for slow travel, than newer district neighborhoods, where streets were designed for faster vehicular travel [76,77,78,79]. This counterintuitive result likely reflects the particularities of post-1980 inner-city redevelopment in China [14,19,80,81]. Since that time, in Shanghai, as in other Chinese cities, many inner city neighborhoods have been demolished, and their residents relocated to new districts, to make room for more profitable new residential and commercial uses [15]. Redeveloped city center neighborhoods typically comprise very large blocks of high rise buildings [10,81]. Many of their erstwhile narrow streets and dense street networks have been replaced with monumental multilane vehicular boulevards [82], effectively reducing street network length (see Figure 2). Figure 3 is an aerial view of a subdistrict near in Songjiang district, one of the new districts of Shanghai, about 20 km southwest of People’s Square. Interestingly, this aspect of inner city redevelopment in China suggests that urban form attributes in the city center are converging with those in newly developed districts (see Figure 3).
Having the lowest BIC and AIC values, the 200 m model indicated that the four independent variables, distance to the city center, counts of residential buildings, total street network length, and counts of educational best captured differences in built environment variations of the city center and new district neighborhoods. This might imply that a school-centered neighborhood in Shanghai could be delineated within a 200 m radius of an elementary school. This neighborhood size is small, compared to Perry’s 400 m neighborhood unit [8,54], the 500 m transit-oriented development (TOD) catchment area in China [55,83], and the 800 m walkable neighborhood in the US [56,57]. Future studies should further test the size or sizes of neighborhoods in Chinese cities. Collecting observations of resident’s daily spatial behaviors will shed light on what might be an appropriate neighborhood size for future planning purposes.
Descriptive statistics also showed that elementary schools had a large number of restaurants, especially fast-food restaurants nearby. Specifically, 44% of schools (312 schools) had a restaurant within 100 m, of which 89% (278 schools) have a fast food restaurant within 100 m. When the search extended to 200 m, more than half of the elementary schools (59%, or 419 schools) had at least one fast-food restaurant, and almost one quarter (24.9%, or 177 schools) had six or more fast-food restaurants. In comparison, a Chicago study found that 78% of the schools had at least one fast-food restaurant within 800 m [84]. Given past evidence gathered on the negative effects of school proximity to fast-food restaurants and, more generally, of exposure to poor-quality food environments on adolescent eating patterns and overweight status [85,86], future studies are needed to understand potential associations on children’s eating patterns in Shanghai. Technological advances and the now available online mapping services in China enabled us to carry out a regional study in a small spatial unit of analysis. Our approach, which captured detailed objective neighborhood-level built environment attributes using Baidu Map and its APIs, could be readily applied to studies on urban design and planning, public health and built environment, and urban morphology in other Chinese cities.
The study has limitations. We centered our definition of neighborhoods on elementary schools. As for defining appropriate neighborhood size, collecting data on resident’s daily activities and perception of their neighborhood will help verify whether and how much neighborhoods centered on a school overlap spatially with neighborhoods centered on commercial, institutional or recreational land uses. The count data of residential and office buildings and different commercial land uses and transportation facilities also have limitations. Additional information on building size, heights, total floor area, population density, and socioeconomic levels would provide further insights on urban form variations in Shanghai. Finally, we only had built environment data at one time point. Clearly, having longitudinal data on detailed land uses and destinations at the fine spatial scale would offer objective evidence on the physical changes detected in a region’s urban form over time.
5. Conclusions
Shanghai’s physical transformations, which are documented in this study, exemplify China’s rapid urbanization and expansion since the economic reform in 1978. Specifically, the study provides information on changes in the urban form of Chinese cities over the last four decades.
This study quantitatively compared the urban form of the city center and the new districts of Shanghai. Our findings support a more nuanced understanding of urban form of Chinese cities. On one hand, we found that divergence between the city center and the new districts seemed to persist. Neighborhoods in the city center had higher residential density and were equipped with more daily routine destinations than their counterparts in the new districts in Shanghai. On the other hand, there was a convergence between Shanghai’s city center and the new districts as the street network length was longer in the new district neighborhoods than in the city center. Second, a 200 m radius of a neighborhood centered on an elementary school seemed to best catch the built environment variation the most. Future studies should verify that this neighborhood size does correspond to the resident’s daily activities and their perception of the neighborhood. Finally, employing Baidu online mapping services and their APIs appeared to be an effective way to secure detailed objective data on the urban physical features of Chinese cities. The approach promises to support future studies in the areas of urban design and planning, public health and built environment, and urban morphology.
Supplementary Materials
The following are available online at https://www.mdpi.com/article/10.3390/su13158481/s1, Table S1: Bivariate analysis results.
Author Contributions
Conceptualization, L.L.; methodology, L.L.; formal analysis, L.L.; data curation, X.C.; writing—original draft preparation, L.L., X.C.; writing—review and editing, L.L., X.C., A.V.M.; visualization, L.L.; supervision, L.L.; funding acquisition, L.L. All authors have read and agreed to the published version of the manuscript.
Funding
This research was funded by National Science Foundation of China, grant number 41301153.
Institutional Review Board Statement
Not applicable.
Informed Consent Statement
Not applicable.
Data Availability Statement
Public elementary school data are available from the Shanghai Municipal Education Commission. Land use POI data are available from Baidu Maps. Street network data are not publicly available due to the purchased agreement.
Acknowledgments
The API codes were written by Jian Shi who graduated from East China Normal University in 2015. Addresses of 715 public elementary schools in Shanghai were obtained from the Shanghai Municipal Education Commission by Dan Qin who also graduated from East China Normal University in 2015.
Conflicts of Interest
The authors declare no conflict of interest.
References
- Wu, W.; Gaubatz, P.R. The Chinese City; Routledge, Taylor & Francis Group: London, UK, 2013; p. 298. [Google Scholar]
- Bergère, M.-C. Shanghai: China’s Gateway to Modernity; Stanford University Press: Stanford, CA, USA, 2009; p. 497. [Google Scholar]
- Lai, K. Differentiated Markets: Shanghai, Beijing and Hong Kong in China’s Financial Centre Network. Urban Stud. 2012, 49, 1275–1296. [Google Scholar] [CrossRef]
- Lu, H. Beyond the Neon Lights: Everyday Shanghai in the Early Twentieth Century, Nachdr. ed.; University of California Press: Berkeley, CA, USA, 2008; p. 456. [Google Scholar]
- Pan, H.; Shen, Q.; Xue, S. Intermodal Transfer between Bicycles and Rail Transit in Shanghai, China. Transp. Res. Rec. 2010, 2144, 181–188. [Google Scholar] [CrossRef]
- Sha, Y.; Wu, J.; Ji, Y.; Chan, S.L.T.; Lim, W.Q. Evolution of Urban Planning and City Development of Shanghai: The Past Three Eras and the Present. In Shanghai Urbanism at the Medium Scale; Springer Berlin Heidelberg: Berlin/Heidelberg, Germany, 2014; pp. 9–18. [Google Scholar]
- Lu, D. Travelling Urban Form: The Neighbourhood Unit in China. Plan. Perspect. 2006, 21, 369–392. [Google Scholar] [CrossRef]
- Perry, C.A. The Neighborhood Unit; Regional New York and Its Environs: New York, NY, USA, 1929; Volume VII. [Google Scholar]
- Lu, X.-M.; Gu, X.-T. The Fifth Travel Survey of Residents in Shanghai and Characteristics Analysis. Urban Transp. China 2011, 9, 1–7. [Google Scholar]
- He, S.; Wu, F. Socio-spatial impacts of property-led redevelopment on China’s urban neighbourhoods. Cities 2007, 24, 194–208. [Google Scholar] [CrossRef]
- Wu, F.; Yeh, A.G.-O. Changing Spatial Distribution and Determinants of Land Development in Chinese Cities in the Transition from a Centrally Planned Economy to a Socialist Market Economy: A Case Study of Guangzhou. Urban Stud. 1997, 34, 1851–1879. [Google Scholar] [CrossRef]
- Ye, L. Urban regeneration in China: Policy, development, and issues. Local Econ. 2011, 26, 337–347. [Google Scholar] [CrossRef]
- Wu, F. The Global and Local Dimensions of Place-making: Remaking Shanghai as a World City. Urban Stud. 2000, 37, 1359–1377. [Google Scholar] [CrossRef]
- Leaf, M. Inner city redevelopment in China. Cities 1995, 12, 149–162. [Google Scholar] [CrossRef]
- Yang, Y.-R.; Chang, C.-h. An Urban Regeneration Regime in China: A Case Study of Urban Redevelopment in Shanghai’s Taipingqiao Area. Urban Stud. 2007, 44, 1809–1826. [Google Scholar] [CrossRef]
- Yin, J.; Yin, Z.; Zhong, H.; Xu, S.; Hu, X.; Wang, J.; Wu, J. Monitoring urban expansion and land use/land cover changes of Shanghai metropolitan area during the transitional economy (1979–2009) in China. Environ. Monit. Assess 2011, 177, 609–621. [Google Scholar] [CrossRef] [PubMed]
- Su, S.; Jiang, Z.; Zhang, Q.; Zhang, Y. Transformation of agricultural landscapes under rapid urbanization: A threat to sustainability in Hang-Jia-Hu region, China. Appl. Geogr. 2011, 31, 439–449. [Google Scholar] [CrossRef]
- Tan, M.; Li, X.; Xie, H.; Lu, C. Urban land expansion and arable land loss in China—A case study of Beijing–Tianjin–Hebei region. Land Use Policy 2005, 22, 187–196. [Google Scholar] [CrossRef]
- Gaubatz, P. China’s Urban Transformation: Patterns and Processes of Morphological Change in Beijing, Shanghai and Guangzhou. Urban Stud. 1999, 36, 1495–1521. [Google Scholar] [CrossRef] [PubMed]
- Guan, J.; Xu, C.; Fan, X.; Guan, Z. Travel Mode Choice Suppression in Large-Scale Residential Areas on the City Periphery: Case Study of Jinhexincheng, Shanghai, China. In Proceedings of the Transportation Research Board 96th Annual MeetingTransportation Research Board, Washington, DC, USA, 8–12 January 2017. [Google Scholar]
- Chaskin, R.J. Perspectives on Neighborhood and Community: A Review of the Literature. Soc. Serv. Rev. 1997, 71, 521–547. [Google Scholar] [CrossRef]
- Park, Y.; Rogers, G.O. Neighborhood Planning Theory, Guidelines, and Research: Can Area, Population, and Boundary Guide Conceptual Framing? J. Plan. Lit. 2015, 30, 18–36. [Google Scholar] [CrossRef]
- Jud, G.D.; Watts, J.M. Schools and Housing Values. Land Econ. 1981, 57, 459. [Google Scholar] [CrossRef]
- Tiebout, C.M. A Pure Theory of Local Expenditures. J. Political Econ. 1956, 64, 416–424. [Google Scholar] [CrossRef]
- Vitiello, D. Re-Forming Schools and Cities: Placing Education on the Landscape of Planning History. J. Plan. Hist. 2006, 5, 183–195. [Google Scholar] [CrossRef]
- Chen, C.; Uttal, D.H. Cultural Values, Parents’ Beliefs, and Children’s Achievement in the United States and China. Hum. Dev. 1988, 31, 351–358. [Google Scholar] [CrossRef]
- LeGates, R.T. Visions, scale, tempo, and form in China’s emerging city-regions. Cities 2014, 41, 171–178. [Google Scholar] [CrossRef]
- Zhang, M.; Chen, J. Unequal school enrollment rights, rent yields gap, and increased inequality: The case of Shanghai. China Econ. Rev. 2018, 49, 229–240. [Google Scholar] [CrossRef]
- Feng, H.; Lu, M. School quality and housing prices: Empirical evidence from a natural experiment in Shanghai, China. J. Hous. Econ. 2013, 22, 291–307. [Google Scholar] [CrossRef]
- Zheng, S.; Kahn, M.E. Land and residential property markets in a booming economy: New evidence from Beijing. J. Urban Econ. 2008, 63, 743–757. [Google Scholar] [CrossRef]
- Easton, S.; Ferrari, E. Children’s travel to school—The interaction of individual, neighbourhood and school factors. Transp. Policy 2015, 44, 9–18. [Google Scholar] [CrossRef] [Green Version]
- Azeredo, C.M.; de Rezende, L.F.M.; Canella, D.S.; Claro, R.M.; Peres, M.F.T.; Luiz, O.d.C.; França-Junior, I.; Kinra, S.; Hawkesworth, S.; Levy, R.B. Food environments in schools and in the immediate vicinity are associated with unhealthy food consumption among Brazilian adolescents. Prev. Med. 2016, 88, 73–79. [Google Scholar] [CrossRef] [PubMed]
- Ding, D.; Sallis, J.F.; Kerr, J.; Lee, S.; Rosenberg, D.E. Neighborhood Environment and Physical Activity Among Youth. Am. J. Prev. Med. 2011, 41, 442–455. [Google Scholar] [CrossRef]
- Cheng, J. Exploring urban morphology using multi-temporal urban growth data: A case study of Wuhan, China. Asian Geogr. 2011, 28, 85–103. [Google Scholar] [CrossRef]
- Schneider, A.; Chang, C.; Paulsen, K. The changing spatial form of cities in Western China. Landsc. Urban Plan. 2015, 135, 40–61. [Google Scholar] [CrossRef]
- Seto, K.C.; Fragkias, M. Quantifying Spatiotemporal Patterns of Urban Land-use Change in Four Cities of China with Time Series Landscape Metrics. Landsc. Ecol. 2005, 20, 871–888. [Google Scholar] [CrossRef]
- Wu, W.; Zhao, S.; Zhu, C.; Jiang, J. A comparative study of urban expansion in Beijing, Tianjin and Shijiazhuang over the past three decades. Landsc. Urban Plan. 2015, 134, 93–106. [Google Scholar] [CrossRef]
- Xu, X.; Min, X. Quantifying spatiotemporal patterns of urban expansion in China using remote sensing data. Cities 2013, 35, 104–113. [Google Scholar] [CrossRef]
- Yu, W.; Zhou, W. The Spatiotemporal Pattern of Urban Expansion in China: A Comparison Study of Three Urban Megaregions. Remote Sens. 2017, 9, 45. [Google Scholar] [CrossRef] [Green Version]
- Barke, M. The Importance of Urban Form as an Object of Study. In Teaching Urban Morphology; Oliveira, V., Ed.; Springer International Publishing: Cham, Switzerland, 2018; pp. 11–30. [Google Scholar]
- Liu, Y.; He, S.; Wu, F.; Webster, C. Urban villages under China’s rapid urbanization: Unregulated assets and transitional neighbourhoods. Habitat Int. 2010, 34, 135–144. [Google Scholar] [CrossRef]
- Whitehand, J.W.R.; Gu, K. Research on Chinese urban form: Retrospect and prospect. Prog. Hum. Geogr. 2006, 30, 337–355. [Google Scholar] [CrossRef]
- Whitehand, J.W.R.; Gu, K.; Conzen, M.P.; Whitehand, S.M. The Typological Process and the Morphological Period: A Cross-Cultural Assessment. Environ. Plann. B Plann. Des. 2014, 41, 512–533. [Google Scholar] [CrossRef]
- Zhang, C.; Chai, Y. Un-gated and integrated Work Unit communities in post-socialist urban China: A case study from Beijing. Habitat Int. 2014, 43, 79–89. [Google Scholar] [CrossRef]
- Zhao, W.; Zou, Y. Un-gating the gated community: The spatial restructuring of a resettlement neighborhood in Nanjing. Cities 2017, 62, 78–87. [Google Scholar] [CrossRef]
- Wan, Z. China’s scientific progress hinges on access to data. Nature 2015, 520, 587. [Google Scholar] [CrossRef] [Green Version]
- Peterson, M.P. Online Mapping with APIs. In Online Maps with APIs and WebServices; Peterson, M.P., Ed.; Springer: Berlin/Heidelberg, Germany, 2012; pp. 3–12. [Google Scholar]
- Liu, X.; Song, Y.; Wu, K.; Wang, J.; Li, D.; Long, Y. Understanding urban China with open data. Cities 2015, 47, 53–61. [Google Scholar] [CrossRef]
- Long, Y.; Zhai, W.; Shen, Y.; Ye, X. Understanding uneven urban expansion with natural cities using open data. Landsc. Urban Plan. 2018, 177, 281–293. [Google Scholar] [CrossRef] [Green Version]
- Li, J.; Long, Y.; Dang, A. Live-Work-Play Centers of Chinese cities: Identification and temporal evolution with emerging data. Comput. Environ. Urban Syst. 2018, 71, 58–66. [Google Scholar] [CrossRef]
- Zhang, Y.; Li, X.; Wang, A.; Bao, T.; Tian, S. Density and diversity of OpenStreetMap road networks in China. J. Urban Manag. 2015, 4, 135–146. [Google Scholar] [CrossRef] [Green Version]
- Zhang, X.; Ren, A.; Chen, L.; Zheng, X. Measurement and Spatial Difference Analysis on the Accessibility of Road Networks in Major Cities of China. Sustainability 2019, 11, 4209. [Google Scholar] [CrossRef] [Green Version]
- Shanghai Bureau of Statistics. Shanghai Statistical Yearbook 2015; Shanghai Bureau of Statistics: Shanghai, China, 2014. [Google Scholar]
- Mehaffy, M.W.; Porta, S.; Romice, O. The “neighborhood unit” on trial: A case study in the impacts of urban morphology. J. Urban. Int. Res. Placemaking Urban Sustain. 2015, 8, 199–217. [Google Scholar] [CrossRef]
- Zhang, M. Chinese Edition of Transit-Oriented Development. Transp. Res. Rec. 2007, 2038, 120–127. [Google Scholar] [CrossRef]
- Weinstein Agrawal, A.; Schlossberg, M.; Irvin, K. How Far, by Which Route and Why? A Spatial Analysis of Pedestrian Preference. J. Urban Des. 2008, 13, 81–98. [Google Scholar] [CrossRef]
- Rundle, A.; Neckerman, K.M.; Freeman, L.; Lovasi, G.S.; Purciel, M.; Quinn, J.; Richards, C.; Sircar, N.; Weiss, C. Neighborhood Food Environment and Walkability Predict Obesity in New York City. Environ. Health Perspect. 2009, 117, 442–447. [Google Scholar] [CrossRef] [PubMed]
- Graf, C. The Lawton Instrumental Activities of Daily Living Scale. AJN Am. J. Nurs. 2008, 108, 52–62. [Google Scholar] [CrossRef] [PubMed] [Green Version]
- Katz, S. Assessing Self-maintenance: Activities of Daily Living, Mobility, and Instrumental Activities of Daily Living. J. Am. Geriatr. Soc. 1983, 31, 721–727. [Google Scholar] [CrossRef] [PubMed]
- Lawton, M.P.; Brody, E.M. Assessment of Older People: Self-Maintaining and Instrumental Activities of Daily Living. Gerontologist 1969, 9, 179–186. [Google Scholar] [CrossRef]
- Romero-Ayuso, D.; Castillero-Perea, Á.; González, P.; Navarro, E.; Molina-Massó, J.P.; Funes, M.J.; Ariza-Vega, P.; Toledano-González, A.; Triviño-Juárez, J.M. Assessment of cognitive instrumental activities of daily living: A systematic review. Disabil. Rehabil. 2021, 43, 1342–1358. [Google Scholar] [CrossRef] [PubMed]
- Bedimo-Rung, A.L.; Mowen, A.J.; Cohen, D.A. The significance of parks to physical activity and public health. Am. J. Prev. Med. 2005, 28, 159–168. [Google Scholar] [CrossRef] [PubMed]
- Larson, L.R.; Jennings, V.; Cloutier, S.A. Public Parks and Wellbeing in Urban Areas of the United States. PLoS ONE 2016, 11, e0153211. [Google Scholar] [CrossRef] [PubMed]
- Xiong, Y. From racecourse to People’s Park and People’s Square: Historical transformation and symbolic significance. Urban Hist. 2011, 38, 475–490. [Google Scholar] [CrossRef]
- Cervero, R.; Kockelman, K. Travel demand and the 3Ds: Density, diversity, and design. Transp. Res. Part D Transp. Environ. 1997, 2, 199–219. [Google Scholar] [CrossRef]
- Schwarz, N. Urban form revisited—Selecting indicators for characterising European cities. Landsc. Urban Plan. 2010, 96, 29–47. [Google Scholar] [CrossRef]
- Song, Y.; Knaap, G.-J. Measuring Urban Form: Is Portland Winning the War on Sprawl? J. Am. Plan. Assoc. 2004, 70, 210–225. [Google Scholar] [CrossRef]
- Tratalos, J.; Fuller, R.A.; Warren, P.H.; Davies, R.G.; Gaston, K.J. Urban form, biodiversity potential and ecosystem services. Landsc. Urban Plan. 2007, 83, 308–317. [Google Scholar] [CrossRef]
- Tsai, Y.-H. Quantifying Urban Form: Compactness versus ‘Sprawl’. Urban Stud. 2005, 42, 141–161. [Google Scholar] [CrossRef]
- Dormann, F.C.; McPherson, M.J.; Araújo, B.M.; Bivand, R.; Bolliger, J.; Carl, G.; Davies, G.R.; Hirzel, A.; Jetz, W.; Daniel Kissling, W.; et al. Methods to account for spatial autocorrelation in the analysis of species distributional data: A review. Ecography 2007, 30, 609–628. [Google Scholar] [CrossRef] [Green Version]
- Burnham, K.P.; Anderson, D.R. Multimodel Inference: Understanding AIC and BIC in Model Selection. Sociol. Methods Res. 2004, 33, 261–304. [Google Scholar] [CrossRef]
- Deng, F.F.; Huang, Y. Uneven land reform and urban sprawl in China: The case of Beijing. Prog. Plan. 2004, 61, 211–236. [Google Scholar] [CrossRef]
- Feng, J.; Zhou, Y.; Wu, F. New Trends of Suburbanization in Beijing since 1990: From Government-led to Market-oriented. Reg. Stud. 2008, 42, 83–99. [Google Scholar] [CrossRef] [Green Version]
- Yue, W.; Liu, Y.; Fan, P. Measuring urban sprawl and its drivers in large Chinese cities: The case of Hangzhou. Land Use Policy 2013, 31, 358–370. [Google Scholar] [CrossRef]
- Zhou, Y.; Ma, L.J.C. Economic Restructuring and Suburbanization in China. Urban Geogr. 2000, 21, 205–236. [Google Scholar] [CrossRef]
- Hess, P.M. Measures of Connectivity [Streets: Old Paradigm, New Investment]. Places 1997, 11, 58–65. [Google Scholar]
- Owens, P.M. Neighborhood form and pedestrian life: Taking a closer look. Landsc. Urban Plan. 1993, 26, 115–135. [Google Scholar] [CrossRef]
- Saelens, B.E.; Sallis, J.F.; Black, J.B.; Chen, D. Neighborhood-Based Differences in Physical Activity: An Environment Scale Evaluation. Am. J. Public Health 2003, 93, 1552–1558. [Google Scholar] [CrossRef] [PubMed]
- Southworth, M.; Owens, P.M. The Evolving Metropolis: Studies of Community, Neighborhood, and Street Form at the Urban Edge. J. Am. Plan. Assoc. 1993, 59, 271–287. [Google Scholar] [CrossRef]
- He, S.; Wu, F. Property-Led Redevelopment in Post-Reform China: A Case Study of Xintiandi Redevelopment Project in Shanghai. J. Urban Aff. 2005, 27, 1–23. [Google Scholar] [CrossRef]
- He, S.; Wu, F. Neighborhood changes and residential differentiation in Shanghai. In China’s Emerging Cities; Routledge: London, UK, 2007. [Google Scholar]
- Wu, D.; Li, T. The Present Situation and Prospective Development of the Shanghai Urban Community. In The New Chinese City; Logan, J.R., Ed.; Blackwell Publishers Ltd.: Oxford, UK, 2001; pp. 22–36. [Google Scholar]
- Pan, H.; Zhang, M. Rail Transit Impacts on Land Use: Evidence from Shanghai, China. Transp. Res. Rec. 2008, 2048, 16–25. [Google Scholar] [CrossRef]
- Austin, S.B.; Melly, S.J.; Sanchez, B.N.; Patel, A.; Buka, S.; Gortmaker, S.L. Clustering of Fast-Food Restaurants Around Schools: A Novel Application of Spatial Statistics to the Study of Food Environments. Am. J. Public Health 2005, 95, 1575–1581. [Google Scholar] [CrossRef]
- Davis, B.; Carpenter, C. Proximity of Fast-Food Restaurants to Schools and Adolescent Obesity. Am. J. Public Health 2009, 99, 505–510. [Google Scholar] [CrossRef] [PubMed]
- Fleischhacker, S.E.; Evenson, K.R.; Rodriguez, D.A.; Ammerman, A.S. A systematic review of fast food access studies: Fast food access review. Obes. Rev. 2011, 12, e460–e471. [Google Scholar] [CrossRef] [PubMed]
Figure 1.
Shanghai municipality and spatial distribution of elementary schools in Shanghai.

Figure 2.
A neighborhood near Haining Road and Henan N Road in the city center of Shanghai, about 2 km northeast of People’s Square (Photo by the leading author when taking urban rail line 10).
Figure 2.
A neighborhood near Haining Road and Henan N Road in the city center of Shanghai, about 2 km northeast of People’s Square (Photo by the leading author when taking urban rail line 10).

Figure 3.
A sub-district in Songjiang district, one of the new districts of Shanghai, about 20 km southwest of People’s Square (photo by the leading author when taking a flight arriving Shanghai).
Figure 3.
A sub-district in Songjiang district, one of the new districts of Shanghai, about 20 km southwest of People’s Square (photo by the leading author when taking a flight arriving Shanghai).


Table 1.
Built environment measurements captured in 2015.
| Categories | Items | Measures |
|---|---|---|
| Distance (Euclidian) | Distance to the city center | Distance to People’s Square |
| Buildings | Residential buildings | Counts in a 100 m buffer, 200 m buffer, 400 m buffer, and 800 m buffer |
| Office buildings | ||
| Transportation facility | Street network length | The total length of streets in a 100 m buffer, 200 m buffer, 400 m buffer, and 800 m buffer |
| Street intersection | Counts in a 100 m buffer, 200 m buffer, 400 m buffer, and 800 m buffer | |
| Bus stop | ||
| Subway station | ||
| Gas station | ||
| Train station | ||
| Parking lot | ||
| Land use | Regular restaurant | Counts in a 100 m buffer, 200 m buffer, 400 m buffer, and 800 m buffer |
| Fast food restaurant | ||
| Hotel | ||
| Retail store | ||
| Supermarket | ||
| Farmer’s market | ||
| Bank | ||
| Hospital | ||
| Drug store | ||
| Educational use | ||
| Park |
Table 2.
Descriptive statistics of the built environment attribute by the city center and new districts—buildings and transportation facility.
Table 2.
Descriptive statistics of the built environment attribute by the city center and new districts—buildings and transportation facility.
| City Center | New Districts | Total | p-Value | |||
|---|---|---|---|---|---|---|
| Distance to People’s Square | Distance in meters | 6217.11 ± 3211.97 | 26,658.49 ± 24,933.77 | 710 | 0.000 | |
| Distance natural log transformed | 8.57 ± 0.64 | 9.95 ± 0.67 | 710 | 0.000 | ||
| Residential building | 100 m buffer | 0 residential building | 15.5% | 84.5% | 310 | 0.000 |
| 1 to 10 residential buildings | 54.3% | 45.7% | 291 | |||
| 11 and more residential buildings | 76.1% | 23.9% | 109 | |||
| 200 m buffer | 0 residential building | 2.3% | 97.7% | 173 | 0.000 | |
| 1 to 10 residential buildings | 28.0% | 72.0% | 175 | |||
| 11 to 40 residential buildings | 57.7% | 42.3% | 182 | |||
| 41 and more residential buildings | 72.8% | 27.2% | 180 | |||
| 400 m buffer | 0 residential building | 15.7% | 84.3% | 102 | 0.000 | |
| 1 to 10 residential buildings | 3.7% | 96.3% | 164 | |||
| 11 to 99 residential buildings | 51.8% | 48.2% | 168 | |||
| 100 and more residential buildings | 65.2% | 34.8% | 276 | |||
| 800 m buffer | 1 to 10 residential buildings | 8.3% | 91.7% | 169 | 0.000 | |
| 11 to 99 residential buildings | 16.4% | 83.6% | 128 | |||
| 100 and more residential buildings | 61.5% | 38.5% | 413 | |||
| Office building | 100 m buffer | 0 office building | 37.5% | 62.5% | 666 | 0.000 |
| 1 and more office buildings | 88.6% | 11.4% | 44 | |||
| 200 m buffer | 0 office building | 34.2% | 65.8% | 600 | 0.000 | |
| 1 and more office buildings | 76.4% | 23.6% | 110 | |||
| 400 m buffer | 0 office building | 21.5% | 78.5% | 423 | 0.000 | |
| 1 and more office buildings | 69.0% | 31.0% | 287 | |||
| 800 m buffer | 0 office building | 11.2% | 88.8% | 241 | 0.000 | |
| 1 to 10 office buildings | 36.0% | 64.0% | 297 | |||
| 11 and more office buildings | 90.1% | 9.9% | 172 | |||
| Bus stop | 100 m buffer | 0 bus stop | 40.9% | 59.1% | 609 | 0.808 |
| 1 to 3 bus stops | 39.6% | 60.4% | 101 | |||
| 200 m buffer | 0 bus stop | 44.1% | 55.9% | 426 | 0.023 | |
| 1 to 5 bus stops | 35.6% | 64.4% | 284 | |||
| 400 m buffer | 2.41 ± 1.58 | 2.09 ± 1.65 | 710 | 0.010 | ||
| 800 m buffer | 9.56 ± 4.36 | 7.61 ± 4.77 | 710 | 0.000 | ||
| Subway station | 100 m buffer | 0 subway station | 40.7% | 59.3% | 710 | |
| 200 m buffer | 0 subway station | 40.7% | 59.3% | 703 | 0.907 | |
| 1 subway station | 42.9% | 57.1% | 7 | |||
| 400 m buffer | 0 subway station | 38.7% | 61.3% | 664 | 0.000 | |
| 1 and more subway stations | 69.6% | 30.4% | 46 | |||
| 800 m buffer | 0 subway station | 28.4% | 71.6% | 510 | 0.000 | |
| 1 and more gas stations | 72.0% | 28.0% | 200 | |||
| Gas station | 100 m buffer | 0 gas station | 40.5% | 59.5% | 708 | 0.087 |
| 1 gas station | 100.0% | 0.0% | 2 | |||
| 200 m buffer | 0 gas station | 40.4% | 59.6% | 698 | 0.210 | |
| 1 and more gas stations | 58.3% | 41.7% | 12 | |||
| 400 m buffer | 0 gas station | 38.5% | 61.5% | 650 | 0.000 | |
| 1 and more gas stations | 65.0% | 35.0% | 60 | |||
| 800 m buffer | 0 gas station | 32.4% | 67.6% | 479 | 0.000 | |
| 1 and more gas stations | 58.0% | 42.0% | 231 | |||
| Parking lot | 100 m buffer | 0 parking lot | 38.8% | 61.2% | 649 | 0.001 |
| 1 and more parking lots | 60.7% | 39.3% | 61 | |||
| 200 m buffer | 0 parking lot | 37.2% | 62.8% | 570 | 0.000 | |
| 1 and more parking lots | 55.0% | 45.0% | 140 | |||
| 400 m buffer | 0 parking lot | 23.5% | 76.5% | 327 | 0.000 | |
| 1 and more parking lots | 55.4% | 44.6% | 383 | |||
| 800 m buffer | 13.92 ± 10.57 | 3.86 ± 4.96 | 710 | 0.000 | ||
| Street network length | 100 m buffer | 0 m | 52.9% | 47.1% | 102 | 0.075 |
| 1 to 200 m | 42.5% | 57.5% | 134 | |||
| 200.01 to 400 m | 34.8% | 65.2% | 201 | |||
| 400.01 to 600 m | 40.1% | 59.9% | 142 | |||
| 600.01 to 800 m | 41.3% | 58.7% | 75 | |||
| 800.01 and more | 35.7% | 64.3% | 56 | |||
| 200 m buffer | Measured in km | 1.39 ± 0.79 | 1.52 ± 0.82 | 710 | 0.034 | |
| 400 m buffer | Measured in km | 5.07 ± 2.57 | 6.08 ± 2.52 | 710 | 0.000 | |
| 800 m buffer | Measured in km | 19.78 ± 8.94 | 24.15 ± 8.44 | 710 | 0.000 | |
| Street intersection | 100 m buffer | 0 intersections | 47.5% | 52.5% | 240 | 0.026 |
| 1 to 2 intersections | 35.9% | 64.1% | 237 | |||
| 3 and more intersections | 38.6% | 61.4% | 233 | |||
| 200 m buffer | 8.92 ± 7.49 | 9.75 ± 7.94 | 710 | 0.185 | ||
| 400 m buffer | 31.31 ± 22.85 | 38.29 ± 24.73 | 710 | 0.000 | ||
| 800 m buffer | 118.75 ± 78.21 | 150.36 ± 76.99 | 710 | 0.000 | ||
Note: p-value less than 0.05 is bolded.
Table 3.
Descriptive statistics of the built environment attribute by the city center and new districts—land use.
Table 3.
Descriptive statistics of the built environment attribute by the city center and new districts—land use.
| City Center | New Districts | Total | p-Value | |||
|---|---|---|---|---|---|---|
| Regular restaurant | 100 m buffer | 0 restaurant | 30.7% | 69.3% | 398 | 0.000 |
| 1 and more than 1 restaurant | 53.5% | 46.5% | 312 | |||
| 200 m buffer | 0 restaurant | 39.4% | 60.6% | 241 | 0.000 | |
| 1 to 5 restaurants | 29.7% | 70.3% | 246 | |||
| 6 and more restaurants | 54.3% | 45.7% | 223 | |||
| 400 m buffer | fewer than 10 restaurants | 17.6% | 82.4% | 239 | 0.000 | |
| 10 to 19 restaurants | 33.8% | 66.2% | 148 | |||
| 20 to 29 restaurants | 48.4% | 51.6% | 124 | |||
| 30 to 39 restaurants | 51.4% | 48.6% | 70 | |||
| 40 to 49 restaurants | 70.0% | 30.0% | 40 | |||
| 50 and more restaurants | 82.0% | 18.0% | 89 | |||
| 800 m buffer | Fewer than 35 restaurants | 12.4% | 87.6% | 233 | 0.000 | |
| 36 to 99 restaurants | 36.2% | 63.8% | 243 | |||
| 100 and more restaurants | 73.5% | 26.5% | 234 | |||
| Fast food restaurant | 100 m buffer | 0 fast-food restaurant | 28.7% | 71.3% | 432 | 0.000 |
| 1 and more fast food restaurant | 59.4% | 40.6% | 278 | |||
| 200 m buffer | 0 fast-food restaurant | 35.1% | 64.9% | 291 | 0.000 | |
| 1 to 5 fast-food restaurants | 30.2% | 69.8% | 242 | |||
| 6 and more fast-food restaurants | 64.4% | 35.6% | 177 | |||
| 400 m buffer | 0 fast-food restaurant | 13.3% | 86.7% | 90 | 0.000 | |
| 1 to 5 fast-food restaurants | 15.0% | 85.0% | 140 | |||
| 6 to 10 fast-food restaurants | 30.9% | 69.1% | 110 | |||
| 11 to 15 fast-food restaurants | 46.2% | 53.8% | 78 | |||
| 16 to 20 fast-food restaurants | 45.3% | 54.7% | 64 | |||
| 21 to 25 fast-food restaurants | 58.5% | 41.5% | 53 | |||
| 26 to 30 fast-food restaurants | 52.5% | 47.5% | 40 | |||
| 31 to 45 fast-food restaurants | 71.8% | 28.2% | 71 | |||
| 46 and more fast-food restaurants | 84.4% | 15.6% | 64 | |||
| 800 m buffer | few than 10 fast-food restaurants | 9.7% | 90.3% | 144 | 0.000 | |
| 11 to 30 fast-food restaurants | 14.8% | 85.2% | 122 | |||
| 31 to 60 fast-food restaurants | 33.5% | 66.5% | 167 | |||
| 61 to 99 fast-food restaurants | 57.0% | 43.0% | 121 | |||
| 100 and more fast-food restaurants | 84.6% | 15.4% | 156 | |||
| Hotel | 100 m buffer | 0 hotel | 36.6% | 63.4% | 593 | 0.000 |
| 1 and more hotels | 61.5% | 38.5% | 117 | |||
| 200 m buffer | 0 hotel | 38.4% | 61.6% | 451 | 0.093 | |
| 1 and more hotels | 44.8% | 55.2% | 259 | |||
| 400 m buffer | 0 hotel | 23.5% | 76.5% | 170 | 0.000 | |
| 1 to 2 hotels | 31.8% | 68.2% | 214 | |||
| 3 to 5 hotels | 47.6% | 52.4% | 170 | |||
| 6 and more hotels | 64.1% | 35.9% | 156 | |||
| 800 m buffer | 19.96 ± 15.47 | 8.78 ± 8.01 | 710 | 0.000 | ||
| Retail store | 100 m buffer | 0 retail store | 40.3% | 59.7% | 699 | 0.119 |
| 1 and more retail stores | 63.6% | 36.4% | 11 | |||
| 200 m buffer | 0 retail store | 40.5% | 59.5% | 677 | 0.569 | |
| 1 and more retail stores | 45.5% | 54.5% | 33 | |||
| 400 m buffer | 0 retail store | 38.1% | 61.9% | 561 | 0.007 | |
| 1 and more retail stores | 50.3% | 49.7% | 149 | |||
| 800 m buffer | 0 retail store | 30.2% | 69.8% | 311 | 0.000 | |
| 1 and more retail stores | 48.9% | 51.1% | 399 | |||
| Supermarket | 100 m buffer | 0 supermarket | 39.8% | 60.2% | 600 | 0.270 |
| 1 and more supermarkets | 45.5% | 54.5% | 110 | |||
| 200 m buffer | 0 supermarket | 42.4% | 57.6% | 425 | 0.275 | |
| 1 and more supermarkets | 38.2% | 61.8% | 285 | |||
| 400 m buffer | 3.26 ± 2.33 | 2.47 ± 2.16 | 710 | 0.000 | ||
| 800 m buffer | 11.79 ± 5.03 | 7.89 ± 4.63 | 710 | 0.000 | ||
| Farmer’s market | 100 m buffer | 0 farmer’s market | 40.3% | 59.7% | 648 | 0.455 |
| 1 and more farmer’s market | 45.2% | 54.8% | 62 | |||
| 200 m buffer | 0 farmer’s market | 39.4% | 60.6% | 530 | 0.237 | |
| 1 and more farmer’s market | 44.4% | 55.6% | 180 | |||
| 400 m buffer | 0 farmer’s market | 27.3% | 72.7% | 227 | 0.000 | |
| 1 to 2 farmer’s markets | 40.8% | 59.2% | 294 | |||
| 3 and more farmer’s markets | 56.6% | 43.4% | 189 | |||
| 800 m buffer | 8.07 ± 5.44 | 4.24 ± 3.45 | 710 | 0.000 | ||
| Bank | 100 m buffer | 0 bank | 38.1% | 61.9% | 625 | 0.000 |
| 1 and more banks | 60.0% | 40.0% | 85 | |||
| 200 m buffer | 0 bank | 38.0% | 62.0% | 527 | 0.011 | |
| 1 and more banks | 48.6% | 51.4% | 183 | |||
| 400 m buffer | 0 bank | 24.0% | 76.0% | 233 | 0.000 | |
| 1 to 4 banks | 38.5% | 61.5% | 247 | |||
| 5 and more banks | 60.0% | 40.0% | 230 | |||
| 800 m buffer | 23.97 ± 17.97 | 9.14 ± 8.87 | 710 | 0.000 | ||
| Hospital | 100 m buffer | 0 hospital | 39.5% | 60.5% | 686 | 0.001 |
| 1 and more hospitals | 75.0% | 25.0% | 24 | |||
| 200 m buffer | 0 hospital | 38.0% | 62.0% | 634 | 0.000 | |
| 1 and more hospitals | 63.2% | 36.8% | 76 | |||
| 400 m buffer | 0 hospital | 27.7% | 72.3% | 458 | 0.000 | |
| 1 and more hospitals | 64.3% | 35.7% | 252 | |||
| 800 m buffer | 0 hospital | 12.1% | 87.9% | 207 | 0.000 | |
| 1 to 3 hospitals | 29.4% | 70.6% | 255 | |||
| 4 and more hospitals | 76.2% | 23.8% | 248 | |||
| Drug store | 100 m buffer | 0 drug store | 39.5% | 60.5% | 648 | 0.036 |
| 1 and more drug stores | 53.2% | 46.8% | 62 | |||
| 200 m buffer | 0 drug store | 38.8% | 61.2% | 505 | 0.107 | |
| 1 and more drug stores | 45.4% | 54.6% | 205 | |||
| 400 m buffer | 0 drug store | 28.4% | 71.6% | 190 | 0.000 | |
| 1 drug store | 39.9% | 60.1% | 223 | |||
| 2 and more drug stores | 49.2% | 50.8% | 297 | |||
| 800 m buffer | 6.84 ± 3.25 | 4.09 ± 3.02 | 710 | 0.000 | ||
| Educational use | 100 m buffer | 0 school | 27.8% | 72.2% | 198 | 0.000 |
| 1 school | 47.0% | 53.0% | 328 | |||
| 2 and more schools | 43.5% | 56.5% | 184 | |||
| 200 m buffer | 0 school | 52.3% | 47.7% | 149 | 0.000 | |
| 1 school | 28.4% | 71.6% | 264 | |||
| 2 schools | 37.6% | 62.4% | 178 | |||
| 3 and more schools | 58.0% | 42.0% | 119 | |||
| 400 m buffer | 5.57 ± 3.92 | 2.82 ± 2.93 | 710 | 0.000 | ||
| 800 m buffer | 18.64 ± 12.81 | 6.75 ± 6.84 | 710 | 0.000 | ||
| Park | 100 m buffer | 0 park | 40.4% | 59.6% | 705 | 0.073 |
| 1 and more parks | 80.0% | 20.0% | 5 | |||
| 200 m buffer | 0 park | 40.5% | 59.5% | 696 | 0.475 | |
| 1 and more parks | 50.0% | 50.0% | 14 | |||
| 400 m buffer | 0 park | 38.5% | 61.5% | 633 | 0.001 | |
| 1 and more parks | 58.4% | 41.6% | 77 | |||
| 800 m buffer | 0 park | 30.7% | 69.3% | 453 | 0.000 | |
| 1 and more parks | 58.4% | 41.6% | 257 |
Note: p-value less than 0.05 is bolded.
Table 4.
Binary logistic regression models.
| Model—100 m | Model—200 m | Model—400 m | Model—800 m | |||||||||
|---|---|---|---|---|---|---|---|---|---|---|---|---|
| Measures | ß | Sig. | Measures | ß | Sig. | Measures | ß | Sig. | Measures | ß | Sig. | |
| Constant | 33.793 | 0.000 | 32.997 | 0.000 | 35.054 | 0.000 | 36.449 | 0.000 | ||||
| Distance to the city center | Distance to the city center (natural log transformed) | −3.686 | 0.000 | Distance to the city center (natural log transformed) | -3.599 | 0.000 | Distance to the city center (natural log transformed) | −3.710 | 0.000 | Distance to the city center (natural log transformed) | −3.888 | 0.000 |
| Residential buildings | 0 residential buildings # | 0.000 | 0 residential buildings # | 0.000 | 0 residential buildings # | 0.000 | 1 to 10 residential buildings # | 0.000 | ||||
| 1 to 10 residential buildings | 0.565 | 0.063 | 1 to 10 residential buildings | 0.926 | 0.154 | 1 to 10 residential buildings | −1.228 | 0.069 | 11 to 99 residential buildings | 0.435 | 0.470 | |
| 11 and more residential buildings | 1.49 | 0.000 | 11 and 40 residential buildings | 1.519 | 0.014 | 11 and 99 residential buildings | −0.243 | 0.663 | 100 and more residential buildings | 1.260 | 0.008 | |
| 41 and more residential buildings | 1.893 | 0.002 | 100 and more residential buildings | 0.375 | 0.466 | |||||||
| Street network length | 0 m # | 0.000 | Street network length (continuous variable, measured in km) | −0.349 | 0.033 | Street network length (continuous variable, measured in km) | −0.206 | 0.000 | Street network length (continuous variable, measured in km) | −0.086 | 0.000 | |
| 1 to 200 m | −0.712 | 0.105 | ||||||||||
| 200.01 to 400 m | −0.933 | 0.020 | ||||||||||
| 400.01 to 600 m | −0.885 | 0.035 | ||||||||||
| 600.01 to 800 m | −0.434 | 0.394 | ||||||||||
| greater than 800 m | −0.926 | 0.076 | ||||||||||
| Bus stop | 0 bus stop # | 0.000 | Bus stop (continuous variable) | −0.002 | 0.981 | |||||||
| 1 to 3 bus stops | −0.112 | 0.754 | ||||||||||
| Educational use | 0 school # | 0.000 | ||||||||||
| 1 school | −1.706 | 0.000 | ||||||||||
| 2 schools | −1.159 | 0.004 | ||||||||||
| 3 and more schools | −0.813 | 0.069 | ||||||||||
| Total of observations | 710 | 710 | 710 | 710 | ||||||||
| −2 log likelihood | 404.617 | 364.402 | 387.914 | 375.674 | ||||||||
# Reference category. p-value less than 0.05 is bolded.
Table 5.
BIC and AIC tests of the models.
| −2 log Likelihood | # Parameters | # of Observations | BIC | AIC | |
|---|---|---|---|---|---|
| model—100 m | 404.617 | 4 | 710 | 430.878 | 412.617 |
| model—200 m | 364.402 | 4 | 710 | 390.663 | 372.402 |
| model—400 m | 387.914 | 4 | 710 | 414.175 | 395.914 |
| model—800 m | 375.674 | 3 | 710 | 395.370 | 381.674 |
Note: the row of model—200 m is bolded.
Publisher’s Note: MDPI stays neutral with regard to jurisdictional claims in published maps and institutional affiliations. |
© 2021 by the authors. Licensee MDPI, Basel, Switzerland. This article is an open access article distributed under the terms and conditions of the Creative Commons Attribution (CC BY) license (https://creativecommons.org/licenses/by/4.0/).
Share and Cite
MDPI and ACS Style
Lin, L.; Chen, X.; Moudon, A.V. Measuring the Urban Forms of Shanghai’s City Center and Its New Districts: A Neighborhood-Level Comparative Analysis. Sustainability 2021, 13, 8481. https://doi.org/10.3390/su13158481
AMA Style
Lin L, Chen X, Moudon AV. Measuring the Urban Forms of Shanghai’s City Center and Its New Districts: A Neighborhood-Level Comparative Analysis. Sustainability. 2021; 13(15):8481. https://doi.org/10.3390/su13158481
Chicago/Turabian StyleLin, Lin, Xueming (Jimmy) Chen, and Anne Vernez Moudon. 2021. "Measuring the Urban Forms of Shanghai’s City Center and Its New Districts: A Neighborhood-Level Comparative Analysis" Sustainability 13, no. 15: 8481. https://doi.org/10.3390/su13158481
Note that from the first issue of 2016, this journal uses article numbers instead of page numbers. See further details here.