Article

Extending Multilevel Statistical Entropy Analysis towards Plastic Recyclability Prediction

by
Philippe Nimmegeers
1,2,
Alexej Parchomenko
3,4,
Paul De Meulenaere
5,6,
Dagmar R. D’hooge
7,8,
Paul H. M. Van Steenberge
7,
Helmut Rechberger
3 and
Pieter Billen
1,*
1
Intelligence in Processes, Advanced Catalysts and Solvents (iPRACS), Faculty of Applied Engineering, University of Antwerp, Groenenborgerlaan 171, 2020 Antwerp, Belgium
2
Environmental Economics (EnvEcon), Department of Engineering Management, Faculty of Business and Economics, University of Antwerp, Prinsstraat 13, 2000 Antwerp, Belgium
3
Institute for Water Quality and Resource Management, TU Wien, Karlsplatz 13/226, 1040 Vienna, Austria
4
VITO, 200 Boeretang, 2400 Mol, Belgium
5
CoSys-Lab, Faculty of Applied Engineering, University of Antwerp, Groenenborgerlaan 171, 2020 Antwerp, Belgium
6
Flanders Make—Ansymo/Cosys Core Lab, 2020 Antwerp, Belgium
7
Laboratory for Chemical Technology, Ghent University, Technologiepark 125, 9052 Ghent, Belgium
8
Centre for Textiles Science and Engineering, Ghent University, Technologiepark 70a, 9052 Ghent, Belgium
*
Author to whom correspondence should be addressed.
Sustainability 2021, 13(6), 3553; https://doi.org/10.3390/su13063553
Submission received: 15 February 2021 / Revised: 10 March 2021 / Accepted: 17 March 2021 / Published: 23 March 2021
(This article belongs to the Special Issue Recycling and Sustainability of Plastics)

Abstract

:
Multilevel statistical entropy analysis (SEA) is a method that has been recently proposed to evaluate circular economy strategies on the material, component and product levels to identify critical stages of resource and functionality losses. However, the comparison of technological alternatives may be difficult, and equal entropies do not necessarily correspond with equal recyclability. A coupling with energy consumption aspects is strongly recommended but largely lacking. The aim of this paper is to improve the multilevel SEA method to reliably assess the recyclability of plastics. Therefore, the multilevel SEA method is first applied to a conceptual case study of a fictitious bag filled with plastics, and the possibilities and limitations of the method are highlighted. Subsequently, it is proposed to extend the method with the computation of the relative decomposition energies of components and products. Finally, two recyclability metrics are proposed. A plastic waste collection bag filled with plastic bottles is used as a case study to illustrate the potential of the developed extended multilevel SEA method. The proposed extension allows us to estimate the recyclability of plastics. In future work, this method will be refined and other potential extensions will be studied together with applications to real-life plastic products and plastic waste streams.

1. Introduction

The same properties that make plastics into incredibly versatile materials—malleability and tuneability—also challenge the transition toward a circular economy for plastics. Indeed, polymers are often mixed at various scales, a wide diversity in compounds exists, and polymers are subject to degradation. Large efforts are being undertaken in numerous projects to increase the recycling rates for various post-industrial and post-consumer end-of-life plastics, leading to new developments in sorting and refining technologies, as well as mechanical and chemical recycling technologies (see for instance [1,2,3,4,5,6,7,8,9,10,11,12]). Even on a societal level, changes are being made in how post-consumer plastics are collected, either by curbside bags or container collection, deposit systems or centralized collection facilities. Many of these efforts, however, interfere with the ever-increasing complexity of plastic formulations and products. At the front end of their lifecycle, some initiatives have been implemented with the aim of designing plastic products for circularity [13,14,15]. This can range from design-for-disassembly [16,17] and design-for-recycling [18,19,20]—both on a molecular level as well as on a product/object level—to assisting in the rapid detection/identification of material types by (chemical) labelling. Nevertheless, disruptive new ideas often fail to be adopted, as they are faced with existing, rigid, large-scale material flow infrastructures.
When assessing the sustainability of various new technological alternatives for plastics circularity, the past decades have seen a shift from using traditional ex post methodologies toward ex ante methodologies. The two major study areas are life cycle assessment (LCA) and techno-economic assessment (TEA), as well as approaches integrating both. To effectively serve as decision supports for research and development trajectories, applying these assessment methods at low technology readiness levels (TRL) is imperative. Various strategies exist, including the assumptions of ideal (thermodynamic) systems, the use of proxy technology transfers, participatory methods and the application of learning curves [21]. Essentially, the lower the technology readiness level, the more generic the study intrinsically becomes, as detailed information about full-scale processes and commercialized products in society is lacking.
Almost all sustainability assessments used for plastics cycles start by establishing mass and energy balances, which can further be translated into a life cycle inventory or into economic data. However, this approach requires quite advanced knowledge about the potential unit processes involved. A key factor in both LCA and TEA, from which many other indicators are derived, is the energy performance of systems. Indeed, if less energy is required to recycle waste plastics into a product, this option may be chosen over its linear economy alternative; e.g., producing virgin products that are incinerated at their end-of-life or landfilling (not taking resource scarcity or other environmental indicators into account). However, an energy balance and therefore quite detailed knowledge ofs unit processes is needed to get to this point. Transformative materials innovations (based on disruptive technologies) may in particular therefore fail to demonstrate their environmental and/or economic potential, as the background technological system—a collection of the currently employed methods—is usually considered in LCA or TEA.
Despite the large efforts dedicated to making the transition towards a more circular economy, an important challenge remains in assessing the recyclability of plastics (e.g., [22]). A reduced level of recyclability of plastics can result (i) from the difficulty to separate different plastic types [23], (ii) from the heterogeneity and mixing of collected plastic fractions, (iii) from degradation processes during the recycling process that impact crucial mechanical properties of recycled plastics [24,25], (iv) from the efforts related to the recycling processes (e.g., [26])) and (v) from the presence of adverse effects; e.g., contaminations and the accumulation of substances in the recyclate that may pose a health risk [27]. This shows that assessing plastic recyclability is a complex task that requires further research.
Often, users of the term recyclability fail to connect their design-for-recycling aspirations with the current complex reality of post-consumer plastic waste handling, sorting and recycling, or even worse, they are bound to a rigid background system. From an engineering point of view, all materials are 100% recyclable, as long as enough energy is available and the size of the cycle does not matter. This supports the aforementioned focus on energy aspects to investigate the feasibility and sustainability of recycling. Again, when making the claim that a material is “recyclable”, it can/should be supported by an integrated sustainability assessment. However, given the strict requirement of mass and energy balance estimations, as mentioned above, this analysis and therefore such claims can only be made for existing platform materials and objects, for which at least proxy technologies and products exist. The outcome of these studies is subject to several constraints corresponding to the scope of the study; the studied market, applied technologies, waste collection and sorting, access to manual labor or automation. These constraints regarding the applicability of the outcomes relate the specific contributions of waste transportation, sorting and refining to the overall impact/cost and are mostly case-specific. Again, judging the potential merits of transformative materials or disruptive system innovations may be inaccurate given the limited forecasting ability of traditional assessment methods.
In the search for more generic assessment methods, Rechberger and Brunner [28] developed statistical entropy analysis (SEA), which was initially applied to waste-to-energy (WtE) plants to investigate whether this technology is a concentrating or diluting waste treatment operation. Later, this method was adopted for predominantly inorganic/metallic materials streams, such as the European [29] and Chinese [30] copper cycle and the Austrian phosphorus cycle [31]. Other recent developments of SEA include the construction of a modified statistical entropy function to assess the recyclability of e-waste [32], linking SEA to exergy analysis applied to a crushed lithium-ion battery lab scale sieving experiment [33] and the introduction of mass joint entropy as an indicator together with a combination of SEA with substance flow analysis to evaluate phosphorus management in a food-based bioethanol system [34]. However, for a decade, the method was only applied to individual substances, limiting its applicability. Recently, however, Parchomenko et al., (2020) [35] extended the method by addressing statistical entropies at the component (consisting of multiple substances) and product (consisting of multiple components) levels, leading towards multilevel statistical entropy analysis. This extension [35] allows us to investigate such circular economy strategies as reuse, repair, remanufacturing or combinations of these. It is important to stress that SEA is not intended as a sustainability metric, but it has been developed to assess resource effectiveness, meaning the ability of a system to preserve functionality on the highest level possible, measured in terms of the statistical entropy changes performed by a system. As SEA is independent of any background systems (such as energy mixes) that play an important role and influence the results of, e.g., LCA, SEA only assesses if a specific state is achieved (product entropy, or entropy level of components or of pure substances) and not how it is achieved (e.g., by a robot or by manual work). Nonetheless, in assessing recyclability, the latter is equally relevant.
The goal of this paper is to highlight how multilevel SEA can also be used in predicting the recyclability of plastics in very generic background systems, although the method alone has some limitations. To overcome these, we propose to extend the assessment method by coupling it with energy balances from generic transportation, sorting and refining technologies. In doing so, we demonstrate that not all statistical entropies (typically expressed as relative statistical entropies) calculated by this method are equal in meaning, as two different waste streams with a similar relative statistical entropy may still differ significantly in the way these waste streams can be separated or further recycled (or reduced in relative statistical entropy). This paper does not present clear-cut formulations to address these issues, but rather explores options for quantifying aspects playing a role in recyclability. In addition, the authors propose a metric based on relative statistical entropy and relative decomposition energy as a potential avenue to define the recyclability of plastics. This is motivated by the fact that the energy required to reduce the relative statistical entropy of two different waste streams with a similar relative statistical entropy may differ significantly. Quantifying this generically, although still in its infancy, may resolve this and yield a powerful predictive and generic tool to predict plastics’ circularity. In this respect, this work can be considered as an addition to the work of Roithner and Rechberger (2020) [36] in which a recyclability effectiveness metric was defined based on classic SEA to quantitatively and qualitatively assess how effectively a studied recycling process can separate and concentrate an input waste stream.
This paper starts by recapping the multilevel SEA method by Parchomenko et al. (2020) [35] and applies this to a fictitious example of a collection bag for post-consumer recyclable plastics. Subsequently, an extension of the multilevel SEA method with energy consumption aspects is proposed together with a possible recyclability metric. Furthermore, a more realistic example of a collection bag with multiple different bottles, as a proxy for source-separated curbside collection systems such as the P + MD system—i.e., the waste collection bag for plastic packaging, metal packaging and drinking cartons in Belgium [37,38]—is elaborated, highlighting how objects with similar relative statistical entropy values may clearly require a different energy input for relative statistical entropy reduction.

2. Methods

In this section, the extended multilevel statistical entropy analysis (SEA) method is described for the assessment of the recyclability of plastics. Firstly, the multilevel statistical entropy analysis method of Parchomenko et al., (2020) [35] is introduced with its mathematical description. Subsequently, this methodology is applied to the conceptual example of a fictitious plastic bag. Limitations of the multilevel statistical entropy analysis method for a direct application as a recyclability metric are illustrated by this conceptual example. To conclude this section, an extension of the multilevel SEA method is presented in which energy consumption aspects are taken into account. Note that the statistical entropy considered in this contribution is not the same as thermodynamic entropy. To stress the difference with thermodynamic entropy (typically denoted by S in scientific literature), the statistical entropy is denoted by H in this contribution (as is typically done in information theory).

2.1. Description of the Multilevel Statistical Entropy Analysis (SEA) Method

Statistical entropy analysis (SEA) is a method based on Shannon’s statistical entropy function [39,40,41] to quantify changes in the substance distribution pattern throughout a system in which materials undergo transitions in different steps [28,29,42]. Among different process steps in a system, the substances can be diluted (increase in statistical entropy), concentrated (decrease in statistical entropy) or remain unchanged (unchanged statistical entropy). The focus of the initial SEA that was applied to the results of material flow systems was on the analysis of individual substances and did not consider components or products. Consequently, SEA cannot be directly applied to the evaluation of circular economy strategies such as reuse, repair, remanufacturing or combinations of these. To evaluate such circular economy strategies, the multilevel SEA method has been developed by Parchomenko et al., (2020) [35] in which, next to substance level entropies, component and product level statistical entropies are considered. The multilevel SEA method [35] is described in this subsection by making a distinction between the three different levels: substance level, component level and product level.

2.1.1. Substance Level Entropy

Consider a flow rate M f of a material flow f (which can be a component or a good flow, in mass per time) and the (dimensionless) mass fraction c i , f of a substance i in the material flow f. Thus, the substance flow rate X i , f (in mass per time) can be calculated as
X i , f = M f c i , f
In addition, standardized (dimensionless) mass fractions m i , f can be computed by dividing the material flow rate M f by the total flow of a substance i, over the F material flows f = 1 F X i , f as indicated in Equation (2) [33].
m i , f = M f f = 1 F X i , f
The statistical entropy H i ( c i , f , m i , f ) of a substance i (which is dimensionless) can be defined as follows [42]:
H i ( c i , f , m i , f ) = f = 1 F m i , f c i , f log 2 c i , f
In the SEA method, a dimensionless relative statistical entropy H r e l i ( c i , f , m i , f ) is used, which is the ratio of the statistical entropy value H i ( c i , f , m i , f ) and the maximum statistical entropy value H m a x i The relative statistical entropy is as indicated in Equation (4).
H r e l i ( c i , f , m i , f ) = H i ( c i , f , m i , f ) H m a x i
H m a x i = log 2 1 c i , g e o , m i n , for open systems log 2 f = 1 F m i , f , for closed systems
where c i , g e o , m i n is the minimum natural or geogenic concentration of substance i in the atmosphere and the hydrosphere, which corresponds with the concentration of the substance i in a compartment where it is maximally diluted [28,35].
Note that, in a closed system, the maximum statistical entropy of a substance i is reached when the substance is equally distributed among the material flows and the concentrations in all material flows are the same for substance i. The minimum statistical entropy is reached if a material flow consists of a single pure substance i (as in that situation, log 2 c i , f = log 2 1 = 0 ).
In SEA, only the relative substance level statistical entropy is considered. For a more detailed description of the SEA method, the reader is referred to [28,29,42]. If the research question concerns one single substance and its use in material flow analysis, the calculation of substance-level entropy can help in addressing this research question. If, however, the research question concerns higher levels (e.g., multiple substances, components or products), then an extended SEA approach should be applied in which the component or product level is addressed.

2.1.2. Component Level Entropy

In multilevel SEA, the second step is to calculate component-level entropy values. These component-level entropy values can subsequently be used for the calculation of the product-level entropies. A similar expression to Equation (3) can be used to describe the statistical entropy of a component n, H n c ( c i , n , m n c ) :
H n c ( c i , n , m n c ) = i = 1 I m n c c i , n log 2 c i , n
where m n c is the normalized component mass (i.e., the mass fraction of component n compared with all components at a stage in the system), c i , n is the concentration of substance i in component n and I is the number of substances.
The main differences between Equations (3) and (6) are the normalization at the component level and the summation over the different substances.
The relative statistical entropy of a component n can be expressed as the ratio between the component-level statistical entropy H n c ( c i , n , m n c ) and the maximum component-level entropy H m a x c . Both the relative component-level statistical entropy and maximum component-level entropy are described in Equations (7) and (8).
H n , r e l c ( c i , n , m n c ) = H n c ( c i , n , m n c ) H m a x c
H m a x c = i = 1 I c i , t o t log 2 c i , t o t
where c i , t o t is the concentration of substance i in the total mixture/product/system stage.
The maximum component-level entropy corresponds with either the case in which all substances are present in one material flow or equally distributed. Note that when dilution takes place in compartments outside the system boundary, the maximum statistical entropy is calculated as in Equation (5) for open systems.

2.1.3. Product Level Entropy

The final level that is considered in this paper is the product level. The product-level statistical entropy is defined in Equation (9).
H p ( c n , p , H n , r e l c ( c i , n , m n c ) ) = n = 1 N log 2 c n , p H n , r e l c ( c i , n , m n c )
c n , p = q n N t o t
where c n , p is the component concentration of component n in the product p, q n is the number of entities of component n and N t o t is the total number of components.
From Equation (9), it can be seen that the product-level entropy depends on the distribution of components (via the component concentration c n , p ) and the distribution of substances over the components (i.e., the relative statistical entropy values of the components H n , r e l c ( c i , n , m n c ) ). Consequently, an increase in product-level entropy can be caused by either an increase in the number of distinct components in a product or through a higher dilution or a more equal distribution of the substances over the product’s components.
In multilevel SEA, relative statistical entropies are considered. Therefore, the product-level statistical entropy needs to be divided by the maximum product-level statistical entropy to calculate the relative product-level statistical entropy. The maximum product-level entropy corresponds with the situation in which every substance is uniformly distributed over the product’s components. The maximum degree of substance dilution is in that case determined by the total number of components N. Thus, the relative product level statistical entropy and maximum product-level entropy can be expressed as in Equations (11) and (12).
H r e l p ( c n , p , H n , r e l c ( c i , n , m n c ) ) = H p ( c n , p , H n , r e l c ( c i , n , m n c ) ) H m a x p
H m a x p = log 2 N t o t
Note that the minimum H r e l p ( c n , p , H n , r e l c ( c i , n , m n c ) ) of 0 is reached in the situation where the product consists of only one component or one type of component (i.e., c n , p = 1 , thus log 2 c n , p = 0 ) and the situation in which all components consist of a single substance (i.e., the component entropies equal zero).

2.2. Conceptual Example of Multilevel SEA: A Fictitious Plastic Bag

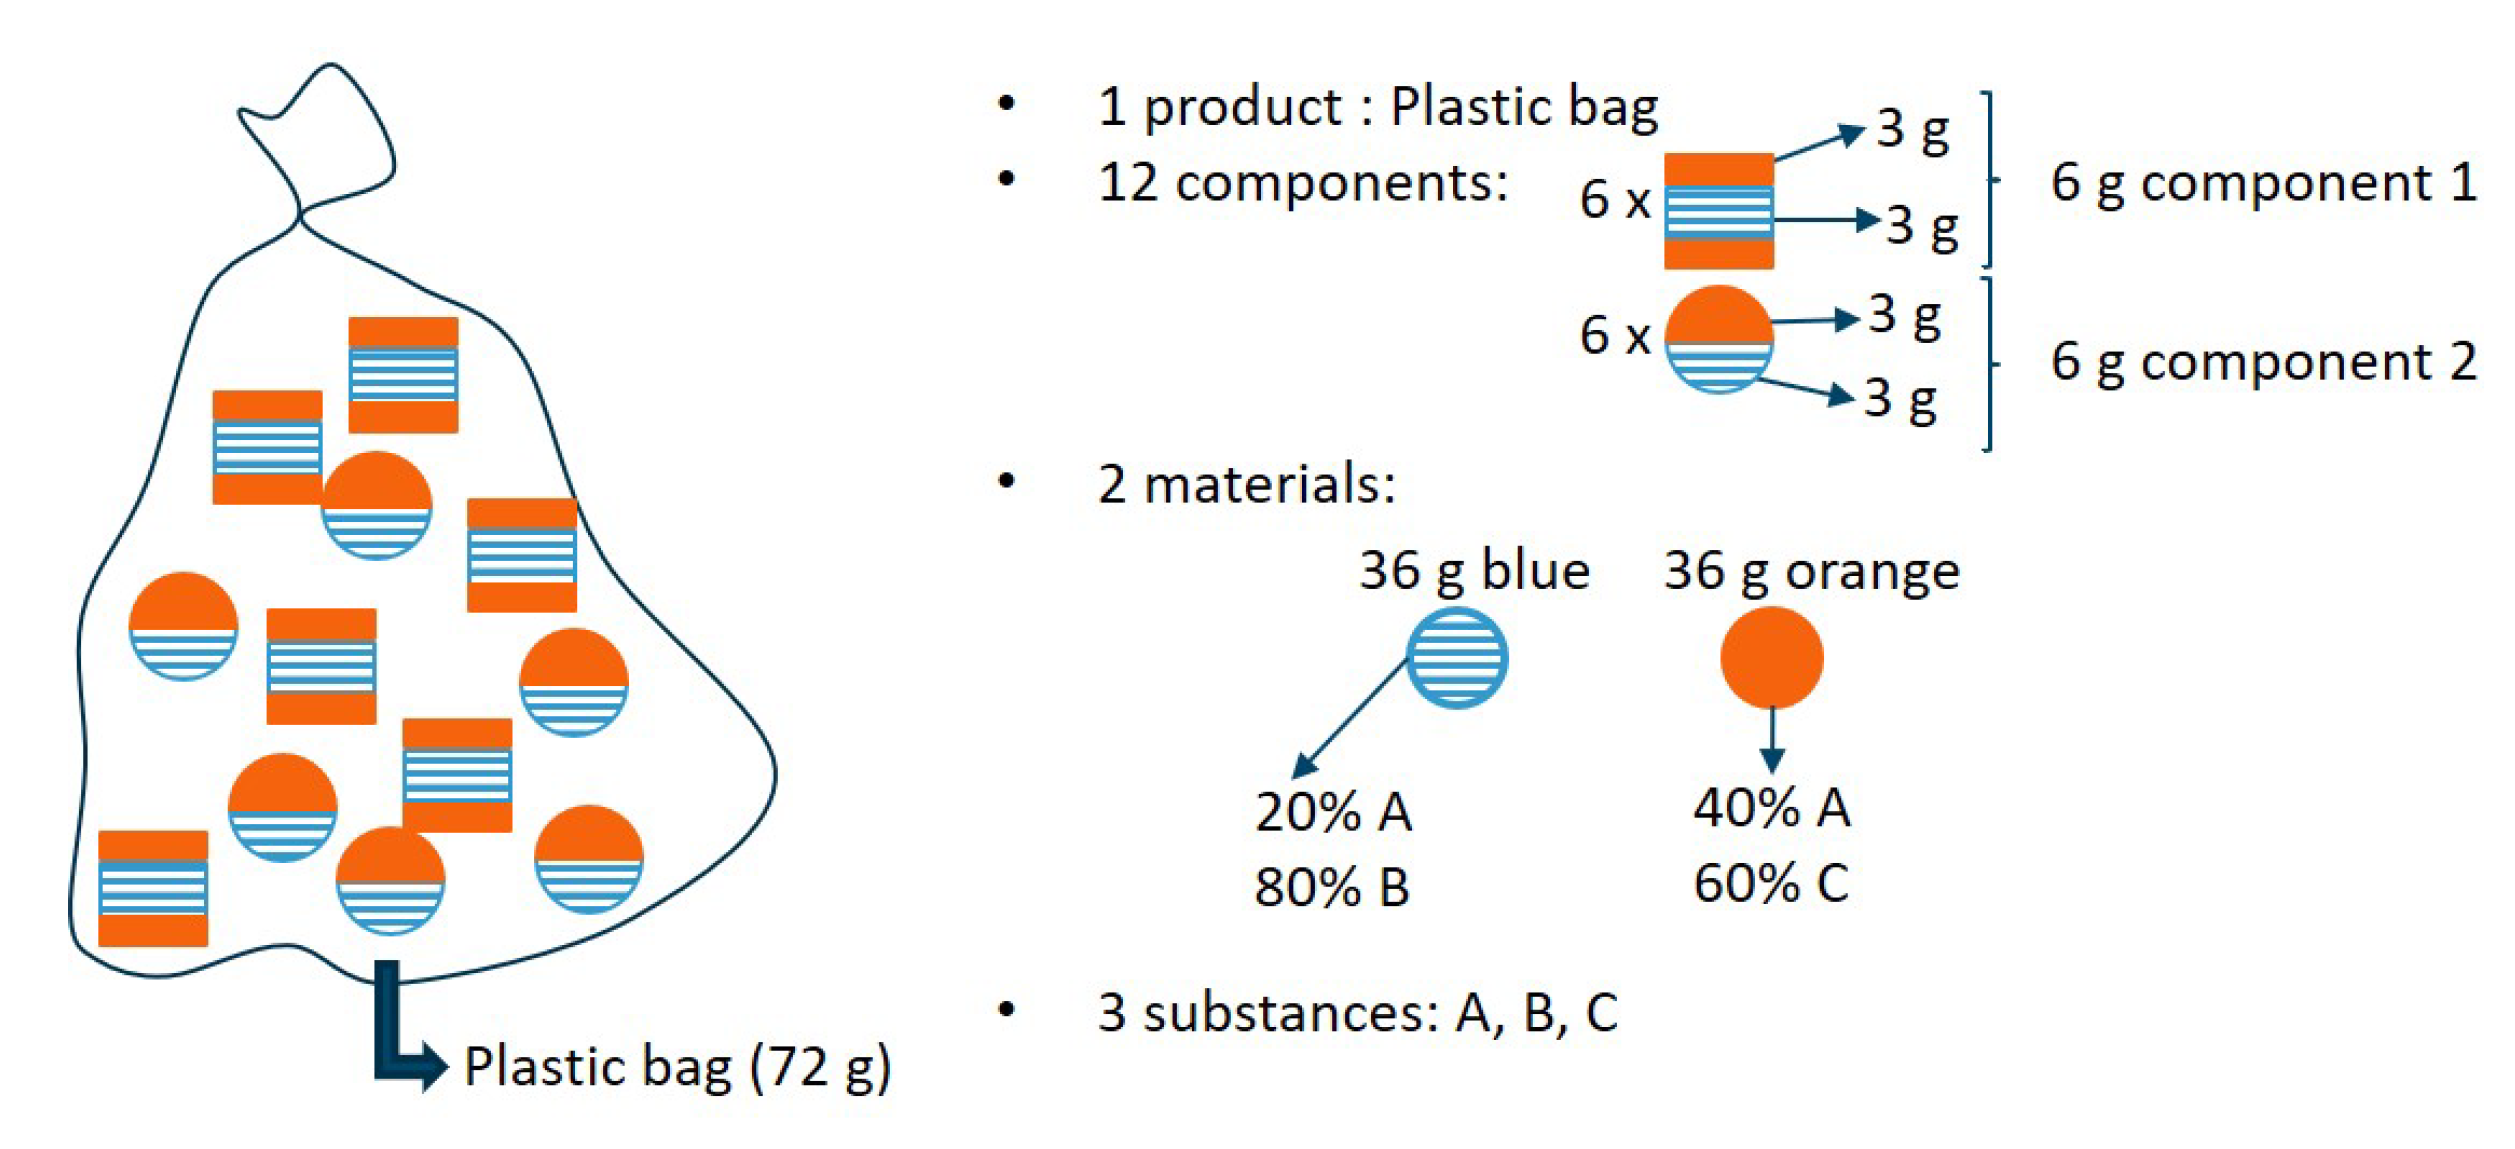
The multilevel SEA method is illustrated based on the conceptual example of a fictitious plastic bag (product) which is filled with 10 components (four units of component 1 and six units of component 2). A unit of component 1 consists of one entity of red material (2 g) and one entity of blue material (3 g). A unit of component 2 consists of one entity of orange material (3 g) and one entity of blue material (3 g). In terms of mass fraction, the blue material consists of 20% substance A and 80% substance B. The orange material consists of 40% substance A and 60% substance C. The red material consists of 50% substance B, 20% substance C and 30% substance D. An illustration of this conceptual example is presented in Figure 1. In the next paragraphs, the substance-level, component-level and product-level entropies are calculated for this example.

2.2.1. Substance Level Entropy Analysis

To study the transformation or distribution of substance A over the components by any given operation, the substance-level entropy should be calculated. The substance-level entropy could be of particular interest when studying sorting or refining processes, targeted at a certain substance purity and yield. The statistical entropy for substance A can be computed by filling in the entries for substance A in Equation (3). This results in the following:
H A ( c A , f , m A , f ) = m A , c 1 c A , c 1 log 2 c A , c 1 m A , c 2 c A , c 2 log 2 c A , c 2 = 1.977
The maximum substance-level statistical entropy can be calculated via Equation (5) for closed systems. This results in the following:
H m a x A = log 2 f = 1 2 m A , c f = 2.085
The relative substance-level statistical entropy can subsequently be calculated via Equation (4):
H r e l A ( c A , f , m A , f ) = H A ( c A , f , m A , f ) H m a x A = 0.948
The exercise above could also be done for the other substances. Therefore, the entries and results for the (relative) substance-level statistical entropies for the different substances are summarized in Table 1. Substance D has the lowest substance-level relative statistical entropy as it is only present in the first component. Substance B has the highest substance-level relative statistical entropy as it is the most diluted substance. Substance A is more diluted than substance C, reflecting the higher substance-level relative statistical entropy of A compared to substance C.

2.2.2. Component-Level Entropy Analysis for the Fictitious Bag Example

If the use and the fate of several related substances in the different components of the system are considered, component-level entropies can be calculated. This could be applicable in research questions regarding the distinct characteristics and composition of various components in a product or system. The component-level entropies are calculated for the two components in this example, component 1 and component 2, using Equation (6). To illustrate the use of the equations, this is elaborated for the first component. In order to complete Equation (6), the component mass fraction m 1 c and and the substance concentrations in component 1 are needed. These can be computed as indicated in Equations (16) and (17).
m 1 c = M 1 c M 1 c + M 2 c = 4 × 5 4 × 5 + 6 × 6 = 0.357
c i , 1 = c i , b l u e M 1 c c b l u e , 1 + c i , o r a n g e M 1 c c o r a n g e , 1 + c i , r e d M 1 c c r e d , 1 M 1 c
Inputting the values for the different substances in Equation (17) results in following substance concentrations in component 1: c A , 1 = 0.12 , c B , 1 = 0.68 , c C , 1 = 0.08 and c D , 1 = 0.12 . Thus, the statistical entropy of component 1 can be formulated as
H 1 c ( c i , 1 , m 1 c ) = m 1 c c A , 1 log 2 c A , 1 + m 1 c c B , 1 log 2 c B , 1 + m 1 c c C , 1 log 2 c C , 1 + m 1 c c D , 1 log 2 c D , 1 = 0.501
The maximum component-level entropy can be calculated with Equation (8):
H m a x c = i = 1 4 c i , t o t log 2 c i , t o t = 1.668
with c i , t o t = c i , b l u e M b l u e + c i , o r a n g e M o r a n g e + c i , r e d M r e d M t o t
where M t o t is the total mass (equal to 56 g for this case study). Consequently, the relative statistical entropy for component 1 can be calculated via Equation (7):
H 1 , r e l c ( c i , 1 , m 1 c ) = H 1 c ( c i , 1 , m 1 c ) H m a x c = 0.301
The entries and results for the (relative) component-level statistical entropies for the different components are summarized in Table 2. The last column of Table 2 indicates that the first component has a lower component-level relative statistical entropy than the second component. This can be explained by the higher degree of dilution (40% B, and 30% A and 30% C) of component 2 in its substances compared to component 1 (68% B, 12% A, 12% D and 8% C), as depicted in the second column of Table 2.

2.2.3. Product-Level Entropy Analysis for the Fictitious Bag Example

For this example, the final hierarchical level in the multilevel SEA method is the product level, in which the use of components and several related substances in the product are studied. The product-level entropy can be calculated with Equation (9). For the fictitious bag example, this results in the following expression:
H p ( c n , p , H n , r e l c ( c i , n , m n c ) ) = n = 1 2 log 2 c n , p H n , r e l c ( c i , n , m n c ) = 0.843
The maximum statistical entropy can be calculated via Equation and H m a x p = log 2 N t o t = log 2 10 = 3.322 . Consequently, the relative statistical entropy of the fictitious bag can be written as (Equation (11)).
H r e l p ( c n , p , H n , r e l c ( c i , n , m n c ) ) = H p ( c n , p , H n , r e l c ( c i , n , m n c ) ) H m a x p = 0.254

2.3. Limitation of Multilevel SEA if Separation Energy Matters: A Counter Example

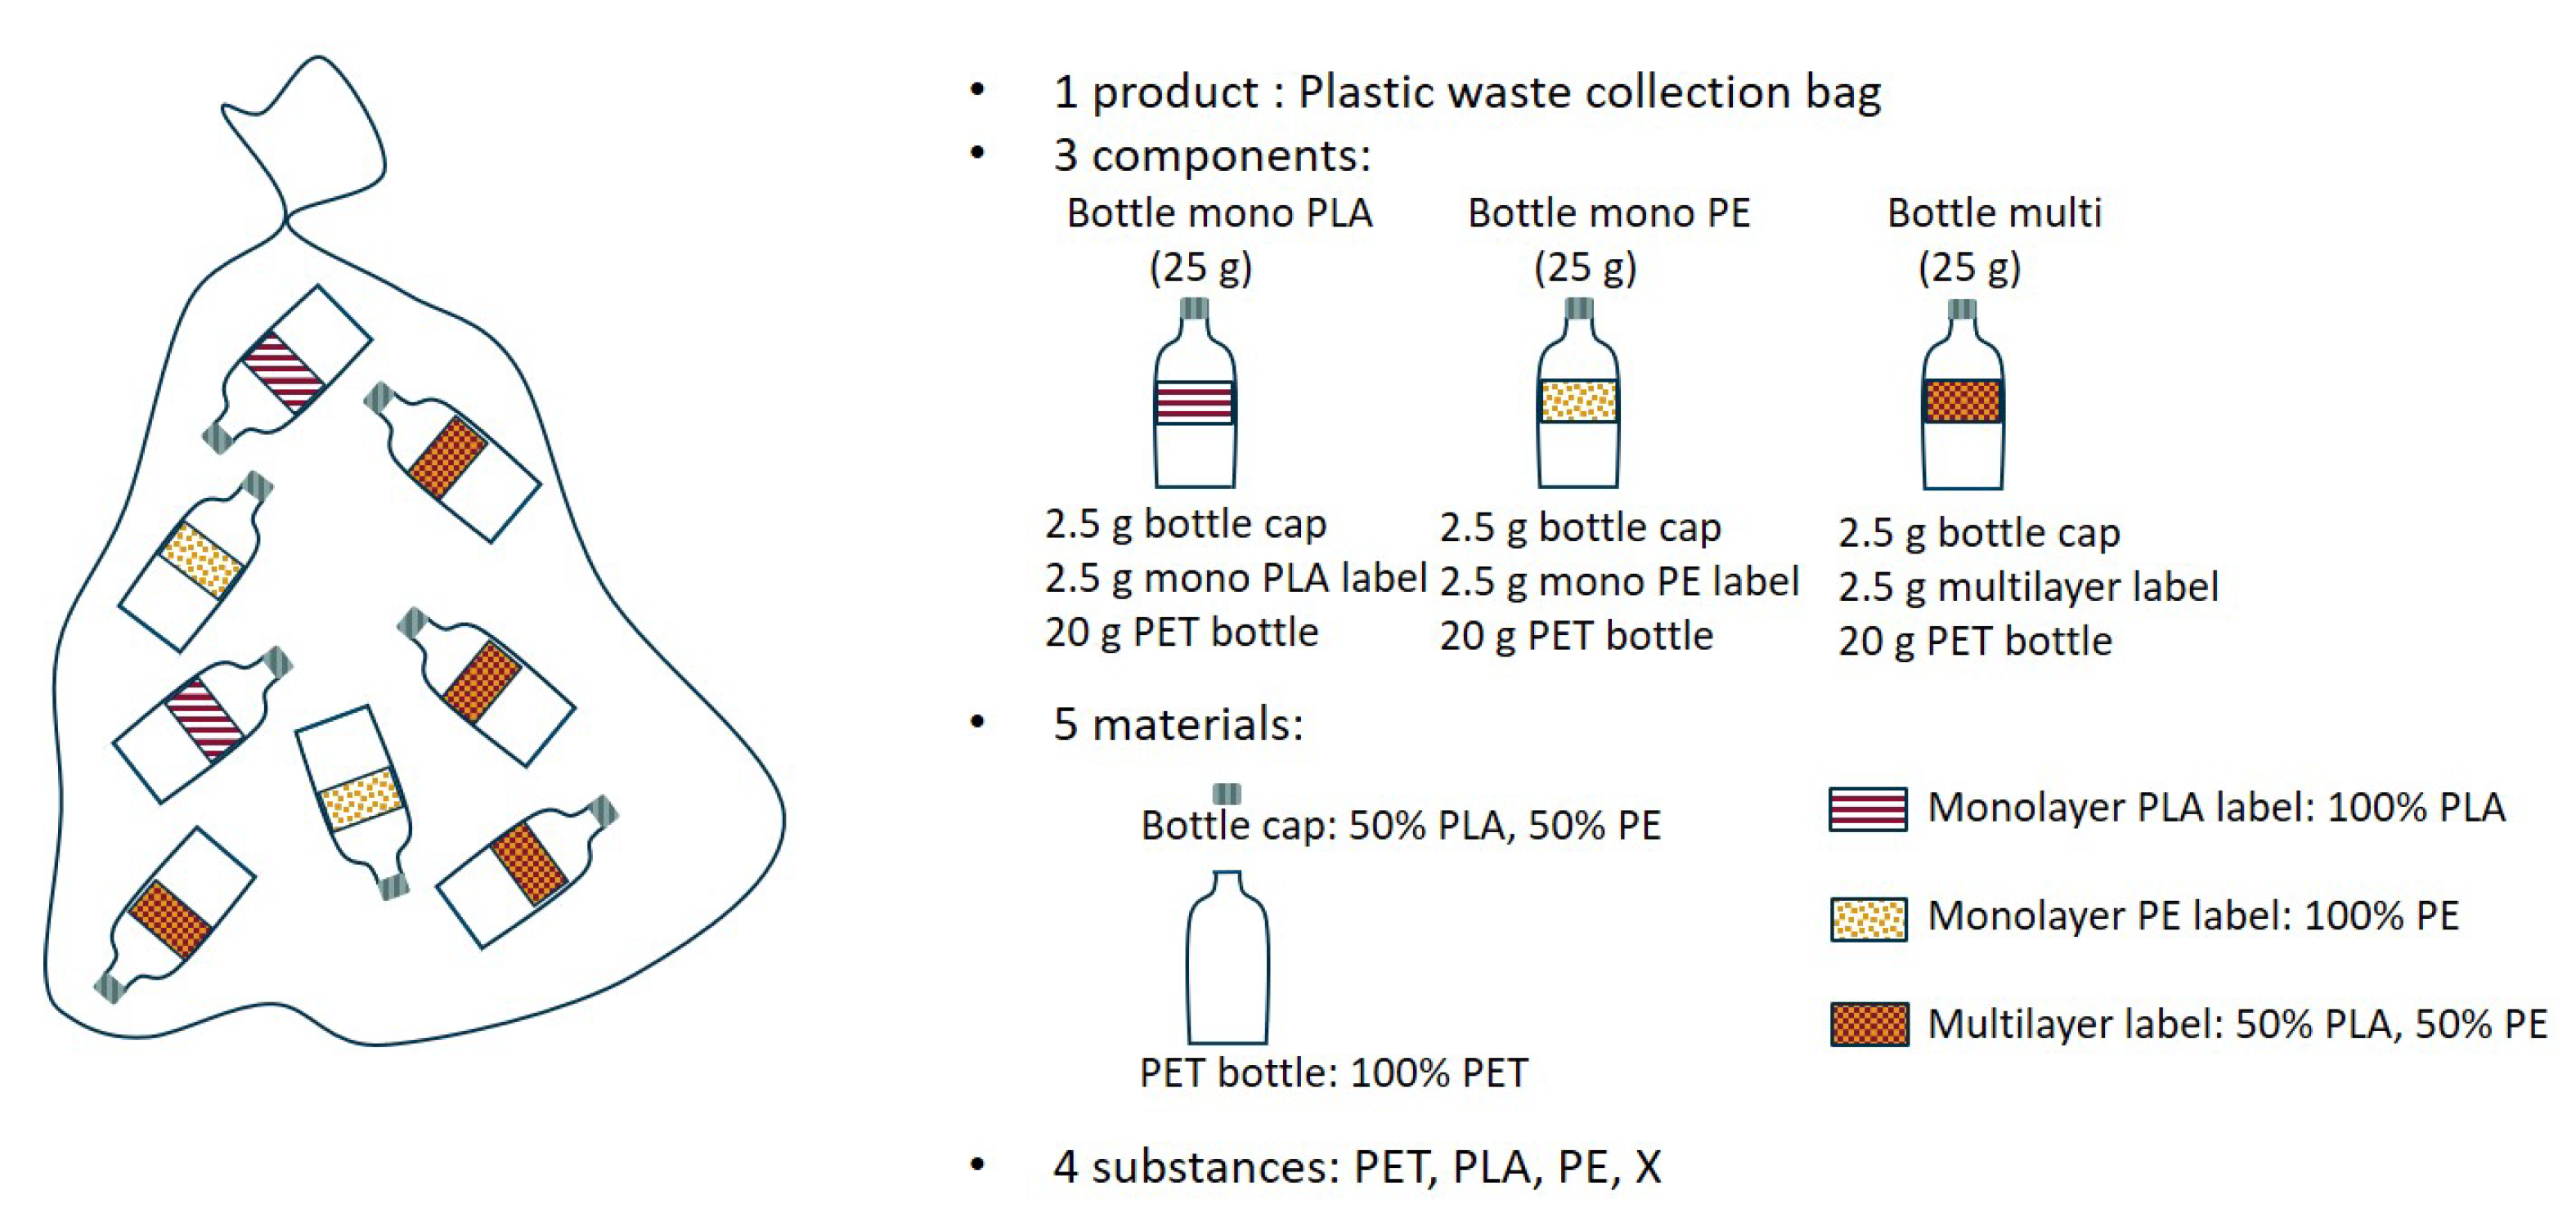
Consider a variation on the fictitious bag example, illustrated in Figure 2. In this example, two components (which could be any plastic packaging objects, ranging from packaging trays to bottles with caps) are present in the product mixture. Both components have the same substance concentrations (with three substances, A, B and C, and two materials, blue and orange). However, both components have a different structure and are linked differently to one another. One component could, for instance, be glued, whereas the other could be screwed. A comparable situation would be a bag filled with multilayer plastics and monolayer plastics, both with the same substance composition.
In this counter example, it is clear that the relative component statistical entropies will be the same; i.e., 0.500 (see Table 3 for details on the calculation of the component level entropies). However, both components are not necessarily as easily separated. Multilevel statistical entropy analysis does not account for the energy that is needed to separate these components in its constituent building blocks. Therefore, the efforts to reduce the relative statistical entropy could strongly differ for the various components, although they have the same relative component statistical entropy. In order to use the concept of multilevel SEA for the evaluation of recyclability, an extension is required which addresses the effort needed to separate the components into their building blocks. Therefore, the authors present such an extension using energy consumption aspects in the next subsection.

2.4. Extension of the Multilevel SEA Method with Energy Consumption Aspects to Assess Recyclability

As indicated in the counter example of the previous subsection, an extension of the multilevel SEA method is needed. The authors propose to extend the multilevel SEA method by including energy consumption aspects to assess the recyclability of a product or its components. Firstly, the extension with energy consumption aspects is illustrated for the component level. Subsequently, it is extended to the product level.
Consider a component n that consists of M different materials that are linked together to form the component n. Such a material m consists of I different substances that are mixed or blended in a certain way (note that a substance is indicated by i). As indicated in the counter example, the relative statistical entropy concept does not account for the often distinct way in which materials and/or substances are linked. Depending on the linking of the materials and/or the substances, different processes exist to decompose the component n in its constituting materials m and/or its constituting substances i. The energies required to decompose a component into its materials E n c ( π , η m c ) or decompose a component into its substances E n c ( π , η i c ) can be defined per unit mass of component (units: J/kg). A conceptual representation of how these decomposition energies are linked to the recycling of the components is indicated by the full blue arrows in Figure 3. Note that these energies depend on the process π that is used, which in turn depends on the required decomposition efficiency to either the materials η m c or the substances η i c . All decomposition efficiencies defined in this contribution have a value between 0 and 1, corresponding with no decomposition and full decomposition into materials or substances, respectively. In addition, it should be stated that, in practice, processes can exist that do both; i.e., decomposing the components partially into their materials and partially into their substances. Therefore, a generic decomposition energy of a component n can be defined as E n c ( π , η m c , η i c ) (in J/kg).
Next, a product p can be considered which consists of N different components n. The energy required to decompose the product into its components can be defined as E p ( π , η n p ) , where η n p is the decomposition efficiency of the product to its components, per unit mass of product (units: J/kg). A product p could also be decomposed directly by a process in its constituent materials using a decomposition energy from a product to its materials described by E p ( π , η m p ) , where η n p is the decomposition efficiency of the product to its components. Similarly, a product could be decomposed in its constituent substances with decomposition energy from a product to its substances E p ( π , η i p ) , where η i p is the decomposition efficiency of the product to its components. These decomposition energies are presented conceptually by the red dotted arrows in Figure 3. The generic energy of decomposition of a product p, decomposing the product partially in its components, materials and substances, can denoted by E p ( π , η n p , η m p , η i p ) (in J/kg).
In order to use these concepts of decomposition energy to evaluate the recyclability of different components or products, a relative metric is needed. Therefore, a maximum decomposition E m a x (in J/kg) is defined. This maximum decomposition energy corresponds with the energy that is needed to produce the amount of virgin substances that are present at the highest hierarchical level of the system that is studied, per kg (units: J/kg). In our contribution, this is the product level. This allows us to compare the relative decomposition energies of components with one another, as the same maximum decomposition energy value is used. In the case that the energy required to produce all virgin substances that are present at a lower hierarchical level is used (such as for a component), the relative decomposition energies of different components could not be compared to one another. Therefore, the energy required to produce all virgin substances that are present at the highest hierarchical level—in this contribution, the product level—has been chosen to define the maximum decomposition energy. A mathematical formulation for the maximum decomposition energy is presented in Equation (24).
E m a x = 1 M t o t n = 1 N i = 1 I q n c i , n M n e i p r o d u c t i o n ,
where M t o t is the total mass of the studied system (i.e., the mass of the highest hierarchical level that is considered), q n is the number of components n in the product (dimensionless), c i , n is the mass fraction of substance i in component n (dimensionless), M n is the mass of component n (in kg) and e i p r o d u c t i o n is the energy that is needed to produce 1 kg of virgin substance i (expressed in J/kg).
The maximum decomposition energy defined in Equation (24) can be used to define the relative decomposition energy of a component E r e l c ( π , η m c , η i c ) and of a product E r e l p ( π , η n p , η m p , η i p ) in Equations (25) and (26), respectively. In practice decomposition to the materials is often the goal as these materials (e.g., blends) have been designed with a specific purpose in mind.
E n , r e l c ( π , η m c , η i c ) = E m , i c ( π , η m c , η i c ) E m a x
E r e l p ( π , η n p η m p , η i p ) = E n , m , i p ( π , η n p , η m p , η i p ) E m a x
Note that the relative decomposition energy (either at component or product level) typically has a value between 0 and 1. However, situations exist in which the relative decomposition energy is greater than 1. In such a situation, the considered decomposition requires more energy per kg than producing the virgin substances that are present per kg. From an energetic point of view, such a recycling route is undesirable. However, such a situation could on the other hand be justifiable in the case of the absence (or an extreme scarcity) of sources to produce the virgin substances.
A first possible recyclability metric for a component based on relative statistical entropy and relative decomposition energies for a component R n ( 1 ) or product R p ( 1 ) can be formulated in Equations (27) and (28), respectively.
R n ( 1 ) = 1 H n , r e l c ( c i , n , m n c ) 1 E n , r e l c ( π , η m c , η i c )
R p ( 1 ) = 1 H r e l p ( c n , p , H n , r e l c ( c i , n , m n c ) ) 1 E r e l p ( π , η n p , η m p , η i p )
Note that the recyclability metrics R n ( 1 ) and R p ( 1 ) typically have a value between 0 and 1 (assuming that the relative decomposition energies have a value between 0 and 1). The minimum recyclability should correspond with the situation in which the relative statistical entropy is either maximal and/or the relative decomposition energy is maximal. The maximum recyclability corresponds with the situation in which the relative statistical entropy equals zero and the relative decomposition energy equals zero. However, negative values of the recyclability metric are possible in which the relative decomposition energy is greater than 1. As mentioned earlier, in such a situation, more energy is required to achieve the preset decomposition than the energy that is needed to produce the virgin substances that are present in the product. In the case of a negative recyclability metric value ( R n ( 1 ) < 0 or R p ( 1 ) < 0 ), recycling can only be justifiable if sources to produce the virgin substances are not available or extremely scarce.
The potential negative value of R n ( 1 ) or R p ( 1 ) could be considered to be less elegant. Therefore, the following alternative recyclability metrics R n ( 2 ) and R p ( 2 ) are proposed at the component and product level:
R n ( 2 ) = 1 H n , r e l c ( c i , n , m n c ) E n , r e l c ( π , η m c , η i c )
R p ( 2 ) = 1 H r e l p ( c n , p , H n , r e l c ( c i , n , m n c ) ) E r e l p ( π , η n p , η m p , η i p )
The minimum value of the alternative recyclability metrics R n ( 2 ) and R p ( 2 ) equals zero and corresponds with the maximum component and product-level relative statistical entropy, respectively. The maximum value of the alternative recyclability metric equals infinity and corresponds with the situation in which the relative decomposition energy equals zero (i.e., no energy is needed to decompose the component or product). Note that negative values of the recyclability metrics R n ( 2 ) and R p ( 2 ) are impossible as the relative statistical entropy values cannot exceed 1 and the relative decomposition energy values cannot be smaller than 0. In addition, a situation in which the recyclability metrics R n ( 2 ) and R p ( 2 ) are smaller than the contributions coming from the relative statistical entropies at the component 1 H n , r e l c ( c i , n , m n c ) and product level 1 H r e l p ( c n , p , H n , r e l c ( c i , n , m n c ) ) , respectively, correspond with the situation of a negative recyclability metric value of R n ( 1 ) and R p ( 1 ) .
In the case studies presented in this contribution, we focus on the recyclability of the components. The two recyclability metrics that have been presented at the component level, R n ( 1 ) and R n ( 2 ) , are evaluated in the next section. The maximum recyclability corresponds with the situation in which a relative statistical entropy value of zero is exhibited for a component (i.e., the component consists of one single substance or one material) and the situation in which no energy is required for further refinement.

3. Results and Discussion

In this section, the results obtained with the proposed extension of multilevel SEA with energy consumption aspects are presented and discussed. Firstly, the assumptions that have been made to calculate the decomposition energies in this paper are introduced. Subsequently, the two proposed recyclability metrics are evaluated for the counter example presented in Section 2.3. Next, the case study of a plastic waste collection bag filled with plastic bottles is introduced, and multilevel SEA and the proposed extension of multilevel SEA are applied to this case study. To conclude this section, the potential of the proposed extension of multilevel SEA for plastic waste recycling is discussed.

3.1. Assumptions for the Calculation of Decomposition Energies

Although the relative statistical entropy difference between a waste collection bag with different monolayer labels versus a bag with multilayer label bottles can be quite small (even zero in the counter example introduced in Section 2.3), we know intuitively that multilayer plastic composites are much harder to recycle. Indeed, the various layer materials are often chemically incompatible, limiting the potential for mechanical recycling [43]. Disentangling the layers in order to lower the relative statistical entropy of a component or product would require custom technologies such as selective dissolution–precipitation [43], delamination [44] or selective hydrolysis of one of the constituting substances [45].
Sorting and pretreating polymers, employing techniques such as washing, shredding, grinding, sink–float and near-infrared separations, reduces the statistical entropy of a collection of plastic waste objects, such as the components and subcomponents (bottles, labels and caps) of the exemplary collection bags. Altogether, with a uniform allocation, such sorting is responsible for about 0.36 MJ energy consumption per kg of plastic [22]. In order to get to recycled pellets via mechanical recycling, an additional 0.32 MJ/kg energy is required [46], leading to a total energy requirement of 0.68 MJ/kg. When multilayer labels are present, to achieve approximately the same relative statistical entropy level, the polylactic acid (PLA) of the labels should be selectively dissolved, corresponding to an energy consumption of 1.23 MJ/kg (0.36 MJ/kg (Faraca et al., 2019) [22] + 0.87 MJ/kg (Maga et al., 2019) [46])). Note that these numbers are an estimate based on the literature and are only for illustration purposes. In addition, the case studies in this contribution are rather simple and do not account for the complexity of the constituents of the components and their mixtures. In practice, this can have implications for the effective decomposition energies.
The maximum decomposition energy has been defined as the energy that is needed to produce all virgin substances present per kg of the product (in this case, the plastic bag). Three substances (PET, PE and PLA) are considered in this contribution, and the energies needed to produce the virgin materials have been assumed based on the literature: 83 MJ/kg for PET [47], 76 MJ/kg for PE [48] and 58.9 MJ/kg for PLA [49].

3.2. Recyclability Metrics for the Counter Example

Consider the counter example from Section 2.3 in which we have two types of components which are equal in substance composition (both having a relative statistical entropy of 0.500), but where one component consists of 100% monolayers and the other of 100% multilayers. Assuming that the substance A is PE, B is PET and C is PLA and that the multilayer components are selectively dissolved, the following decomposition energies can be calculated: E m a x = 73.7 MJ/kg, E m o n o = 0.68 MJ/kg, E r e l m o n o = 0.00923 , E m u l t i = 1.23 MJ/kg and E r e l m u l t i = 0.0167. The values of the recyclability metrics for the monolayer and multilayer components are depicted in Table 4.
From Table 4 it can be seen that both recyclability metrics are higher for the monolayer component than for the multilayer component, reflecting that the monolayer components are easier to recycle than the multilayer components (as expected). However, the difference between the recyclability metrics of the monolayer and multilayer components is more pronounced in R n ( 2 ) than in R n ( 1 ) . Therefore, we consider the second recyclability metric R n ( 2 ) as being more attractive than the first one R n ( 1 ) in terms of quantifying the effect of decomposition energy on recyclability.
In the next section, a plastic waste collection bag filled with plastic bottles is studied as a more complex system. This waste stream differs from the counter example, in the sense that the plastic bottles are very similar and only differ in the composition of the labels and the way these labels are constructed (i.e., monolayers versus multilayers). Both recyclability metrics are compared to see whether these are capable of capturing the slight difference in recyclability.

3.3. Case Study: Plastic Waste Collection Bag Filled with Plastic Bottles

As a case study, a simplified plastic waste collection bag filled with plastic bottles (the product for this case study) has been studied, as illustrated in Figure 4. Three types of components are considered: a plastic bottle with a monolayer PLA label (referred to as monolayer PLA bottle), a plastic bottle with a monolayer PE label (referred to as monolayer PE bottle) and a plastic bottle with a multilayer PLA and PE label (referred to as multilayer PLA bottle). Five materials are present in the studied system: a bottle cap, bottle material, monolayer PLA label, monolayer PLA label, multilayer PLA and PE label. Four substances are considered: PET, PLA, PE and X (an adhesive component that can be present on the label). It should be noted that this example is hypothetical and does not represent common bottle labels.
The concentrations of the substances in the components and products are summarized in Table 5. The concentrations of the materials in the components and the concentrations of the components in the product are summarized in Table 6.

3.3.1. Multilevel SEA Results

Based on the data in Table 5 and Table 6, the component-level and product-level relative statistical entropies can be calculated. The results are depicted in Table 7. The component-level relative statistical entropy value of the multilayer bottle is higher (0.5) compared to the monolayer bottles (0.241). This is due to two factors: (i) the number and total mass of multilayer bottles is higher than the number of monolayer bottles (PLA) and monolayer bottles (PE) individually, and (ii) the multilayer bottle has a label that consists of PE, PLA and X, while the monolayer bottles only have a label that consists of PE and X or PLA and X. Note that, although the sum of the masses of the two monolayer bottle components equals the mass of the multilayer bottle components, the sum of the component-level relative statistical entropies of the monolayer bottles is still lower than the relative statistical entropy of the multilayer bottle due to the difference in the composition of the label.
As a first variation on this case study, the relative statistical entropies are calculated in the case that no PE monolayer bottles were present in the bag and four PLA monolayer bottles and four multilayer bottles were present in the bag. The relative statistical entropy of the multilayer bottle remains unchanged. However, the relative statistical entropy of the monolayer bottle (PLA) changes to 0.486, which is close to the value of 0.504 for the multilayer bottle. The slight difference in component-level relative statistical entropy is caused by the label composition. However, the product-level relative statistical entropy decreases from 0.488 to 0.33 as the number of distinct components has reduced.
A second variation is the situation in which the bag is only filled with eight multilayer bottles. In this situation, the product consists of only one type of component, rendering the concept of product-level relative statistical entropy much less useful. The component-level relative statistical entropy is at its maximum value of 1, as all substances are concentrated in the same manner in the different components.
A third variation is the situation in which the bag is only filled with four monolayer bottles (PLA) and four monolayer bottles (PE). In this case, the component level entropies equal 0.482. The product-level relative statistical entropy changes to 0.32, which is close to the product-level relative statistical entropy of the first variation.
In essence, the multilayer presence does not dramatically increase the relative statistical entropy, whereas the recyclability of multilayers is clearly dramatic. This appears especially from the comparison of variation 1 and variation 3.

3.3.2. Extending the SEA Results with Energy Considerations

The assumptions from Section 3.1 are followed when calculating the relative decomposition energies. Since the labels account for 10% of the total mass in the collection bags in our example, the additional energy requirement to achieve a similar statistical entropy is thus 4% higher for the first variation (half of the bottles having multilayer labels) and 8% higher for the second variation (all bottles having multilayer labels). If hydrolysis (Maga et al., 2019) [46] is used instead of dissolution–precipitation, these numbers would change to 7% and 14%, respectively. Note that these numbers are an authors’ estimate and are only for illustration purposes.
Consider the plastic waste collection bag filled with four monolayer PLA bottles and four multilayer bottles (i.e., the first variation with component-level relative statistical entropies of 0.488 and 0.500, respectively). If we consider recyclability at the component level, we study the relative statistical entropy at the component level and the relative decomposition energy at the component level. This means that, for the relative decomposition energies, the relative decomposition energy of a monolayer bottle and the relative decomposition energy of a multilayer bottle are calculated for the recyclability metrics. If we consider the selective dissolution of the multilayer labels, we can conclude from the previous paragraph that 8% more energy is needed to recycle a multilayer bottle compared to a monolayer bottle. This would lead to the expressions of the proposed recyclability metric at the component level being R m o n o and R m u l t i , where E r e l m o n o is the relative decomposition energy of a monolayer PLA bottle:
R m o n o = 1 0.486 1 E r e l m o n o
R m u l t i = 1 0.504 1 1.08 E r e l m o n o
For the monolayer PLA bottle, we assume that it is decomposed by a sorting and pretreatment step, followed by a mechanical recycling step. For this situation, we calculated a total energy requirement of 0.68 MJ kg 1 [22,46]. For substance X, we assume no energy requirement, as it is not considered to be a valuable raw substance in this case study. In the first variation, four monolayer PLA bottles and four multilayer bottles are present in the product. The substance concentrations and the substance masses in the bag filled with four monolayer PLA bottles and four multilayer bottles (first variation of the case study) are summarized in Table 8. Note that the total mass of the product equals 0.2 kg.
The maximum decomposition energy for the first variation can be calculated by combining Equation (24) with the substance masses depicted in Table 8 and the energies needed to produce the virgin materials. This results in E m a x = 79.1 MJ/kg and E r e l m o n o = 0.00860 and E r e l m u l t i = 0.00928 and in the values presented in Table 9.
Both recyclability indicators in Table 9 indicate a slightly easier recyclability of the monolayer PLA bottles compared to the multilayer bottles. However, the first recyclability metric shows a substantial difference of 0.019. This is counterintuitive when comparing this with the difference in the counter example of 0.003 for the first recyclability metric. This would imply that the difference in recyclability between the two types of bottles is higher than the difference in recyclability between the monolayers and the multilayers in the counter example. The decomposition energy contribution seems undervalued when using the first recyclability metric R n ( 1 ) . Comparing the difference in recyclability between the monolayers and the multilayers in this case study and the counter example gives more expected results. The monolayers are substantially easier to recycle than the multilayers in the counter example (a difference of 24.3 in R n ( 2 ) ), while the monolayer PLA bottles and multilayer bottles differ less in recyclability (difference of 6.4 in R n ( 2 ) ) for the second recyclability metric. The results for R n ( 2 ) correspond more with what is expected intuitively, as the monolayer bottle and the multilayer bottle only differ in terms of the labels (which is only 10% of the bottle mass), which explains the small difference in recyclability. Based on this reasoning, we consider the second recyclability metric R n ( 2 ) as being most suited to the proposed recyclability metrics in this contribution.
It should be stressed that different options exist to define recyclability metrics based on relative statistical entropy and relative decomposition energies. One option would be to use a recyclability metric in which the relative statistical entropy is put in the denominator (for instance, 1 E n , r e l c ( π , η m c , η i c ) H n , r e l c ( c i , n , m n c ) for the component level) or both relative decomposition energy and relative statistical entropy are put in the denominator ( 1 H n , r e l c ( c i , n , m n c E n , r e l c ( π , η m c , η i c ) ). Another option could be to define the maximum decomposition energy in another way; an option could be to define the maximum decomposition energy as the maximum energy from a group of currently existing/considered recycling processes that is needed to achieve the required decomposition efficiencies. For the examples elaborated in this paper, this would correspond with the energy needed for a hydrolysis process. However, this would be a definition that is less generic. In future work, different definitions of recyclability metrics using the concepts of relative statistical entropy and relative decomposition energy will be studied with real life case studies, and it will be assessed whether these can be computed in a generic and practical way (i.e., whether the information needed to compute these can be made available in a relatively easy manner).

3.4. Potential for Plastic Waste Recycling

Different pathways exist to recycle plastic waste, which are typically subdivided into mechanical and chemical recycling processes. A recent review on the current state of the art processes for solid plastic waste recycling has been presented by Ragaert et al., (2017) [50]. The different mechanical recycling steps that are typically needed to separate plastic waste collection bags into their different plastic components can be summarized as follows [50]: (s) bag opening/cutting, (ii) separation by size (progressive rotating sieve), (iii) blowing out of loose contents (labels or bags) with wind sifters, (iv) removal of ferrous materials by an overhead magnet, (v) removal of cartons by optical sorting, (vi) removal of non-ferrous metals (e.g., aluminum) with eddy currents and (vii) removal of soft plastics (e.g., foils) using a ballistic separator. The authors stress that, in this contribution, a simplified situation has been studied in which the plastic waste collection bag only contains bottles, while in practice other plastic packaging objects, such as trays, foils and bags, are present [37]. In addition, it is clear that a substantial number of process steps (and an associated substantial energy consumption) are needed.
Multilayer plastics are widely used (e.g., in food packaging applications) as the properties of different raw materials can be combined to optimize performance with respect to the packaging requirements (e.g., preventing contaminations, serving as an oxygen barrier and extending shelf life). The review of Kaiser et al., (2018) [51] addressed the recycling of multilayer plastic packaging by making a distinction between (i) methods that separate multilayer plastic packaging into its constituting components (delamination and selective dissolution precipitation) and (ii) compatibilization, wihch processes the mixture in one step. The delamination of multilayer plastics is challenging and complex, making the separation costly and time-consuming, and the recycled material is often of low quality. Therefore, another option is to avoid separating the multilayer plastic waste into its separate components but instead blend the polymer. Typically, compatibilization is applied, in which a compatibilizer (e.g., a graft or block copolymer) is used to improve the miscibility of the overall blend, reducing the energy requirements. Compatibilization, typically achieved in a rather well-defined extrusion process, results in a system with a high entropy state. However, the energy needed to reduce the entropy in a delamination process might be too high.
Reactive extrusion and multiphase blending with extrusion technology is currently being developed to combine the recycling of polymers or plastic waste and synthesize new polymers or plastic products [52,53,54]. Similarly, reactive extrusion typically keeps the system at a high relative statistical entropy state but offers benefits from an energetic point of view compared with other technologies (that aim at reducing the entropy) for the same waste stream. This feature makes reactive extrusion an interesting application that can be analyzed with the proposed extension in this contribution. Therefore, in future work, the extended multilevel statistical entropy methodology will be further developed and applied to support the development of reactive extrusion technology.
The proposed methodology in this paper, in which multilevel statistical entropy analysis has been extended with energy consumption aspects, can be used to evaluate these different recycling options from a recyclability point of view. However, in terms of sustainable plastic waste treatment, additional aspects need to be addressed. Therefore, the authors see opportunities to integrate the proposed extended multilevel statistical entropy analysis methodology with energy consumption aspects in a multi-objective environmental techno-economic assessment framework [55].
Other perspectives for future work are the refinement of the proposed recyclability metric and the inclusion of energy consumption aspects, the application of the proposed methodology to real-life plastic products and plastic waste streams and integration of different levels of entropy (e.g., at the molecular and geographical level).

4. Conclusions

In this paper, the multilevel statistical entropy analysis (SEA) method has been reviewed and discussed in the context of evaluating the recyclability of plastics. We have illustrated how the concept of multilevel SEA can be extended to allow the assessment of the recyclability of plastics based on a conceptual example of a fictitious plastic bag. As a potential avenue to assess the recyclability of plastics, we proposed an extension of multilevel SEA with energy consumption aspects (relative decomposition energy) to formulate recyclability metrics for components and products. In other words, we took into account the energy required to reduce the relative statistical entropy of components or products. This methodology has been applied to the case study of a plastic waste collection bag. This paper explored which aspects play a role in recyclability and which options exist to quantify this. Future work will involve further refinement using realistic case studies as well as complex processes such as reactive extrusion.

Author Contributions

Conceptualization, P.N., A.P., P.D.M. and P.B.; methodology, P.N. and A.P.; software, P.N., A.P., P.B.; validation, P.N., A.P. and P.B.; formal analysis, P.N., A.P. and P.B.; investigation, P.N. and P.B.; writing—original draft preparation, P.N. and P.B.; writing—review and editing, P.N., A.P., P.D.M., D.R.D., P.H.M.V.S., H.R. and P.B.; visualization, P.N.; supervision, H.R. and P.B. All authors have read and agreed to the published version of the manuscript.

Funding

This research received no external funding.

Data Availability Statement

Data is contained within the article.

Conflicts of Interest

The authors declare no conflict of interest.

References

  1. MMAtwo Project. Available online: https://www.mmatwo.eu/ (accessed on 11 February 2021).
  2. CIRC-PACK Project. Available online: https://www.circpack.eu/ (accessed on 11 February 2021).
  3. iCAREPLAST Project. Available online: https://www.icareplast.eu/ (accessed on 11 February 2021).
  4. MultiCycle Project. Available online: http://multicycle-project.eu/ (accessed on 11 February 2021).
  5. PlastiCircle Project. Available online: https://www.plasticircle.eu/ (accessed on 11 February 2021).
  6. PolyCE Project. Available online: https://www.polyce-project.eu/ (accessed on 11 February 2021).
  7. PolynSPIRE Project. Available online: https://www.polynspire.eu/ (accessed on 11 February 2021).
  8. ResolVe Project. Available online: https://depolymerisation.com/ (accessed on 11 February 2021).
  9. PLASTECO Project. Available online: https://www.interregeurope.eu/plasteco/ (accessed on 11 February 2021).
  10. BIOCOMPACK-CE Project. Available online: https://www.interreg-central.eu/Content.Node/BIOCOMPACK-CE.html (accessed on 11 February 2021).
  11. MATTER Project. Available online: https://catalisti.be/project/sidestream-valorization/matter/ (accessed on 11 February 2021).
  12. P2PC Project. Available online: https://catalisti.be/project/sidestream-valorization/p2pc/ (accessed on 11 February 2021).
  13. European Commission. Communication from the Commission to the European Parliament, the Council, the European Economic and Social Committee and the Committee of the Regions A European Strategy for Plastics in a Circular Economy; COM/2018/028 final; European Commission: Brussels, Belgium, 2018. [Google Scholar]
  14. European Commission. Directive (EU) 2019/904 of the European Parliament and of the Council. On the Reduction of the Impact of Certain Plastic Products on the Environment; European Commission: Brussels, Belgium, 2019. [Google Scholar]
  15. Gall, M.; Schweighuber, A.; Buchberger, W.; W Lang, R. Plastic Bottle Cap Recycling—Characterization of Recyclate Composition and Opportunities for Design for Circularity. Sustainability 2020, 12, 378. [Google Scholar] [CrossRef]
  16. Peeters, J.R.; Vanegas, P.; Dewulf, W.; Duflou, J.R. Economic and environmental evaluation of design for active disassembly. J. Clean. Prod. 2017, 140, 1182–1193. [Google Scholar] [CrossRef] [Green Version]
  17. Vanegas, P.; Peeters, J.R.; Cattrysse, D.; Tecchio, P.; Ardente, F.; Mathieux, F.; Dewulf, W.; Duflou, J.R. Ease of disassembly of products to support circular economy strategies. Resour. Conserv. Recycl. 2018, 135, 323–334. [Google Scholar] [CrossRef] [PubMed]
  18. Radusin, T.; Nilsen, J.; Larsen, S.; Annfinsen, S.; Waag, C.; Eikeland, M.S.; Pettersen, M.K.; Fredriksen, S.B. Use of recycled materials as mid layer in three layered structures-new possibility in design for recycling. J. Clean. Prod. 2020, 259, 120876. [Google Scholar] [CrossRef]
  19. Ragaert, K.; Hubo, S.; Delva, L.; Veelaert, L.; Du Bois, E. Upcycling of contaminated post-industrial polypropylene waste: A design from recycling case study. Polym. Eng. Sci. 2018, 58, 528–534. [Google Scholar] [CrossRef]
  20. Gradus, R. Postcollection Separation of Plastic Recycling and Design-For-Recycling as Solutions to Low Cost-Effectiveness and Plastic Debris. Sustainability 2020, 12, 8415. [Google Scholar] [CrossRef]
  21. Buyle, M.; Audenaert, A.; Billen, P.; Boonen, K.; Van Passel, S. The Future of Ex-Ante LCA? Lessons Learned and Practical Recommendations. Sustainability 2019, 11, 5456. [Google Scholar] [CrossRef] [Green Version]
  22. Faraca, G.; Martinez-Sanchez, V.; Astrup, T.F. Environmental life cycle cost assessment: Recycling of hard plastic waste collected at Danish recycling centres. Resour. Conserv. Recycl. 2019, 143, 299–309. [Google Scholar] [CrossRef]
  23. Foschi, E.; Zanni, S.; Bonoli, A. Combining Eco-Design and LCA as Decision-Making Process to Prevent Plastics in Packaging Application. Sustainability 2020, 12, 9738. [Google Scholar] [CrossRef]
  24. Eriksen, M.; Christiansen, J.; Daugaard, A.; Astrup, T. Closing the loop for PET, PE and PP waste from households: Influence of material properties and product design for plastic recycling. Waste Manag. 2019, 96, 75–85. [Google Scholar] [CrossRef]
  25. Fiorio, R.; D’hooge, D.R.; Ragaert, K.; Cardon, L. A Statistical Analysis on the Effect of Antioxidants on the Thermal-Oxidative Stability of Commercial Mass- and Emulsion-Polymerized ABS. Polymers 2019, 11, 25. [Google Scholar] [CrossRef] [PubMed] [Green Version]
  26. Paletta, A.; Leal Filho, W.; Balogun, A.L.; Foschi, E.; Bonoli, A. Barriers and challenges to plastics valorisation in the context of a circular economy: Case studies from Italy. J. Clean. Prod. 2019, 241, 118149. [Google Scholar] [CrossRef]
  27. Alassali, A.; Barouta, D.; Tirion, H.; Moldt, Y.; Kuchta, K. Towards a high quality recycling of plastics from waste electrical and electronic equipment through separation of contaminated fractions. J. Hazard. Mater. 2020, 387, 121741. [Google Scholar] [CrossRef] [PubMed]
  28. Rechberger, H.; Brunner, P.H. A New, Entropy Based Method To Support Waste and Resource Management Decisions. Environ. Sci. Technol. 2002, 36, 809–816. [Google Scholar] [CrossRef] [PubMed]
  29. Rechberger, H.; Graedel, T. The contemporary European copper cycle: Statistical entropy analysis. Ecol. Econ. 2002, 42, 59–72. [Google Scholar] [CrossRef]
  30. Yue, Q.; Lu, Z.; Zhi, S. Copper cycle in China and its entropy analysis. Resour. Conserv. Recycl. 2009, 53, 680–687. [Google Scholar] [CrossRef]
  31. Laner, D.; Zoboli, O.; Rechberger, H. Statistical entropy analysis to evaluate resource efficiency: Phosphorus use in Austria. Ecol. Indic. 2017, 83, 232–242. [Google Scholar] [CrossRef]
  32. Zeng, X.; Li, J. Measuring the recyclability of e-waste: An innovative method and its implications. J. Clean. Prod. 2016, 131, 156–162. [Google Scholar] [CrossRef]
  33. Velázquez Martínez, O.; Van Den Boogaart, K.; Lundström, M.; Santasalo-Aarnio, A.; Reuter, M.; Serna-Guerrero, R. Statistical entropy analysis as tool for circular economy: Proof of concept by optimizing a lithium-ion battery waste sieving system. J. Clean. Prod. 2019, 212, 1568–1579. [Google Scholar] [CrossRef]
  34. Wang, X.; Miao, J.; You, S.; Ren, N. Statistical entropy analysis as a proxy method for quantitative evaluation of phosphorus of a food-based bioethanol system. Resour. Conserv. Recycl. 2021, 164, 105125. [Google Scholar] [CrossRef]
  35. Parchomenko, A.; Nelen, D.; Gillabel, J.; Vrancken, K.C.; Rechberger, H. Evaluation of the resource effectiveness of circular economy strategies through multilevel Statistical Entropy Analysis. Resour. Conserv. Recycl. 2020, 161, 104925. [Google Scholar] [CrossRef]
  36. Roithner, C.; Rechberger, H. Implementing the dimension of quality into the conventional quantitative definition of recycling rates. Waste Manag. 2020, 105, 586–593. [Google Scholar] [CrossRef] [PubMed]
  37. Roosen, M.; Mys, N.; Kusenberg, M.; Billen, P.; Dumoulin, A.; Dewulf, J.; Van Geem, K.M.; Ragaert, K.; De Meester, S. Detailed Analysis of the Composition of Selected Plastic Packaging Waste Products and Its Implications for Mechanical and Thermochemical Recycling. Environ. Sci. Technol. 2020, 54, 13282–13293. [Google Scholar] [CrossRef] [PubMed]
  38. Kleinhans, K.; Hallemans, M.; Huysveld, S.; Thomassen, G.; Ragaert, K.; Van Geem, K.M.; Roosen, M.; Mys, N.; Dewulf, J.; De Meester, S. Development and application of a predictive modelling approach for household packaging waste flows in sorting facilities. Waste Manag. 2021, 120, 290–302. [Google Scholar] [CrossRef] [PubMed]
  39. Shannon, C. A mathematical theory of communication, I and II. Bell Syst. Tech. J. 1948, 27, 379–423. [Google Scholar] [CrossRef] [Green Version]
  40. Shannon, C. A mathematical theory of communication, III–V. Bell Syst. Tech. J. 1948, 27, 623–656. [Google Scholar] [CrossRef]
  41. Shannon, C.; Weaver, W. The Mathematical Theory of Communication, 7th ed.; University of Illinois Press: Urbana, IL, USA, 1949. [Google Scholar]
  42. Rechberger, H. Entwicklung einer Methode zur Bewertung von Stoffbilanzen in der Abfallwirtschaft. Ph.D. Thesis, TU Wien, Vienna, Austria, 1999. [Google Scholar]
  43. Walker, T.W.; Frelka, N.; Shen, Z.; Chew, A.K.; Banick, J.; Grey, S.; Kim, M.S.; Dumesic, J.A.; Van Lehn, R.C.; Huber, G.W. Recycling of multilayer plastic packaging materials by solvent-targeted recovery and precipitation. Sci. Adv. 2020, 6. [Google Scholar] [CrossRef]
  44. Ügdüler, S.; De Somer, T.; Van Geem, K.M.; Roosen, M.; Kulawig, A.; Leineweber, R.; De Meester, S. Towards a better understanding of delamination of multilayer flexible packaging films by carboxylic acids. ChemSusChem 2021. [Google Scholar] [CrossRef]
  45. Ügdüler, S.; Van Geem, K.M.; Denolf, R.; Roosen, M.; Mys, N.; Ragaert, K.; De Meester, S. Towards closed-loop recycling of multilayer and coloured PET plastic waste by alkaline hydrolysis. Green Chem. 2020, 22, 5376–5394. [Google Scholar] [CrossRef]
  46. Maga, D.; Hiebel, M.; Thonemann, N. Life cycle assessment of recycling options for polylactic acid. Resour. Conserv. Recycl. 2019, 149, 86–96. [Google Scholar] [CrossRef]
  47. Gleick, P.; Cooley, H.S. Energy implications of bottled water. Environ. Res. Lett. 2009, 4, 014009. [Google Scholar] [CrossRef]
  48. Boustead, I. Eco-profiles of the European Plastics Industry: High density polyethylene (HDPE). PlasticsEurope 2005. [Google Scholar]
  49. Guo, Q.; Crittenden, J. An energy analysis of polylactic acid (PLA) produced from corn grain and corn stover integrated system. In Proceedings of the 2011 IEEE International Symposium on Sustainable Systems and Technology, Chicago, IL, USA, 16–18 May 2011; pp. 1–5. [Google Scholar] [CrossRef]
  50. Ragaert, K.; Delva, L.; Van Geem, K. Mechanical and chemical recycling of solid plastic waste. Waste Manag. 2017, 69, 24–58. [Google Scholar] [CrossRef]
  51. Kaiser, K.; Schmid, M.; Schlummer, M. Recycling of Polymer-Based Multilayer Packaging: A Review. Recycling 2018, 3, 1. [Google Scholar] [CrossRef] [Green Version]
  52. Moad, G. The synthesis of polyolefin graft copolymers by reactive extrusion. Prog. Polym. Sci. 1999, 24, 81–142. [Google Scholar] [CrossRef]
  53. Hernández-Ortiz, J.C.; Van Steenberge, P.H.M.; Duchateau, J.N.E.; Toloza, C.; Schreurs, F.; Reyniers, M.F.; Marin, G.B.; D’hooge, D.R. The Relevance of Multi-Injection and Temperature Profiles to Design Multi-Phase Reactive Processing of Polyolefins. Macromol. Theory Simul. 2019, 28, 1900035. [Google Scholar] [CrossRef]
  54. Wang, S.; Daelemans, L.; Fiorio, R.; Gou, M.; D’hooge, D.R.; De Clerck, K.; Cardon, L. Improving Mechanical Properties for Extrusion-Based Additive Manufacturing of Poly(Lactic Acid) by Annealing and Blending with Poly(3-Hydroxybutyrate). Polymers 2019, 11, 1529. [Google Scholar] [CrossRef] [Green Version]
  55. Thomassen, G.; Van Dael, M.; You, F.; Van Passel, S. A multi-objective optimization-extended techno-economic assessment: Exploring the optimal microalgal-based value chain. Green Chem. 2019, 21, 5945–5959. [Google Scholar] [CrossRef]
Figure 1. Illustration of the conceptual fictitious plastic bag example.
Sustainability 13 03553 g001
Figure 2. Illustration of the counter example, also a conceptual fictitious plastic bag.
Sustainability 13 03553 g002
Figure 3. Conceptual representation of the decomposition energies for the counter example. For the sake of completeness, the decomposition energy from a material k to its substances i, denoted by E k m ( π , η i m ) , has also been depicted.
Sustainability 13 03553 g003
Figure 4. Illustration of the plastic waste collection bag filled with plastic bottles.
Sustainability 13 03553 g004
Table 1. Substance-level statistical entropy entries for the fictitious plastic bag example, with Π c 1 = m i , c 1 c i , c 1 log 2 c i , c 1 and Π c 2 = m i , c 2 c i , c 2 log 2 c i , c 2 . In bold are the resulting substance level relative statistical entropies.
m i , c 1 c i , c 1 log 2 c i , c 1 Π c 1 m i , c 2 c i , c 2 log 2 c i , c 2 Π c 2 H i H m a x i H r e l i
A1.5150.12−3.0590.5562.7270.3−1.7371.4211.9772.0850.948
B0.7140.68−0.5560.2701.2860.4−1.3220.6800.95010.950
C1.610.08−3.6440.4702.9030.3−1.7371.5131.9832.1750.912
D8.330.12−3.0593.059150003.0594.5440.673
Table 2. Component-level statistical entropy entries and value for the fictitious plastic bag example.
c i , n m n c log 2 c i , n m n c c i , n log 2 c i , n H n , rel c
c A , 1 0.120.357−3.0590.131
c B , 1 0.680.357−0.5560.135
c C , 1 0.080.357−3.6440.104
c D , 1 0.120.357−3.0590.131
H 1 c 0.5010.301
c A , 2 0.30.643−1.7370.335
c B , 2 0.40.643−1.3220.340
c C , 2 0.30.643−1.7370.335
c D , 2 00.64300
H 2 c 1.0100.606
Table 3. Component-level statistical entropy entries and value for the counter example.
c i , n m n c log 2 c i , n m n c c i , n log 2 c i , n H n , rel c
c A , 1 0.3000.500−1.7370.261
c B , 1 0.4000.500−1.3220.264
c C , 1 0.3000.500−1.7370.261
H 1 c 0.7850.500
c A , 2 0.3000.500−1.7370.261
c B , 2 0.4000.500−1.3220.264
c C , 2 0.3000.500−1.7370.261
H 2 c 0.7850.500
Table 4. Values of the recyclability metrics and difference between the recyclability metrics for the monolayer and multilayer components in the counter example.
R n ( 1 ) R n ( 2 )
Monolayer0.49554.2
Multilayer0.49229.9
Monolayer–Multilayer0.00324.3
Table 5. Concentrations of substances in the components and product for plastic waste collection bag filled with plastic bottles.
PETPEPLAX
ComponentsMonolayer bottle (PLA)0.80.050.1450.005
Monolayer bottle (PE)0.80.1450.050.005
Multilayer bottle (PLA and PE)0.80.09750.09750.005
ProductBlue bag0.80.09750.09750.005
Table 6. Concentrations of materials in the components and the concentrations of the components in the product for the plastic waste collection bag filled with plastic bottles.
Bottle CapMonolayer Label (PLA)Bottle MaterialMultilayer LabelMonolayer Label (PE)Mass Fraction in Product
Monolayer bottle (PLA)0.10.10.8000.25
Monolayer bottle (PE)0.100.800.10.25
Multilayer bottle (PLA and PE)0.100.80.100.5
Table 7. Component-level and product-level relative statistical entropies for the plastic waste collection bag filled with plastic bottles.
Relative Statistical Entropy
Monolayer bottle (PLA)0.241
Monolayer bottle (PE)0.241
Multilayer bottle (PLA and PE)0.5
Plastic bag (product)0.488
Table 8. Concentrations and masses of substances in the product for the first variation of the plastic waste collection bag (filled with four monolayer PLA bottles and four multilayer bottles.
PETPEPLAX
Concentration (-)0.80.0740.1210.005
Mass (kg)0.160.0150.0240.001
Table 9. Values of the recyclability metrics and difference between the recyclability metrics for the first variation of the plastic waste collection bag (filled with four monolayer PLA bottles and four multilayer bottles.
R n ( 1 ) R n ( 2 )
Monolayer PLA bottle0.51059.8
Multilayer bottle0.49153.4
Monolayer PLA bottle—Multilayer bottle0.0196.4
Publisher’s Note: MDPI stays neutral with regard to jurisdictional claims in published maps and institutional affiliations.

