Article

Analysis of the Adaptative Strategy of Cirsium vulgare (Savi) Ten. in the Colonization of New Territories

by
Jhony Fernando Cruz Román
1,
Ricardo Enrique Hernández-Lambraño
1,2,
David Rodríguez de la Cruz
1,2 and
José Ángel Sánchez Agudo
1,2,*
1
Departamento de Botánica y Fisiología Vegetal, Área de Botánica, Universidad de Salamanca, Campus Miguel de Unamuno s/n, E-37007 Salamanca, Spain
2
Grupo de Investigación en Biodiversidad, Diversidad Humana y Biología de la Conservación, Universidad de Salamanca, Campus Miguel de Unamuno s/n, E-37007 Salamanca, Spain
*
Author to whom correspondence should be addressed.
Sustainability 2021, 13(4), 2384; https://doi.org/10.3390/su13042384
Submission received: 15 January 2021 / Revised: 17 February 2021 / Accepted: 18 February 2021 / Published: 23 February 2021

Abstract

:
The current situation of global environmental degradation as a result of anthropogenic activities makes it necessary to open new research lines focused on the causes and effects of the main alterations caused in the ecosystems. One of the most relevant is how the niche dynamics of invasive species change between different geographical areas, since its understanding is key to the early detection and control of future invasions. In this regard, we analyzed the distribution pattern of Cirsium vulgare (Savi) Ten., a plant of the Asteraceae family originally from the Eurasian region that currently invades wide areas of the world. We estimated its niche shifts between continents using a combination of principal components analysis (PCA) and Ecological Niche Modelling (ENM) on an extensive set of data on global presences of its native and invaded ranges from Global Biodiversity Information Facility (GBIF). A set of bioclimatic variables and the Human Footprint (HFP) with a resolution of 10 km were selected for this purpose. Our results showed that the species has a marked global trend to expand toward warmer climates with less seasonality, although in some regions its invasiveness appears to be less than in others. The models had a good statistical performance and high coherence in relation to the known distribution of the species and allowed us to establish the relative weight of the contribution of each variable used, with the annual temperature and seasonality being the determining factors in the establishment of the species. Likewise, the use of non-climatic variable HFP has provided relevant information to explain the colonizing behavior of the species. The combination of this methodology with an adequate selection of predictor variables represents a very useful tool when focusing efforts and resources for the management of invasive species.

1. Introduction

Globalization, with its intense commercial activity of nations around the world, implies a massive flow of transportation of goods, people, and others from one territory to another. All the processes carried out in these movements involve strong environmental consequences such as the emission of pollutants, global warming, changes in land use, destruction of habitat, and landscape fragmentation [1,2,3]. No less important is the spread of some species with high colonizing capacity that give rise to biological invasions, which is considered to be one of the phenomena responsible for the planet’s loss of biodiversity [4,5]. Although a large number of species can be transported voluntarily or involuntarily from their natural habitats to other territories [6], the majority do not survive because they do not adapt to new ecological conditions. Some of them become naturalized, coexisting in harmony with the native species, but a few are able to overcome adaptive barriers and become invasive, displacing native species and causing serious damage to the balance of the ecosystem [7,8,9]. Despite having more information available on biological invasions, we ignore the majority of the processes that drive the dispersion of invasive species and the changes between ranks (native and invaded) [10]. To anticipate the behavior of the translocated species, it is essential to identify these key factors to prioritize areas for the detection and control of early invasions. Once established, these invaders can cause serious environmental and socioeconomic disruption because of their eradication and control costs [11,12,13,14]. In that sense, prevention can be a practical, effective, and profitable management strategy [15]. New methodologies for managing future ecological problems have been developed on the basis of advances in Geographic Information Systems (GIS) [16]. Ecological niche models (ENMs) are one of the newest tools for spatial ecological analysis, consisting of the correlation of species presence/absences or just presences with a background and predefined environmental variables (usually geographical, environmental, or topographical). The approach of these models is based on Hutchison’s duality hypothesis, which means that these models are developed in two spaces: The geographical (two-dimensional) and the environmental–ecological (multidimensional) [17,18,19].
Hutchinson [20] differentiated two types of niches: (1) Fundamental, which consists of all the optimal biotic and abiotic conditions where a species can achieve its development and subsistence; and (2) realized or observed, which is restricted to the environments where the species is effectively found due to certain biotic interactions. To carry out the modelling process, it is necessary to use an algorithm that contains all the statistical processes to conduct the spatial information. Due to its efficiency and practicality, “MaxEnt” [21], an algorithm based on the principle of Maximum Entropy, is one of the most commonly used [10,22,23]. One of the main advantages of this software is that it is able to work only with presence data as it uses a self-generated background to match them with the environmental variables [10,21,24]. Another noteworthy feature of this algorithm is that it can be used to build models with robust results with a few points of the species’ presence [21,24].
The main approach to investigating climatic niches in space and time has been to analyze climatic conditions across a species’ distribution ranges over time [25]. One of the assumptions underlying the ENM is the principle of ecological niche conservation, which suggests that most species tend to conserve their ecological requirements in native and invaded ranges [26,27]. However, this approach has been refuted by some authors, including the authors of [21,22,23,28,29], who have concluded that, due to the complexity of the dynamics of biological invasions, species have a greater capacity to expand beyond their native environmental envelope than previously thought. Such niche shifts can be triggered by biotic factors, such as the absence of competitors and/or pathogens, evolutionary changes due to genetic drift, or other natural selection in the invaded range [30,31].
The relative weight of factors implicit in the dynamics of niche shift can be evaluated with metrics based primarily on observing the displacement of a niche centroid generated from environmental data from the combined ranges subjected to a principal component analysis (PCA) [29]. The most commonly used metrics for measuring centroid displacement are: (1) Expansion, which measures the proportion of the displacement in the species ecological centroid to new environmental features in the invaded range due to rapid adaptative evolution and/or biotic interactions; and (2) unfilling, which measures the proportion of ecological niche that is suitable for the development of the species. The unfilling metric provides a first approach to determine possible areas of future invasion of a species [29,32].
The present work delves into this hypothesis of niche shift across territories of the world using the species Spear thistle (Cirsium vulgare (Savi) Ten.). C. vulgare, which is considered one of the most prolific invasive species in the world. It is native to Eurasia and is naturalized in several countries, spreading to all continents except Antarctica [33,34,35]. This species represents a serious threat in protected areas and biodiversity sanctuaries worldwide. Different types of control methods have been implemented, ranging from mechanical removal and application of chemical agents to biological control [36]. However, no direct strategy has been shown to be effective with C. vulgare. There is a need to develop alternatives based eminently on the abovementioned prevention measures to make it possible to anticipate their invasion, and these alternatives must be supported by science-based research such as the current study.
We tested the application of the methodologies described above using georeferenced presence data from the Global Biodiversity Information Facility (GBIF) platform in conjunction with an extensive literature review of the species’ distribution. Raster’s layers were downloaded from Chelsa repositories and resampled to 10 × 10 km. Parametrization was done according to previous works at regional different levels dealing with biological invasions [15,22,23,37].
The objective of this work is to test the application of specific ecoinformatics methodologies to explain and predict the adaptability to new environments of certain invasive species that are currently distributed on a global scale.

2. Materials and Methods

2.1. The Target Species: Cirsium vulgare (Savi) Ten. (Asteraceae)

Spear thistle (Cirsium vulgare (Savi) Ten.) is an herbaceous biennial or perennial plant, occasionally annual, thorny, erect, up to 2 m high. Its basal leaves form a rosette, and the plant produces 150 to 250 flowers with purple corollas. Its fruit is an achene [38]. Its native distribution is located in Eurasia and it is naturalized widely in many countries of the world [33,38]. C. vulgare has become an invasive plant that is difficult to eradicate mainly due to the high production and resistance of its seeds, its viable life form, and its sequential germination pattern [39]. The impact of the species on the native flora is quite notable, since it can form dense shrub populations that occupy all of the existing space, displacing other species. In particular, C. vulgare displaces smaller species by monopolizing the light capture and more efficiently extracting underground resources through its dense roots [38,40]. It is believed that this species appeared in North America in the colonial period and spread throughout the continent [35]. In Oceania (Tasmania), there are records from the 1830s, and it is possible that it was transported there from South Africa [41]. In temperate zones of South America, there is a permanent risk of invasion by this specie due to the accidental transport of contaminated agricultural products such as seeds or fodder or its deliberate introduction as an ornamental plant [41]. C. vulgare usually grows in sunny areas in well-irrigated soils with high nutrient concentrations [31,42].

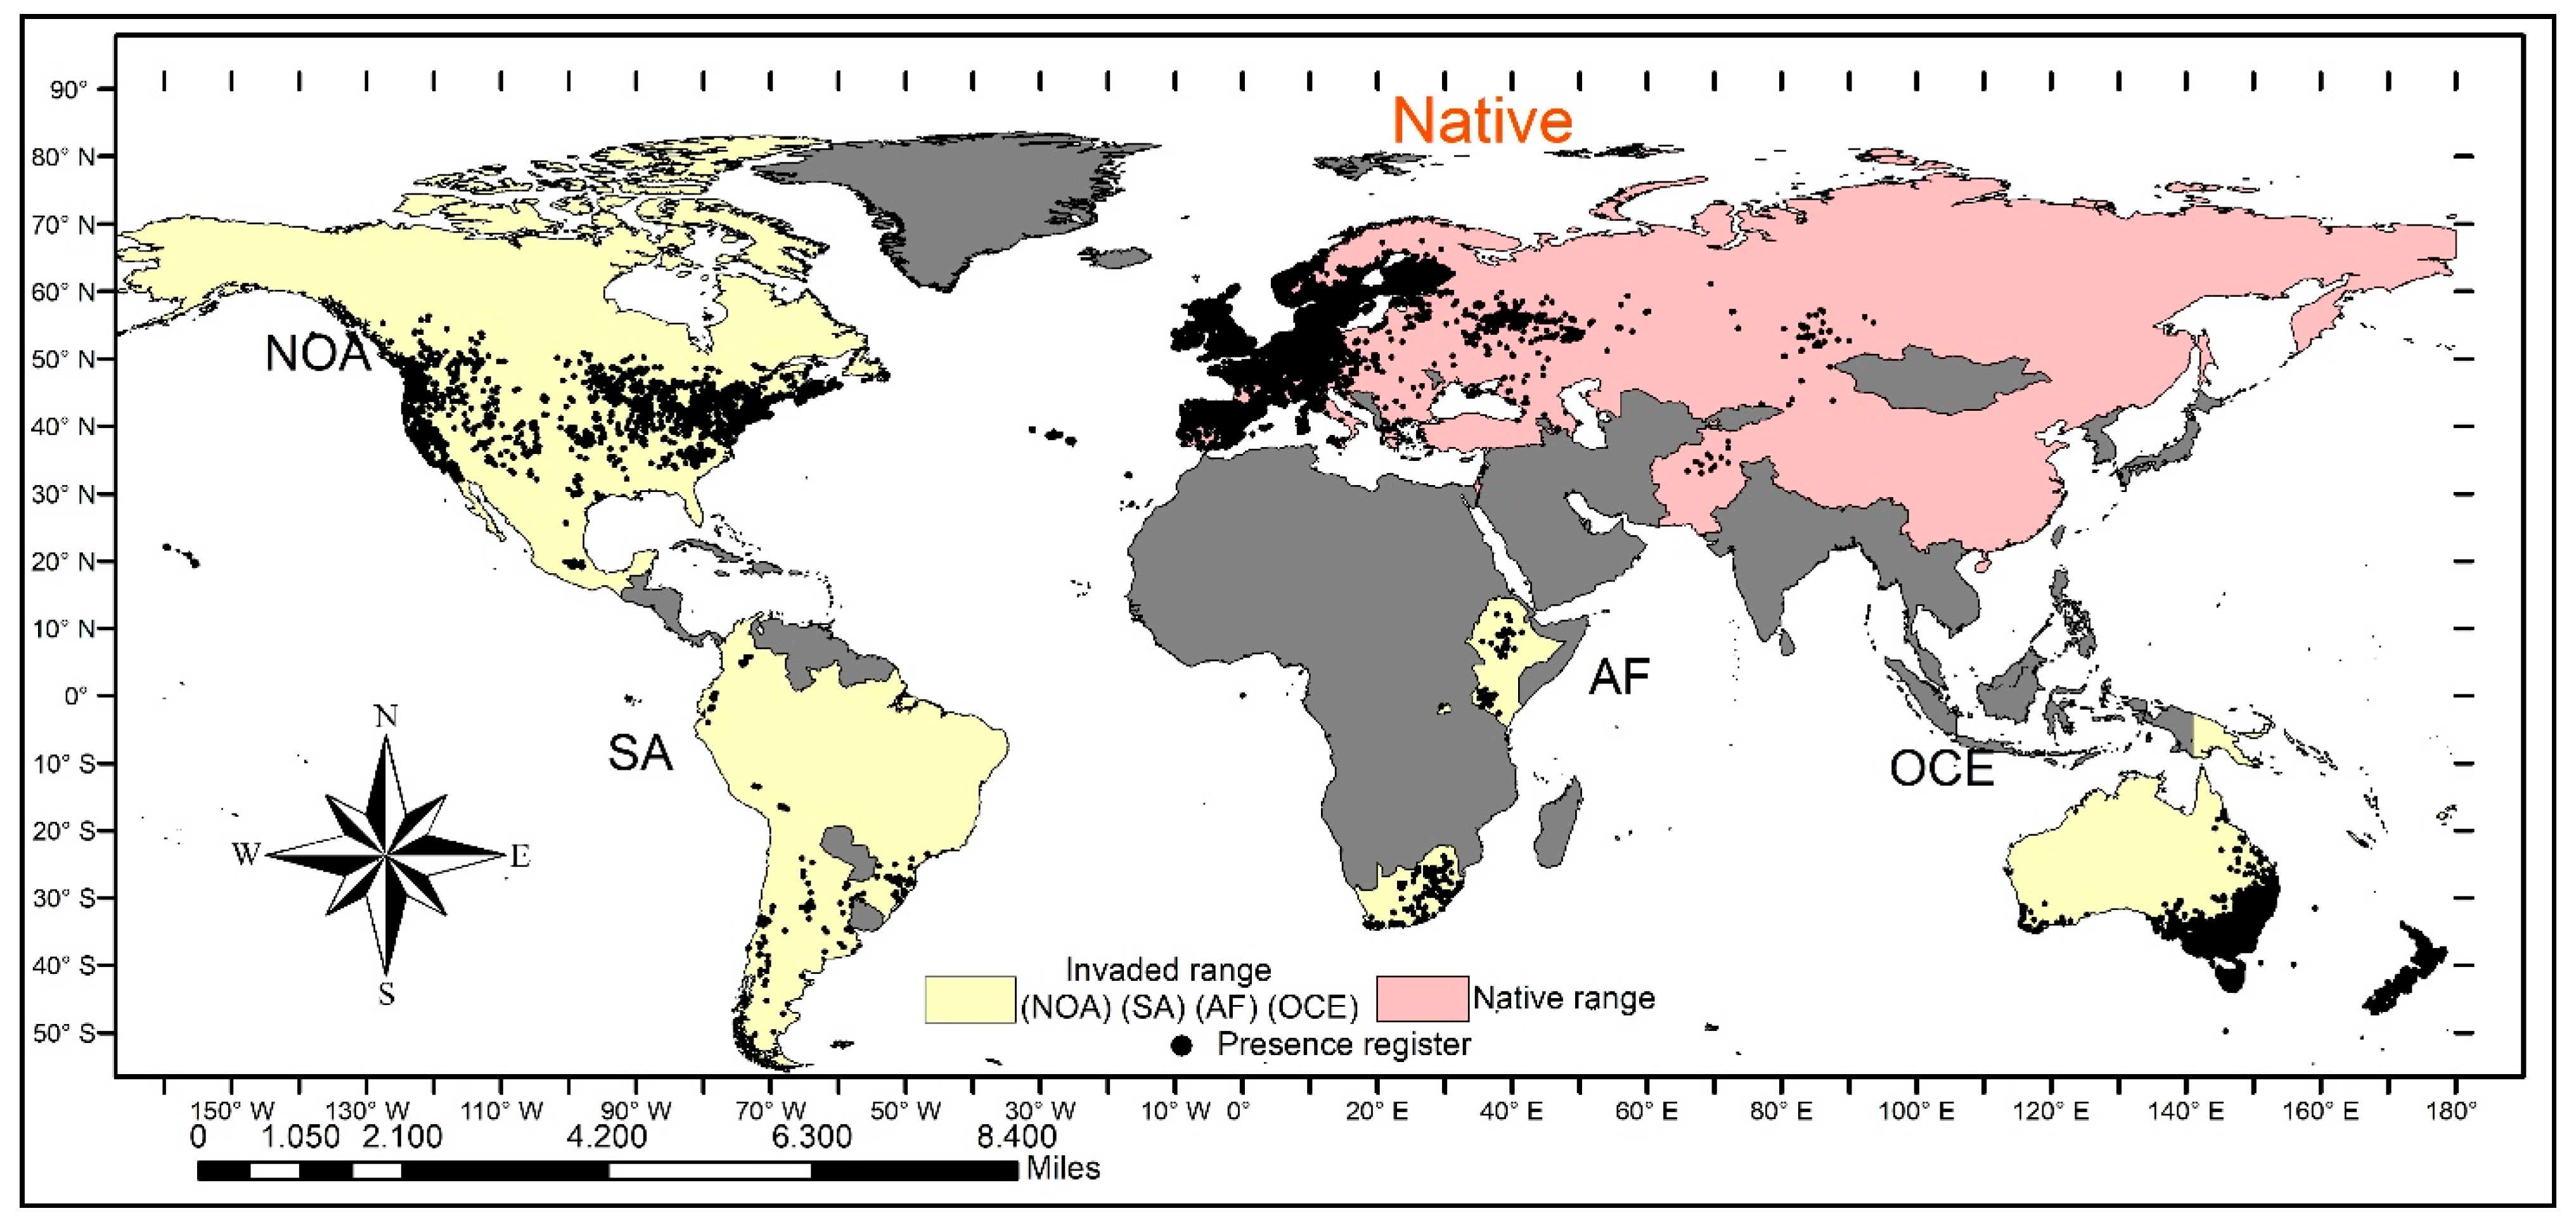
2.2. Occurrence Datasets

In the current study, 387,510 occurrence data from The Global Biodiversity Information Facility (www.gbif.org (accessed on: 3 April 2020)) were downloaded, processed, and filtered to eliminate incorrect, duplicate, or badly georeferenced citations, as well as to homogenize their resolutions. Thus, 10 × 10 km grids were generated in the geographical space to avoid bias [10]. Then, an exhaustive bibliographic review of the species was carried out, and the geographical ranges were established. We obtained 24,632 grids in the native range in Eurasia. For the invaded ranges, we obtained 2967 grids in North America, 176 in South America, 284 in Africa, and 7356 in Oceania (Figure 1).
The compiled database is the result of an extensive search of the occurrence of the species in the study area. Nevertheless, we acknowledge that this database may not represent the full range of environmental conditions in which the species can be found (e.g., other introduced areas) as in other studies elsewhere [10].

2.3. Environmental Variables

As potential predictors to characterize the species’ ecological niche, we used a set of variables related to climate and human influence (Table 1). Climatic variables (seasonal and annual patterns of temperature and precipitations) were available from climatology databases at high resolutions for the Earth’s land surface areas (CHELSA; http://chelsa-climate.org/ (accessed on: 5 April 2020)), which provides improved climatic estimates in landscapes with complex topography at 30 arc-seconds spatial resolutions (~1 km). Solar radiation was available from the WorldClim database (https://www.worldclim.org (accessed on: 5 April 2020)) at 30 arc-seconds spatial resolutions. Because of its effect on invasive species distribution, we included a variable related to human footprint on the landscape (https://wcshumanfootprint.org (accessed on: 5 April 2020)). This variable measures the cumulative impact of direct pressures on nature from human activities. It includes 8 inputs: The extent of built environments, crop land, pastureland, human population density, nighttime lights, railways, roads, and navigable waterways.
Finally, in order to avoid the cross-correlation within the selected environmental variables, a multicollinearity test was conducted using Pearson’s correlation coefficient [10] in R software [43]. Variables with cross-correlation coefficient values of r > ±0.75 were excluded. The final explanatory variables selected were: Annual mean temperature (Bio 1), temperature seasonality (Bio 4), annual precipitation (Bio 12), precipitation seasonality (Bio 15), standard deviance of radiation (Rad_sd), and Human Footprint (HFP). Variables were resampled to 10 km to optimize processing time using an interpolation bilinear resampling technique. All spatial information processing was handled using the Spatial Analyst Tool from ArcGIS 10.5 [44].

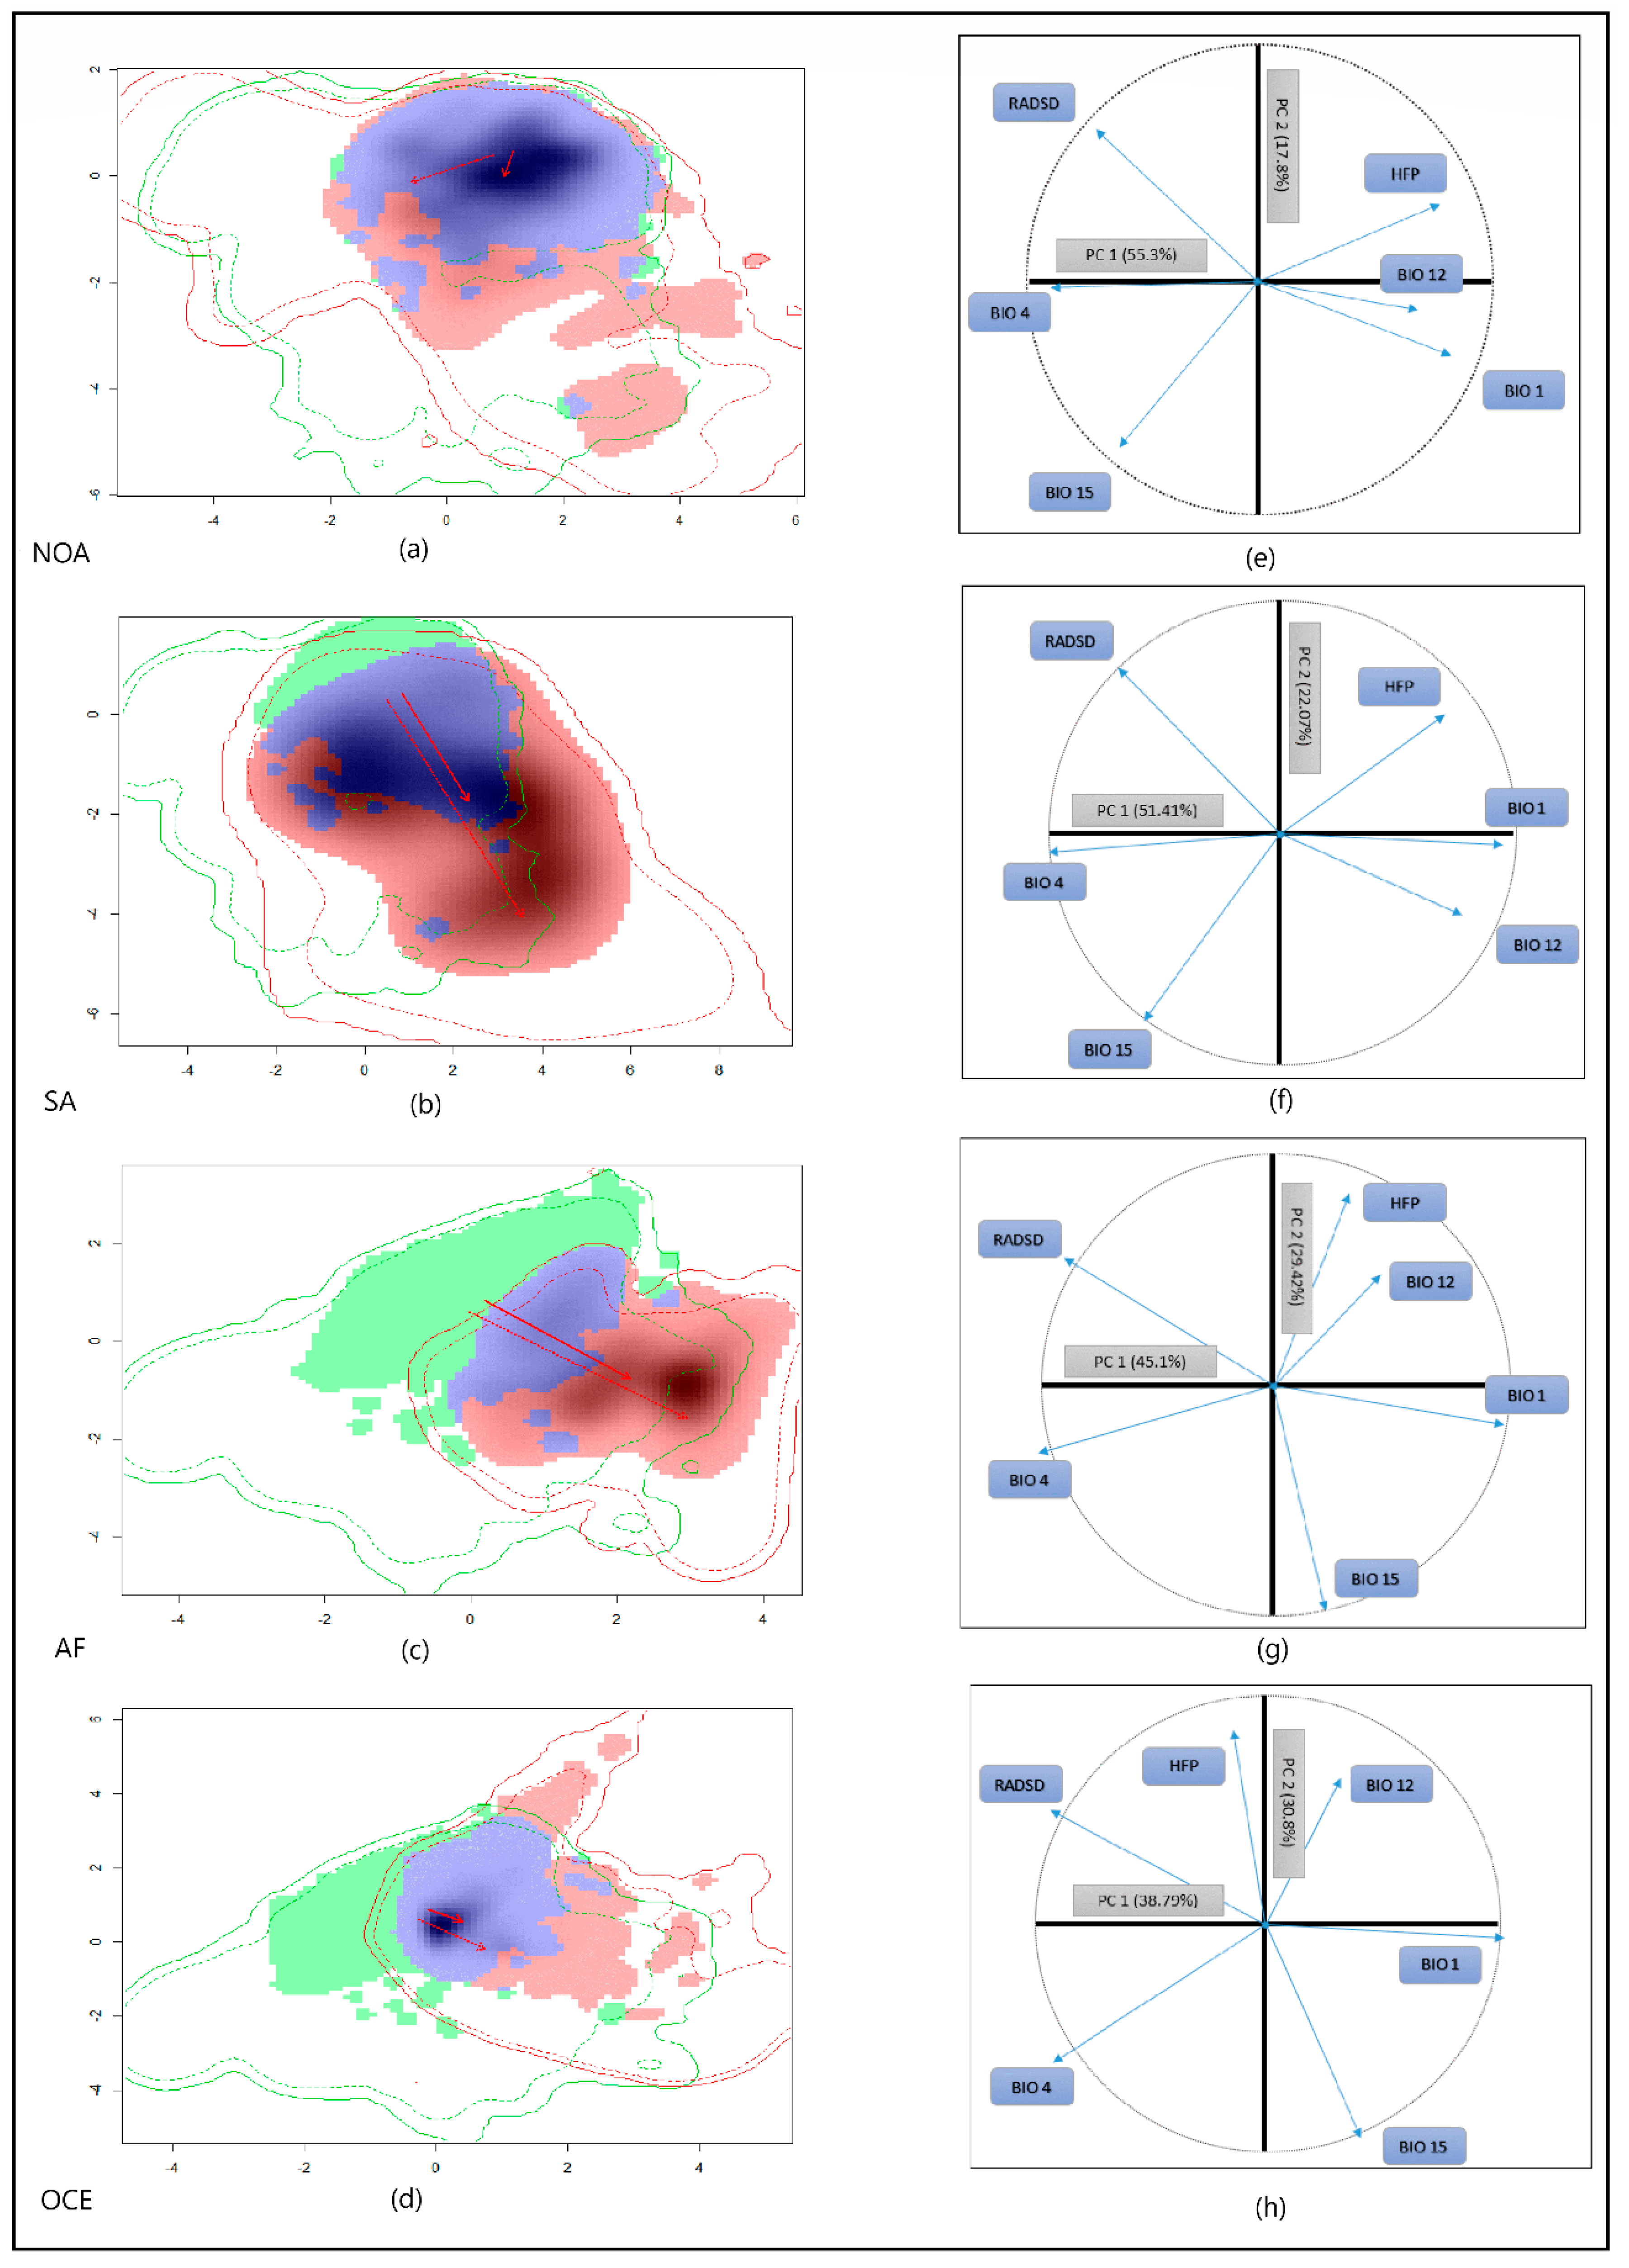
2.4. Niche Shift Measurement

The niche shift of C. vulgare was measured on the basis of the environmental species envelope represented by explanatory variables, which contain climatic and non-climatic factors (Table 1). The process consists of calibrating a PCA with the areas effectively occupied by the plant in its native and invaded ranges and the environmental conditions within the whole study area [21,22,32].
The process was carried out below the R-program software with the library “ecospat” [45]. First, we extracted the environmental conditions of the native range and the areas of the invaded range. Then, the PCA was calibrated, and the first 2 axes were taken into account for the analysis. Second, in order to avoid spatial bias, we divided the environmental space into 100 × 100 cells and transformed the data into densities [10]. Third, based on Schoener’s D metric (0 = totally different to 1 = complete overlap), we measured the proportion of native niche that does not overlap with the invaded niche, i.e., “unfilled,” and the proportion of invaded niche that does not overlap with the native niche or “expansion” [32]. In addition, in order to avoid bias, we used the 90th percentile of all environmental space and we compared it with the whole environmental extent. Fourth, the distribution of density and median environmental space in both ranges was calculated to determine the overall trend of ecological niche shift [21,22,32]. Fifth, we applied a niche equivalence test, that is, the correspondence between an observed and expected D, by randomly reassigning the occurrences of the native and invaded ranges. In this test, the null hypothesis (the niches are not identical) is rejected if p < 0.05. Also, we applied the niche similarity test, which compares the observed and expected D by randomly reassigning the occurrences in a single range. The value of p > 0.05 implies that the niches are not more similar than expected by chance [22].

2.5. Reciprocal Ecological Niche Models: Calibration and Evaluation
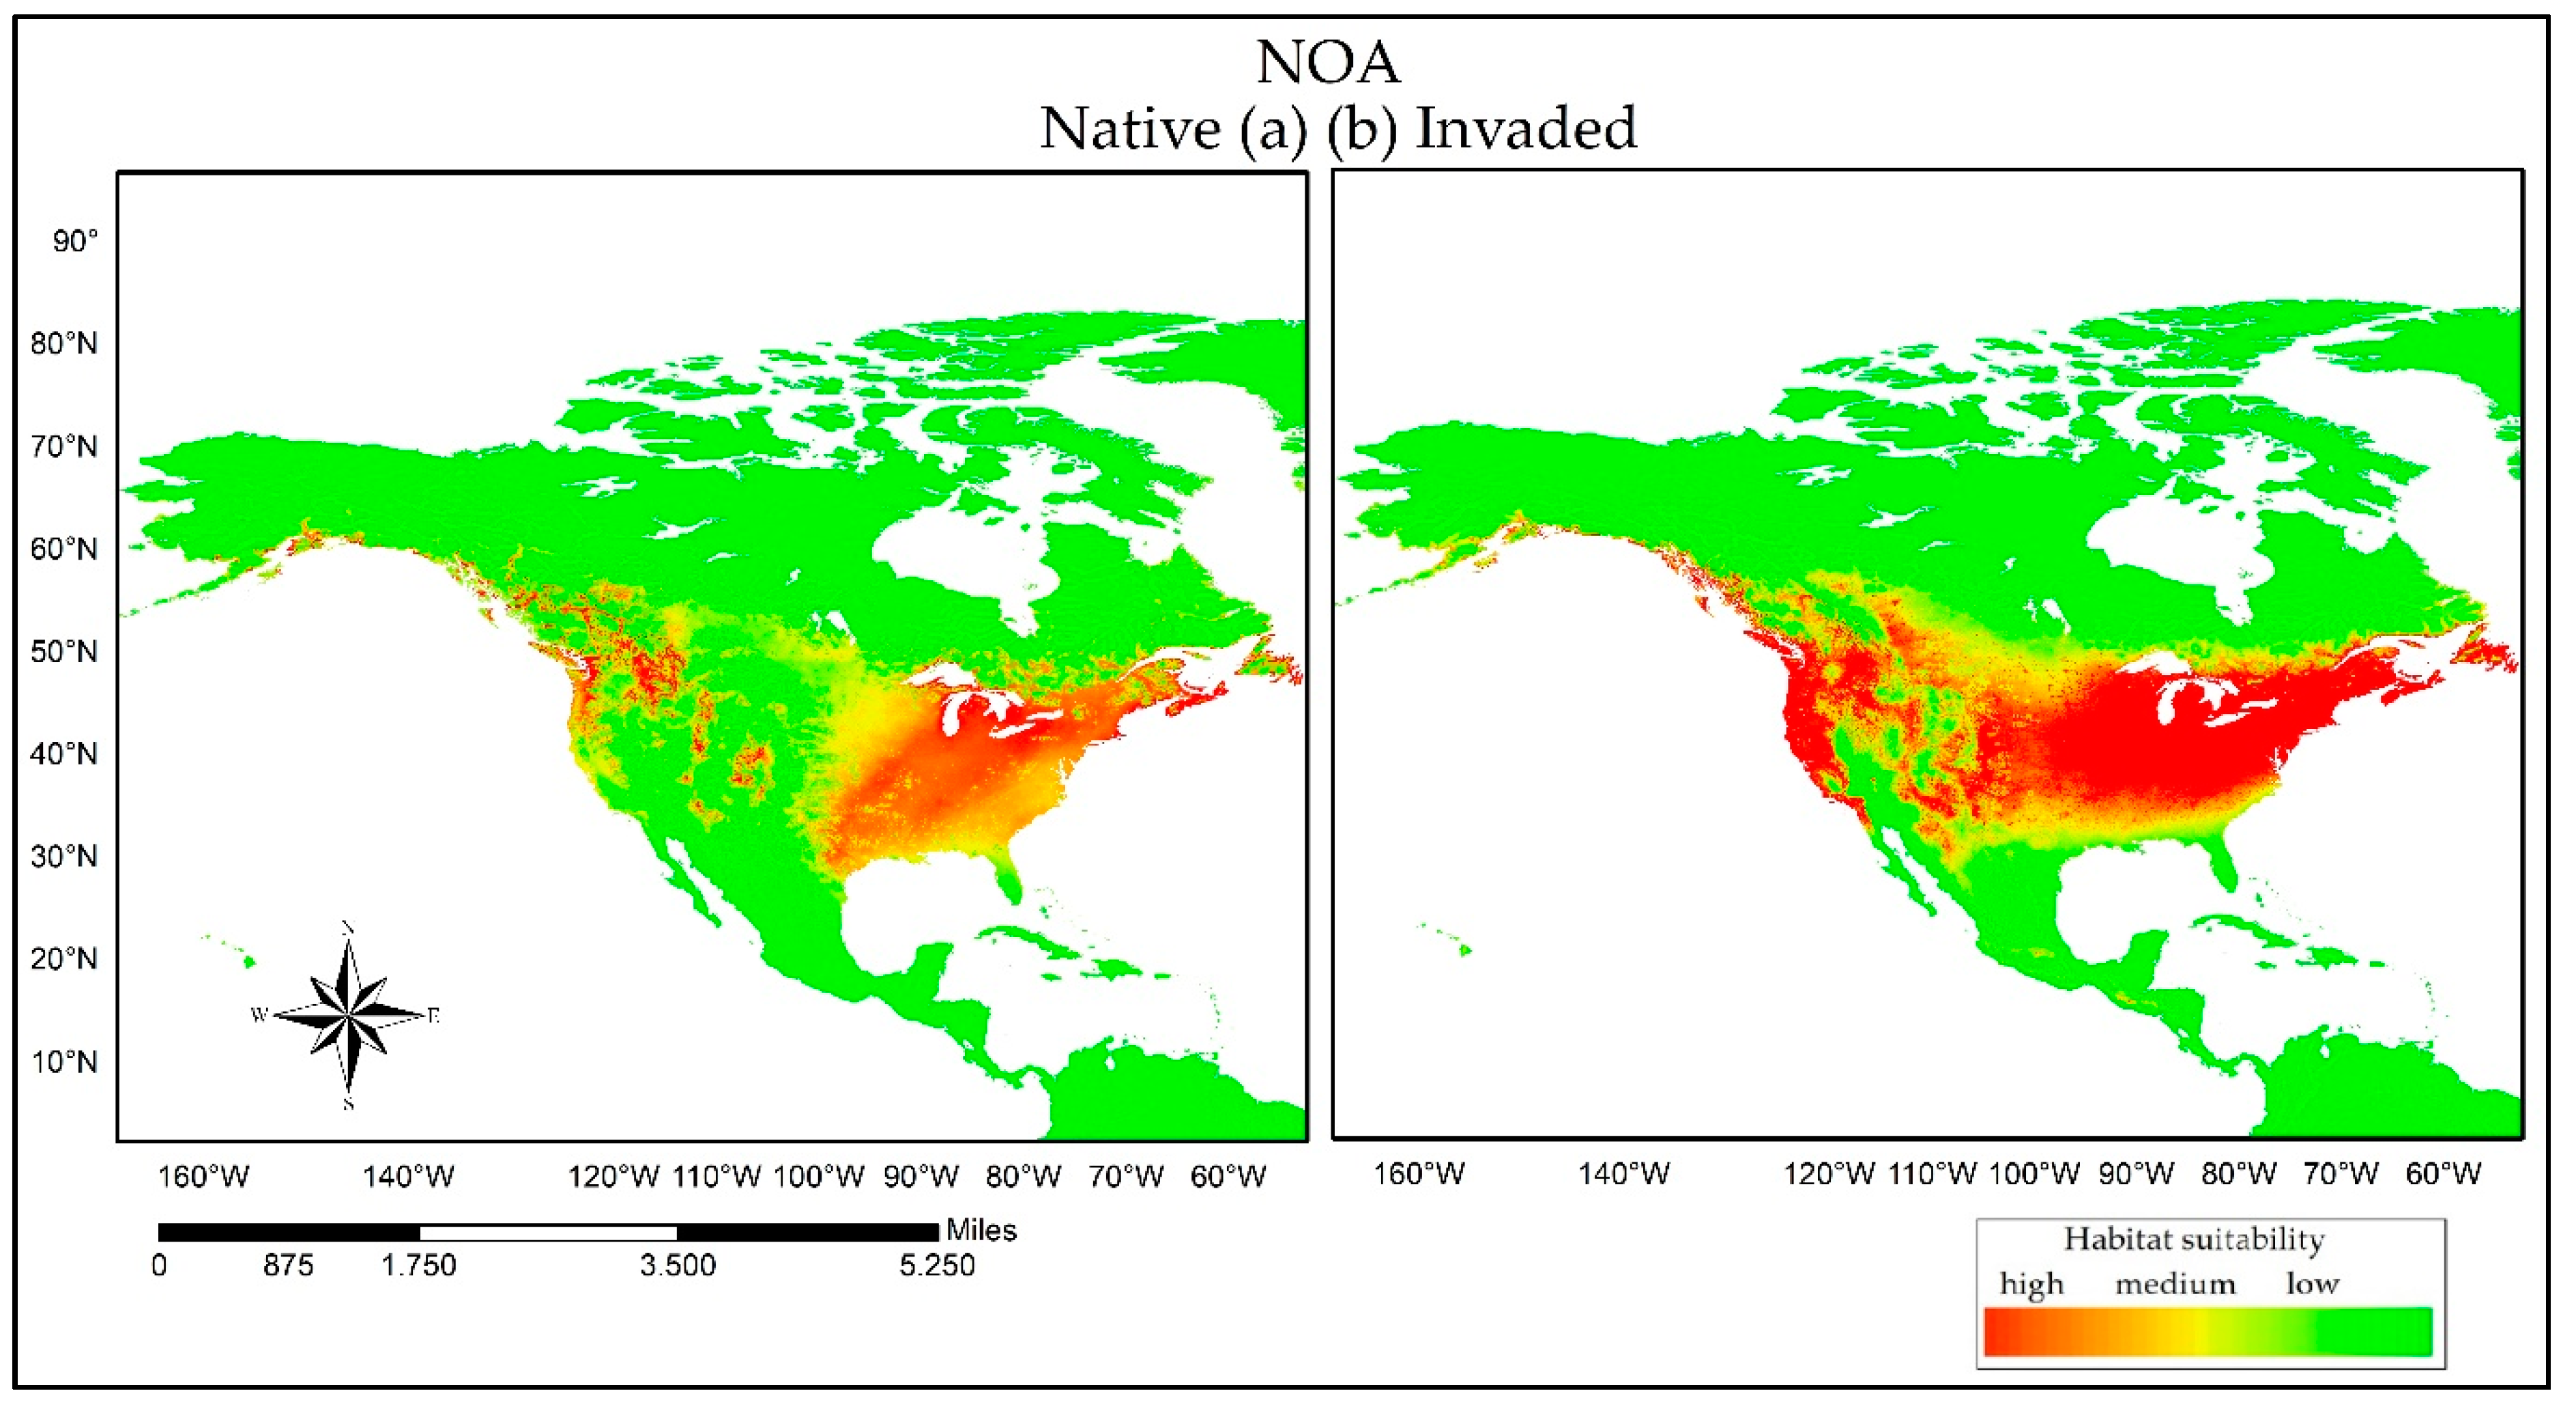
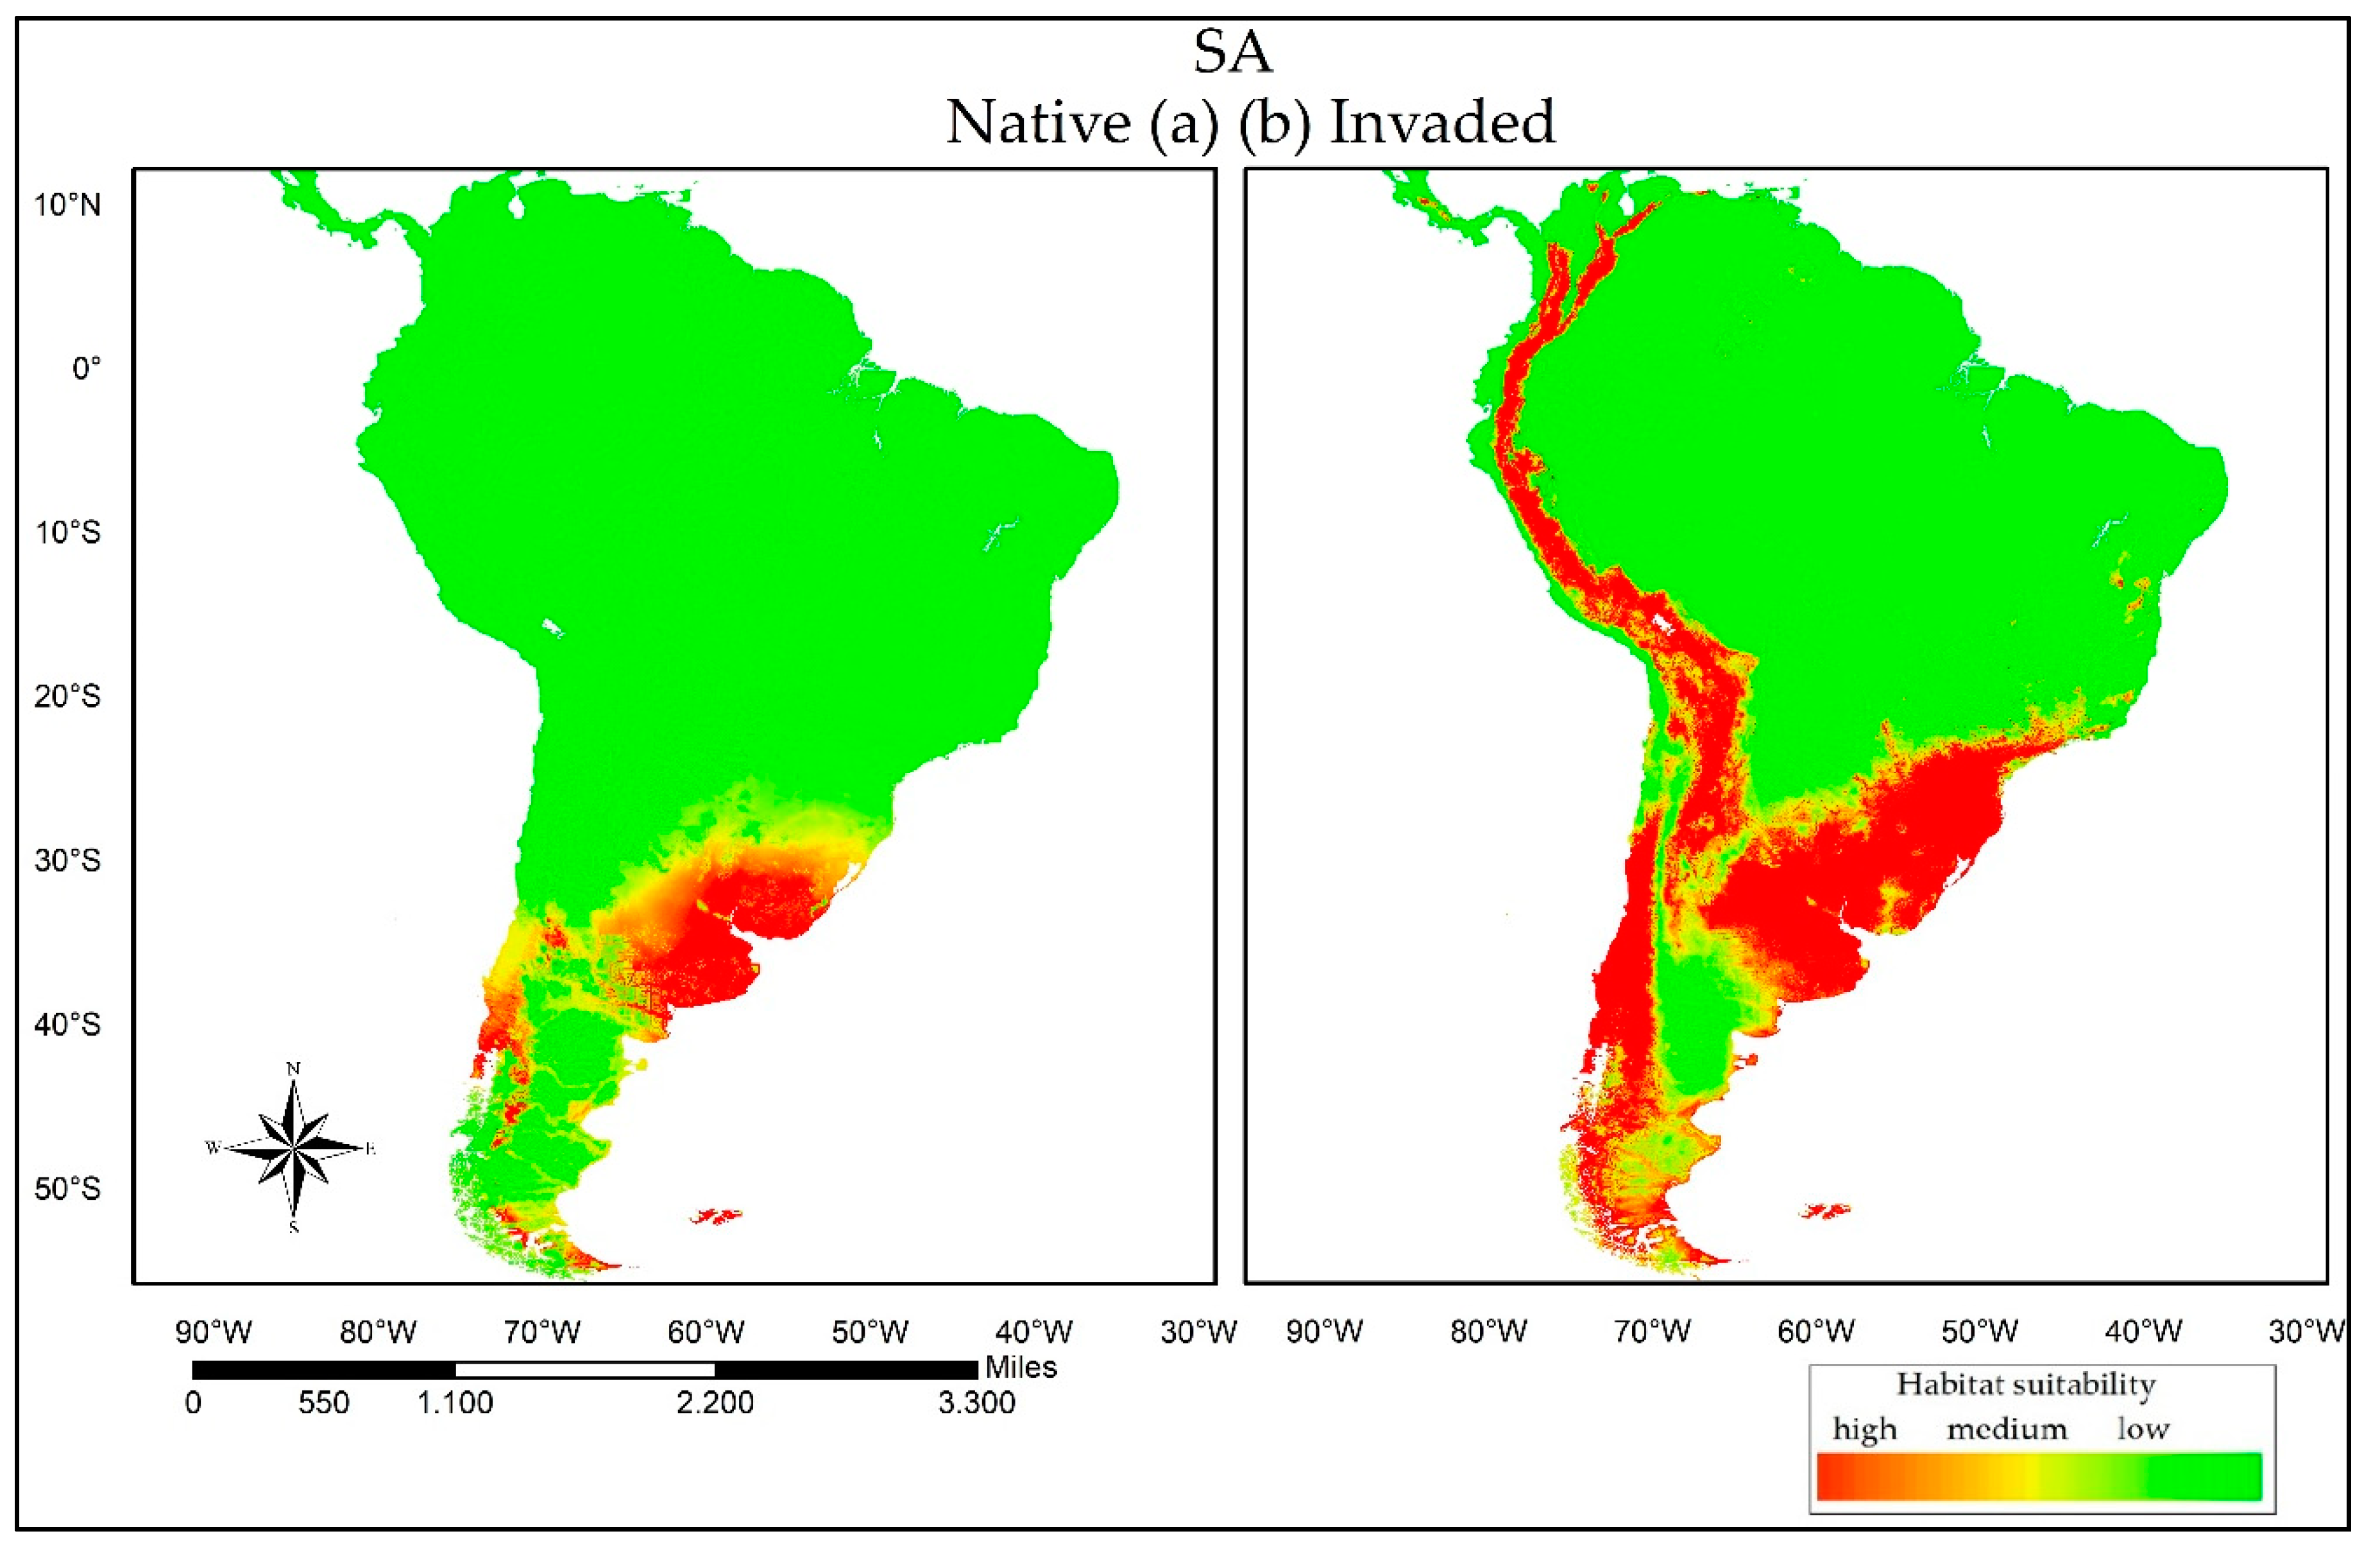
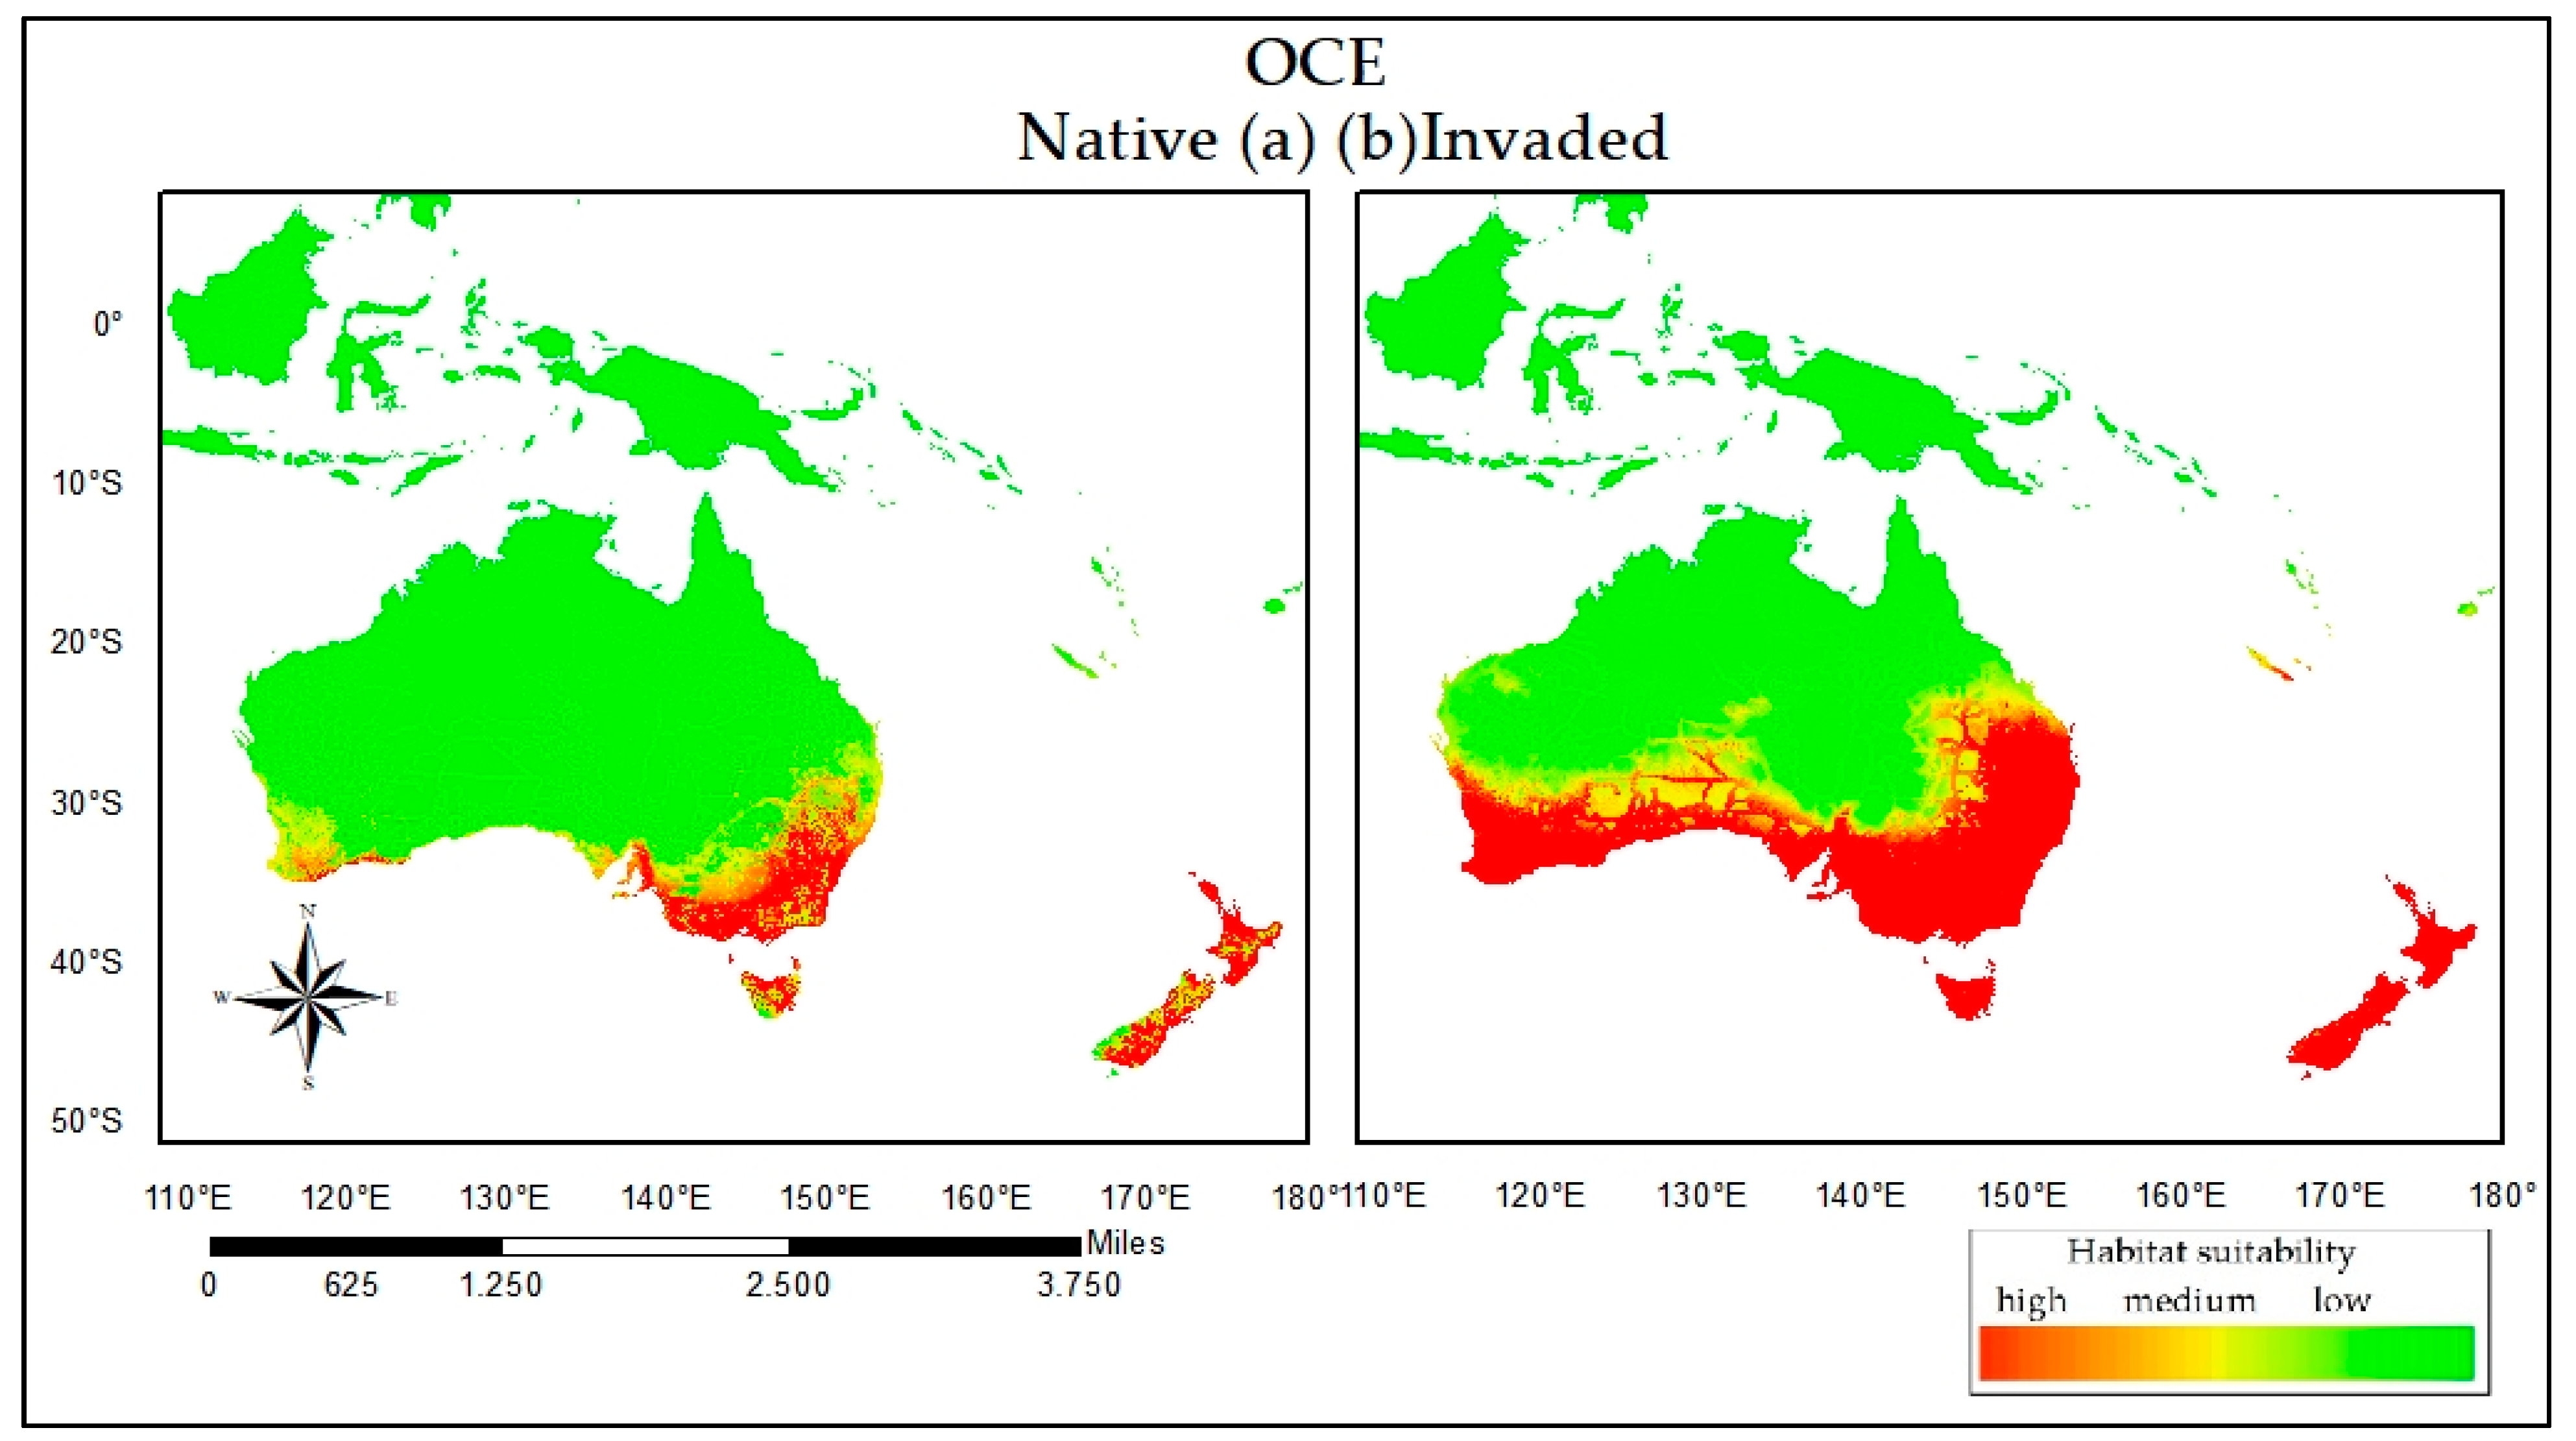
To explore niche conservatism across ranges of C. vulgare, we generated Ecological Niche Models that were compared to each other in a reciprocal way [10,46] using the MaxEnt program [21]. The MaxEnt model is a maximum entropy-based machine learning program that estimates the habitats suitability for a species based on the environmental constraints [21]. To generate reciprocal models, we first made distribution models of potential suitable habitats with the same occurrence points and environmental variables that were used in our PCA. Then, we projected native models into introduced ranges and visually compared them with models calibrated with data occurrence in the introduced range. We then repeated this step but projected the introduced models into the native range and compared them in the same way.
In fitting these models, we set up 15 replicates using 80% of the data for calibration and the other 20% for evaluation, the selection of feature classes (autofeature), a regularization multiplier value of 1, a maximum of 500 iterations, and 10,000 background points. To select the background points, we generated a Kernel Density map to draw background points at random in MaxEnt. This limits the background points to areas that we assume were surveyed for the species, which provides MaxEnt with a background file with the same bias as the presence locations [47]. We measured variable importance by comparing the jackknife of training gain values when models were made with individual variables. To avoid projections into environments outside which the models were trained upon, we used the ‘fade-by-clamping’ option in MaxEnt, which removes heavily clamped pixels from the final predictions [21]. Predictive performance of each model was assessed using 15-fold cross-validation and the area under a receiver operating characteristic curve (AUC), which measures a model’s ability to discriminate presence from background records (0.5 = random, 1 = perfect).

3. Results

3.1. Environmental Niche Analysis

For the target regions of this study, North America (NOA), South America (SA), Africa (AF), and Oceania (OCE) (Figure 1), a clear niche shift was observed for C. vulgare between the native and the invaded range. The overlap of “D” niches (Table 2) between niches was much greater in NOA and OCE than in SA and AF. Metrics of niche displacement for NOA revealed that there is a large proportion of common environments occupied between ranges and that the species has expanded (“expansion”) into warmer environments (Bio 1) and with less temperature variation (Bio 4). On the other hand, there is a very low proportion of environments with optimal conditions still not occupied (“unfilling,” Figure 2a,e). The metrics also indicate that the presences are quite associated with anthropogenic activities (HFP), something similar occurring in OCE but in this case less expansion was observed (Figure 2d,h). In the case of SA (Figure 2b,f) and AF (Figure 2c,g), the climatic trend of the expansion was similar to that of NOA and OCE, but it was also observed that the species tends toward environments with greater seasonality of rainfall (Bio 15). The metric did not show significant variations when considering the whole extension of the environments or only marginal environments, that is, the 90th percentile, except for AF, where it was observed that the unfilled environments had a higher proportion considering the totality of the available environments. Similarly, it was found that, in all the analyses, the environments with less radiation had a generalized trend (Figure 2).
According to the equivalence test carried out between both ranges, the niches occupied in SA were similar to those occupied in its native range, while OCE was the region with the most differences with respect to the niche of origin. In addition, the similarity test showed that except for the NOA region, the results were repeated. The results indicated that, in a certain proportion of the regions, niches were not more similar than expected by chance, i.e., in NOA, the niches were more similar to the niche of the native region than would be expected by chance (Figure 3).

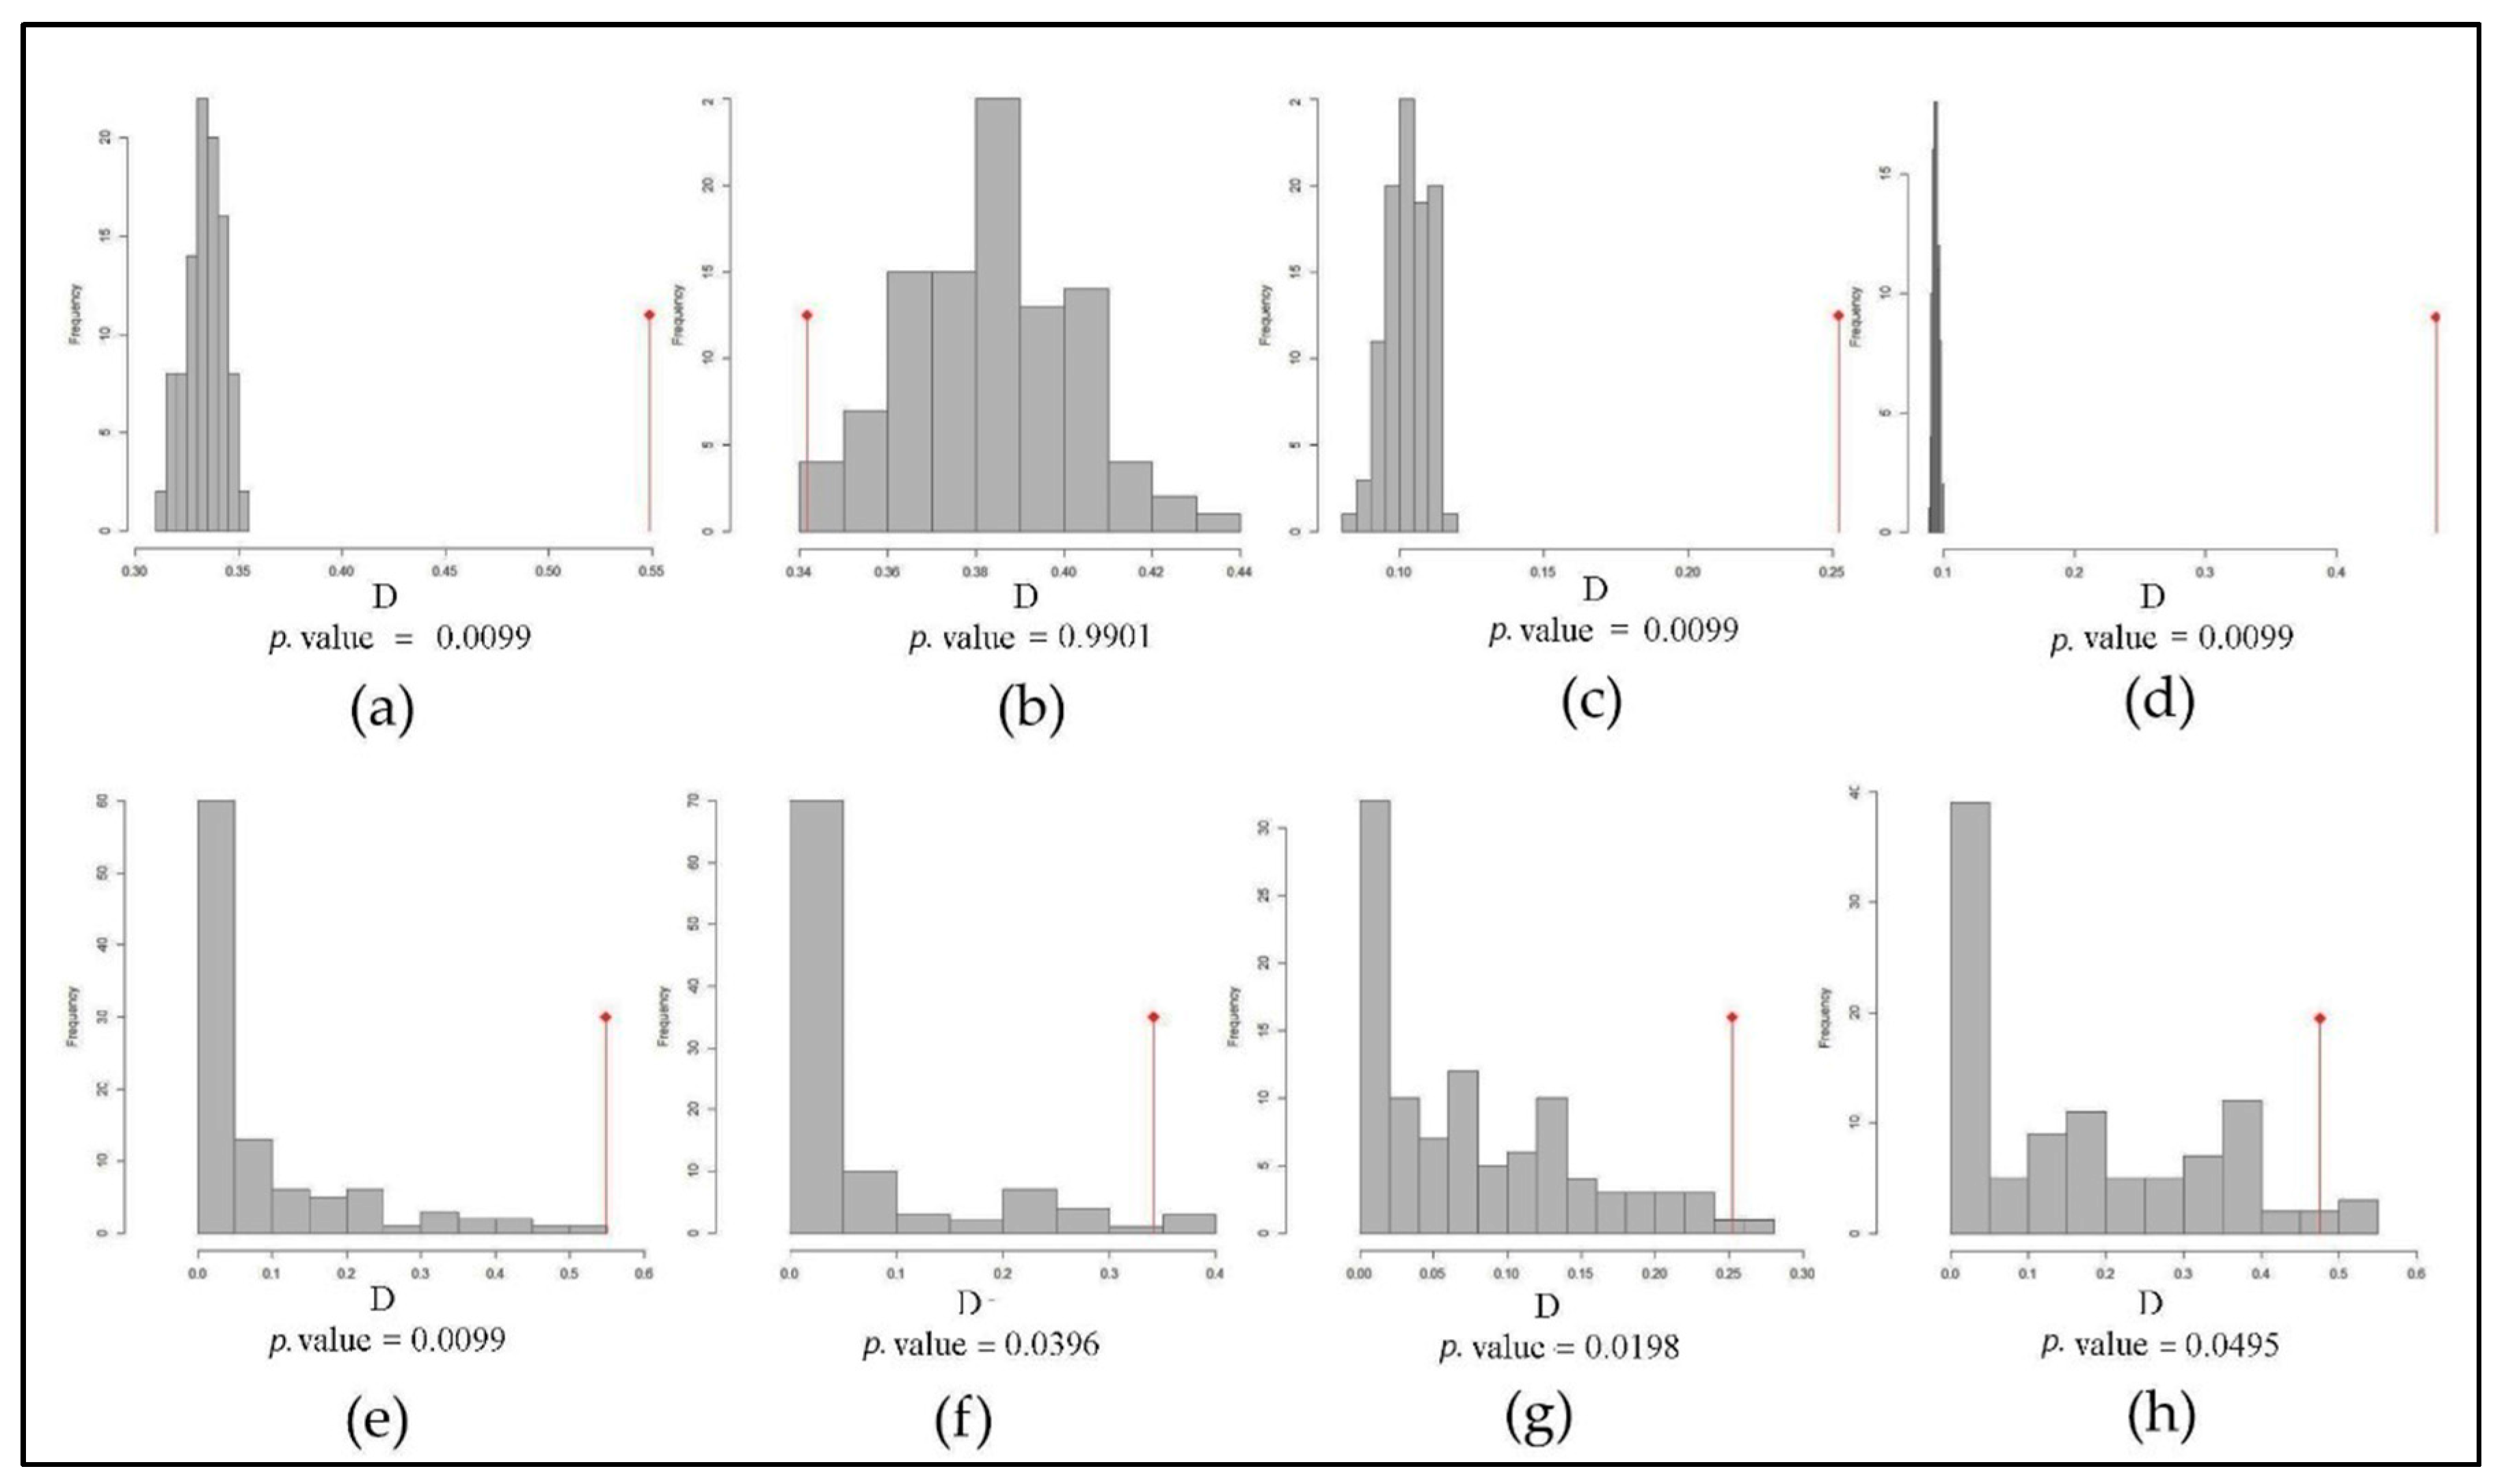
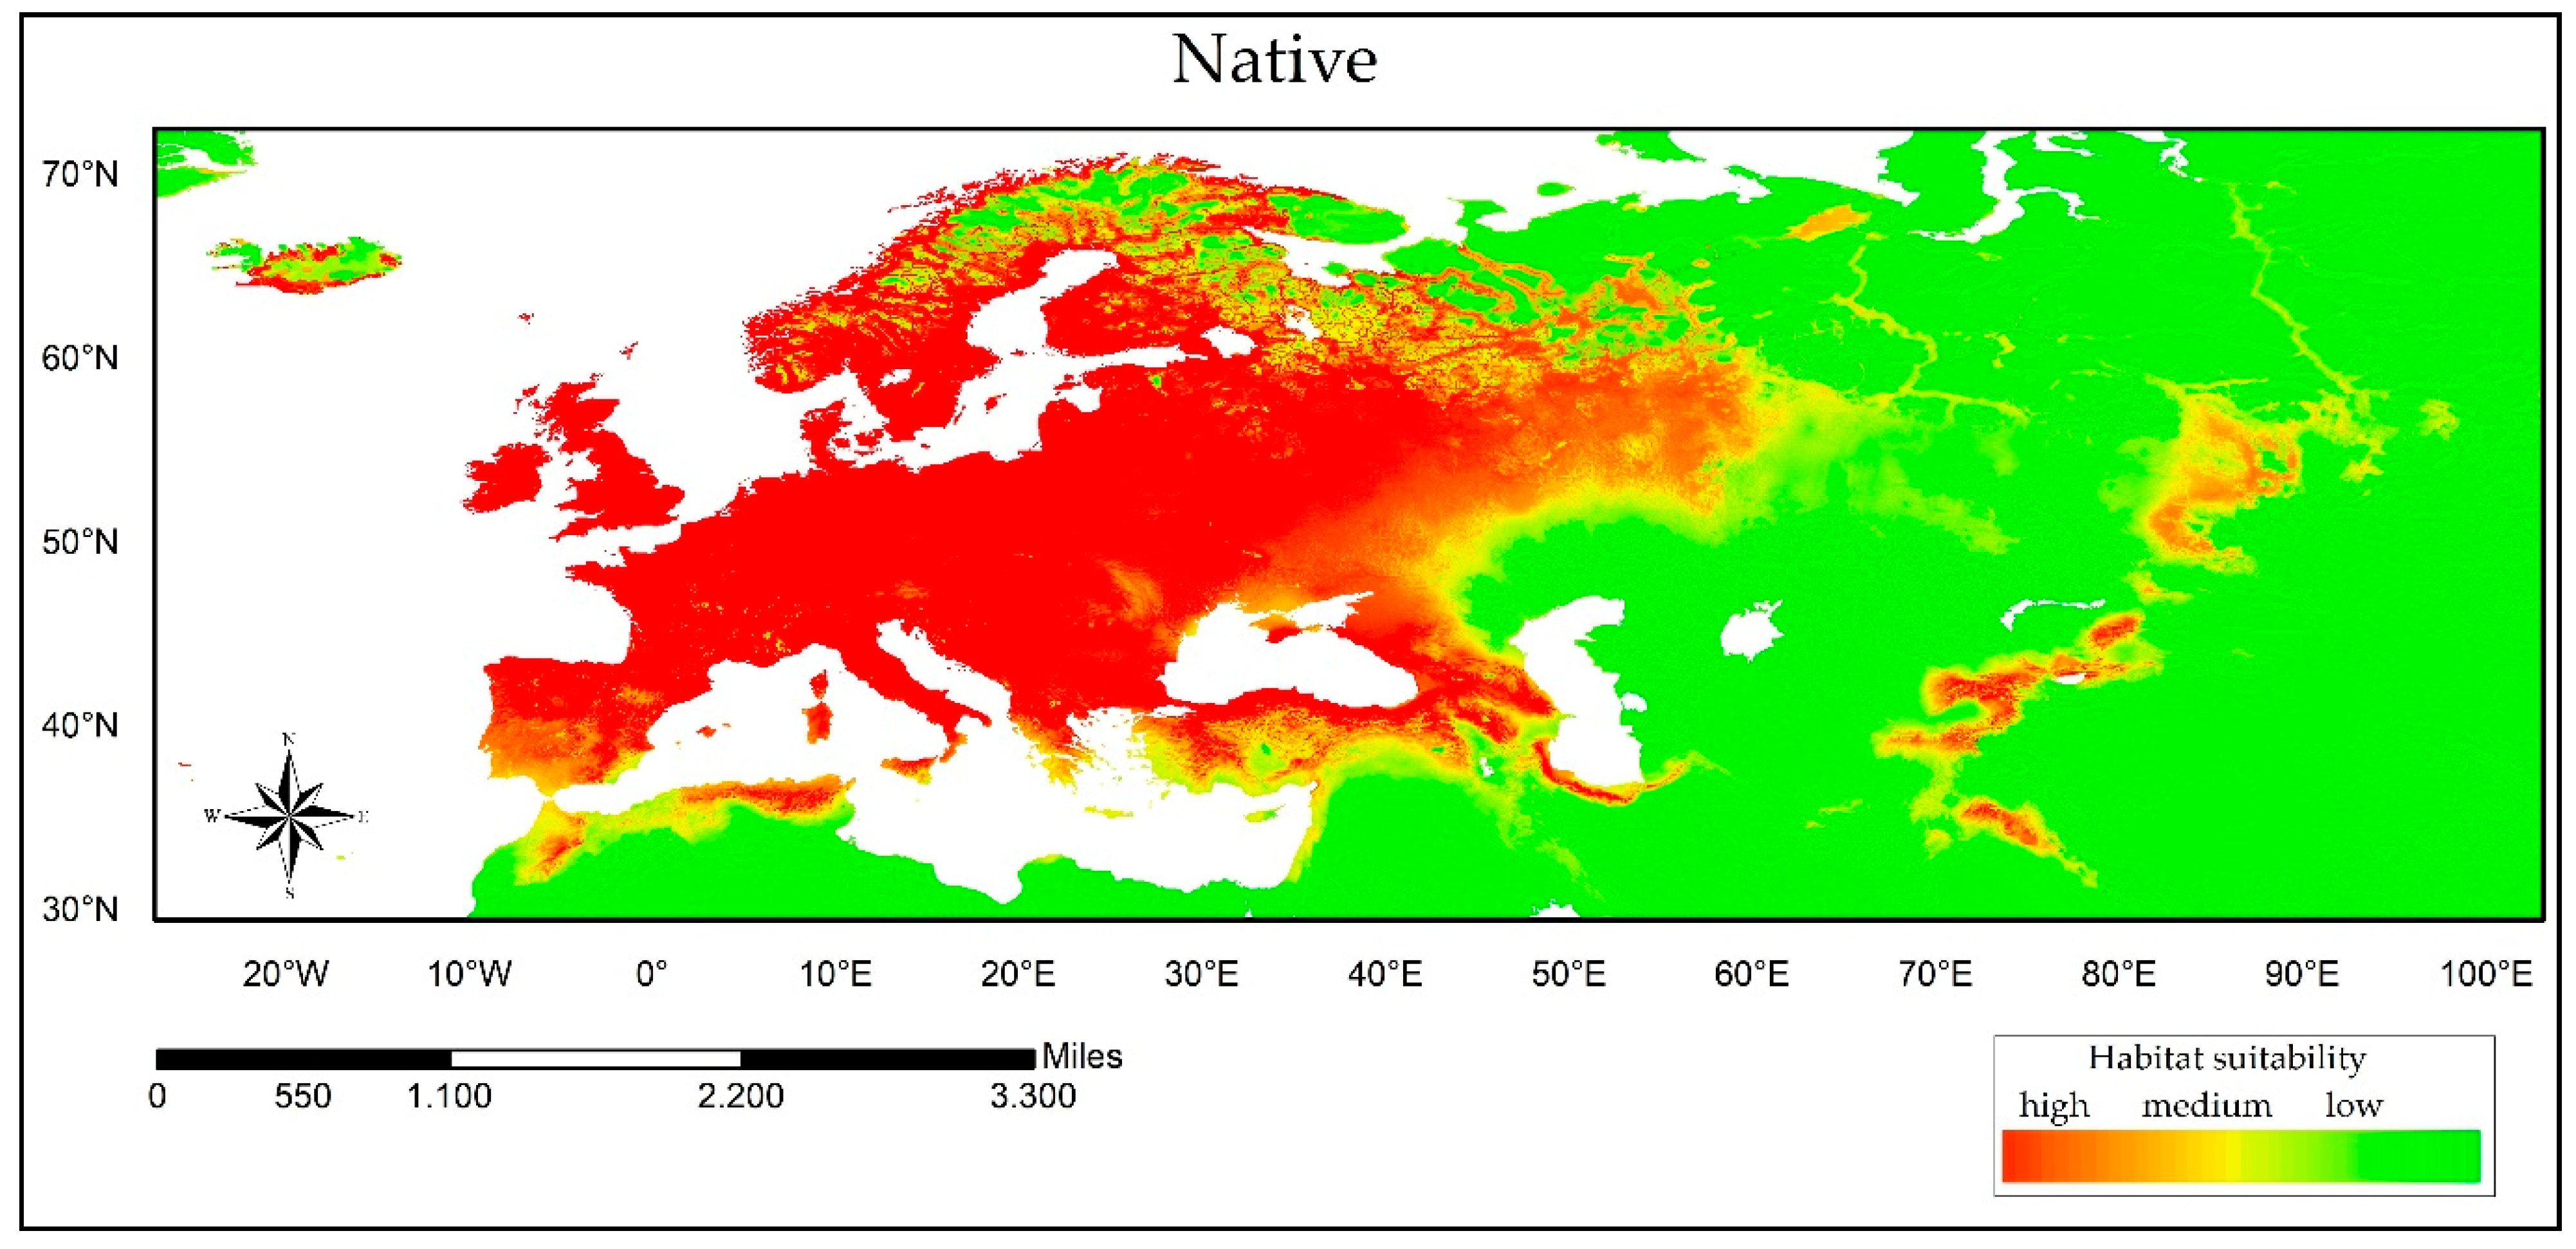
3.2. Reciprocal Ecological Niche Models

The models generated for all regions showed a proper fitting of the models compared to random model, with good AUC values (Table 3), and a relatively low rate of omission, indicating that the presence itself of the species was correlated with the most suitable environments for it. The most important variable for C. vulgare in its native range was HFP, preceded by solar radiation (Rad_sd) (Table 4).
Our results for the native region show a high adjustment of the suitability zones with the known presence of the species, which was expected given the greater historical extent of the colonization of this species (Figure 4). The prediction of the native model projected toward NOA (Figure 5a) was able to predict quite accurately the areas where C. vulgare is currently recorded. Projection calibrated in the invaded range (Figure 5b) showed that there are zones in the center of the subcontinent, with several areas of high habitat suitability extending westward. Variable analysis determined that HFP and Rad_sd were the most representative variables for this model (Table 4). In the case of SA (Figure 6a), the native model fairly predicted areas where the species occurs (to the south of Brazil, Chile and Argentina) and also predicted suitable habitats in Uruguay, but it did not hit areas with presence records in northern Argentina, southern Bolivia and Peru, and the mountainous areas of Ecuador and Colombia. The model of the invaded SA (Figure 6b) range predicted highly viable habitats along Chile and in the Andes Mountains in Ecuador and Colombia. Also, annual mean temperature (Bio 1) and seasonal temperature (Bio 4) (Table 4) were the explanatory variables with the highest contribution when calibrating the invaded model in SA. In the case of AF, the prediction of the native model (Figure 7a) was particularly accurate in North Africa in the Mediterranean region and in South Africa, where areas with records of C. vulgare were correctly predicted by our model, although it failed in the eastern areas of the African continent. On the other hand, the model calibrated in the invaded range of AF (Figure 7b) predicted areas of high habitat potential in Ethiopia and Kenya. The most important variables for AF were Bio 1 and Bio 4 (Table 4). For OCE, the prediction of the native model (Figure 8a) matches quite well with the records of the species, while the model of the invaded range for this region predicted areas of suitable habitat for C. vulgare across Papua New Guinea in northern Oceania. The model calibrated on the invaded range indicates that the species occupies a large part of Australia and that there are suitable environments for further expansion. Another suitable area is New Zealand, where the species is widely distributed (Figure 8b). The most important variables were Bio 4 and Rad_sd (Table 4).

4. Discussion

The study and understanding of biological invasions are critical elements since they can provide crucial information of the impact of invasive species and its areas of potential invasion in order to develop effective strategies and prevention measures. Studies at the regional level [23,48] constructed with adequately selected predictor variables have allowed a better characterization of the ecological niche shifts at different scales and at different stages of invasion [29,32]. However, defining the reasons why that happens is complex due to the different processes involved in the invasion of a species and, of course, it is essential the application of adequate methodologies to confront elements of the dynamics of ecological niches. A displacement of the niche centroid may imply that the species has found new suitable conditions within the invaded range in a non-analogous climate (climate absent in its native distribution), which would imply a shift in the realized niche but within the tolerance range of the species’ fundamental niche through a preadaptation mechanism, i.e., at some point, the species could have developed in the climate in question [49,50]. Another possibility is that the species underwent changes at the genetic level beyond its fundamental niche and adapted to new environmental conditions. It has been determined that C. vulgare has adapted and proliferated to the conditions of the dune ecosystems in Chile, presenting therophytic characteristics [51]. These new capacities may have been developed in the whole invaded range, although it is possible that this may be a preexisting characteristic of the species, coinciding with what happens with other therophytic species that have been described in some areas of the Mediterranean where C. vulgare has its native range. On the other hand, the establishment of species in new environments is not such a simple matter apart from phenotypic plasticity and genetic adaptation, as biological interactions play a crucial role in the processes of colonization of new territories [50]. A recent study showed that the species of the genus Cirsium (L.) Mill., since they generally share their environmental preferences and are often found in the same geographical area, are capable of sharing genetic material by means of cross-pollination. This would generate a greater genetic diversity and would imply possible adaptive capacities to new environments [52]. Some weed control studies [36,53,54] for C. vulgare have shown that this species has many natural competitors, mainly herbivorous insects that feed on the plant, reducing its capacity to produce seeds. These natural enemies have been used to control the proliferation of the plant mainly in North America, South Africa, and Oceania. However, the production capacity and resistance of the seeds of this species make it a very difficult adversary. C. vulgare is a weed with a fairly efficient competition capacity and with high resistance to chemical control systems, especially in South Australia where these cases are common with other species not necessarily of thistles [55].
When we analyzed the niche overlap metrics between regions, we observed that the use of marginal environments produced a variation in the values obtained, something previously verified in other invasive species [56]. In our case, the same case was fulfilled in almost all the regions. For example, in NOA, the values were practically the same, although the values in the expansion and unfilling were quite low (Table 2, Figure 2). This may be due to the similarity between niches that exist between this region and its native region (Figure 4). In the case of OCE, the expansion values showed a slight variation when using marginal environments, but the region also presented low values in the expansion. There was a great variation in the unfilling ratio when using these environments, which would mean possible future invasion areas. Besides, the SA region did not present such significant variability in the use of marginal environments, but the expansion values were much more representative compared to NOA and OCE. In addition, there is an important proportion of the native niche that the species has conserved but there is also a proportion of unfilling that has not been occupied. This could be because the species has not yet been introduced into these areas. Alternatively, it could be attributed to the existence of some geographical barrier, as it is a continent with large geographical features, or to biological interactions with other organisms—predatory pressure or competition for resources—that have not allowed it to settle [12,37]. In the case of AF, the metrics showed there was a rather low proportion of overlap of niches in relation to the native range. In fact, it was the lowest compared to the other three regions analyzed, but, interestingly, the expansion metrics were quite high and rather constant when including marginal environments. On the other hand, the unfilling metric varied drastically since was moderate without marginal environments, and the metric reached an important value when including these environments. It is interesting that the direction of displacement of the species in all regions was generally toward warmer environments with less variation in temperature.
According to AUC data, the performance of our models is statistically acceptable [10,37]. The analysis of variables importance indicates the very important role of annual and seasonal temperature in the distribution of the study species (Table 4). The predictions of the models (Figure 5, Figure 6, Figure 7 and Figure 8) show some differences with regard to the current distribution of the species (Figure 1). In this sense, it is important to note that, for this sort of species, it is necessary to consider variables beyond the bioclimatic ones [10,29]. In our case, the inclusion of the Human Footprint (HFP) provided us with insight into how anthropogenic activities are specially linked to the distribution of C. vulgare. This has also been observed for example in studies carried out in Africa [57] and in New Zealand [36], where the invasive species studied mainly proliferate in wastelands, roadsides, and areas of pasture cultivation. It is clear that there is a correlation between human intervention and the proliferation and success of invasive species, and some studies have highlighted the vulnerability of invaded ecosystems, emphasizing landscape structure as a determining factor in the success of the invasion [48,58]. In our case, when the weight of the Human Footprint (HFP) was analyzed (Figure 2h), we observed a relationship between the proliferation of our species in areas where humans modified the natural landscape, one of the most outstanding in the fields of agricultural production [59].
This contribution aims to show that the combination of tools and methods for predicting and inferring possible future invasions with an adequate selection of climatic and non-climatic variables, taking into account a global vision of the distribution of species at a regional level, can be a starting point for understanding the general trends of biological invasions. Likewise, through the comparison of the different types of ecological needs of the target species, it may be possible to achieve basic information for developing effective control strategies fitted to each territory and to invest resources in a more profitable way to protect native biodiversity.

Author Contributions

Conceptualization, J.Á.S.A. and J.F.C.R.; methodology, R.E.H.-L., J.F.C.R. and J.Á.S.A.; software, R.E.H.-L. and J.F.C.R.; validation, R.E.H.-L. and J.F.C.R.; formal analysis, J.F.C.R., R.E.H.-L. and J.Á.S.A.; investigation, J.F.C.R.; writing—review and editing, J.F.C.R., J.Á.S.A. and D.R.d.l.C.; supervision, J.Á.S.A. and D.R.d.l.C. All authors have read and agreed to the published version of the manuscript.

Funding

This research received no external funding.

Institutional Review Board Statement

Not applicable.

Informed Consent Statement

Not applicable.

Data Availability Statement

Not applicable.

Acknowledgments

We wish to thank both the scientific and editorial reviewers for their invaluable help in correcting this article.

Conflicts of Interest

The authors declare no conflict of interest.

References

  1. Sala, O.E.; Chapin, F.S., III; Armesto, J.J.; Berlow, E.; Bloomfield, J.; Dirzo, R.; Huber-Sanwald, E.; Huenneke, L.F.; Jackson, R.B.; Kinzig, A.; et al. Global Biodiversity Scenarios for the Year 2100. Science 2000, 287, 1770–1774. [Google Scholar] [CrossRef] [PubMed]
  2. Haddad, N.M.; Brudvig, L.A.; Clobert, J.; Davies, K.F.; Gonzalez, A.; Holt, R.D.; Lovejoy, T.E.; Sexton, J.O.; Austin, M.P.; Collins, C.D.; et al. Habitat Fragmentation and Its Lasting Impact on Earth’s Ecosystems. Sci. Adv. 2015, 1, e1500052. [Google Scholar] [CrossRef] [Green Version]
  3. Rybicki, J.; Hanski, I. Species-Area Relationships and Extinctions Caused by Habitat Loss and Fragmentation. Ecol. Lett. 2013, 16, 27–38. [Google Scholar] [CrossRef] [PubMed]
  4. Pérez-García, J.N. Causas de la pérdida global de biodiversidad. Rev. Asoc. Colomb. Cienc. Biol. 2020, 183–198. [Google Scholar] [CrossRef]
  5. Butchart, S.H.M.; Walpole, M.; Collen, B.; van Strien, A.; Scharlemann, J.P.W.; Almond, R.E.A.; Baillie, J.E.M.; Bomhard, B.; Brown, C.; Bruno, J.; et al. Global Biodiversity: Indicators of Recent Declines. Science 2010, 328, 1164–1168. [Google Scholar] [CrossRef] [PubMed]
  6. Seebens, H.; Blackburn, T.M.; Dyer, E.E.; Genovesi, P.; Hulme, P.E.; Jeschke, J.M.; Pagad, S.; Pyšek, P.; Winter, M.; Arianoutsou, M.; et al. No Saturation in the Accumulation of Alien Species Worldwide. Nat. Commun. 2017, 8, 14435. [Google Scholar] [CrossRef] [PubMed]
  7. Estrada, A.; Morales-Castilla, I.; Caplat, P.; Early, R. Usefulness of Species Traits in Predicting Range Shifts. Trends Ecol. Evol. 2016, 31, 190–203. [Google Scholar] [CrossRef] [PubMed] [Green Version]
  8. Mathakutha, R.; Steyn, C.; le Roux, P.C.; Blom, I.J.; Chown, S.L.; Daru, B.H.; Ripley, B.S.; Louw, A.; Greve, M. Invasive Species Differ in Key Functional Traits from Native and Non-Invasive Alien Plant Species. J. Veg. Sci. 2019, 30, 994–1006. [Google Scholar] [CrossRef]
  9. Alharbi, W.; Petrovskii, S. Patterns of Invasive Species Spread in a Landscape with a Complex Geometry. Ecol. Complex. 2018, 33, 93–105. [Google Scholar] [CrossRef] [Green Version]
  10. Hernández-Lambraño, R.E.; González-Moreno, P.; Sánchez-Agudo, J.Á. Towards the Top: Niche Expansion of Taraxacum Officinale and Ulex Europaeus in Mountain Regions of South America. Austral Ecol. 2017, 42, 577–589. [Google Scholar] [CrossRef]
  11. Born-Schmidt, G.; De Alba, F.; Servole, J.; Koleff, P. Espaldon, maria victoria Principales Retos Que Enfrenta Mexico Ante Las Especies Exóticas Invasoras; Comisión Nacional para el Conocimiento y Uso de la Biodiversidad (Conabio), el Programa de las Naciones Unidas para el Desarrollo (PNUD) y el Centro de Estudios Sociales y de Opinión Pública (CESOP): Mexico City, Mexico, 2017. [Google Scholar]
  12. Zilio, M.I. El Impacto Económico de las Invasiones Biológicas en Argentina: Cuánto Cuesta no Proteger la Biodiversidad; Asociación Argentina de Economía Política (AAEP): Buenos Aires, Argentina, 2019. [Google Scholar]
  13. Hoffmann, B.; Broadhurst, L. The Economic Cost of Managing Invasive Species in Australia. NeoBiota 2016, 31, 1–18. [Google Scholar] [CrossRef] [Green Version]
  14. Jackson, T. Addressing the Economic Costs of Invasive Alien Species: Some Methodological and Empirical Issues. Int. J. Sustain. Soc. 2015, 7, 221–240. [Google Scholar] [CrossRef]
  15. Broennimann, O.; Guisan, A. Predicting Current and Future Biological Invasions: Both Native and Invaded Ranges Matter. Biol. Lett. 2008, 4, 585–589. [Google Scholar] [CrossRef] [PubMed]
  16. Medeiros, C.M. Aplicación de Modelos de Nicho Ecológico y Sistemas de Información Geográfica para la Conservación de la Biodiversidad. Ph.D. Thesis, Universidad de Salamanca, Salamanca, Spain, 2018. Available online: http://purl.org/dc/dcmitype/Text (accessed on 3 April 2020).
  17. Soberón, J.; Osorio-Olvera, L.; Peterson, T. Diferenias conceptuales entre modelación de nichos y modelación de áreas de distribución. Rev. Mex. Biodivers. 2017, 88, 437–441. [Google Scholar] [CrossRef]
  18. Mota Vargas, C.; Encarnación Luévano, A.; Ortega Andrade, H.M.; Prieto Torres, D.A.; Peña Peniche, A.; Rojas Soto, O.R. Una Breve Introducción a los Modelos de Nicho Ecológico; Universidad Autónoma del Estado de Hidalgo: Pachuca, Mexico, 2020; ISBN 978-607-482-598-5. [Google Scholar]
  19. Colwell, R.K.; Rangel, T.F. Hutchinson’s Duality: The Once and Future Niche. Proc. Natl. Acad. Sci. USA 2009, 106 (Suppl. 2), 19651–19658. [Google Scholar] [CrossRef] [PubMed] [Green Version]
  20. Hutchinson, G.E. Concluding Remarks. Cold Spring Harb. Symp. Quant. Biol. 1957, 22, 415–427. [Google Scholar] [CrossRef]
  21. Phillips, S.J.; Anderson, R.P.; Schapire, R.E. Maximum Entropy Modeling of Species Geographic Distributions. Ecol. Model. 2006, 190, 231–259. [Google Scholar] [CrossRef] [Green Version]
  22. Goncalves, E.; Herrera, I.; Duarte, M.; Bustamante, R.; Lampo, M.; Squez, G.; Sharma, G.; Garcia-Rangel, S. Global Invasion of Lantana Camara: Has the Climatic Niche Been Conserved across Continents? PLoS ONE 2014, 9. [Google Scholar] [CrossRef] [PubMed] [Green Version]
  23. Battini, N.; Farias, N.; Giachetti, C.; Schwindt, E.; Bortolus, A. Staying Ahead of Invaders: Using Species Distribution Modeling to Predict Alien Species’ Potential Niche Shifts. Mar. Ecol. Prog. Ser. 2019, 612, 127–140. [Google Scholar] [CrossRef]
  24. Elith, J.; Graham, C.; Anderson, R.; Dudík, M.; Ferrier, S.; Guisan, A.; Hijmans, R.; Huettmann, F.; Leathwick, J.; Lehmann, A. Novel Methods Improve Prediction of Species’ Distributions from Occurrence Data. Ecography 2006, 29, 129–151. [Google Scholar] [CrossRef] [Green Version]
  25. Pearman, P.B.; Guisan, A.; Broennimann, O.; Randin, C.F. Niche Dynamics in Space and Time. Trends Ecol. Evol. 2008, 23, 149–158. [Google Scholar] [CrossRef] [PubMed]
  26. Peterson, A.T. Predicting the Geography of Species’ Invasions via Ecological Niche Modeling. Q. Rev. Biol. 2003, 78, 419–433. [Google Scholar] [CrossRef] [Green Version]
  27. Carlos-Júnior, L.A.; Barbosa, N.P.U.; Moulton, T.P.; Creed, J.C. Ecological Niche Model Used to Examine the Distribution of an Invasive, Non-Indigenous Coral. Mar. Environ. Res. 2015, 103, 115–124. [Google Scholar] [CrossRef] [PubMed]
  28. Parravicini, V.; Azzurro, E.; Kulbicki, M.; Belmaker, J. Niche Shift Can Impair the Ability to Predict Invasion Risk in the Marine Realm: An Illustration Using Mediterranean Fish Invaders. Ecol. Lett. 2015, 18, 246–253. [Google Scholar] [CrossRef] [PubMed]
  29. Guisan, A.; Petitpierre, B.; Broennimann, O.; Daehler, C.; Kueffer, C. Unifying Niche Shift Studies: Insights from Biological Invasions. Trends Ecol. Evol. 2014, 29, 260–269. [Google Scholar] [CrossRef] [PubMed] [Green Version]
  30. Hierro, J.L.; Maron, J.L.; Callaway, R.M. A Biogeographical Approach to Plant Invasions: The Importance of Studying Exotics in Their Introduced and Native Range. J. Ecol. 2005, 93, 5–15. [Google Scholar] [CrossRef]
  31. Richardson, D.M.; Allsopp, N.; D’Antonio, C.M.; Milton, S.J.; Rejmánek, M. Plant Invasions—The Role of Mutualisms. Biol. Rev. 2000, 75, 65–93. [Google Scholar] [CrossRef] [PubMed]
  32. Petitpierre, B.; Kueffer, C.; Broennimann, O.; Randin, C.; Daehler, C.; Guisan, A. Climatic Niche Shifts Are Rare Among Terrestrial Plant Invaders. Science 2012, 335, 1344–1348. [Google Scholar] [CrossRef] [PubMed] [Green Version]
  33. Moore, R.J.; Frankton, C. The Thistles of Canada; Research Branch, Canada Department of Agriculture: Ottawa, ON, Canada, 1974. [Google Scholar]
  34. Parsons, W.T.; Cuthbertson, E.G. Noxious Weeds of Australia; Inkata Press: Melbourne, VIC, Australia, 1992; ISBN 978-0-909605-81-0. [Google Scholar]
  35. Mitich, L.W. Bull Thistle, Cirsium vulgare. Weed Technol. 1998, 12, 761–763. [Google Scholar] [CrossRef] [Green Version]
  36. Cripps, M.; Navukula, J.; Casonato, S.; van Koten, C. Impact of the Gall Fly, Urophora Stylata, on the Pasture Weed, Cirsium Vulgare, in New Zealand. BioControl 2020, 65, 501–513. [Google Scholar] [CrossRef]
  37. Broennimann, O.; Fitzpatrick, M.C.; Pearman, P.B.; Petitpierre, B.; Pellissier, L.; Yoccoz, N.G.; Thuiller, W.; Fortin, M.-J.; Randin, C.; Zimmermann, N.E.; et al. Measuring Ecological Niche Overlap from Occurrence and Spatial Environmental Data. Glob. Ecol. Biogeogr. 2012, 21, 481–497. [Google Scholar] [CrossRef] [Green Version]
  38. Holm, L.; Doll, J.; Holm, E.; Pancho, J.V.; Herberger, J.P. World Weeds: Natural Histories and Distribution; John Wiley & Sons: Hoboken, NJ, USA, 1997. [Google Scholar]
  39. Herrera, I.; Goncalves, E.; Pauchard, A.; Bustamante, R.O. Manual de Plantas Invasoras de Sudamérica; IEB Chile, Instituto de Ecología y Biodiversidad: Región de O’Higgins, Chile, 2016. [Google Scholar]
  40. Petryna, L.; Moora, M.; Nuñes, C.O.; Cantero, J.J.; Zobel, M. Are Invaders Disturbance-Limited? Conservation of Mountain Grasslands in Central Argentina. Appl. Veg. Sci. 2002, 5, 195–202. [Google Scholar] [CrossRef]
  41. Parsons, W.T.; Cuthbertson, E.G. Noxious Weeds of Australia, 2nd ed.; CSIRO Publishing: Collingwood, VIC, Australia, 2001; ISBN 978-0-643-06514-7. [Google Scholar]
  42. Klinkhamer, P.G.; De Jong, T.J. Cirsium Vulgare (Savi) Ten. J. Ecol. 1993, 177–191. [Google Scholar] [CrossRef]
  43. R: El Proyecto R Para Computación Estadística. Available online: https://www.r-project.org/index.html (accessed on 4 February 2021).
  44. About ArcGIS|Mapping & Analytics Software and Services. Available online: https://www.esri.com/en-us/arcgis/about-arcgis/overview (accessed on 31 January 2021).
  45. Cola, V.D.; Broennimann, O.; Petitpierre, B.; Breiner, F.T.; D’Amen, M.; Randin, C.; Engler, R.; Pottier, J.; Pio, D.; Dubuis, A.; et al. Ecospat: An R Package to Support Spatial Analyses and Modeling of Species Niches and Distributions. Ecography 2017, 40, 774–787. [Google Scholar] [CrossRef]
  46. Broennimann, O.; Treier, U.A.; Müller-Schärer, H.; Thuiller, W.; Peterson, A.T.; Guisan, A. Evidence of Climatic Niche Shift during Biological Invasion. Ecol. Lett 2007, 10, 701–709. [Google Scholar] [CrossRef] [PubMed] [Green Version]
  47. Elith, J.; Phillips, S.J.; Hastie, T.; Dudík, M.; Chee, Y.E.; Yates, C.J. A Statistical Explanation of MaxEnt for Ecologists. Divers. Distrib. 2011, 17, 43–57. [Google Scholar] [CrossRef]
  48. González-Moreno, P.; Delgado, J.; Vilà, M. Una Visión a Escala de Paisaje de Las Invasiones Biológicas. Ecosistemas 2015, 24, 84–92. [Google Scholar] [CrossRef]
  49. Webber, B.; Le Maitre, D.; Kriticos, D. Comment on “Climatic Niche Shifts Are Rare Among Terrestrial Plant Invaders”. Science 2012, 338, 193. [Google Scholar] [CrossRef] [PubMed] [Green Version]
  50. Jack of All Trades, Master of Some? On the Role of Phenotypic Plasticity in Plant Invasions-Richards-2006-Ecology Letters-Wiley Online Library. Available online: https://onlinelibrary.wiley.com/doi/10.1111/j.1461-0248.2006.00950.x (accessed on 15 December 2020).
  51. Martín, J.S.; Ramírez, C.; Martín, C.S. La flora de las dunas chilenas y sus adaptaciones morfológicas. Bosque 1992, 13, 29–39. [Google Scholar] [CrossRef]
  52. Sheidai, M.; Zanganeh, S.; Haji-Ramezanali, R.; Nouroozi, M.; Noormohammadi, Z.; Ghsemzadeh-Baraki, S. Genetic Diversity and Population Structure in Four Cirsium (Asteraceae) Species. Biologia 2013, 68. [Google Scholar] [CrossRef]
  53. Suwa, T.; Louda, S.M.; Leland Russell, F. No Interaction between Competition and Herbivory in Limiting Introduced Cirsium Vulgare Rosette Growth and Reproduction. Oecologia 2010, 162, 91–102. [Google Scholar] [CrossRef] [PubMed] [Green Version]
  54. Moyo, C.; Harrington, K.C.; Kemp, P.D. Effectiveness of Spraying Herbicides in the Centre Compared to All over Rosettes of Cirsium Vulgare and Jacobaea Vulgaris. In Proceedings of the 19th Australasian Weeds Conference, Hobart, Australia, 1–4 September 2014; pp. 235–238. [Google Scholar]
  55. Chauhan, B.S.; Jha, P. Glyphosate Resistance in Sonchus Oleraceus and Alternative Herbicide Options for Its Control in Southeast Australia. Sustainability 2020, 12, 8311. [Google Scholar] [CrossRef]
  56. Paulo De Marco, J.; Diniz-Filho, J.A.F.; Bini, L.M. Spatial Analysis Improves Species Distribution Modelling during Range Expansion. Biol. Lett. 2008, 4, 577–580. [Google Scholar] [CrossRef] [PubMed] [Green Version]
  57. Horo, J.T.; Tessema, T. Abundance and Distribution of Invasive Alien Plant Species in Illu Ababora Zone of Oromia National Regional State, Ethiopia. J. Agric. Sci. Food Technol. 2015, 1, 94–100. [Google Scholar] [CrossRef]
  58. Cabra-Rivas, I.; Saldaña, A.; Castro-Díez, P.; Gallien, L. A Multi-Scale Approach to Identify Invasion Drivers and Invaders’ Future Dynamics. Biol. Invasions 2016, 18. [Google Scholar] [CrossRef]
  59. Zhang, X.; Wei, H.; Zhao, Z.; Liu, J.; Zhang, Q.; Zhang, X.; Gu, W. The Global Potential Distribution of Invasive Plants: Anredera Cordifolia under Climate Change and Human Activity Based on Random Forest Models. Sustainability 2020, 12, 1491. [Google Scholar] [CrossRef] [Green Version]
Figure 1. The map shows all the zones for the native and invaded ranges which were defined based on the filtered presences (black spots) and the bibliographic analysis of C. vulgare. The native range, represented with the light red color, covers almost all Eurasia. The invaded range, represented by the color yellow, includes: NOA—North America; SA—South America, excluding some countries (Venezuela, Uruguay, Paraguay, Surinam, Guyana, and French Guyana); AF—Africa, in areas belonging some countries (South Africa, Ethiopia, Rwanda, and Kenya); and OCE—Oceania, the whole continent. Zones that do not fall into either range are represented in grey.
Sustainability 13 02384 g001
Figure 2. The niche overlap for each invaded range zones with the native range with 10 km of grid resolution is shown in (a) NOR—North America, (b) SA—South America, (c) AF—Africa, and (d) OCE—Oceania. Also, continuous and discontinuous red lines indicate 100% and 90% of the available background environments for C. vulgare, respectively. The solid red areas indicate the expansion, that is, areas that are actually occupied by the species (only for native range). The solid green color shows the areas that satisfy the requirements of the species but have not been occupied by it, that is, the unfilling (only invaded range). The solid blue color belongs to the stability, which is not more than the proportion of shared niche between the native and invaded ranges. The continuous red arrow shows the environmental distance between the median of the distribution density for each range, and the discontinuous red arrow shows the environmental distance between the median of the environmental space in each range. The contribution of climate variables in the first two axes of the PCA and the correlation of variables for each of the zones are shown, respectively, in (eh).
Sustainability 13 02384 g002
Figure 3. Equivalence and Similarity tests to compare the niches between the native and invaded ranges. The first row shows the equivalence values, i.e., the frequencies observed for the niche overlap index (D) in relation to the expected D for p = 0.05 (ad). The niche similarity is shown in the second row (eh). The first column compares native range with North America (a,e), the second column compares native range with South America (b,f), the third column compares native range with Africa (c,g), and the fourth column compares native range with Oceania (d,h).
Sustainability 13 02384 g003
Figure 4. Native range model. Red indicates higher habitat suitability for C. vulgare. Yellow indicates medium suitability while light green indicates low or no suitability as it becomes lighter.
Sustainability 13 02384 g004
Figure 5. (a) Native model projected in NOA. (b) Model of the invaded range calibrated in NOA. Red indicates higher habitat suitability for C. vulgare. Yellow indicates medium suitability while light green indicates low or no suitability as it becomes lighter.
Sustainability 13 02384 g005
Figure 6. (a) Native model projected in SA. (b) Model of the invaded range calibrated in SA. Red indicates higher habitat suitability for C. vulgare. Yellow indicates medium suitability while light green indicates low or no suitability as it becomes lighter.
Sustainability 13 02384 g006
Figure 7. (a) Native model projected in AF. (b) Model of the invaded range calibrated in AF. Red indicates higher habitat suitability for C. vulgare. Yellow indicates medium suitability while light green indicates low or no suitability as it becomes lighter.
Sustainability 13 02384 g007
Figure 8. (a) Native model projected in OCE. (b) Model of the invaded range calibrated in OCE. Red indicates higher habitat suitability for C. vulgare. Yellow indicates medium suitability while light green indicates low or no suitability as it becomes lighter.
Sustainability 13 02384 g008
Table 1. Selected explanatory variables, the first column of the table displays the abbreviation that was used in this study to represent the selected variables; in the second, the full name of each variable; and the third the type of variable, that is, whether it is climatic or non-climatic.
CodeNameType
Bio 1Annual mean TemperatureClimatic
Bio 4Temperature Seasonality
Bio 12Annual Precipitation
Bio 15Precipitation Seasonality
Rad_sdStandard deviance of RadiationNon-Climatic
HFPHuman Footprint
Table 2. Principal component analysis (PCA) metrics for C. vulgare. The metrics for the niche overlap (Schoener’s D) the intersection, i.e., considering the percentile (90%) to eliminate marginal environments between the native and invaded ranges (marginal environments), and considering the full extent of available environments (whole environmental extent).
RangeSchoener’s D MetricMarginal EnvironmentsWhole Environmental Extent
D. OverlapStabilityExpansionUnfillingStabilityExpansionUnfilling
Native
vs. NOA
0.54860.86680.13310.00020.86420.13570.0002
Native
vs. SA
0.34170.54110.45880.05570.41970.58020.0567
Native
vs. AF
0.25220.24340.75650.36130.22910.77080.8097
Native
vs. OCE
0.47610.94400.05590.14910.94100.05890.2713
Table 3. Model accuracy results using the area under a receiver operating characteristic curve (AUC).
AUC Values
Training Test
NativeNOASAAFOCENativeNOASAAFOCE
0.670.890.980.980.810.670.880.970.980.81
Table 4. Importance of the variables using the average +/− the standard deviation of the contribution of the same variables as a product of the three replicates carried out for each model in the native and invaded ranges.
VariableNative RangeInvaded Range
NOASAAFOCE
Bio 10.79 ± 8.3715.3 ± 1.425.9 ± 4.431.4 ± 1.11.6 ± 4.4
Bio 44.4 ± 6.84.8 ± 5.043.8 ± 4.637 ± 2.347.8 ± 9.8
Bio 1214.7 ± 6.412.9 ± 1.142.5 ± 6.85.3 ± 1.03.6 ± 1.4
Bio 152.2 ± 3.92.7 ± 2.63.6 ± 3.12.9 ± 1.913.8 ± 1.2
Rad_sd29.7 ± 4.822.1 ± 2.15.4 ± 4.14.7 ± 2.925 ± 1.8
HFP48.0 ± 2.441.9 ± 4.419.1 ± 1.218.4 ± 1.18.1 ± 1.2
Publisher’s Note: MDPI stays neutral with regard to jurisdictional claims in published maps and institutional affiliations.

