
Remanufacturing for Circular Economy: Understanding the Impact of Manufacturer’s Incentive under Price Competition

 ,
,  ,
,  and
and
Abstract
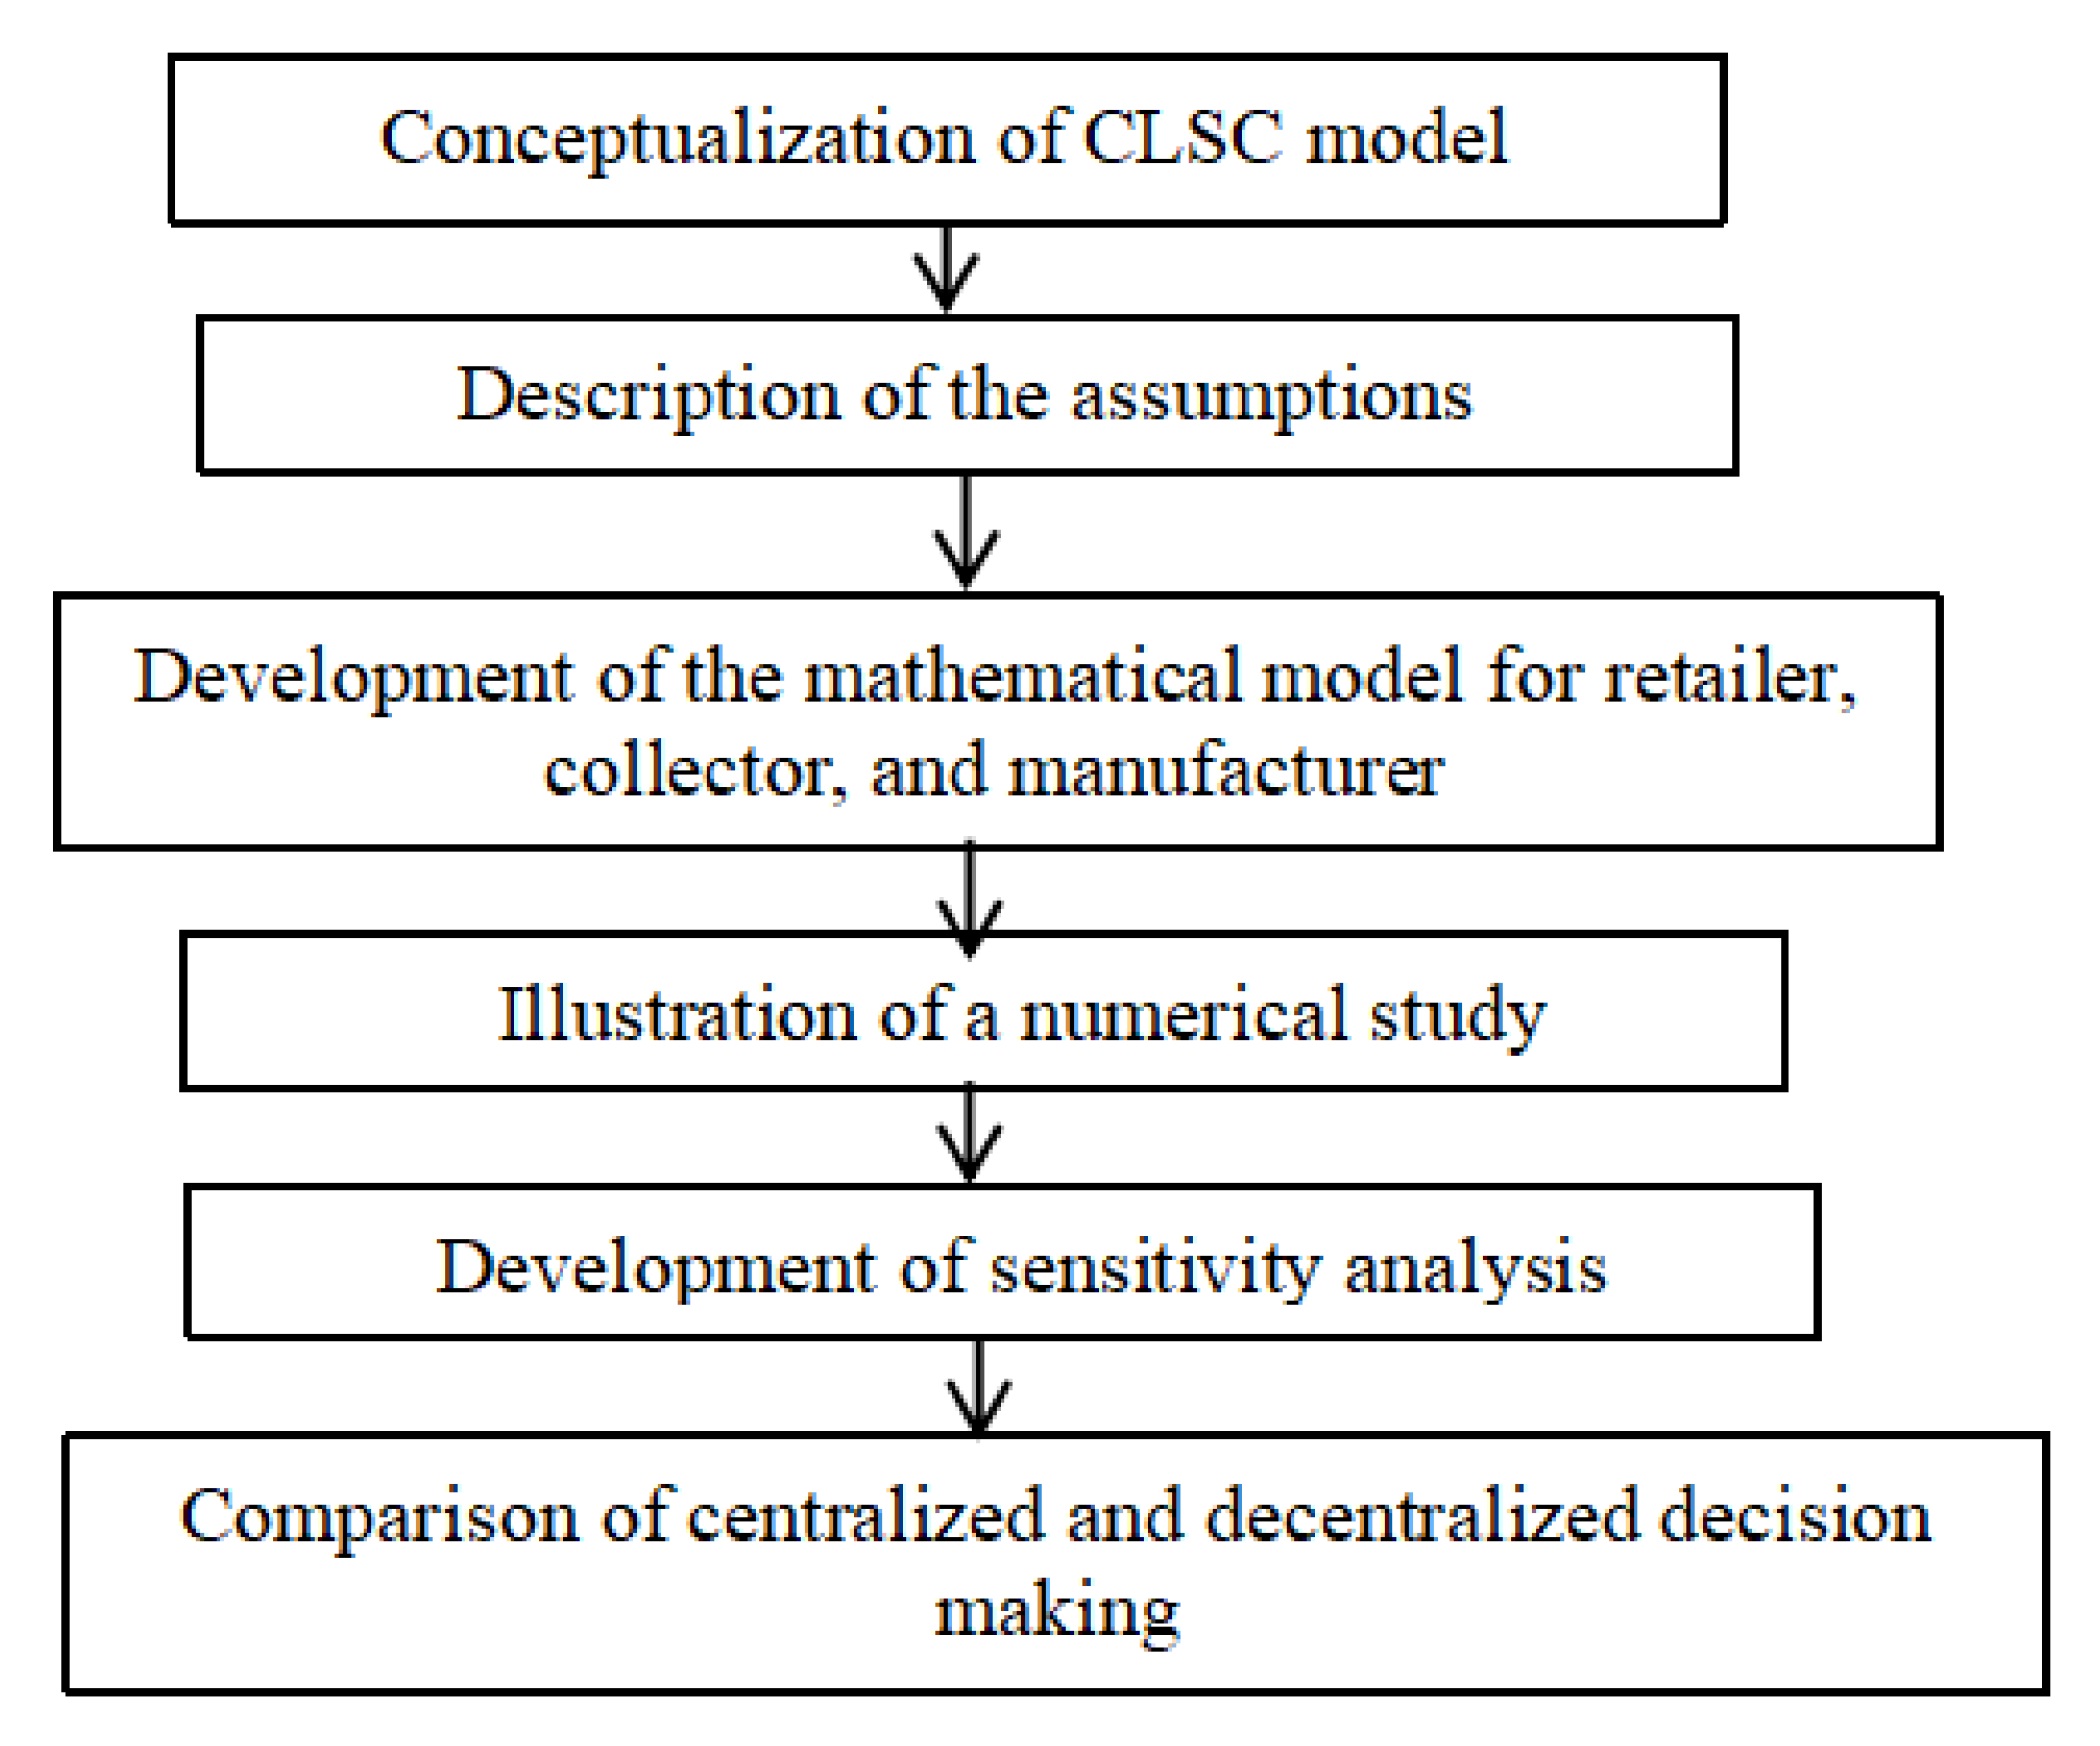
:1. Introduction
2. Literature Review
Research Gap
3. Key Assumptions and Notations
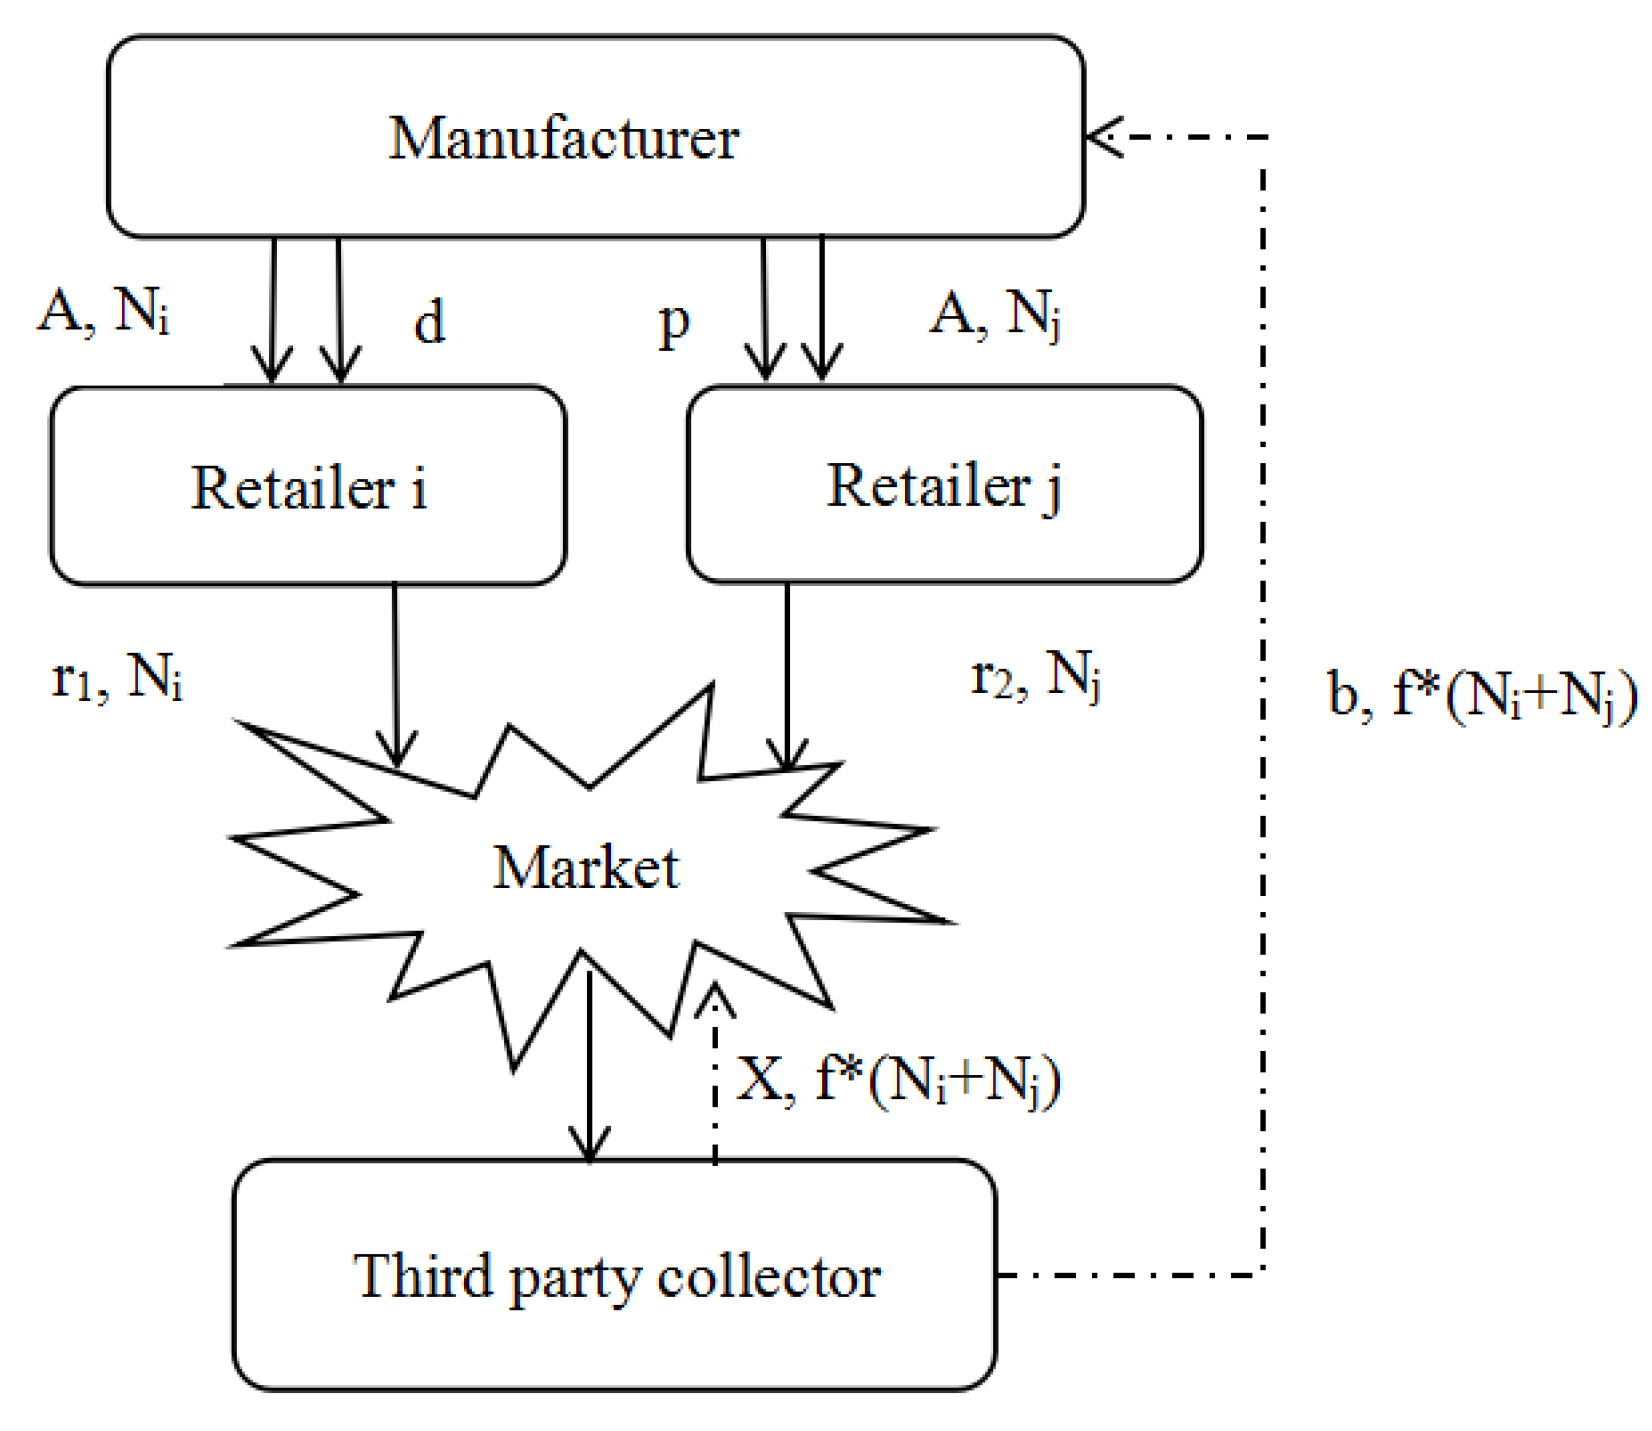
4. Model Development
4.1. Retailers’ Problem
4.1.1. Proposition
- (a)
- and are concave in r1 and r2, respectively.
- (b)
- There exists an optimal value for retail price r1 (r2), which maximizes the profit function ().
- (a)
- and where , > 0. Hence, and . This proves that and are concave in r1 and r2, respectively.
- (b)
- The optimum value of r1 can be obtained using the equation f(r1) = . Since , f(r1) is a decreasing function in r1. As the value of f(0) = 0 and f(∞) = −∞, there exists a unique solution for r1 (where 0 < r1 < ∞). Similarly, it can also be proved that there exists a unique solution for r2. ☐
4.1.2. Proposition
- (a)
- For the given d, the r2 diminishes at a quicker rate in comparison to r1 with p.
- (b)
- For the given p, the r1 diminishes at a quicker rate in comparison to r2 with d.
- (a)
- , Since > , is greater than . This proves that r2 decreases at a faster rate in comparison to r1 with p.
- (b)
- ,. Since >, is greater than . This proves that r1 decreases at a faster rate in comparison to r2 with d. ☐
4.1.3. Proposition
- (a)
- For a given d, Nj increases as the p increases.
- (b)
- For a given p, Ni increases as the d increases.
- (a)
- Since and > , Nj increases as the p increases.
- (b)
- Since and > , Ni increases as the d increases. ☐
4.2. Decision of the Collector
4.3. Manufacturer’s Problem
5. Numerical Study
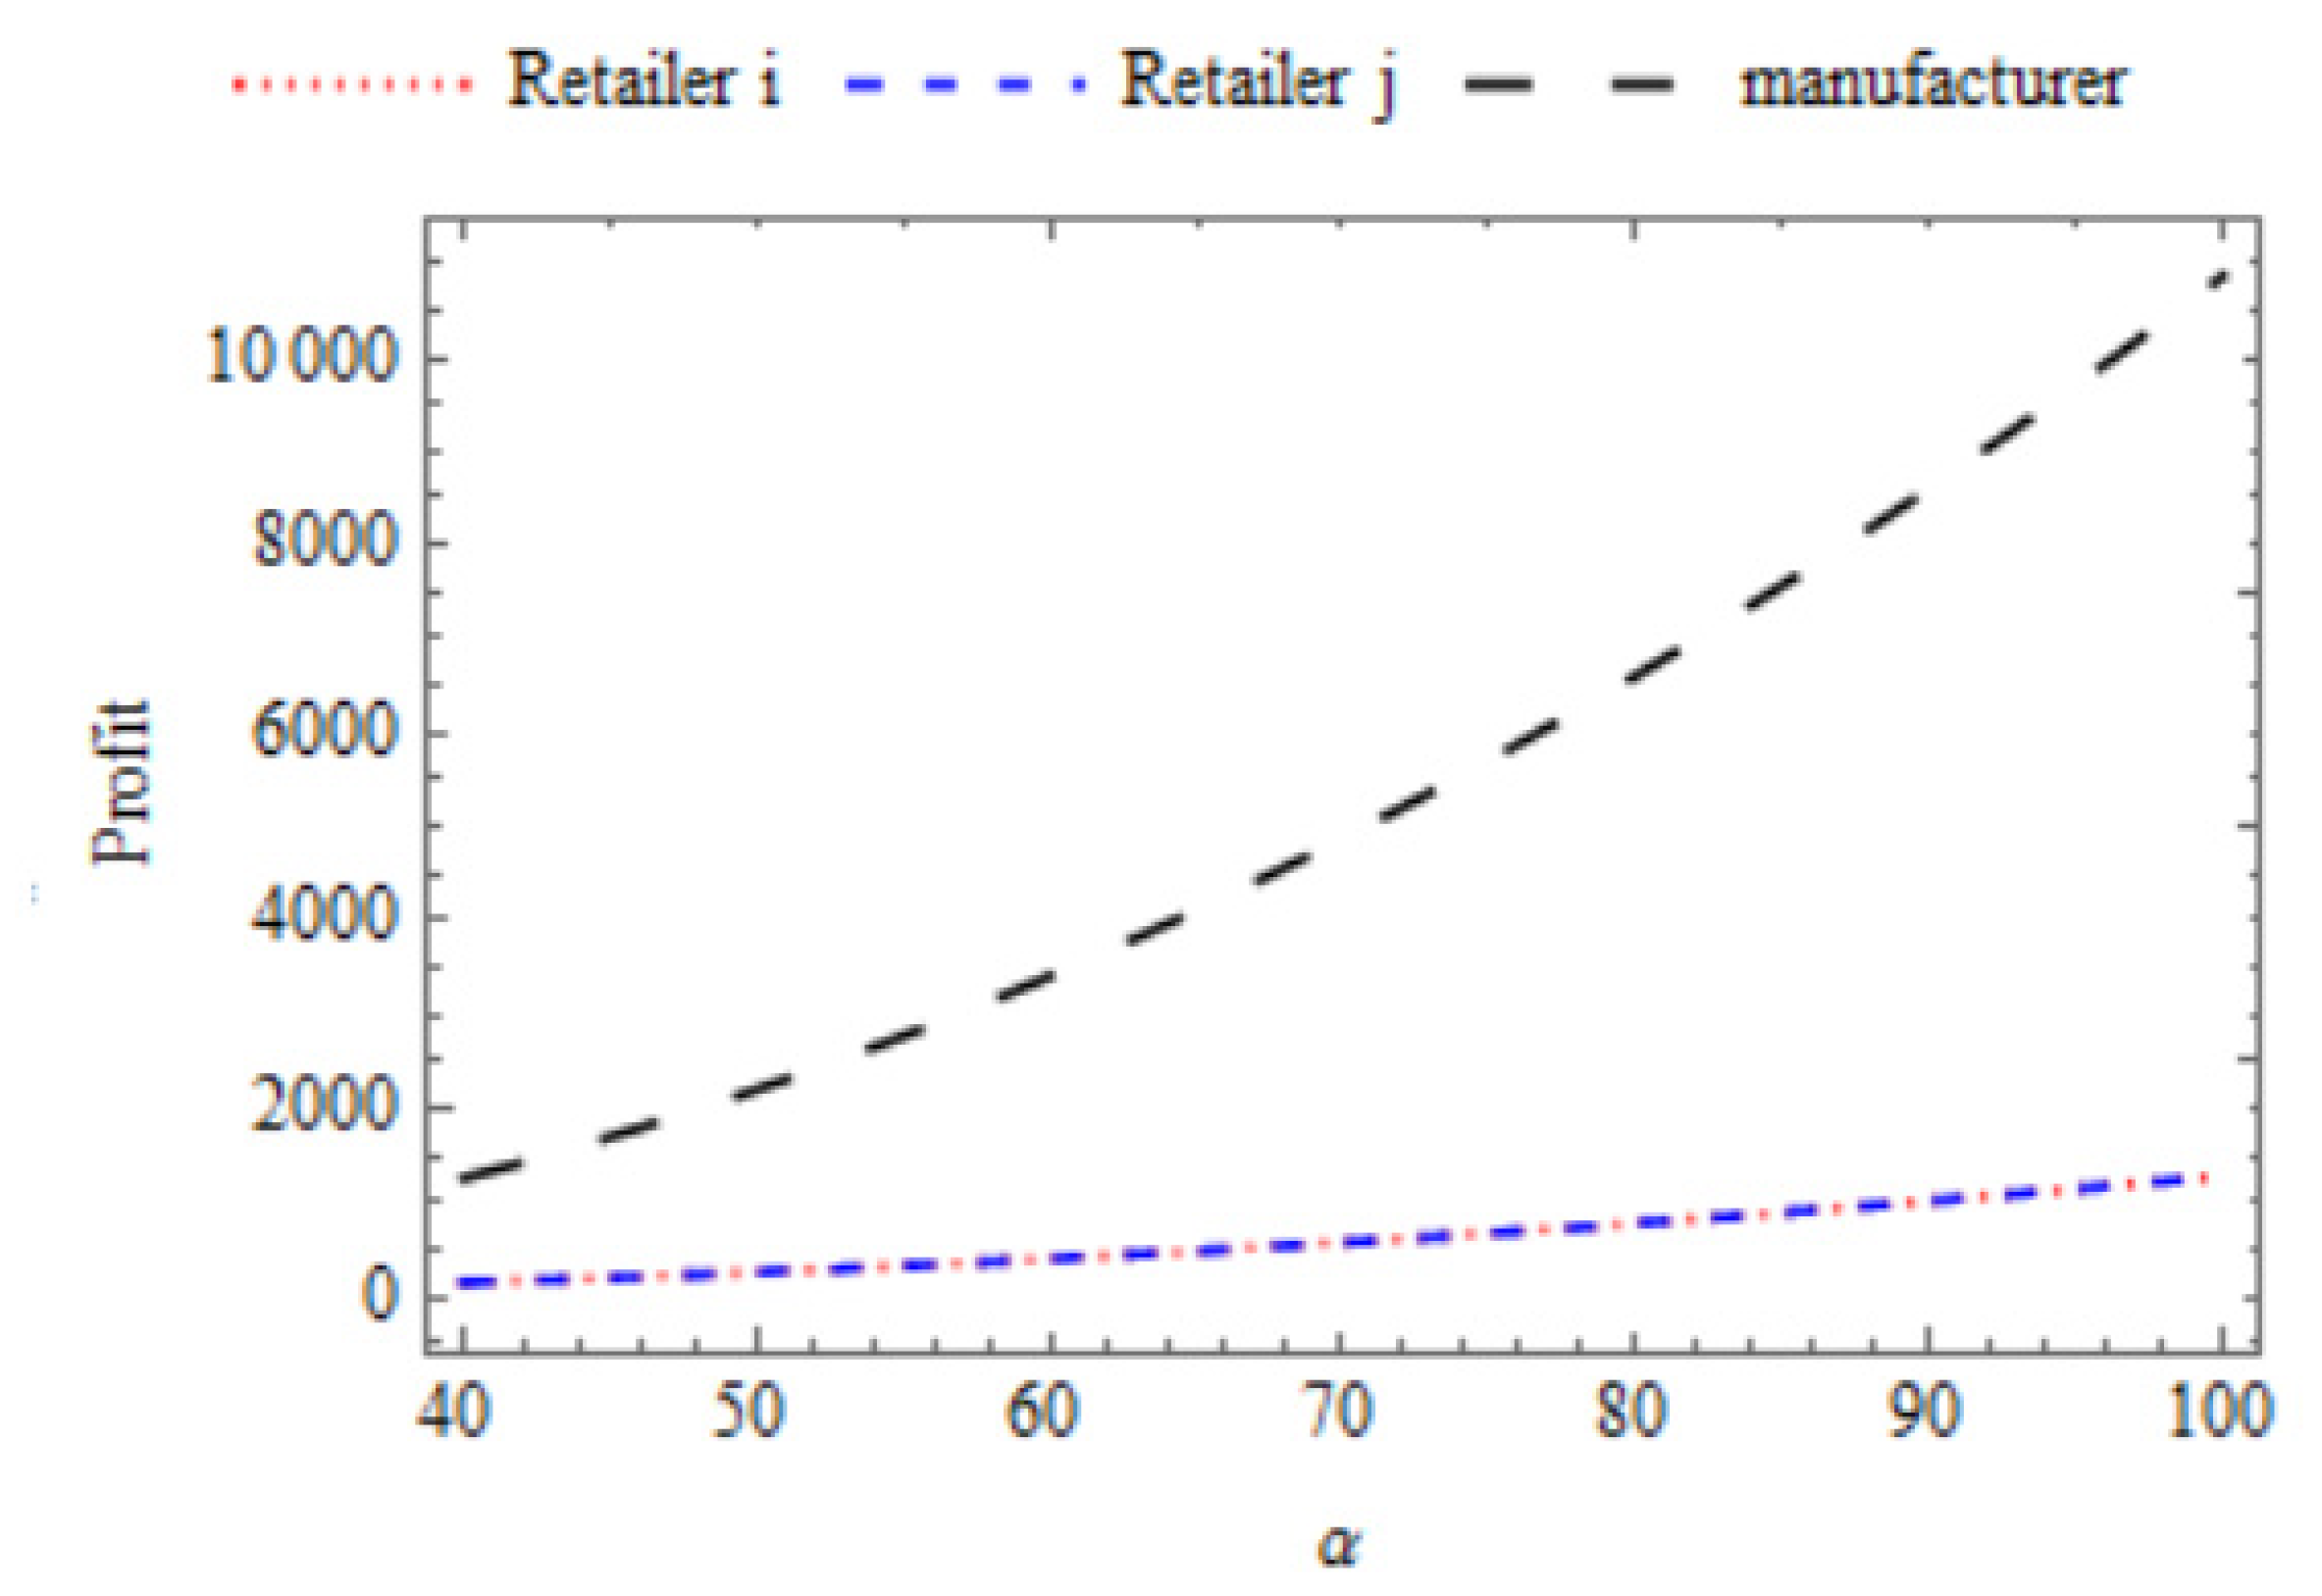
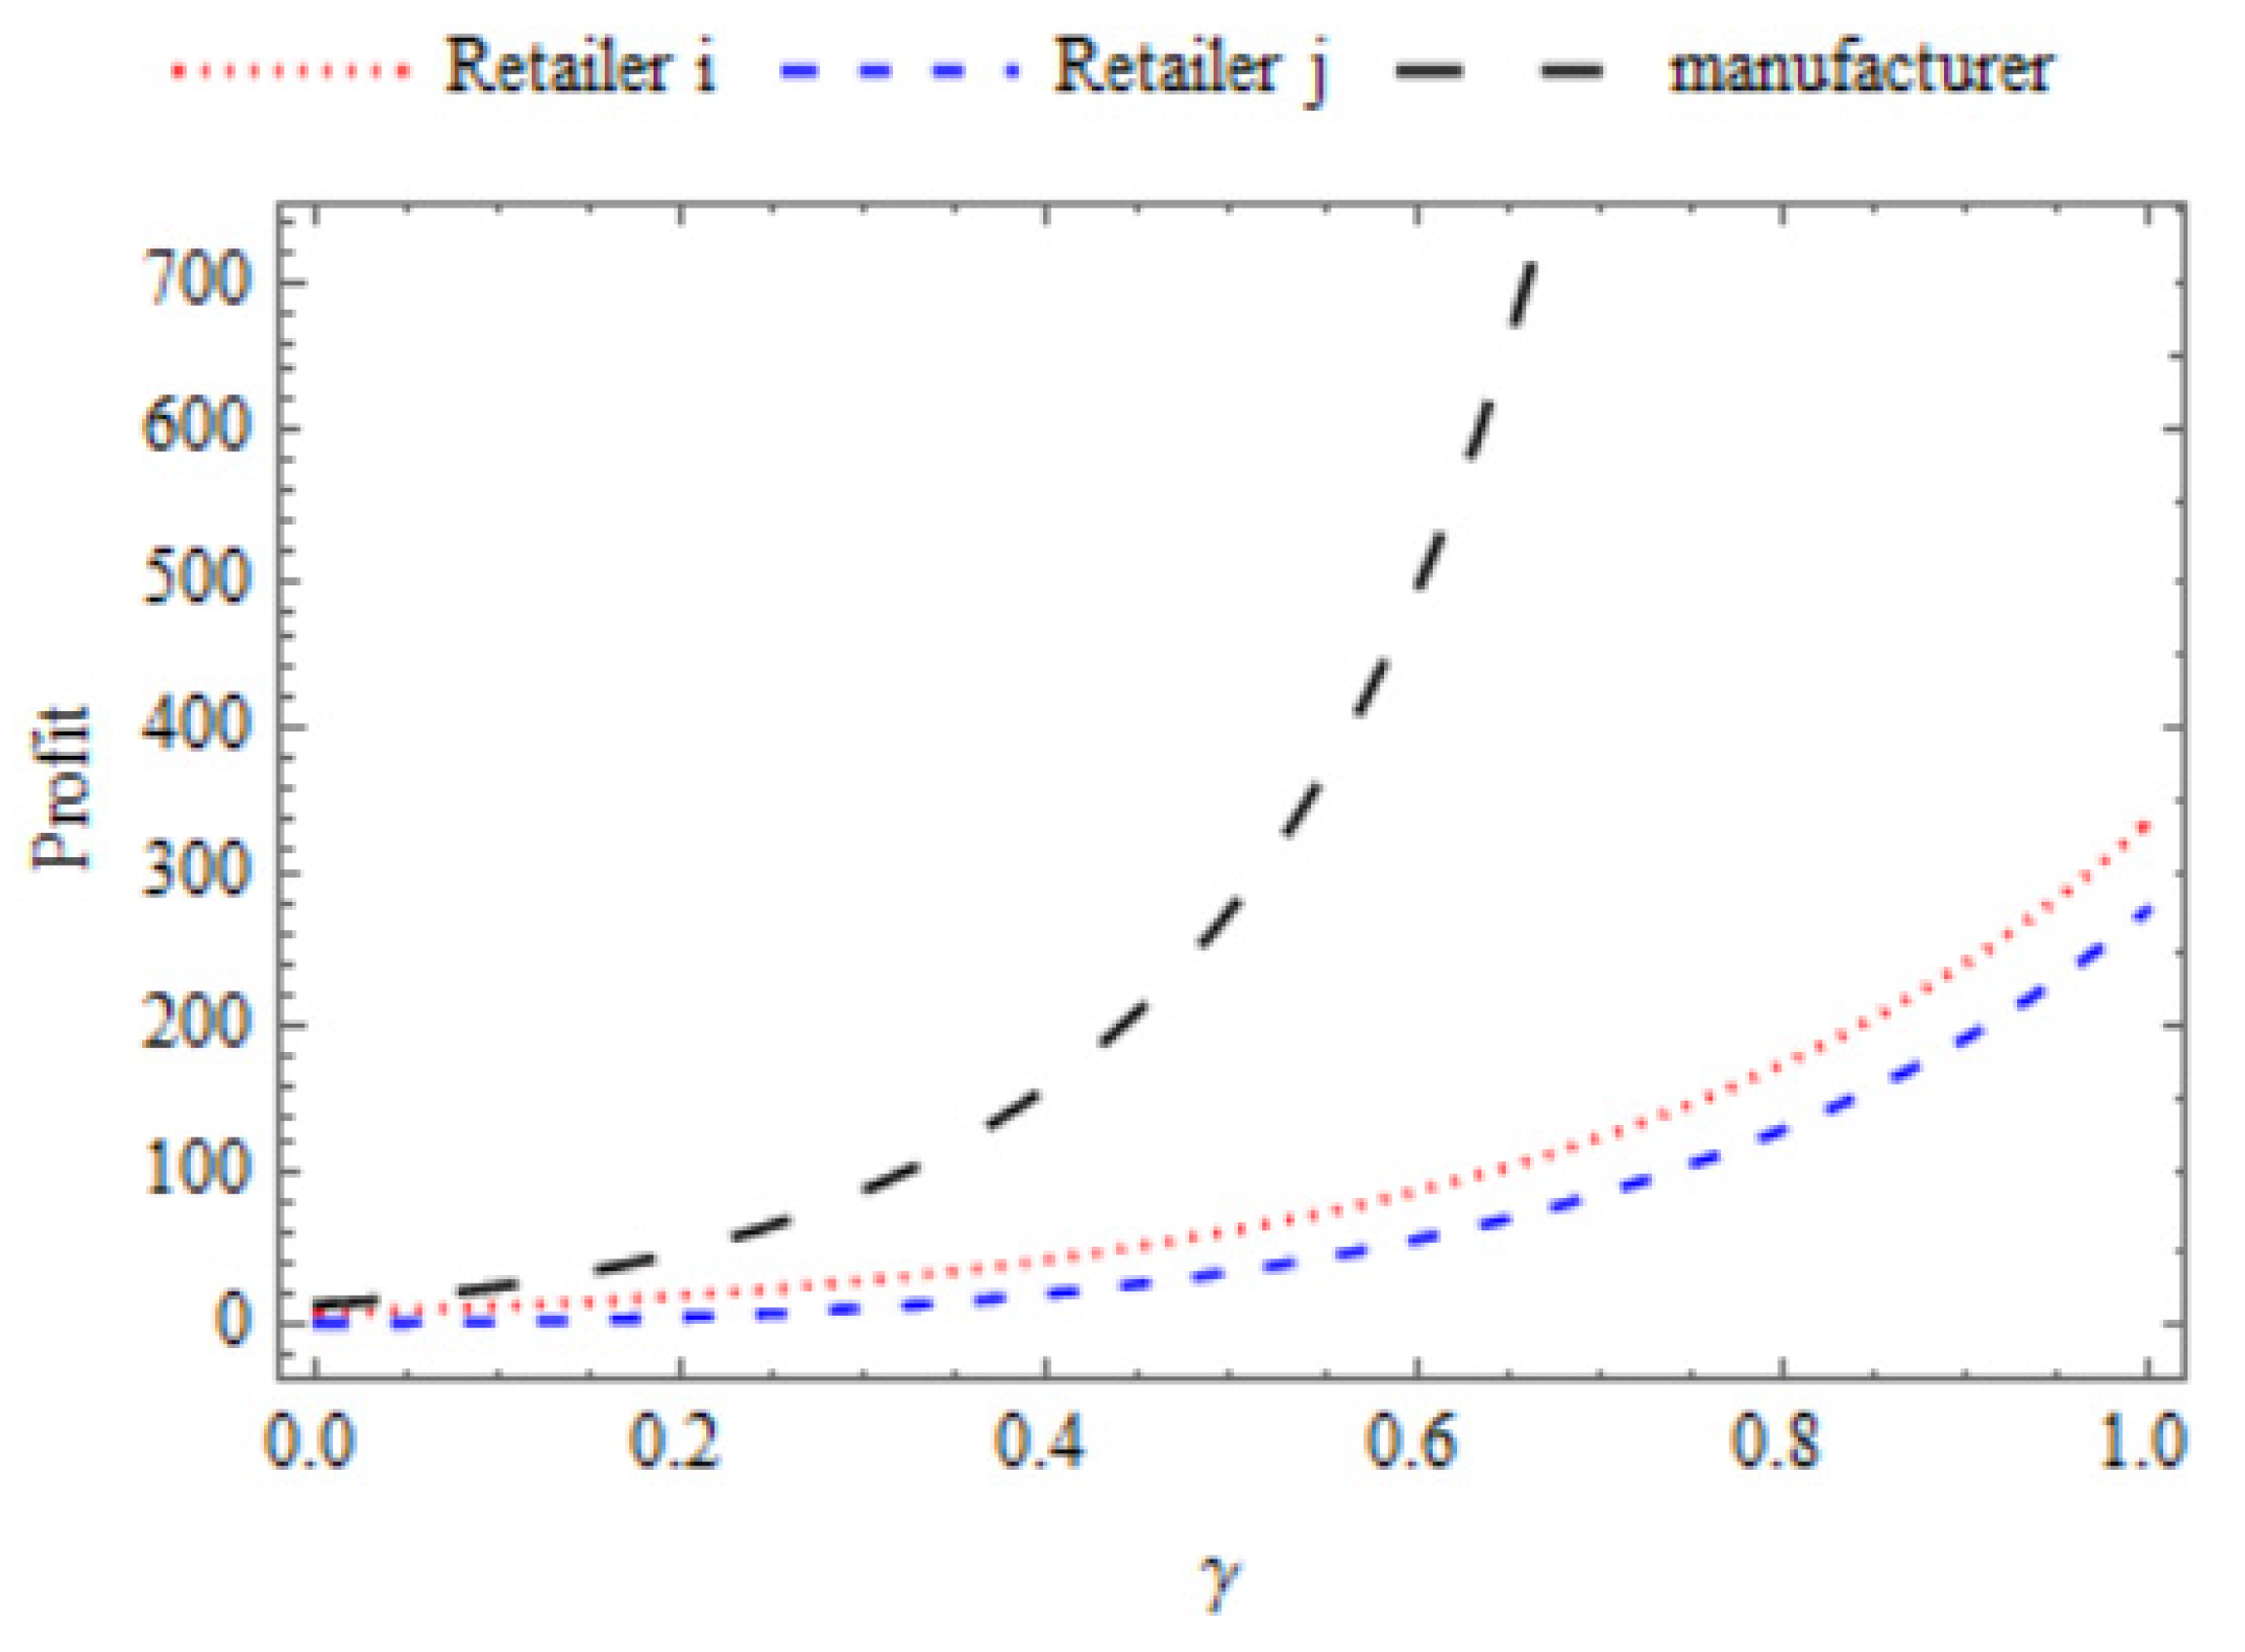
6. Sensitivity Analysis
6.1. Effect of the Market Size (α)
6.2. Effect of Price Elasticity (β)
6.3. Effect of Cross-Price Elasticity (γ)
7. Coordination Strategy in the Dual-Retailer Closed-Loop Supply Chain
8. Conclusions
Limitations and Future Work
Author Contributions
Funding
Informed Consent Statement
Conflicts of Interest
Appendix A
Appendix B
References
- Ferasso, M.; Beliaeva, T.; Kraus, S.; Clauss, T.; Ribeiro-Soriano, D. Circular economy business models: The state of research and avenues ahead. Bus. Strategy Environ. 2020, 29, 3006–3024. [Google Scholar] [CrossRef]
- Chauhan, A.; Jakhar, S.K.; Chauhan, C. The Interplay of Circular Economy with Industry 4.0 Enabled Smart City Drivers of Healthcare Waste Disposal. J. Clean. Prod. 2021, 279, 123854. [Google Scholar] [CrossRef] [PubMed]
- Kirchherr, J.; Reike, D.; Hekkert, M. Conceptualizing the circular economy: An analysis of 114 definitions. Resour. Conserv. Recycl. 2017, 127, 221–232. [Google Scholar] [CrossRef]
- Hazen, B.T.; Mollenkopf, D.A.; Wang, Y. Remanufacturing for the Circular Economy: An Examination of Consumer Switching Behavior: Remanufacturing Circular Economy Consumer Switching Behaviour. Bus. Strat. Environ. 2017, 26, 451–464. [Google Scholar] [CrossRef]
- Subramanian, R.; Subramanyam, R. Key Factors in the Market for Remanufactured Products. Manuf. Serv. Oper. Manag. 2012, 14, 315–326. [Google Scholar] [CrossRef] [Green Version]
- Milios, L.; Matsumoto, M. Consumer Perception of Remanufactured Automotive Parts and Policy Implications for Transi-tioning to a Circular Economy in Sweden. Sustainability 2019, 11, 6264. [Google Scholar] [CrossRef] [Green Version]
- Jiang, Z.; Ding, Z.; Zhang, H.; Cai, W.; Liu, Y. Data-driven ecological performance evaluation for remanufacturing process. Energy Convers. Manag. 2019, 198, 111844. [Google Scholar] [CrossRef]
- Chakraborty, K.; Mondal, S.; Mukherjee, K. Critical Analysis of Enablers and Barriers in Extension of Useful Life of Auto-motive Products through Remanufacturing. J. Clean. Prod. 2019, 227, 1117–1135. [Google Scholar] [CrossRef]
- Khor, K.S.; Hazen, B. Remanufactured products purchase intentions and behaviour: Evidence from Malaysia. Int. J. Prod. Res. 2016, 55, 2149–2162. [Google Scholar] [CrossRef]
- Awan, U.; Sroufe, R.; Shahbaz, M. Industry 4.0 and the circular economy: A literature review and recommendations for future research. Bus. Strat. Environ. 2021, 30, 2038–2060. [Google Scholar] [CrossRef]
- Feng, H.; Li, J.; Zhao, D. Retailer’s optimal replenishment and payment policies in the EPQ model under cash discount and two-level trade credit policy. Appl. Math. Model. 2013, 37, 3322–3339. [Google Scholar] [CrossRef]
- Giri, B.C.; Sharma, S. Optimising an integrated production–inventory system under cash discount and retailer partial trade credit policy. Int. J. Syst. Sci. Oper. Logist. 2017, 6, 99–118. [Google Scholar] [CrossRef]
- Feng, L.; Skouri, K.; Wang, W.-C.; Teng, J.-T. Optimal Selling Price, Replenishment Cycle and Payment Time among Ad-vance, Cash, and Credit Payments from the Seller’s Perspective. Ann. Oper. Res. 2020, 1–22. [Google Scholar] [CrossRef]
- Tsao, Y.-C.; Sheen, G.-J. A multi-item supply chain with credit periods and weight freight cost discounts. Int. J. Prod. Econ. 2012, 135, 106–115. [Google Scholar] [CrossRef]
- Kim, J.; Hwang, H.; Shinn, S. An Optimal Credit Policy to Increase Supplier’s Profits with Price-Dependent Demand Func-tions. Prod. Plan. Control 1995, 6, 45–50. [Google Scholar] [CrossRef]
- Shah, N.H.; Cárdenas-Barrón, L.E. Retailer’s decision for ordering and credit policies for deteriorating items when a supplier offers order-linked credit period or cash discount. Appl. Math. Comput. 2015, 259, 569–578. [Google Scholar] [CrossRef]
- Chung, K.-J.; Liao, J.-J.; Lin, S.-D.; Chuang, S.-T.; Srivastava, H.M. The Inventory Model for Deteriorating Items under Con-ditions Involving Cash Discount and Trade Credit. Mathematics 2019, 7, 596. [Google Scholar] [CrossRef] [Green Version]
- He, P.; He, Y.; Xu, H. Channel Structure and Pricing in a Dual-Channel Closed-Loop Supply Chain with Government Sub-sidy. Int. J. Prod. Econ. 2019, 213, 108–123. [Google Scholar] [CrossRef]
- Ruiz-Torres, A.J.; Mahmoodi, F.; Ohmori, S. Joint determination of supplier capacity and returner incentives in a closed-loop supply chain. J. Clean. Prod. 2019, 215, 1351–1361. [Google Scholar] [CrossRef]
- Jena, S.K.; Sarmah, S.P.; Padhi, S.S. Impact of government incentive on price competition of closed-loop supply chain systems. INFOR Inf. Syst. Oper. Res. 2017, 56, 192–224. [Google Scholar] [CrossRef]
- Hong, X.; Xu, L.; Du, P.; Wang, W. Joint advertising, pricing and collection decisions in a closed-loop supply chain. Int. J. Prod. Econ. 2015, 167, 12–22. [Google Scholar] [CrossRef]
- Hosseini-Motlagh, S.-M.; Nouri-Harzvili, M.; Johari, M.; Sarker, B.R. Coordinating economic incentives, customer service and pricing decisions in a competitive closed-loop supply chain. J. Clean. Prod. 2020, 255, 120241. [Google Scholar] [CrossRef]
- Genc, T.S.; De Giovanni, P. Optimal return and rebate mechanism in a closed-loop supply chain game. Eur. J. Oper. Res. 2018, 269, 661–681. [Google Scholar] [CrossRef] [Green Version]
- Alhawari, O.; Awan, U.; Bhutta, M.K.S.; Ülkü, M.A. Insights from Circular Economy Literature: A Review of Extant Defini-tions and Unravelling Paths to Future Research. Sustainability 2021, 13, 859. [Google Scholar] [CrossRef]
- Hartley, K.; van Santen, R.; Kirchherr, J. Policies for Transitioning towards a Circular Economy: Expectations from the Eu-ropean Union (EU). Resour. Conserv. Recycl. 2020, 155, 104634. [Google Scholar] [CrossRef]
- Reike, D.; Vermeulen, W.J.V.; Witjes, S. The circular economy: New or Refurbished as CE 3.0?—Exploring Controversies in the Conceptualization of the Circular Economy through a Focus on History and Resource Value Retention Options. Resour. Conserv. Recycl. 2018, 135, 246–264. [Google Scholar] [CrossRef]
- Chen, T.-L.; Kim, H.; Pan, S.-Y.; Tseng, P.-C.; Lin, Y.-P.; Chiang, P.-C. Implementation of green chemistry principles in circular economy system towards sustainable development goals: Challenges and perspectives. Sci. Total. Environ. 2020, 716, 136998. [Google Scholar] [CrossRef] [PubMed]
- Reddy, K.N.; Kumar, A. Capacity Investment and Inventory Planning for a Hybrid Manufacturing—Remanufacturing Sys-tem in the Circular Economy. Int. J. Prod. Res. 2021, 59, 2450–2478. [Google Scholar] [CrossRef]
- Wang, X.; Zhu, Y.; Sun, H.; Jia, F. Production decisions of new and remanufactured products: Implications for low carbon emission economy. J. Clean. Prod. 2018, 171, 1225–1243. [Google Scholar] [CrossRef]
- Singhal, D.; Tripathy, S.; Jena, S. Remanufacturing for the circular economy: Study and evaluation of critical factors. Resour. Conserv. Recycl. 2020, 156, 104681. [Google Scholar] [CrossRef]
- Zhang, T.; Chu, J.; Wang, X.; Liu, X.; Cui, P. Development pattern and enhancing system of automotive components remanufacturing industry in China. Resour. Conserv. Recycl. 2011, 55, 613–622. [Google Scholar] [CrossRef]
- van der Laan, E.; Salomon, M. Production Planning and Inventory Control with Remanufacturing and Disposal. Eur. J. Oper. Res. 1997, 102, 264–278. [Google Scholar] [CrossRef] [Green Version]
- Guide, V.R. Production planning and control for remanufacturing: Industry practice and research needs. J. Oper. Manag. 2000, 18, 467–483. [Google Scholar] [CrossRef]
- Yang, C.-H.; Liu, H.-B.; Ji, P.; Ma, X. Optimal acquisition and remanufacturing policies for multi-product remanufacturing systems. J. Clean. Prod. 2016, 135, 1571–1579. [Google Scholar] [CrossRef]
- Wei, J.; Zhao, J. Pricing decisions with retail competition in a fuzzy closed-loop supply chain. Expert Syst. Appl. 2011, 38, 11209–11216. [Google Scholar] [CrossRef]
- Alqahtani, A.Y.; Gupta, S.M. Warranty as a marketing strategy for remanufactured products. J. Clean. Prod. 2017, 161, 1294–1307. [Google Scholar] [CrossRef]
- Galbreth, M.R.; Blackburn, J.D. Optimal Acquisition and Sorting Policies for Remanufacturing. Prod. Oper. Manag. 2009, 15, 384–392. [Google Scholar] [CrossRef]
- Savaskan, R.C.; Bhattacharya, S.; Van Wassenhove, L.N. Closed-Loop Supply Chain Models with Product Remanufacturing. Manag. Sci. 2004, 50, 239–252. [Google Scholar] [CrossRef] [Green Version]
- Savaskan, R.C.; Van Wassenhove, L.N. Reverse Channel Design: The Case of Competing Retailers. Manag. Sci. 2006, 52, 1–14. [Google Scholar] [CrossRef] [Green Version]
- Choi, D.-W.; Hwang, H.; Koh, S.-G. A generalized ordering and recovery policy for reusable items. Eur. J. Oper. Res. 2007, 182, 764–774. [Google Scholar] [CrossRef]
- Jena, S.; Sarmah, S. Price competition and co-operation in a duopoly closed-loop supply chain. Int. J. Prod. Econ. 2014, 156, 346–360. [Google Scholar] [CrossRef]
- Mitra, S. Optimal pricing and core acquisition strategy for a hybrid manufacturing/remanufacturing system. Int. J. Prod. Res. 2015, 54, 1–18. [Google Scholar] [CrossRef]
- Wu, C.-H. Price and service competition between new and remanufactured products in a two-echelon supply chain. Int. J. Prod. Econ. 2012, 140, 496–507. [Google Scholar] [CrossRef]
- Huang, Y.-F. Optimal retailer’s ordering policies in the EOQ model under trade credit financing. J. Oper. Res. Soc. 2003, 54, 1011–1015. [Google Scholar] [CrossRef]
- Karimabadi, K.; Arshadi-khamseh, A.; Naderi, B. Optimal Pricing and Remanufacturing Decisions for a Fuzzy Du-al-Channel Supply Chain. Int. J. Syst. Sci. Oper. Logist. 2020, 7, 248–261. [Google Scholar]
- Goyal, S.K. Economic Order Quantity under Conditions of Permissible Delay in Payments. J. Oper. Res. Soc. 1985, 36, 335. [Google Scholar] [CrossRef]
- Moriarty, R.T.; Moran, U. Managing hybrid marketing systems. Harv. Bus. Rev. 1990, 68, 146–155. [Google Scholar]
- Chung, K. A Theorem on the Determination of Economic Order Quantity under Conditions of Permissible Delay in Pay-ments. Comput. Oper. Res. 1998, 25, 49–52. [Google Scholar] [CrossRef]
- Abad, P.L.; Jaggi, C.K. A Joint Approach for Setting Unit Price and the Length of the Credit Period for a Seller When End Demand Is Price Sensitive. Int. J. Prod. Econ. 2003, 83, 115–122. [Google Scholar] [CrossRef]
- Huang, Y.-F.; Chung, K.-J. Note: A note on the production and inventory systems taking account of time value. Prod. Plan. Control 2003, 14, 673–675. [Google Scholar] [CrossRef]
- Huang, Y. A Closed-Loop Supply Chain with Trade-In Strategy under Retail Competition. Math. Probl. Eng. 2018, 2018, 1–16. [Google Scholar] [CrossRef] [Green Version]
- Wallace, D.W.; Giese, J.L.; Johnson, J.L. Customer retailer loyalty in the context of multiple channel strategies. J. Retail. 2004, 80, 249–263. [Google Scholar] [CrossRef]
- Cai, G.G.; Zhang, Z.G.; Zhang, M. Game theoretical perspectives on dual-channel supply chain competition with price discounts and pricing schemes. Int. J. Prod. Econ. 2009, 117, 80–96. [Google Scholar] [CrossRef]
- Liu, B.; Zhang, R.; Xiao, M. Joint decision on production and pricing for online dual channel supply chain system. Appl. Math. Model. 2010, 34, 4208–4218. [Google Scholar] [CrossRef]
- Mitra, S.; Webster, S. Competition in remanufacturing and the effects of government subsidies. Int. J. Prod. Econ. 2008, 111, 287–298. [Google Scholar] [CrossRef]
- Tsao, Y.-C. Managing a retail-competition distribution channel with incentive policies. Appl. Math. Model. 2011, 35, 4140–4148. [Google Scholar] [CrossRef]
- Tsao, Y.-C.; Sheen, G.-J. Dynamic Pricing, Promotion and Replenishment Policies for a Deteriorating Item under Permissi-ble Delay in Payments. Comput. Oper. Res. 2008, 35, 3562–3580. [Google Scholar] [CrossRef]
- Li, X.; Li, Y.; Govindan, K. An incentive model for closed-loop supply chain under the EPR law. J. Oper. Res. Soc. 2014, 65, 88–96. [Google Scholar] [CrossRef]
- Song, H.; Chu, H. Incentive Strategies of Different Channels in an Electric Vehicle Battery Closed-Loop Supply Chain. Procedia Comput. Sci. 2019, 162, 634–641. [Google Scholar] [CrossRef]
- Manouchehrabadi, M.K.; Yaghoubi, S. A game theoretic incentive model for closed-loop solar cell supply chain by considering government role. Energy Sour. Part A Recover. Util. Environ. Eff. 2020, 1–25. [Google Scholar] [CrossRef]
- Wang, X.; Zhang, Z.; Yang, L.; Zhao, J. Price and capacity decisions in a telemedicine service system under government subsidy policy. Int. J. Prod. Res. 2021, 59, 5130–5143. [Google Scholar] [CrossRef]
- Che, C.; Zhang, X.; Chen, Y.; Zhao, L.; Zhang, Z. A Model of Waste Price in a Symbiotic Supply Chain Based on Stackelberg Algorithm. Sustainability 2021, 13, 1740. [Google Scholar] [CrossRef]
- Wan, G.; Kou, G.; Li, T.; Xiao, F.; Chen, Y. Pricing Policies in a Retailer Stackelberg O2O Green Supply Chain. Sustainability 2020, 12, 3236. [Google Scholar] [CrossRef] [Green Version]
- Su, J.; Li, C.; Tsai, S.-B.; Lu, H.; Liu, A.; Chen, Q. A Sustainable Closed-Loop Supply Chain Decision Mechanism in the Elec-tronic Sector. Sustainability 2018, 10, 1295. [Google Scholar] [CrossRef] [Green Version]
- Li, Z.; Xu, Y.; Deng, F.; Liang, X. Impacts of Power Structure on Sustainable Supply Chain Management. Sustainability 2017, 10, 55. [Google Scholar] [CrossRef] [Green Version]
- Shevchenko, T.; Laitala, K.; Danko, Y. Understanding Consumer E-Waste Recycling Behavior: Introducing a New Economic Incentive to Increase the Collection Rates. Sustainability 2019, 11, 2656. [Google Scholar] [CrossRef] [Green Version]
- Wang, Y.; Wiegerinck, V.; Krikke, H.; Zhang, H. Understanding the Purchase Intention towards Remanufactured Product in Closed-Loop Supply Chains: An Empirical Study in China. Int. J. Phys. Distrib. Logist. Manag. 2013, 43, 866–888. [Google Scholar] [CrossRef]
- Chen, J.-M.; Chang, C.-I. Dynamic pricing for new and remanufactured products in a closed-loop supply chain. Int. J. Prod. Econ. 2013, 146, 153–160. [Google Scholar] [CrossRef]
- Gan, S.-S.; Pujawan, I.N.; Widodo, B. Pricing decision for new and remanufactured product in a closed-loop supply chain with separate sales-channel. Int. J. Prod. Econ. 2017, 190, 120–132. [Google Scholar] [CrossRef] [Green Version]
- Awan, U. Industrial Ecology in Support of Sustainable Development Goals. In Encyclopedia of the UN Sustainable Development Goals; Springer: Cham, Switzerland, 2020; pp. 370–380. [Google Scholar]
- Zhen, L.; Huang, L.; Wang, W. Green and sustainable closed-loop supply chain network design under uncertainty. J. Clean. Prod. 2019, 227, 1195–1209. [Google Scholar] [CrossRef]
- Sun, X.; Zhou, Y.; Li, Y.; Govindan, K.; Han, X. Differentiation competition between new and remanufactured products considering third-party remanufacturing. J. Oper. Res. Soc. 2020, 71, 161–180. [Google Scholar] [CrossRef]


| Symbol | Description |
|---|---|
| i, j | Retailer1, retailer2 |
| mr | manufacturer |
| t | Third party collector |
| r1, r2 | Retail price for retailer i, retailer j |
| d | Cash discount |
| p | Credit period |
| A | Declared wholesale price |
| Ni, Nj | Order quantity by retailer i, retailer j |
| Πmt | Total profit of the manufacturer |
| Πi, Πj | Profit of the retailer i, retailer j |
| Πt | Profit of the third party collector |
| Total profit of non-coordinated system | |
| Total profit of coordinated chain | |
| α1,α2 | Market size for retailer i, retailer j |
| β1,β2 | Price elasticity for retailer i, retailer j |
| γ1,γ2 | Cross price elasticity for retailer i, retailer j |
| f | The fraction of the used products collected |
| k | Capital opportunity cost |
| b | Transfer price |
| X | Amount paid to consumers |
| m | Cost of manufacturing |
| n | The difference between manufacturing and remanufacturing cost |
| l | Collection parameter |
| p* | d* | r1* | Ni* | r2* | Nj* | f* | |||||
|---|---|---|---|---|---|---|---|---|---|---|---|
| mr | 1.14 | 0.07 | 889.86 | - | - | - | - | - | - | - | - |
| i | - | - | - | 84.94 | 11.16 | 124.59 | - | - | - | - | - |
| j | - | - | - | - | - | - | 80.14 | 9.31 | 86.68 | - | - |
| t | - | - | - | - | - | - | - | - | - | 0.10 | 5.25 |
| γ1, γ2 | β1, β2 | ||
|---|---|---|---|
| 1 | 1.2 | 1.5 | |
| 0.7 | p* = 1.145, d* = 0.0777 | p* = 4.005, d* = 0.367 | p* = 5.57, d* = 0.529 |
| = 124.59 | = 57.19 | = 15.34 | |
| = 86.68 | = 33.59 | = 5.11 | |
| = 889.86 | = 295.23 | = 54.33 | |
| r1* = 84.94, r2* = 80.14 | r1* = 57.48, r2* = 53.24 | r1* = 40.83, r2* = 37.20 | |
| β1, β2 | γ1, γ2 | ||
|---|---|---|---|
| 0.3 | 0.5 | 0.7 | |
| 1 | p* = 5.294, d* = 0.48 | p* = 4.044, d* = 0.362 | p* = 1.145, d* = 0.0777 |
| = 28.95 | = 62.35 | = 124.59 | |
| = 10.28 | =34.76 | = 86.68 | |
| = 90.07 | = 279.19 | = 889.86 | |
| r1* = 46.87, r2* = 40.85 | r1* = 58.87, r2* = 53.54 | r1* = 84.94, r2* = 80.14 | |
Publisher’s Note: MDPI stays neutral with regard to jurisdictional claims in published maps and institutional affiliations. |
© 2021 by the authors. Licensee MDPI, Basel, Switzerland. This article is an open access article distributed under the terms and conditions of the Creative Commons Attribution (CC BY) license (https://creativecommons.org/licenses/by/4.0/).
Share and Cite
Singhal, D.; Jena, S.K.; Aich, S.; Tripathy, S.; Kim, H.-C. Remanufacturing for Circular Economy: Understanding the Impact of Manufacturer’s Incentive under Price Competition. Sustainability 2021, 13, 11839. https://doi.org/10.3390/su132111839
Singhal D, Jena SK, Aich S, Tripathy S, Kim H-C. Remanufacturing for Circular Economy: Understanding the Impact of Manufacturer’s Incentive under Price Competition. Sustainability. 2021; 13(21):11839. https://doi.org/10.3390/su132111839
Chicago/Turabian StyleSinghal, Deepak, Sarat Kumar Jena, Satyabrata Aich, Sushanta Tripathy, and Hee-Cheol Kim. 2021. "Remanufacturing for Circular Economy: Understanding the Impact of Manufacturer’s Incentive under Price Competition" Sustainability 13, no. 21: 11839. https://doi.org/10.3390/su132111839