Article

Artificial Neural Network Led Optimization of Oxyhydrogen Hybridized Diesel Operated Engine

1
Department of Mechanical Engineering, University of Engineering and Technology, Lahore 54890, Pakistan
2
Department of Mechanical Engineering, National University of Singapore, Singapore 117575, Singapore
3
Department of Physics, University of Engineering and Technology Lahore, Lahore 54890, Pakistan
4
Center for Energy Science, Department of Mechanical Engineering, University of Malaya, Kuala Lumpur 50603, Malaysia
5
Department of Mechanical Engineering, New Campus, University of Engineering and Technology, Lahore 54890, Pakistan
6
Department of Mechanical Engineering, School of Technology, Glocal University, Delhi-Yamunotri Marg, SH-57, Mirzapur Pole, Saharanpur 247121, Uttar Pradesh, India
*
Authors to whom correspondence should be addressed.
Sustainability 2021, 13(16), 9373; https://doi.org/10.3390/su13169373
Submission received: 9 July 2021 / Revised: 9 August 2021 / Accepted: 17 August 2021 / Published: 20 August 2021

Abstract

:
The prevailing massive exploitation of conventional fuels has staked the energy accessibility to future generations. The gloomy peril of inflated demand and depleting fuel reservoirs in the energy sector has supposedly instigated the urgent need for reliable alternative fuels. These very issues have been addressed by introducing oxyhydrogen gas (HHO) in compression ignition (CI) engines in various flow rates with diesel for assessing brake-specific fuel consumption (BSFC) and brake thermal efficiency (BTE). The enrichment of neat diesel fuel with 10 dm3/min of HHO resulted in the most substantial decrease in BSFC and improved BTE at all test speeds in the range of 1000–2200 rpm. Moreover, an Artificial Intelligence (AI) approach was employed for designing an ANN performance-predicting model with an engine operating on HHO. The correlation coefficients (R) of BSFC and BTE given by the ANN predicting model were 0.99764 and 0.99902, respectively. The mean root errors (MRE) of both parameters (BSFC and BTE) were within the range of 1–3% while the root mean square errors (RMSE) were 0.0122 kg/kWh and 0.2768% for BSFC and BTE, respectively. In addition, ANN was coupled with the response surface methodology (RSM) technique for comprehending the individual impact of design parameters and their statistical interactions governing the output parameters. The R2 values of RSM responses (BSFC and BTE) were near to 1 and MRE values were within the designated range. The comparative evaluation of ANN and RSM predicting models revealed that MRE and RMSE of RSM models are also well within the desired range but to be outrightly accurate and precise, the choice of ANN should be potentially endorsed. Thus, the combined use of ANN and RSM could be used effectively for reliable predictions and effective study of statistical interactions.

1. Introduction

Ever-growing industrialization and unprecedented use of non-renewable fuels have brought us to a very feeble junction where we have to be a bit vigilant or we may run out of fossil fuels [1]. Hydrocarbon reserves found in nature are going to become extinct in the future if we continue using them without any restrictions because these reserves are being consumed at a rate faster than their formation [2,3]. The world energy demand is excessively soaring and is likely to be 28% higher in 2040 if consumption continues at the current pace. The intensifying pressure of depleting energy resources and fear of damage to the environment has consequently made scientists to look for alternative or green fuels. The use of oxygenated, alcoholic, and hydrogen fuels in CI engines has been the locus of interest of engineers for the past few years [4,5,6,7,8,9,10].
Compression ignition (CI) engines have long been the power generation source for heavy machinery in energy and aquatic transport owing to their high efficiency, torque, and feasibility of operation on a lean mixture of air and fuel [11]. Diesel is a commonly used fuel in CI engines. However, due to the incessant usage of fossil fuels to generate diesel, the focus of the researchers, engineers, and scientists made a paradigm shift towards the study of more efficient, promising, and greener fuels [12,13,14,15,16].
Hydrogen itself cannot be used in CI engines due to its high auto-ignition temperatures, which requires a very high compression ratio, but it can be mixed with fuel with low autoignition temperatures. Hydrogen gas is a good blending agent and could be effectively used in engines because of its low ignition temperature and high flammability [17]. The use of hydrogen as a mixing fuel is a concept with novelty and therefore much work has been reported. The earliest studies were conducted by T. Litzinger et al. on the operations of the IC Engines with multi-blended fuels. They validated the role of H2 inside the IC engines and found it as a potential replacement of fossil fuels [18]. Moreover, with scientific and technological development, many researchers have discovered that H2 can be used as a blend with other gases to reduce its combustibility and increase its ignition energy. H.K Abdel Aal carried out one such study to generate a safe method of H2 enrichment by using methane as a blending agent with H2. He used Le Chatelier’s principle for predicting flammability and determining a safe ratio [19].
Similarly, among many fuels available for mixing, the use of diesel has also been an area of interest of researchers [20,21]. Kadir Aydin et al. conducted experimentation on a Mitsubishi 4 stroke CI engine using HHO gas dm3/min as a blended fuel with diesel. They observed a 19.1% increase in brake power (BP) and a 14% decrease in brake-specific fuel consumption (BSFC) with the addition of HHO as compared with simple diesel. Their study identified 1750 rpm as a critical speed, below which the HHO addition was not favorable for engine performance [22]. Similarly, Alfredas et al. used an Audi 1.9 TDI (IZ type) CI engine to investigate the effect of HHO addition at three liters per minute (LPM) with diesel on the performance of the engine. Within the rpm range of 1900–3700, HHO proved to be favorable for engine performance [23]. Ali Yimilaz et al. also studied the outcome of HHO addition on engine performance and reported that engine torque was amplified by 19.1%, and an average gain of 14% was achieved using HHO [24]. The effect of HHO gas on the performance of a Mitsubishi Canter brand, four-stroke, water-cooled diesel engine was conducted by Raif et al. They varied the flow rate of HHO from 3 LPM to 7 LPM and observed that with HHO enrichment, the torque and brake power increased, whereas fuel consumption decreased [25]. HHO has also the potential to be used as a blending agent with other fuels. In this regard, Usman et al. used HHO with LPG and CNG and reported improved performance and reduced emissions with the addition of HHO for both cases [26].
Owing to the cost and time of simply random experiments, researchers nowadays are utilizing computer systems to attain similar efficiency by performing the least number of experimental runs. Artificial neural network (ANN) and response surface methodology (RSM) techniques are currently used to solve problems in science and engineering, especially where classical modeling methods have pathetically failed. The predictive capability of the ANN model is based on the training of experimental data values and followed by validation. If new data values are not desired, the ANN model may re-learn to enhance the performance [27,28]. Raif Kenanoglu et al. used an artificial neural network for performance and emission analysis of a hydroxy gas-enriched CI engine for odd flow rates of 3.5 and 7 L/min. They used the Levenberg-Marquardt (LM) training function and found a 95.82% accuracy for torque [29]. Similarly, Yildrium et al. studied the effect of HHO enrichment on three different biodiesels using ANN. They used artificial intelligence for fixing optimum hydrogen enrichment and found that developed models had a coefficient of determination close to 1 [30].
Similarly, the RSM has the statistical regression technique for prediction [31,32]. Over the last few years, the combined application of ANN and RSM methods has been hailed with significant success in the power industry. Ghobadian et al. utilized diesel and biodiesel fuel blends for ANN-based prediction of performance and emission. The developed ANN model was viable with correlation coefficients (R-values) of 0.999 and 0.9487 for BSFC and torque, respectively [33]. The ANN coupled RSM-based optimization of SI engine was carried by Samet Uslu et al., which rendered the use of the ANN-supported RSM model as an effective tool for performance prediction [34].
Considering the literature cited, the use of ANN for predicting the performance of engines fueled with diesel HHO blends has already been studied [30]. However, the optimization of the engine with the same blend has not been reported so far. In the current study, ANN was used to predict the performance (BSFC and BTE) of a CI engine operating on diesel with HHO in flow rates of 2–10 LPM. Moreover, the ANN-assisted RSM optimization was applied to identify the optimized working conditions. The obtained optimum conditions were validated using experimentation. Thus, the combined use of artificial intelligence and RSM proved valuable in estimating and optimizing the performance of a CI engine.

2. Materials and Methods

2.1. HHO Generator

The HHO (hydroxy gas) was produced using an Ironside HHO Generator, shown in Figure 1. The features of the used HHO generator are itemized in Table 1. The power to the electrical unit was supplied using an AC source. Water was ionized using potassium hydroxide as a catalyst that generated hydrogen (positive charge) and hydroxide (negative charge) ions. On supplying the potential across ionized water, the generated HHO traversed first from a bubbler and later from a flow meter. Prior to injection in the engine’s intake manifold, the flow rate of the gas was monitored using the flow meter. The potentiometer was connected with the electrical box for regulating the flow through the cell.

2.2. Experimental Methodology and Test Fuels

A direct injection, four-stroke, three-cylinder diesel engine was used for performance tests whose specifications are shown in Table 2. The speed, load, and fuel flow measuring system were equipped with the engine, as comprehensively demonstrated in the experimental setup (see Figure 2). The engine was attached with a 3-phase AC generator having 85% efficiency. Five breakers with equal loading capacity were utilized from the control unit, as shown in the schematic of the engine testbed (Figure 3). The loads were applied to the test engine utilizing the generator.
The fuels used for conducting the experimental runs were pure diesel and HHO-mixed diesel with 2, 4, 6, 8, and 10 LPM enrichment. The physicochemical properties of liquid and gaseous fuels are shown in Table 3.
First, the diesel engine was allowed to warm up for 10 min ahead of recording the experimental observations. The tests were started at an engine speed of 1000 rpm and ceased at 2200 rpm, with equal increments of 200 rpm at each stage. The performance parameters, BSFC and BTE, were calculated at each constant strategic engine speed with varying loads (9%, 18%, 27%, 36%, 45%) and HHO concentration of 2, 4, 6, 8, and 10 LPM by using the following mathematical modelling equations:
BTE = Break   Power × 3600 Fuel   Consumption × Calorific   Value
BSFC = Fuel   Consumption Break   Power
Considering all the possible combinations of continuously varying factors, 210 experimental observations were documented. The experimental work was restricted to lower half partial loading conditions considering the safety aspect associated with HHO utilization in engine. Moreover, using hydrogen accompanies better combustion and higher flame speed and temperature inside the engine, which may lead to thermal degradation if operated at higher loading conditions. Later, the ANN technique was implemented for designing the predictable model of engine performance. Finally, the performance was optimized using response surface methodology (RSM) and the desirability aspect was investigated.

3. Experimental Results and Discussion

Non-renewable fuels are normally associated with enhanced performance and reduced exhaust emissions [35]. Hydroxy gas is believed to facilitate cleaner and smoother combustion compared with conventional fuels. The experimental deliverables significantly demonstrated the decrease in BSFC and increase in BTE by virtue of HHO addition to diesel. The detailed effect of HHO on performance parameters is presented in the following sections.

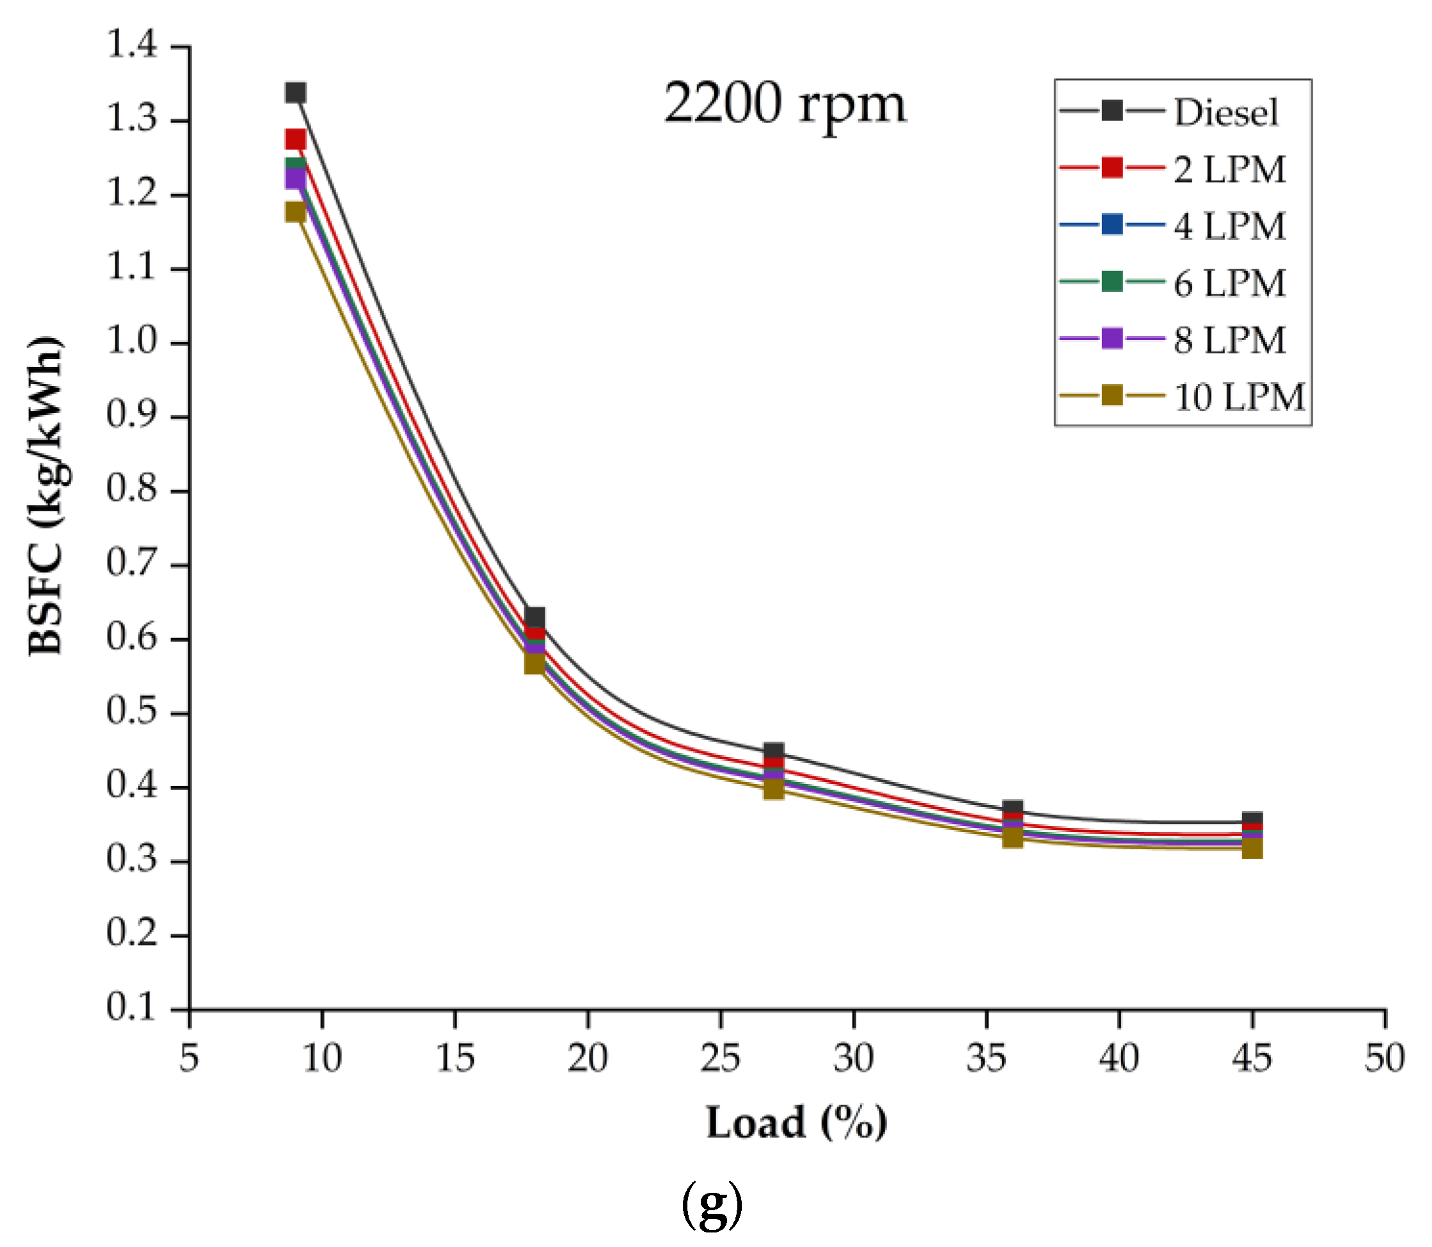
3.1. Brake Specific Fuel Consumption

The patterns of BSFC variation with varying flow rate and engine load are shown in Figure 4a–g. The BSFC of all operating conditions of HHO enriched fuel was lower than for neat diesel. The addition of gaseous fuel to diesel evidenced promising fuel economy. At the speed of 2200 rpm and a load of 9%, the parameter (BSFC) differed by 12% for neat diesel and the one having 10 LPM of HHO, with the latter being more fuel-efficient. Similarly, the speed of 1600 rpm rendered un-blended diesel less efficient on the account of an average of 8.44% higher fuel consumption when juxtaposed with 10 LPM HHO-enriched diesel. Moreover, the higher engine speeds seem to have a greater decrement in BSFC compared with low speeds. Equated at loads of 9% and 18% for speeds 1800 and 2200 rpm, the BSFC values diverged by 0.33 and 0.64 kg/kWh for low and high speed, respectively. The higher flammability at higher speeds is the reason for augmented variations (decline) in BSFC for increased revolutions of the power-producing shaft. The improved fuel economy of the engine functioned with HHO could be apprehended by the high calorific value of hydrogen and efficient combustion due to the availability of oxygen atoms in the HHO structure [19,36,37,38].

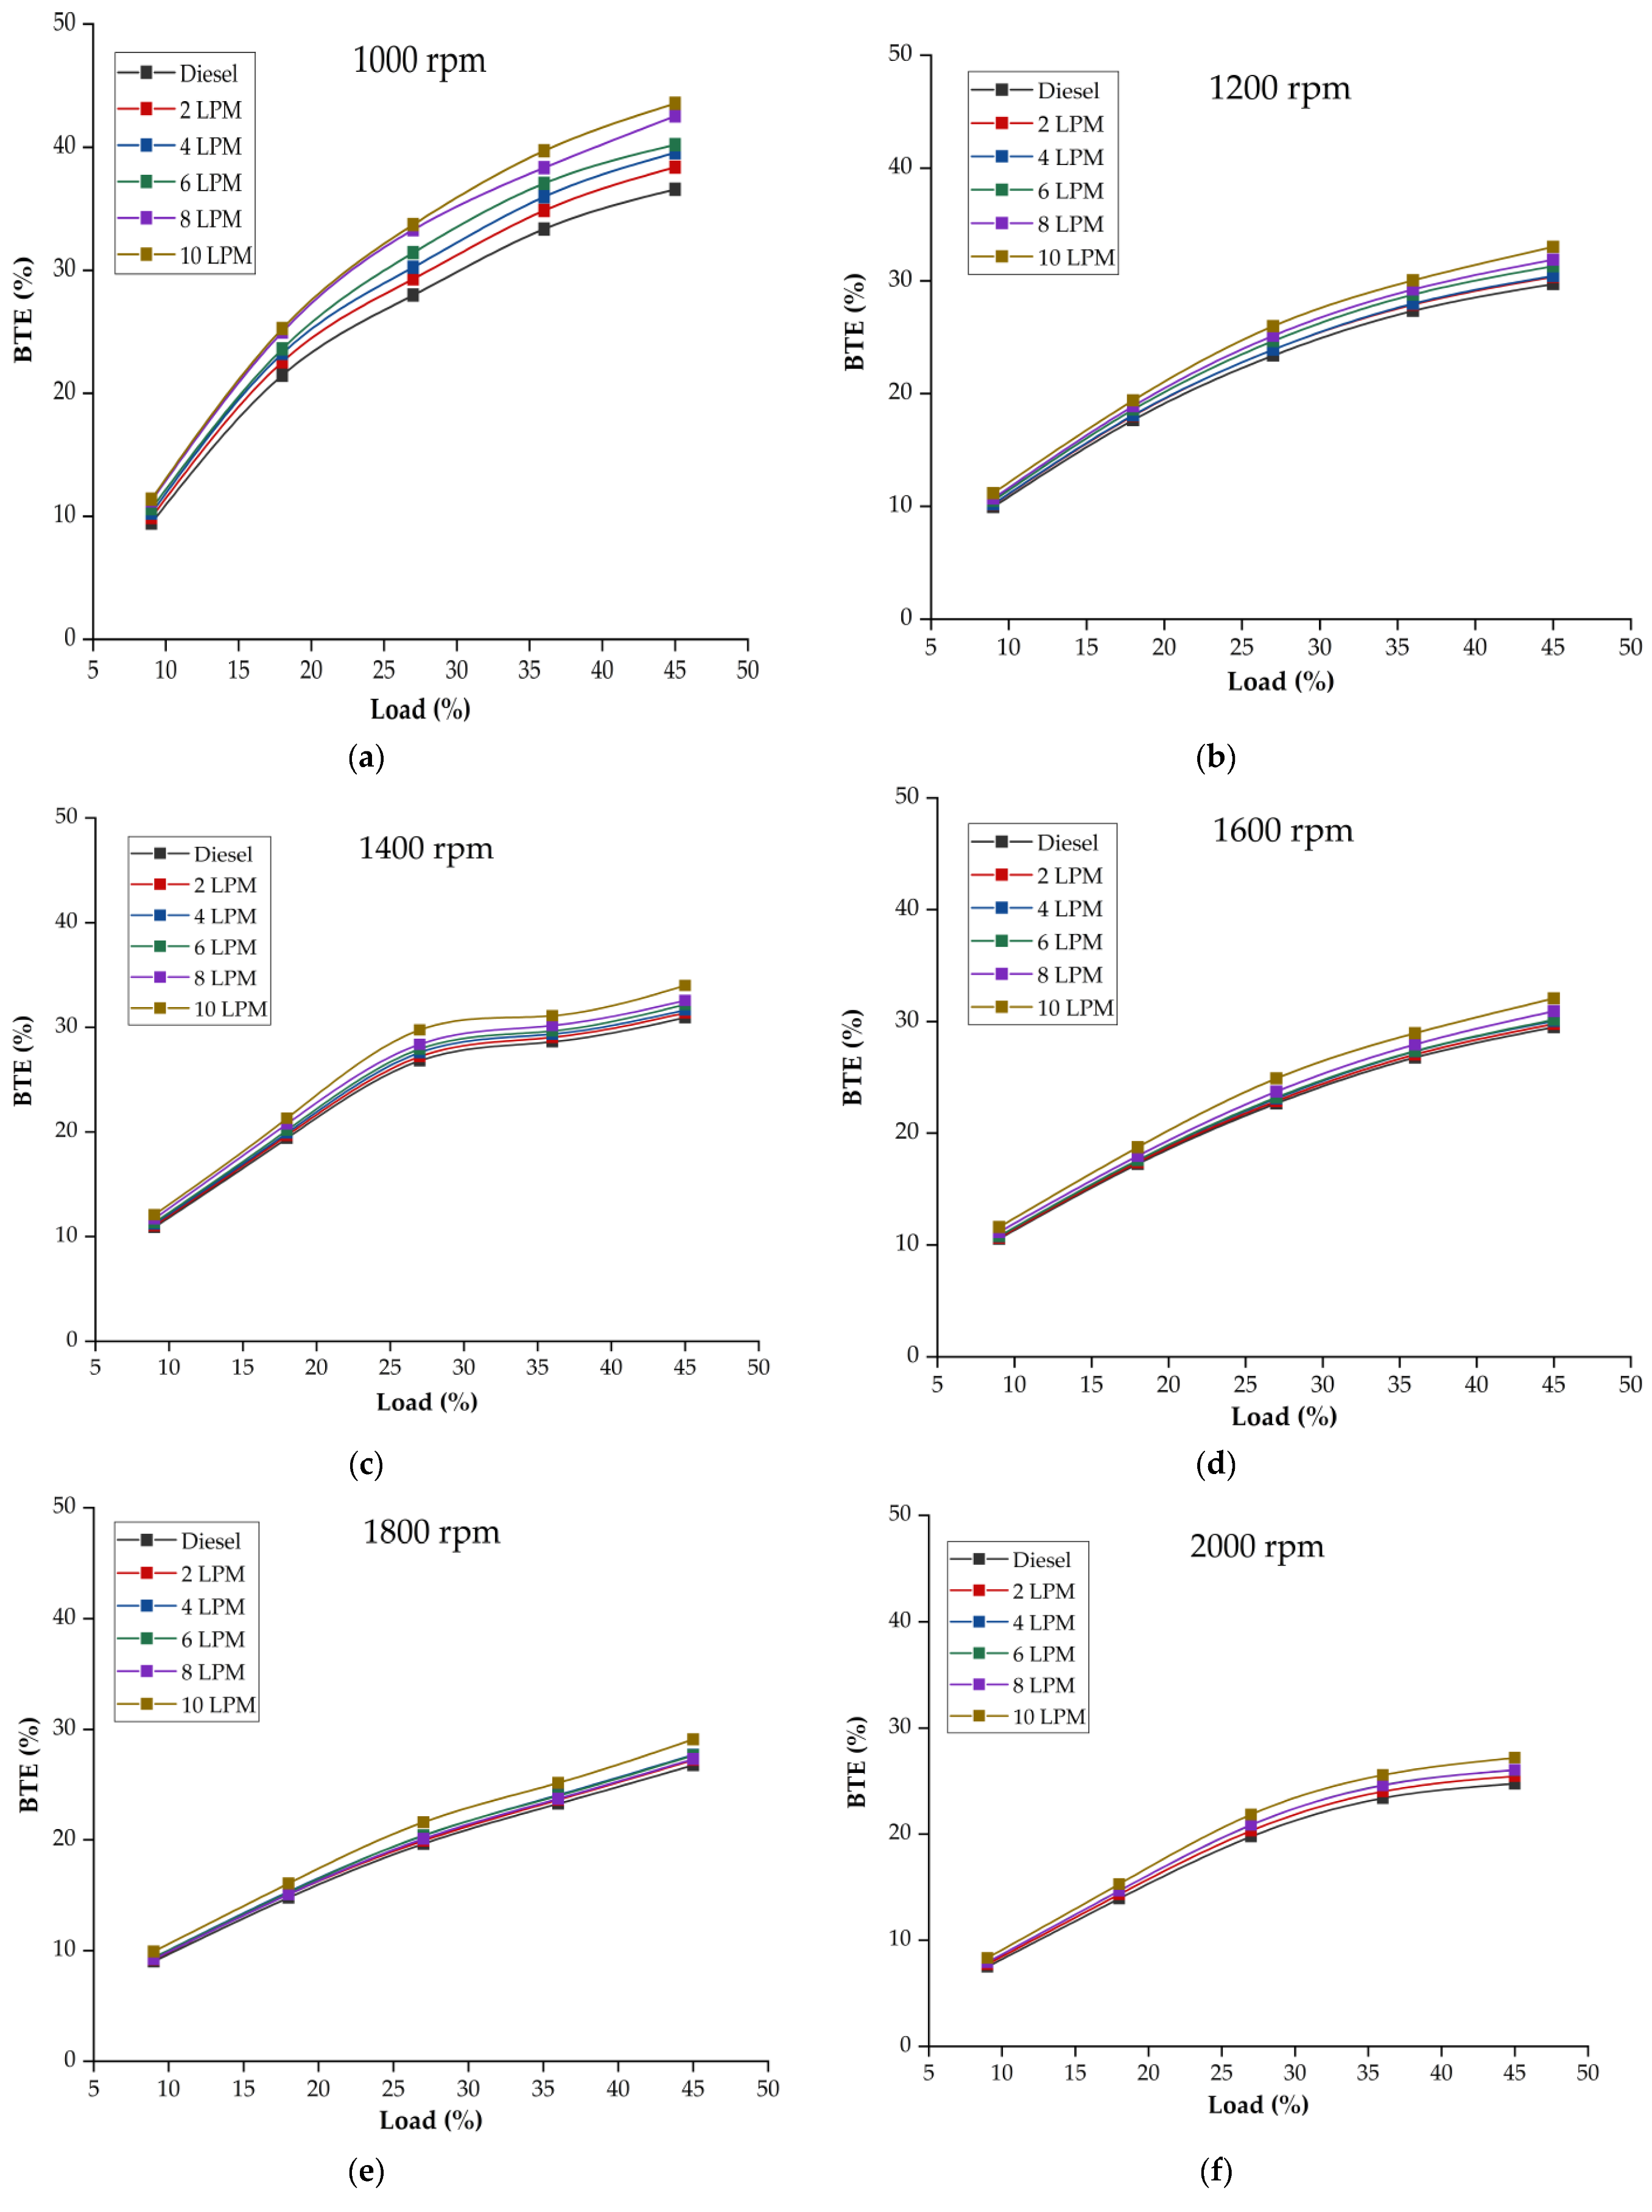
3.2. Brake Thermal Efficiency

Figure 5a–g shows the brake thermal efficiencies of all operating conditions at different HHO flow rates and loads. Identical to BSFC, the engine exhibited boosted thermal efficiencies for all HHO-enriched fuels compared with pure diesel. The test speed of 1400 rpm and flow rates of 2, 4, 6, 8, and 10 HHO at the constant load of 18% returned BTE values of 11.11%, 19.80%, 27.37%, 29.16%, and 31.55%, respectively. Thus, with the successive addition of HHO to the pure diesel, the engine exhibited a more efficient behavior. Figure 5c is seen to be following a different pattern compared with other test speeds. The manufacturer provided the maximum torque of 243 Nm at 1400 rpm (see Table 2). Therefore, at 36% loading condition for 1400 rpm, the fuel consumption was observed as higher, which resulted in a lower rate of increase in BTE, as made evident by the part of curve after the 25% load. Of all the experimental runs, the maximum recorded efficiency was 42.39% at the following conditions: 1000 rpm, 10 LPM HHO, and 45% load. Compared at a speed of 2000 rpm, diesel with 10 LPM HHO presented an average of 9.07% better performance than neat fuel. The chemical structure of diesel reveals the presence of 23 hydrogen atoms. The addition of hydroxy gas augments the number of hydrogen atoms and hydrogen to carbon ratio increases, which could be held accountable for significantly improved efficiency [39]. Moreover, enhanced combustion, the high calorific value of fuel mixture, diffusivity, and fast flame propagation speed of hydrogen are the phenomena governing the better performance of the engine [29,30,40,41].

4. ANN Application

4.1. Data Preprocessing
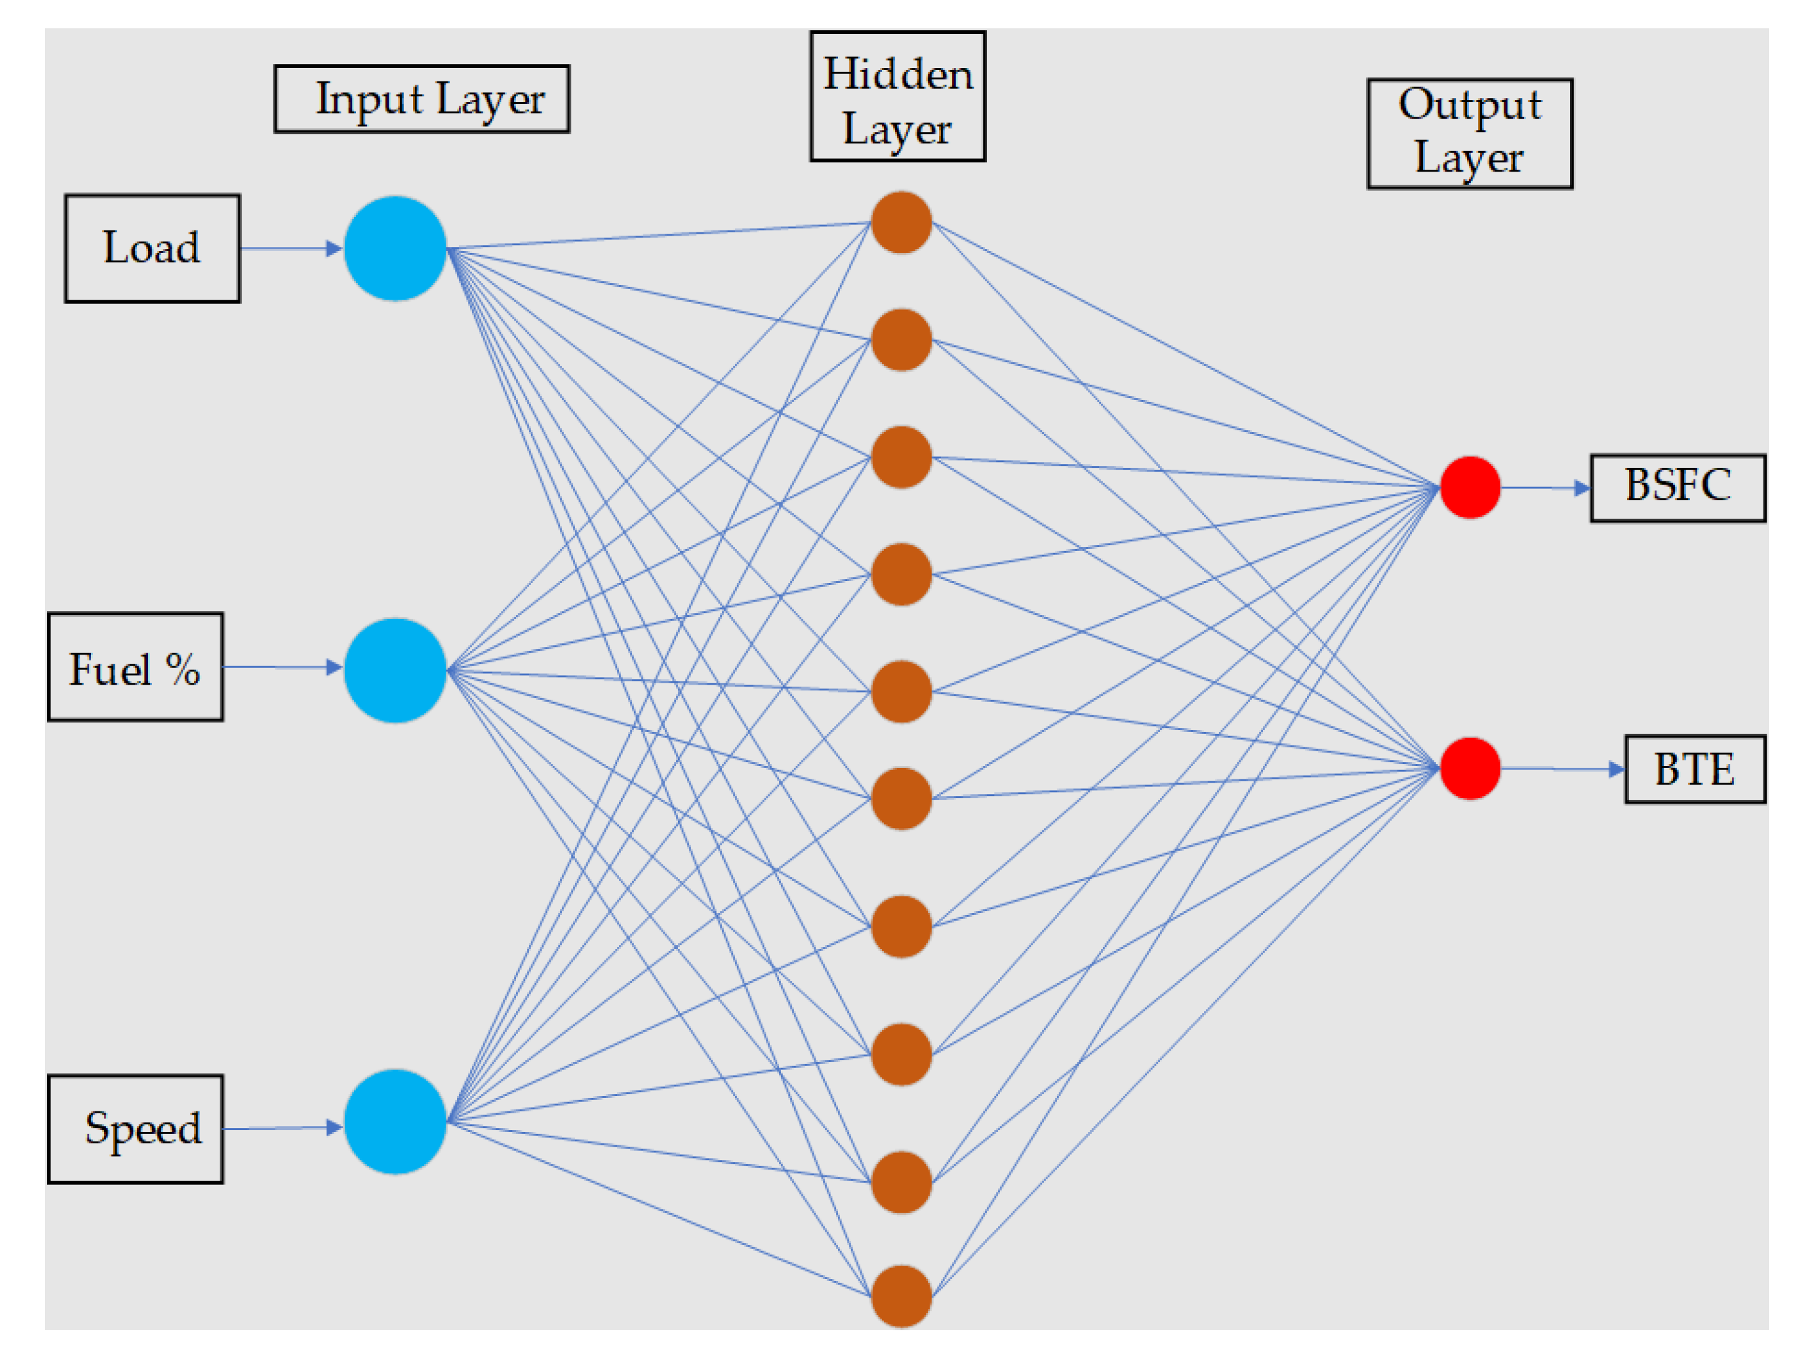
Prior to the development of the model, the input data (speed, load, and flow rate) and output data (BSFC and BTE) were normalized between the (0, 1) range using Equations (3) and (4). All the data were within 0 to 1 and no faulty data were detected.
Input N = input min ( input ) max ( input ) min ( input )
Output N = Output min ( output ) max ( output ) min ( output )

4.2. ANN Model

ANN is chiefly a statistical model that stems from the very idea of the information processing system of the human brain [42]. Over the few decades, ANN models have been growing exceptionally more common, owing to their widespread use for analyzing, processing, system controls, and optimization applications. With similar popularity in other fields, it has also been expansively used in the automotive sector as performance parameters could be correctly estimated using it. Depending upon the complexity of data, the ANN could have many layers, but generically it is reported with three stages: input layer, hidden layer, and output layer [43,44]. Neurons are information carriers that act as a connecting medium between the three layers. The neurons are interlinked through communication links which are in turn connected with connection weights. The signals are transmitted to the neurons by connection weights.
In the current study, engine speed, HHO flow rate, and engine load were designated as input parameters for input layers while performance parameters (BSFC and BTE) were dedicated to the output layer. The number of experimental observations recorded were 210, which served as a dataset to the input layer of ANN. MATLAB NN Toolbox was used for developing the model, which randomly divided the input into three groups as training (70%), validation (15%), and testing (15%). The network used in the hidden and output layers of the ANN model was a feedforward backpropagation network because of its valuable uses in the modelling of the system, signal processing of data with non-linearities, and accuracy [43,45]. The Trainlm training function and mean square error (MSE) performance function were employed, which is generally a preferable combination for faultless predictions [46]. Owing to the magnitude of the data set and higher reported efficiency rates, the tansig transfer function was selected. For diminishing the errors, LEARNGDM learning function was used. The quantity of neurons in the hidden layer is central to the efficient prediction of the ANN model, as with too low a number the connection between input data and output predicted results could be feeble and the resultant model will be considered inappropriate [43,47]. Moreover, the criteria of ceasing the training on the escalation of validation error was used. Usually, the use of 10 neurons is widely reported in the literature and the same could also be considered for the present case. However, with such a rough guess, the results may often be misleading. Therefore, the optimum neurons were identified by iterations 5 points above and near 10 below which identified the use of 10 neurons for achieving desirable results. The trained ANN model may have an error in form overfitting, which is a considerable difference of error between the training and testing. Figure 6 shows the performance of ANN training for 1000 epochs, from which it could be arguably concluded that the test error is comparable to the training error and are converging at one value. Therefore, the ANN model is not over fitted. The attributes of the ANN models are epitomized in Table 4 and the detailed network structure of the ANN model is shown in Figure 7. The working of ANN for the current case is clarified by the process diagram shown in Figure 8. It encompasses three stages. Input parameters were introduced in the first stage, which were repetitively trained in the second stage for minimizing disparity, and checked for the desired results in the third stage.
The output results of the ANN model were tested using the statistical measures of mean relative error (MRE), Root mean square error (RMSE), and correlation coefficient (R2), as defined in Equations (5)–(7):
MRE ( % ) = 1 n   i = 1 n | 100 t i p i p i |
RMSE = 1 n i = 1 n ( p i o i ) 2
R 2 = 1 ( i = 1 n ( p i o i ) 2 i = 1 n ( o i ) 2 )
The best output results could be adjudicated by ensuing certain statistical ranges associated with the above formulas. In the current scenario, the ANN predicted outputs rendered appropriate based on two statistical indicators: (a) correlation coefficient (R) close to positive unity and (b) the MRE of input and output within the defined range of 1–3%. In the case the predicted results failed to meet the demarcated criterion, the ANN model learning rate was varied.

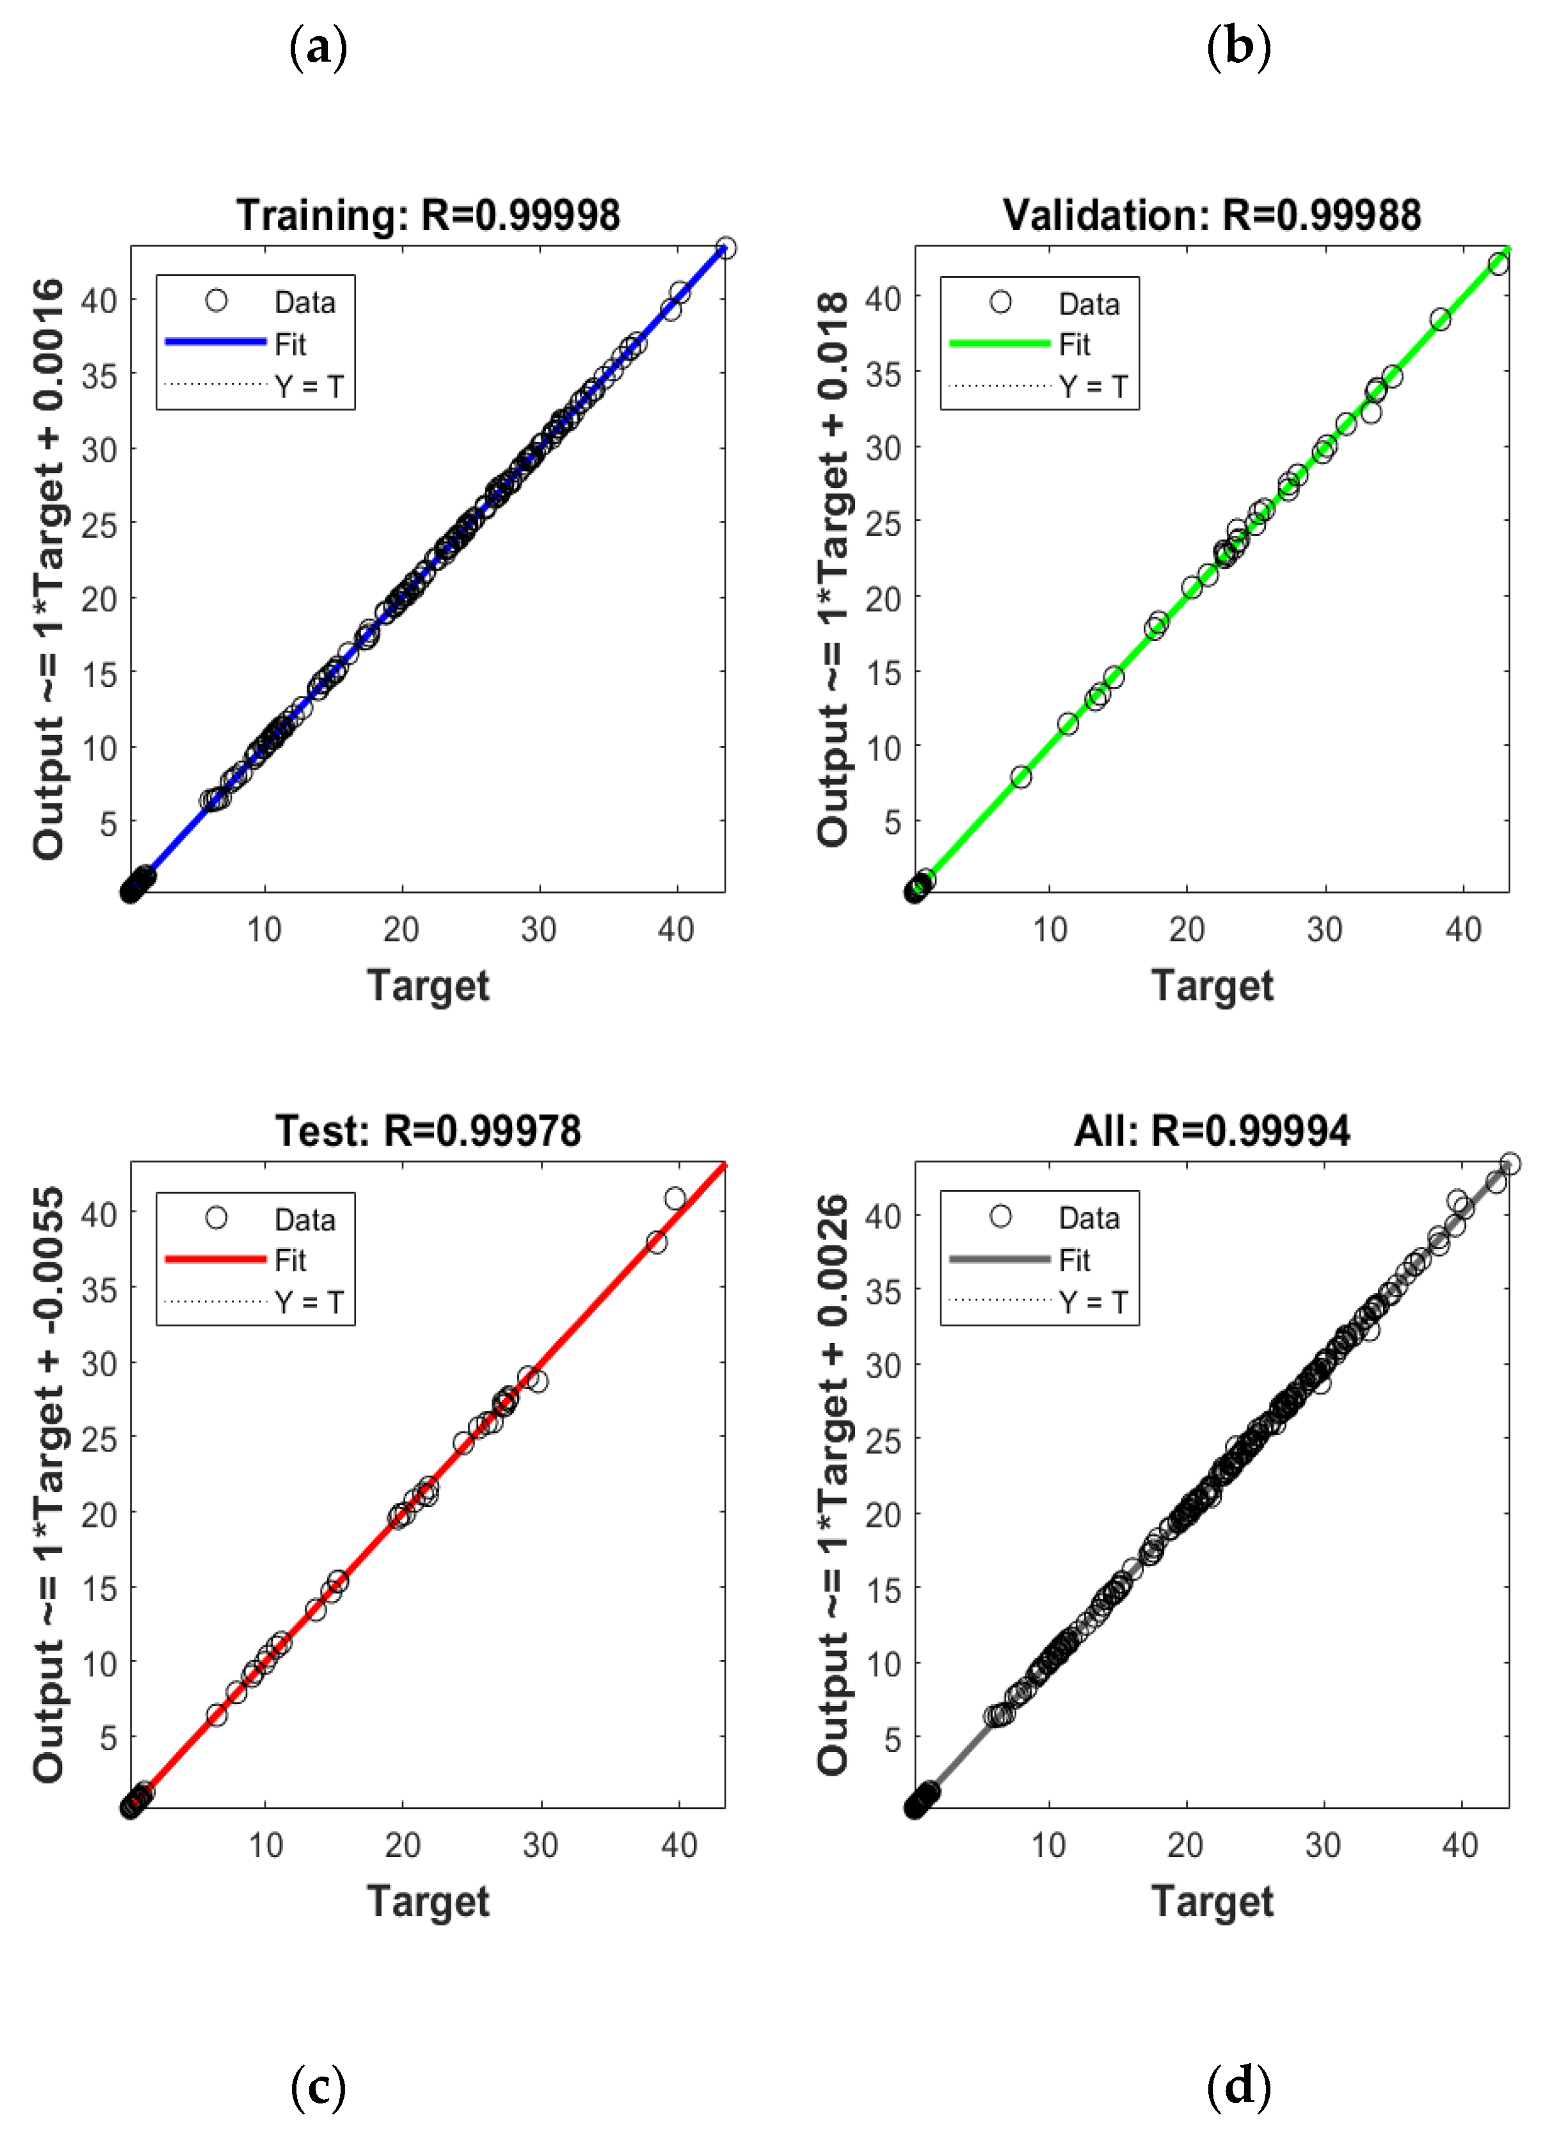
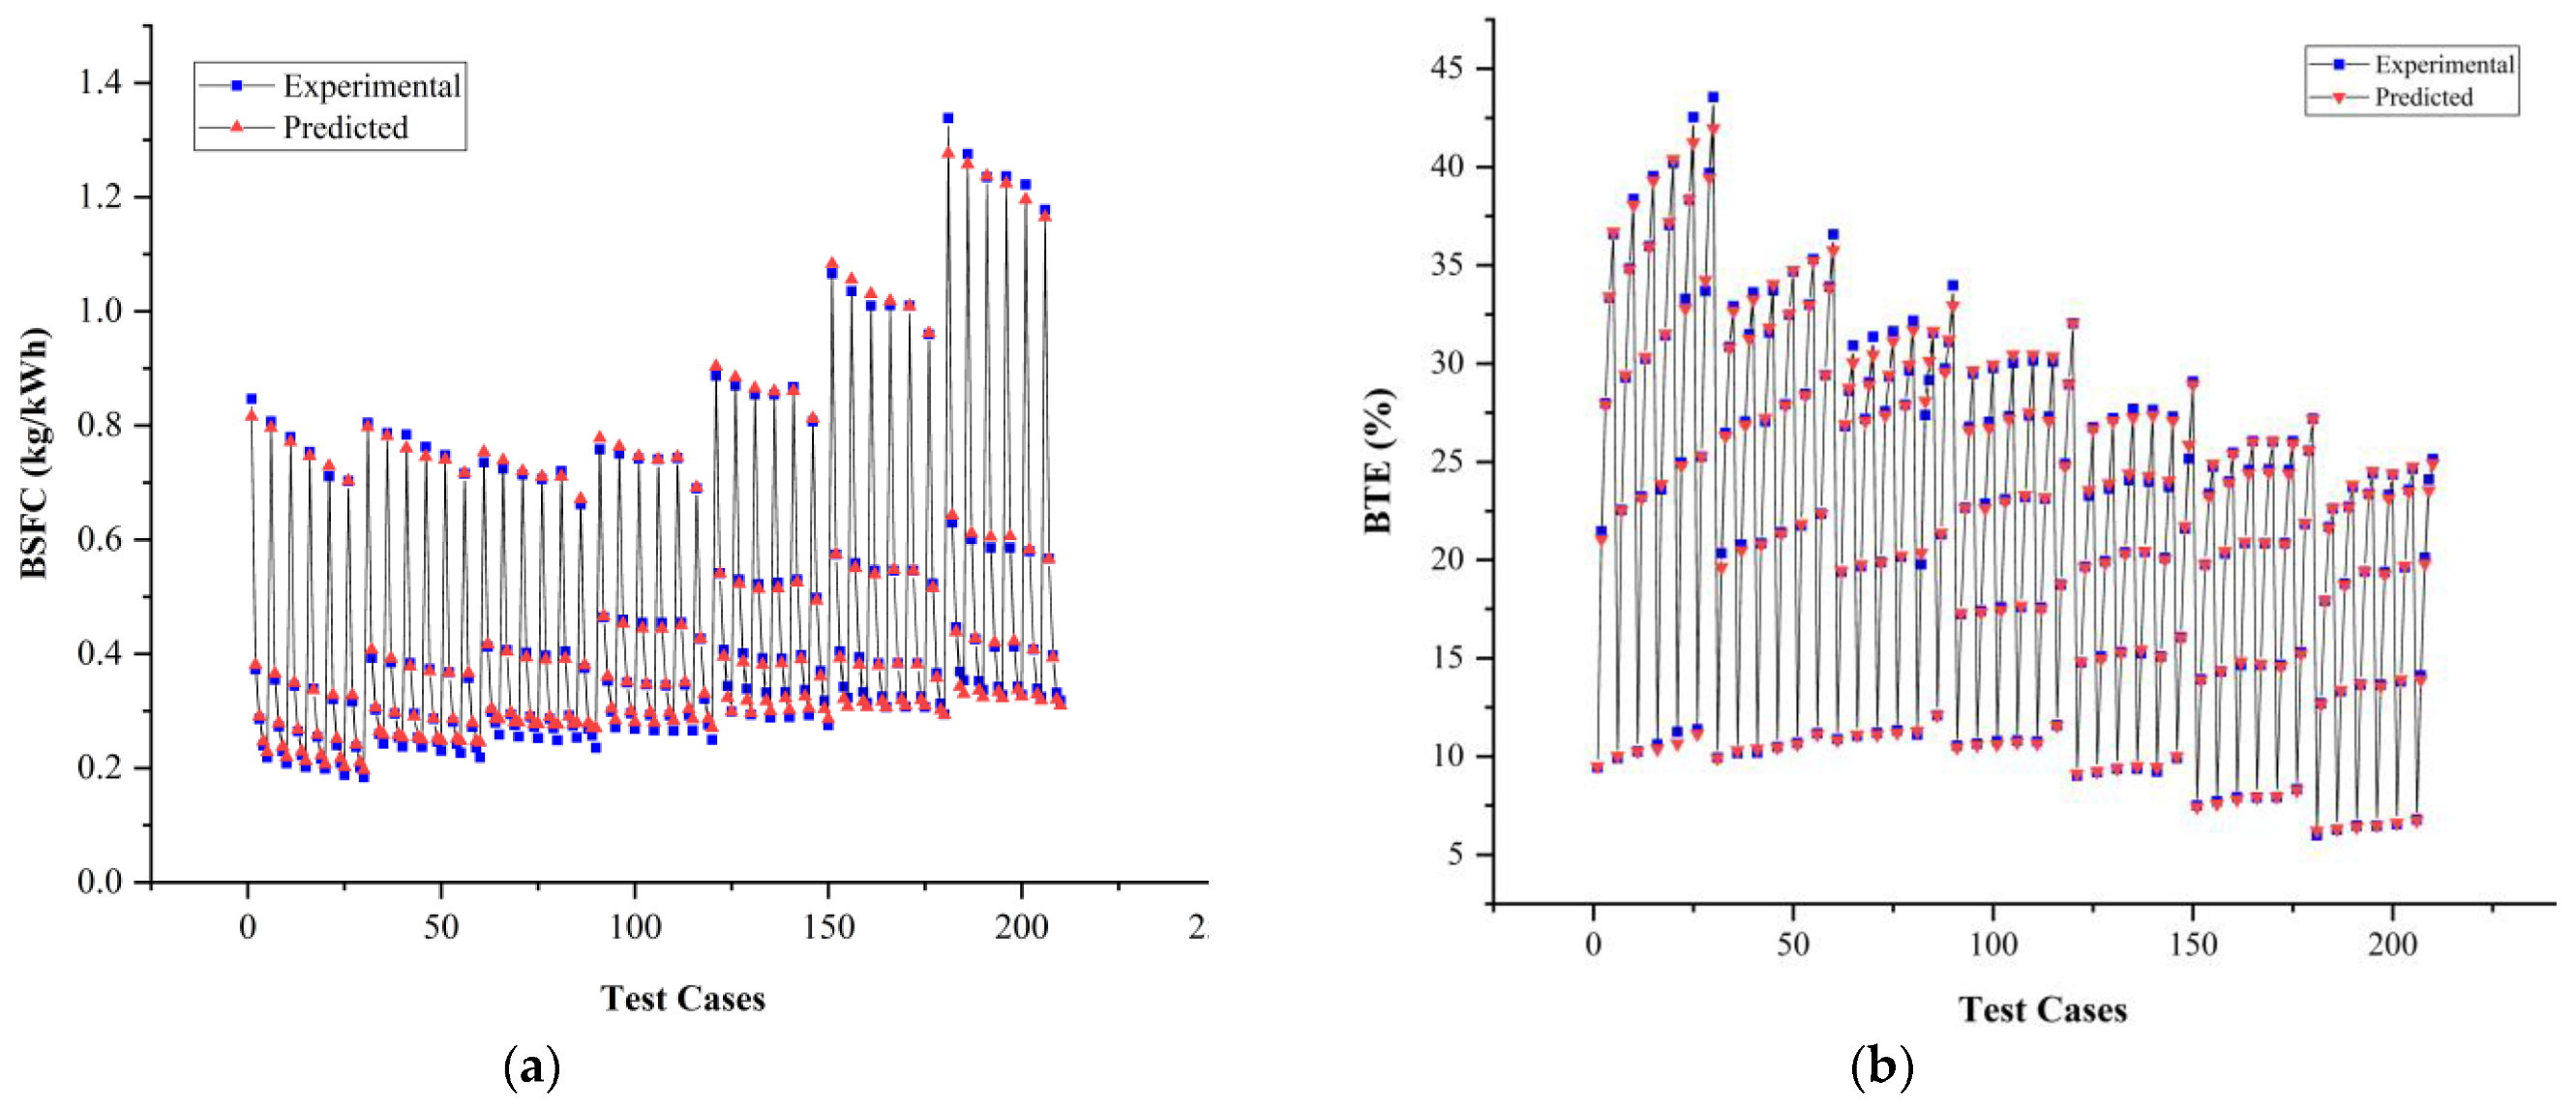
4.3. ANN Prediction Comparison and Discussion

The prediction of performance characteristics of test engine fueled with diesel-HHO blends using the artificial intelligence approach proved exceptionally valuable. The overall regression graphs yielded by the ANN application are shown in Figure 9a–d. The results generated by the model were in line with the statistical criterion defined in the preceding sections. The correlation coefficients for the three stages of the developed neural network were found qua 0.99998 for training, 0.99988 for validation. 0.99978 for testing, and 0.99994 for training, testing, and validation as a whole. The correlation coefficients for all stages were precisely near to +1, which demonstrates the well-matching of the experimental and ANN-predicted results.
The further analysis was initiated by evaluating the predicted and experiment results of BSFC and BTE on an individual basis as shown in Figure 10a,b. The correlation coefficient for BSFC returned a value of 0.99764. The MRE and RMSE accuracy-defining equations proved solid testimonies of BSFC model-generated results with values of 2.64% and 0.0122 kg/kWh. The statistical parameters showed that the prediction of the BSFC of a diesel engine operating on blended fuel using ANN has enough competence and efficiency. Similarly, the BTE-guessed values were significantly close to experimental values shown with R, MRE, and RMSE values of 0.99902, 1.91%, and 0.2768%. The BTE ANN model proved remarkable in the prediction of performance parameters.
The comprehensive comparison of two data sets, experimental and predicted, for each observation of parameters (BSFC and BTE) is shown in Figure 11a,b. The plotted line graphs depict the overlapping data points for most of the test runs, signaling the negligible deviations. From 210 observations, there are only a few sets for which the predicted values were seen escalating on either extreme, but collectively, they could merely be ignored due to an inconsequential effect. The in-depth analysis of the obtained statistical parameters unequivocally advocates that the ANN prediction model is suitable for performance parameters.

5. RSM-Based Optimization

Optimization of any process aims at achieving the maximum output by manipulating the controlled variables. In any optimization technique, numerical constraints are typically introduced for either maximizing or minimizing the response variables. Several available optimization techniques could admirably define the optimized parameters within the provided range. Response surface methodology (RSM) is a well-known statistical technique employed for the optimization of involved parameters using experimentally extracted data for solving multiple simultaneous equations. Over the years, the RSM has been seen extensively used in the engineering sector owing to its accurate prediction of response(s) influenced by multiple discrete factors. In the current optimization study, the BSFC and BTE of the test engine were nominated as response variables. The goal was to maximize BTE and minimize BSFC. The RSM design factors considered for optimization of diesel engine performance attributes were engine speed (rpm), HHO flow rate (LPM), and load of the engine (%). Design Expert 11 was used for creating the model and response surfaces. A multilevel design for a pre-defined experimental strategy was developed using historical data feature. The model defining parameters, listed in Table 5, were three numeric factors, seven levels of speed, six levels of HHO blend, and five levels of engine load.

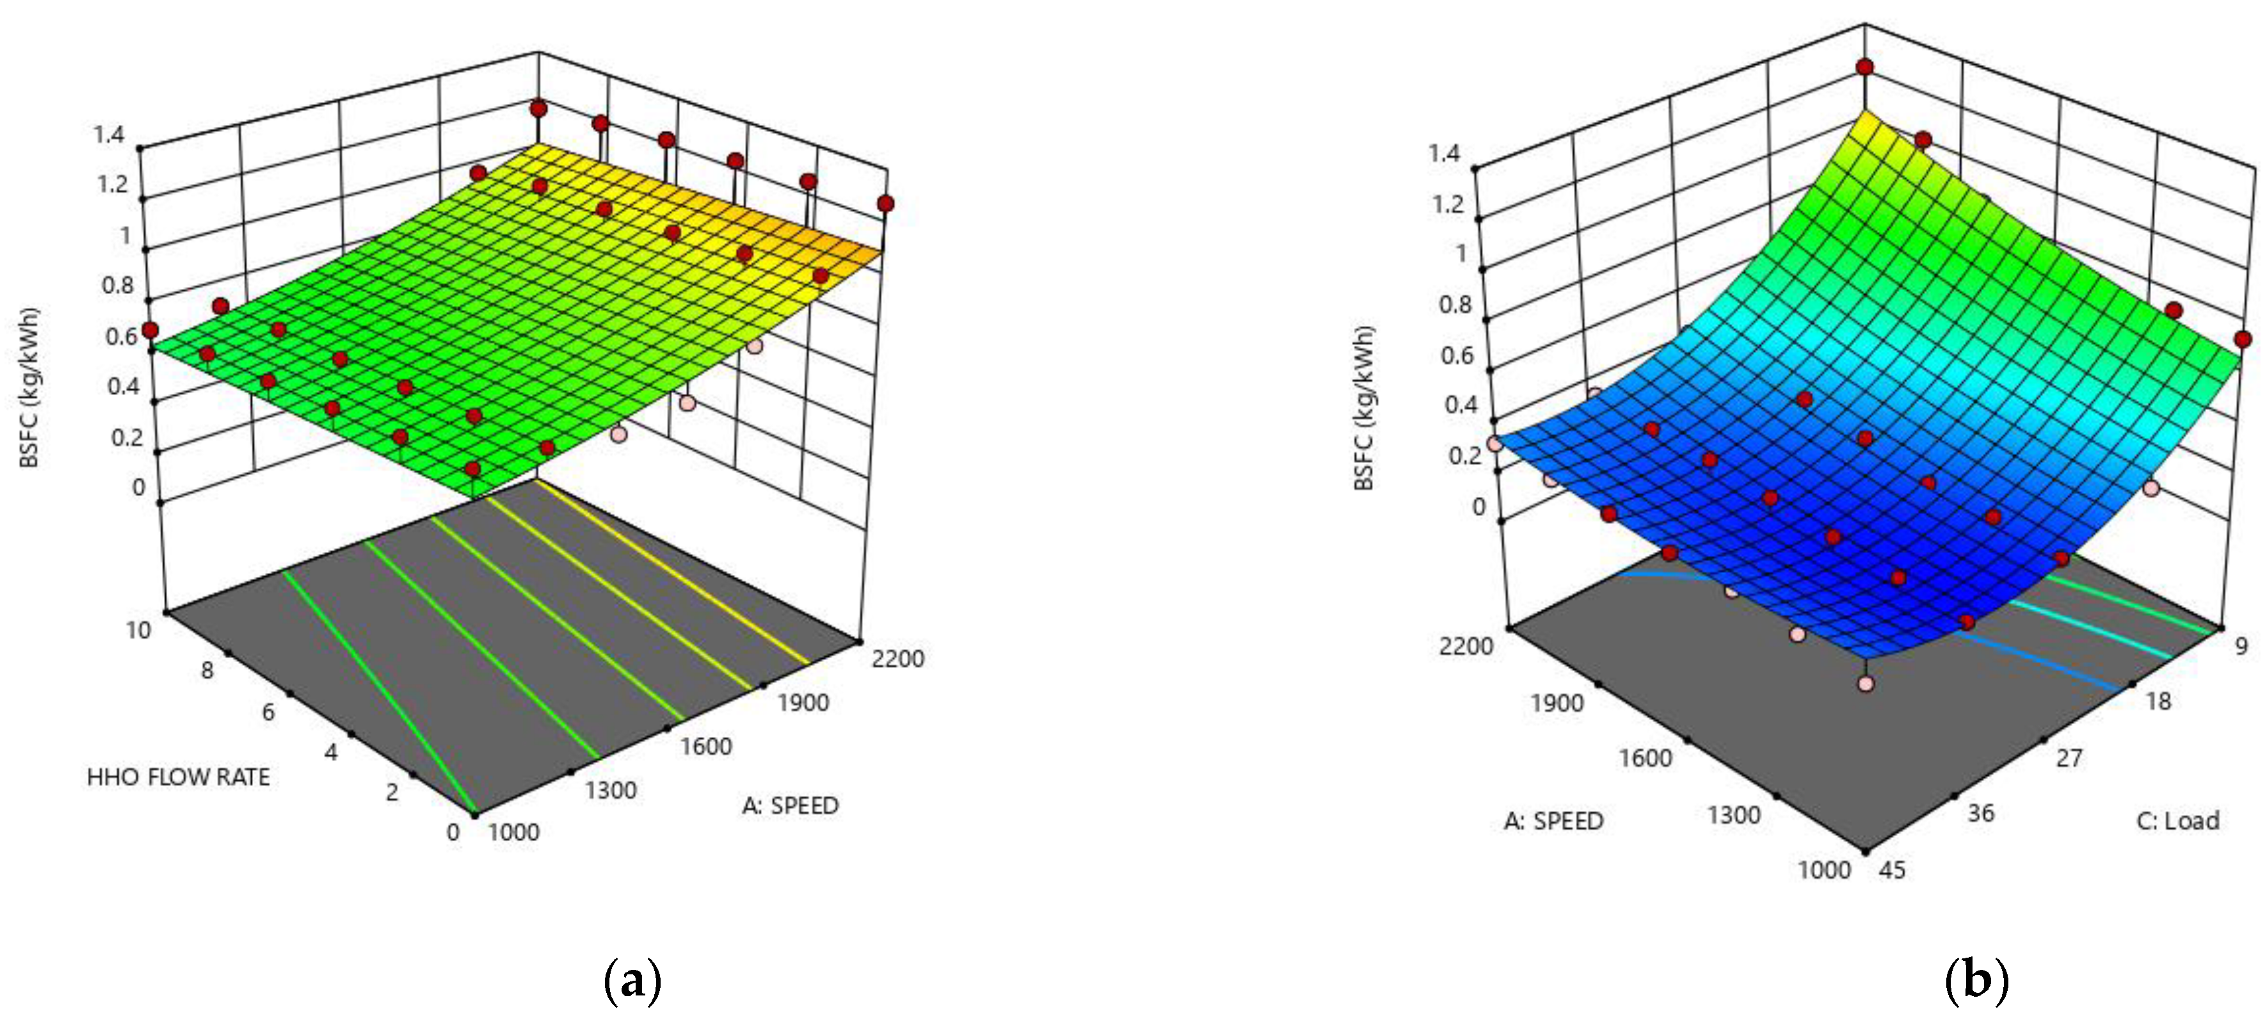
5.1. Selection of an Empirical Model

The fit summaries of BSFC and BTE are listed in Table 6 and Table 7. Generally, the selection of the appropriate model is governed by (a) p-value (b) predicted R2 and (c) reasonable agreement between predicted and adjusted R2 [48]. Based on the mentioned assessing parameters, the first two models (linear and 2FI) had small values of R2. However, the quadratic model had the signs of best fit, owing to p < 0.0001 and R2 significantly close to 1. Recent studies have also shown that the engine combustion process is complex and therefore could be aptly described with a quadratic model [49]. Thus, referring to the deduced observations and published literature, the quadratic model was designated for optimization purposes.

5.2. Analysis of Variance and Predicting Equations

Analysis of variance (ANOVA) is a statistical tool used for assessing the statistical significance of the model, individual terms, and interactions. It provides a detailed understanding of the regression model as the interactions between the factors and the responses can be explicitly comprehended. Table 8 and Table 9 provide the ANOVA for the quadratic models of BSFC and BTE. The model F values of 383.56 and 1298.30 for BSFC and BTE imply that models are significant. The model terms have been abbreviated as A—Speed, B—HHO flow rate, and C—load. The p values less than 0.0500 indicate the significance of model terms. In the case of BSFC, A, B, C, AC, BC, A², and C² are significant model terms. The p values of the terms AB, BC, and C2 indicate the model terms that are insignificant. The accuracy of the models under consideration has been verified using the diagnostic predicted vs actual and residual vs run plots as shown in Figure 12a–d. Figure 12a,b demonstrates that for BSFC and BTE, the RSM predicted values are in close agreement with the ANN values, indicated by the colored data point falling on the linear inclined line. Similarly, the deviation of RSM and actual (ANN) values were in the narrow residual range of [−3.7428, +3.7428], as depicted in Figure 12c,d. The even distribution atop and below the reference axis, for both the cases, signals the statistical significance of BSFC and BTE RSM models. The response surfaces of BSFC and BTE variation with engine speed, HHO percentage, and engine load are shown in Figure 13 and Figure 14 respectively. It is visible that all the design factors had a significant effect on responses. The dark and light dots on the response surfaces shows the design points above and below predicted values, respectively.
Second-order regression equations relating the input parameters and responses for estimation of performance are given by coded Equations (8) and (9). The coded alphabets A, B, and C correspond to the study design factors: speed, HHO flow rate, and load, respectively. By using the corresponding values of speed, flow rates, and engine load, in the regression equations, the values of BSFC and BTE could be accurately predicted.
BSFC =   0.3055   +   0.0165     A     0.0191     B     0.2717     C   +   0.0005     AB     0.0852     AC + 0.0178     BC   +   0.0441     A 2 0.0015     B 2   +   0.2475     C 2
BTE = 23.71 5.40     A   +   1.06     B   +   10.43     C 0.6690     AB 2.37     AC + 0.4239     BC   +   1     A 2   +   0.1020     B 2 4.23     C 2

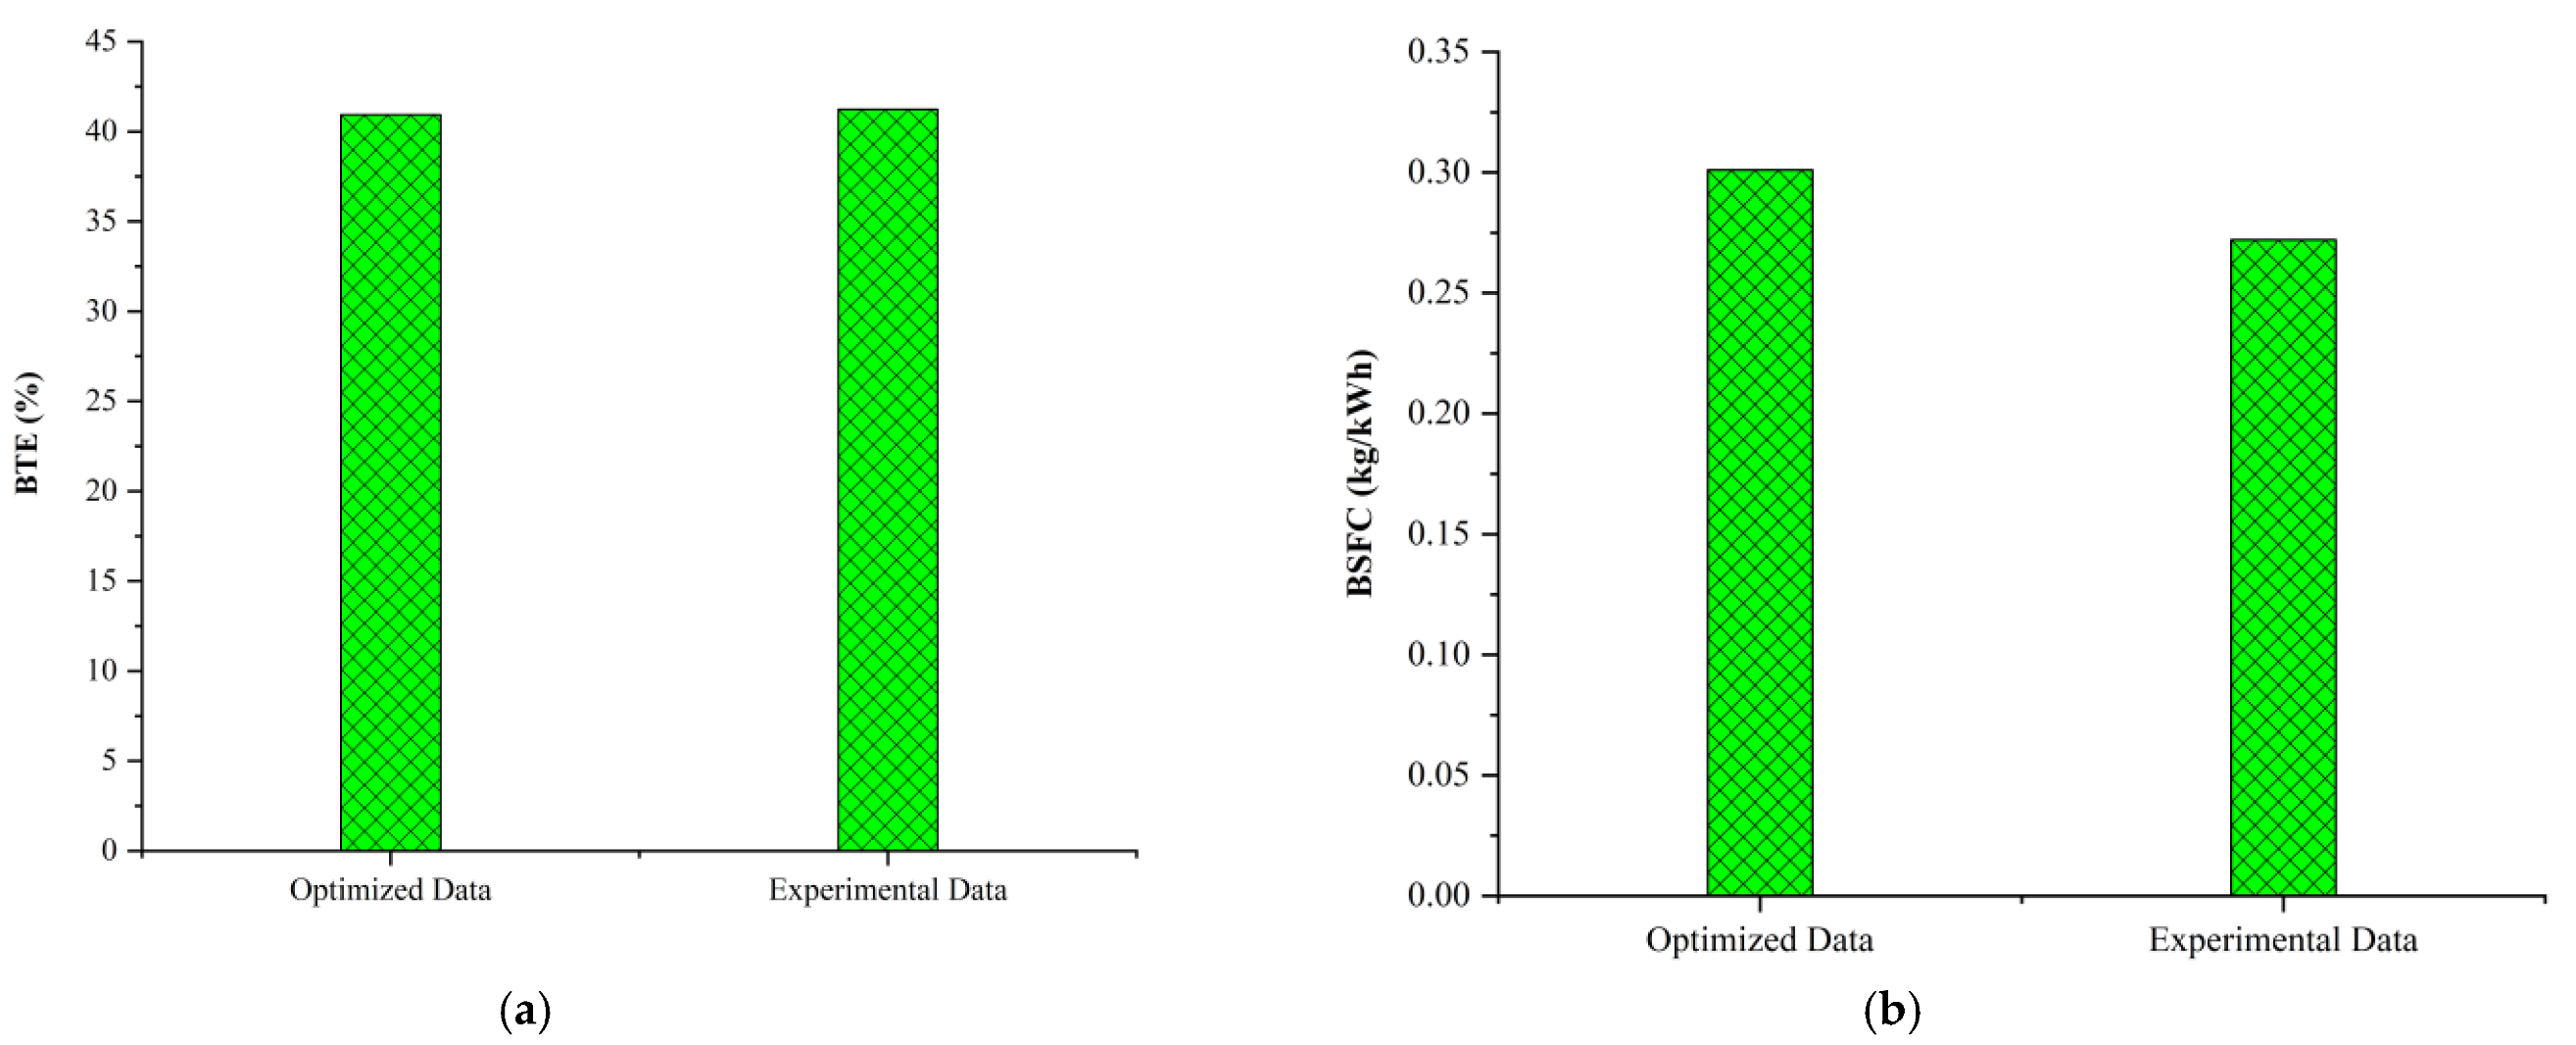
5.3. Optimization Results and Validation

In the current study, objective of RSM was to recognize the engine optimum working conditions. The speed, flow rate, and load were design factors, and ANN estimated values of BSFC and BTE were the outputs (responses). The design expert optimization feature demands optimal constraints to be defined for the factors and responses. Table 10 illustrates the defined constraints and setup for optimization. The goal was to optimize the engine with targets of minimizing BSFC and maximizing BTE while keeping the within range criterion for study factors.
The best operating parameters for engine performance came out to be 1000 rpm, 10 L per minute flow rate of HHO, and 45% engine load. The performance parameters against these optimal values of design factors are 0.301 kg/kWh BSFC and 40.939% of BTE. The composite desirability (D) is a unitless number that lies within the range of zero to one. It is a measure of favorability to which input defining factors optimize the objectives as a whole. The closer the value to the 1, the more favorable the optimization. In the current study, the composite desirability was detected to be 0.971. A value sufficiently close to 1 indicates that the employed RSM models are highly efficient and could be used to predict the optimum design factors for the efficient performance of the diesel engine.
The RSM-optimized results could be easily validated by conducting the experimental runs. Therefore, experimental observations of BSFC and BTE were recorded corresponding to optimized values of speed, flow rates, and loads, and the comparison is shown in Figure 15a,b. The experimental observation returned a value of BSFC 5.64%, less as compared with an optimized parameter. Similarly, the optimum value for brake thermal efficiency was 6.15% lower in comparison with experimental observation. With sufficient agreement between optimized and experimental observations as the basis, the RSM is viable and practically implementable.

6. Comparison of ANN and RSM Models

The artificial intelligence and statistically based predicting models of BSFC and BTE seemingly have alike reliability and efficiency. However, due to the generic association of methods root task to the same domains, the comparative assessment of the two will be an ideal approach. The detailed comparison of MRE and RMSE of ANN and RSM models is shown in Table 11. The statistical comparison discloses that the ANN models of BSFC and BTE have a better ability to efficiently predict parameters of an engine due to lower MRE and RMSE. ANN and RSM returned MRE values of 1.91% and 2.26% for BTE and 2.64% and 2.94% for BSFC, respectively. Similarly, the RMSE given by ANN and RSM for BSFC were 0.012 and 0.088 kg/kWh, respectively. The comparison vouched for ANN’s efficiency and reliability as the statistical parameters (MRE and RMSE) of both parameters were less than its competitor.

7. Conclusions

This study evaluated the use of oxyhydrogen gas with diesel at different flow rates in a CI engine. ANN and RSM tools were collectively used for performance prediction and optimization. The results could be summarized as:
  • 10 LPM HHO with diesel was found to be most fuel efficient among all test fuels.
  • HHO addition to the diesel improved BTE for all flow rates. Pure diesel showed the least BTE among all combinations of fuels.
  • The correlation coefficients of training, testing, and validation of the ANN model came out to be 0.99998, 0.99988, and 0.99978 respectively. Moreover, MRE values were in the range of 1–3%.
  • RSM identified all the study factors as statistically significant owing to p values less than 0.005.
  • Optimum operating conditions for engine were 1000 rpm, 10 LPM HHO, and 45% loading condition.
  • Composite desirability of 0.971 for multi-response optimization indicated the appropriate optimization setting.
  • The experimental BSFC and BTE differed by 5.64% and 6.15% from RSM-optimized values.
  • The ANN model proved better than RSM due to low RMSE and MRE values.
Thus, the addition of HHO to diesel proved highly valuable for improved performance. The statistical assessment tools (R, MRE, and RMSE) revealed that the performance could be accurately predicted by ANN and RSM models. Conclusively, the HHO enrichment to the diesel is desirable for better performance and could be optimized using Artificial Intelligence and statistical methods.
The authors aim at conducting studies to investigate the effect of HHO with a stepwise increment beyond 45% loading condition along with the collective and individual ANN modelling for outputs with different algorithms and training functions.

Author Contributions

Conceptualization, M.U., A.A.Z. and U.B.; methodology, M.U., H.H. and F.R.; software, R.B., M.H.S. and U.B.; validation, M.A.K., M.A.M. and A.A.Z.; formal analysis, M.A.K. and M.A.M.; investigation, H.H. and M.U.; writing—original draft preparation, M.U. and M.H.S.; writing—review and editing, F.R., R.B., M.I. and M.E.M.S.; supervision, M.U.; project administration, M.A.M.; funding acquisition, M.A.K. All authors have read and agreed to the published version of the manuscript.

Funding

The authors would like to thank the Faculty of Engineering at the University of Malaya, Malaysia for their support through the research grant no GPF018A-2019.

Institutional Review Board Statement

Not applicable.

Informed Consent Statement

Not applicable.

Data Availability Statement

Not applicable.

Conflicts of Interest

The authors declare no conflict of interest.

References

  1. Usman, M.; Jamil, M.K.; Riaz, F.; Hussain, H.; Hussain, G.; Shah, M.H.; Qyyum, M.A.; Salman, C.A.; Lee, M. Refining and Reuse of Waste Lube Oil in SI Engines: A Novel Approach for a Sustainable Environment. Energies 2021, 14, 2937. [Google Scholar] [CrossRef]
  2. Archer, D. Fate of fossil fuel CO2 in geologic time. J. Geophys. Res. Ocean. 2005, 110. [Google Scholar] [CrossRef] [Green Version]
  3. Hussain, F.; Soudagar, M.E.M.; Afzal, A.; Mujtaba, M.; Fattah, I.; Naik, B.; Mulla, M.H.; Badruddin, I.A.; Khan, T.; Raju, V.D. Enhancement in Combustion, Performance, and Emission Characteristics of a Diesel Engine Fueled with Ce-ZnO Nanoparticle Additive Added to Soybean Biodiesel Blends. Energies 2020, 13, 4578. [Google Scholar] [CrossRef]
  4. Mujtaba, M.; Kalam, M.; Masjuki, H.; Gul, M.; Soudagar, M.E.M.; Ong, H.C.; Ahmed, W.; Atabani, A.; Razzaq, L.; Yusoff, M. Comparative study of nanoparticles and alcoholic fuel additives-biodiesel-diesel blend for performance and emission improvements. Fuel 2020, 279, 118434. [Google Scholar] [CrossRef]
  5. Mujtaba, M.; Masjuki, H.; Kalam, M.; Noor, F.; Farooq, M.; Ong, H.C.; Gul, M.; Soudagar, M.E.M.; Bashir, S.; Rizwanul Fattah, I. Effect of Additivized Biodiesel Blends on Diesel Engine Performance, Emission, Tribological Characteristics, and Lubricant Tribology. Energies 2020, 13, 3375. [Google Scholar] [CrossRef]
  6. Soudagar, M.E.M.; Banapurmath, N.R.; Afzal, A.; Hossain, N.; Abbas, M.M.; Haniffa, M.A.C.M.; Naik, B.; Ahmed, W.; Nizamuddin, S.; Mubarak, N.M. Study of diesel engine characteristics by adding nanosized zinc oxide and diethyl ether additives in Mahua biodiesel–diesel fuel blend. Sci. Rep. 2020, 10, 15326. [Google Scholar] [CrossRef]
  7. Mujtaba, M.A.; Muk Cho, H.; Masjuki, H.H.; Kalam, M.A.; Farooq, M.; Soudagar, M.E.M.; Gul, M.; Afzal, A.; Ahmed, W.; Raza, A.; et al. Effect of primary and secondary alcohols as oxygenated additives on the performance and emission characteristics of diesel engine. Energy Rep. 2021, 7, 1116–1124. [Google Scholar] [CrossRef]
  8. Kumar, M.S.; Ramesh, A.; Nagalingam, B. Use of hydrogen to enhance the performance of a vegetable oil fuelled compression ignition engine. Int. J. Hydrog. Energy 2003, 28, 1143–1154. [Google Scholar]
  9. Soudagar, M.E.M.; Afzal, A.; Safaei, M.R.; Manokar, A.M.; El-Seesy, A.I.; Mujtaba, M.A.; Samuel, O.D.; Badruddin, I.A.; Ahmed, W.; Shahapurkar, K.; et al. Investigation on the effect of cottonseed oil blended with different percentages of octanol and suspended MWCNT nanoparticles on diesel engine characteristics. J. Therm. Anal. Calorim. 2020. [Google Scholar] [CrossRef]
  10. Khan, H.; Soudagar, M.E.M.; Kumar, R.H.; Safaei, M.R.; Farooq, M.; Khidmatgar, A.; Banapurmath, N.R.; Farade, R.A.; Abbas, M.M.; Afzal, A. Effect of nano-graphene oxide and n-butanol fuel additives blended with diesel—Nigella sativa biodiesel fuel emulsion on diesel engine characteristics. Symmetry 2020, 12, 961. [Google Scholar] [CrossRef]
  11. Takaishi, T.; Numata, A.; Nakano, R.; Sakaguchi, K. Approach to high efficiency diesel and gas engines. Mitsubishi Heavy Ind. Rev. 2008, 45, 21–24. [Google Scholar]
  12. Lanjewar, P.B.; Rao, R.; Kale, A. Assessment of alternative fuels for transportation using a hybrid graph theory and analytic hierarchy process method. Fuel 2015, 154, 9–16. [Google Scholar] [CrossRef]
  13. Mujtaba, M.; Cho, H.M.; Masjuki, H.; Kalam, M.; Ong, H.; Gul, M.; Harith, M.; Yusoff, M. Critical review on sesame seed oil and its methyl ester on cold flow and oxidation stability. Energy Rep. 2020, 6, 40–54. [Google Scholar] [CrossRef]
  14. S Gavhane, R.; M Kate, A.; Pawar, A.; Safaei, M.R.; M Soudagar, M.E.; Mujtaba Abbas, M.; Muhammad Ali, H.; R Banapurmath, N.; Goodarzi, M.; Badruddin, I.A. Effect of Zinc Oxide Nano-Additives and Soybean Biodiesel at Varying Loads and Compression Ratios on VCR Diesel Engine Characteristics. Symmetry 2020, 12, 1042. [Google Scholar] [CrossRef]
  15. Soudagar, M.E.M.; Mujtaba, M.A.; Safaei, M.R.; Afzal, A.; V, D.R.; Ahmed, W.; Banapurmath, N.R.; Hossain, N.; Bashir, S.; Badruddin, I.A.; et al. Effect of Sr@ZnO nanoparticles and Ricinus communis biodiesel-diesel fuel blends on modified CRDI diesel engine characteristics. Energy 2021, 215, 119094. [Google Scholar] [CrossRef]
  16. Soudagar, M.E.M.; Khan, H.M.; Khan, T.M.Y.; Razzaq, L.; Asif, T.; Mujtaba, M.A.; Hussain, A.; Farooq, M.; Ahmed, W.; Shahapurkar, K.; et al. Experimental Analysis of Engine Performance and Exhaust Pollutant on a Single-Cylinder Diesel Engine Operated Using Moringa Oleifera Biodiesel. Appl. Sci. 2021, 11, 7071. [Google Scholar] [CrossRef]
  17. Momirlan, M.; Veziroglu, T.N. The properties of hydrogen as fuel tomorrow in sustainable energy system for a cleaner planet. Int. J. Hydrog. Energy 2005, 30, 795–802. [Google Scholar] [CrossRef]
  18. Litzinger, T.; Stoner, M.; Hess, H.; Boehman, A. Effects of oxygenated blending compounds on emissions from a turbocharged direct injection diesel engine. Int. J. Engine Res. 2000, 1, 57–70. [Google Scholar] [CrossRef]
  19. Abdel-Aal, H.; Sadik, M.; Bassyouni, M.; Shalabi, M. A new approach to utilize hydrogen as a safe fuel. Int. J. Hydrog. Energy 2005, 30, 1511–1514. [Google Scholar] [CrossRef]
  20. Gad, M.; El-Fakharany, M.; Elsharkawy, E. Effect of HHO gas enrichment on performance and emissions of a diesel engine fueled by biodiesel blend with kerosene additive. Fuel 2020, 280, 118632. [Google Scholar] [CrossRef]
  21. Fayaz, H.; Mujtaba, M.A.; Soudagar, M.E.M.; Razzaq, L.; Nawaz, S.; Nawaz, M.A.; Farooq, M.; Afzal, A.; Ahmed, W.; Khan, T.M.Y.; et al. Collective effect of ternary nano fuel blends on the diesel engine performance and emissions characteristics. Fuel 2021, 293, 120420. [Google Scholar] [CrossRef]
  22. Aydin, H.; Ilkılıc, C.J.A.T.E. Effect of ethanol blending with biodiesel on engine performance and exhaust emissions in a CI engine. Appl. Therm. Eng. 2010, 30, 1199–1204. [Google Scholar] [CrossRef]
  23. Rimkus, A.; Matijošius, J.; Bogdevičius, M.; Bereczky, Á.; Török, Á. An investigation of the efficiency of using O2 and H2 (hydrooxile gas-HHO) gas additives in a ci engine operating on diesel fuel and biodiesel. Energy 2018, 152, 640–651. [Google Scholar] [CrossRef]
  24. Yilmaz, A.C.; Uludamar, E.; Aydin, K. Effect of hydroxy (HHO) gas addition on performance and exhaust emissions in compression ignition engines. Int. J. Hydrog. Energy 2010, 35, 11366–11372. [Google Scholar] [CrossRef]
  25. Kenanoğlu, R.; Baltacıoğlu, M.K.; Demir, M.H.; Özdemir, M.E. Performance & emission analysis of HHO enriched dual-fuelled diesel engine with artificial neural network prediction approaches. Int. J. Hydrog. Energy 2020, 45, 26357–26369. [Google Scholar]
  26. Usman, M.; Farooq, M.; Naqvi, M.; Saleem, M.W.; Hussain, J.; Naqvi, S.R.; Jahangir, S.; Jazim Usama, H.M.; Idrees, S.; Anukam, A. Use of gasoline, LPG and LPG-HHO blend in SI engine: A comparative performance for emission control and sustainable environment. Processes 2020, 8, 74. [Google Scholar] [CrossRef] [Green Version]
  27. Dongare, A.; Kharde, R.; Kachare, A.D. Introduction to artificial neural network. Int. J. Eng. Innov. Technol. 2012, 2, 189–194. [Google Scholar]
  28. Gul, M.; Shah, A.N.; Aziz, U.; Husnain, N.; Mujtaba, M.; Kousar, T.; Ahmad, R.; Hanif, M.F. Grey-Taguchi and ANN based optimization of a better performing low-emission diesel engine fueled with biodiesel. Energy Sources Part A Recovery Util. Environ. Eff. 2019, 1–14. [Google Scholar] [CrossRef]
  29. Yildizhan, Ş.; Uludamar, E.; Çalık, A.; Dede, G.; Özcanlı, M. Fuel properties, performance and emission characterization of waste cooking oil (WCO) in a variable compression ratio (VCR) diesel engine. Eur. Mech. Sci. 2017, 1, 56–62. [Google Scholar] [CrossRef] [Green Version]
  30. Yıldırım, S.; Tosun, E.; Çalık, A.; Uluocak, İ.; Avşar, E. Artificial intelligence techniques for the vibration, noise, and emission characteristics of a hydrogen-enriched diesel engine. Energy Sources Part A Recovery Util. Environ. Eff. 2019, 41, 2194–2206. [Google Scholar] [CrossRef]
  31. Mujtaba, M.; Masjuki, H.; Kalam, M.; Ong, H.C.; Gul, M.; Farooq, M.; Soudagar, M.E.M.; Ahmed, W.; Harith, M.; Yusoff, M. Ultrasound-assisted process optimization and tribological characteristics of biodiesel from palm-sesame oil via response surface methodology and extreme learning machine-Cuckoo search. Renew. Energy 2020, 158, 202–214. [Google Scholar] [CrossRef]
  32. Gul, M.; Zulkifli, N.W.M.; Kalam, M.A.; Masjuki, H.H.; Mujtaba, M.A.; Yousuf, S.; Bashir, M.N.; Ahmed, W.; Yusoff, M.N.A.M.; Noor, S.; et al. RSM and Artificial Neural Networking based production optimization of sustainable Cotton bio-lubricant and evaluation of its lubricity & tribological properties. Energy Rep. 2021, 7, 830–839. [Google Scholar]
  33. Ghobadian, B.; Rahimi, H.; Nikbakht, A.; Najafi, G.; Yusaf, T. Diesel engine performance and exhaust emission analysis using waste cooking biodiesel fuel with an artificial neural network. Renew. Energy 2009, 34, 976–982. [Google Scholar] [CrossRef] [Green Version]
  34. Uslu, S.; Celik, M.B. Performance and exhaust emission prediction of a SI engine fueled with I-amyl alcohol-gasoline blends: An ANN coupled RSM based optimization. Fuel 2020, 265, 116922. [Google Scholar] [CrossRef]
  35. Dinjus, E.; Arnold, U.; Dahmen, N.; Höfer, R.; Wach, W. Green fuels–sustainable solutions for transportation. In Sustainable Solutions for Modern Economies; Royal Society of Chemistry: London, UK, 2009; Volume 4, pp. 125–129. [Google Scholar]
  36. Uludamar, E.; Tosun, E.; Tüccar, G.; Yıldızhan, Ş.; Çalık, A.; Yıldırım, S.; Serin, H.; Özcanlı, M. Evaluation of vibration characteristics of a hydroxyl (HHO) gas generator installed diesel engine fuelled with different diesel–biodiesel blends. Int. J. Hydrog. Energy 2017, 42, 23352–23360. [Google Scholar] [CrossRef]
  37. Masood, M.; Ishrat, M.; Reddy, A. Computational combustion and emission analysis of hydrogen–diesel blends with experimental verification. Int. J. Hydrog. Energy 2007, 32, 2539–2547. [Google Scholar] [CrossRef]
  38. Uludamar, E. Effect of hydroxy and hydrogen gas addition on diesel engine fuelled with microalgae biodiesel. Int. J. Hydrog. Energy 2018, 43, 18028–18036. [Google Scholar] [CrossRef]
  39. Dahake, M.; Patil, S.; Patil, S. Effect of hydroxy gas addition on performance and emissions of diesel engine. Int. Res. J. Eng. Technol. 2016, 3. [Google Scholar]
  40. Sun, Z.-Y.; Liu, F.-S.; Liu, X.-H.; Sun, B.-G.; Sun, D.-W. Research and development of hydrogen fuelled engines in China. Int. J. Hydrog. Energy 2012, 37, 664–681. [Google Scholar] [CrossRef]
  41. Premkartikkumar, S.; Annamalai, K.; Pradeepkumar, A. Using hydrogen as a fuel in automotive engines–an investigation. Int. J. Innov. Technol. Res. 2013, 1, 90–93. [Google Scholar]
  42. Ahmed, E.; Usman, M.; Anwar, S.; Ahmad, H.M.; Nasir, M.W.; Malik, M.A.I. Application of ANN to predict performance and emissions of SI engine using gasoline-methanol blends. Sci. Prog. 2021, 104, 00368504211002345. [Google Scholar] [CrossRef]
  43. Kesgin, U. Genetic algorithm and artificial neural network for engine optimisation of efficiency and NOx emission. Fuel 2004, 83, 885–895. [Google Scholar] [CrossRef]
  44. Çay, Y.; Korkmaz, I.; Çiçek, A.; Kara, F. Prediction of engine performance and exhaust emissions for gasoline and methanol using artificial neural network. Energy 2013, 50, 177–186. [Google Scholar] [CrossRef]
  45. Cay, Y. Prediction of a gasoline engine performance with artificial neural network. Fuel 2013, 111, 324–331. [Google Scholar] [CrossRef]
  46. Yusaf, T.; Yousif, B.; Elawad, M. Crude palm oil fuel for diesel-engines: Experimental and ANN simulation approaches. Energy 2011, 36, 4871–4878. [Google Scholar] [CrossRef]
  47. Sayin, C.; Ertunc, H.M.; Hosoz, M.; Kilicaslan, I.; Canakci, M. Performance and exhaust emissions of a gasoline engine using artificial neural network. Appl. Therm. Eng. 2007, 27, 46–54. [Google Scholar] [CrossRef]
  48. Abdalla, A.N.; Tao, H.; Bagaber, S.A.; Ali, O.M.; Kamil, M.; Ma, X.; Awad, O.I. Prediction of emissions and performance of a gasoline engine running with fusel oil–gasoline blends using response surface methodology. Fuel 2019, 253, 1–14. [Google Scholar] [CrossRef]
  49. Dey, S.; Reang, N.M.; Das, P.K.; Deb, M. Comparative study using RSM and ANN modelling for performance-emission prediction of CI engine fuelled with bio-diesohol blends: A fuzzy optimization approach. Fuel 2021, 292, 120356. [Google Scholar] [CrossRef]
Figure 1. HHO generator.
Sustainability 13 09373 g001
Figure 2. Experimental setup.
Sustainability 13 09373 g002
Figure 3. Schematic of engine test bed.
Sustainability 13 09373 g003
Figure 4. (ag) Comparison of BSFC for diesel—HHO blends in speed range (1000–2200).
Sustainability 13 09373 g004aSustainability 13 09373 g004b
Figure 5. (ag) Comparison of BTE for diesel—HHO blends in the speed range (1000–2200).
Sustainability 13 09373 g005aSustainability 13 09373 g005b
Figure 6. Performance validation of ANN.
Sustainability 13 09373 g006
Figure 7. The ANN model.
Sustainability 13 09373 g007
Figure 8. Working of ANN.
Sustainability 13 09373 g008
Figure 9. (a) Training, (b) validation, (c) testing, and (d) overall correlation coefficients.
Sustainability 13 09373 g009
Figure 10. Comparison of predicted results with experimental results for (a) BSFC and (b) BTE.
Sustainability 13 09373 g010
Figure 11. Comparison of experimental and predicted values for (a) BSFC and (b) BTE.
Sustainability 13 09373 g011
Figure 12. (ad) Predicted vs actual graph for (a) BSFC and (b) BTE and residual vs. run graphs for (a) BSFC and BTE RSM models.
Sustainability 13 09373 g012aSustainability 13 09373 g012b
Figure 13. Response surfaces variation of BSFC with (a) flow rate and speed, (b) speed and load, and (c) load and flow rate.
Sustainability 13 09373 g013aSustainability 13 09373 g013b
Figure 14. Response surfaces variation of BTE with (a) load and speed, (b) load and HHO, and (c) flow rate and speed.
Sustainability 13 09373 g014
Figure 15. Comparison of optimized and experimental results for (a) BSFC and (b) BTE.
Sustainability 13 09373 g015
Table 1. HHO generator specifications.
FeatureDescription
Material of PlateStainless steel (316-l)
Dimensions of Plate16.5 cm by 16.5 cm by 0.1 cm
Electrode configurationCenter anodes, end cathodes
Plate spacing2 mm
HHO flow rateup to 10 LPM
Maximum Voltage35 V
Maximum Current40 A
Relation between current and LPMDirect relation up to 10 LPM
Table 2. Engine specifications.
FeaturesDescription
Engine typePerkin/AD 3.152
Bore91.4 mm
Stroke127.0 mm
Number of holes of nozzles4
Brake mean effective pressure7.1570 bars
Injection timing17 ⁰ BTDC
Displacement2.5 Liters
Compression ratio18.5
Maximum speed2200 rpm
Maximum power36.8 kW at 1500 rpm
Maximum torque243 N.m at 1400 rpm
Table 3. Properties of fuels.
PropertiesDieselHydrogen
Research octane number30>130
Density at 20 °C833.1 kg/m30.0827 kg/m3
Net heating value42.5 MJ/kg119.93 MJ/kg
Flame velocity30 cm/s265–325 cm/s
Autoignition temperature530 K858 K
Chemical compositionC12H23H2
Table 4. Attributes of the ANN model.
AttributesDescription
ParametersThree Inputs, Two Outputs, One hidden layer
Network TypeFeedforward backpropagation
Total number of data sets210
Number of data sets for ANN training147
Neuron in hidden layer10
Data Division15% for validation, 15% for testing and 70% for training
Table 5. Factors and levels.
FactorsUnitsLevelsL [1]L [2]L [3]L [4]L [5]L [6]L [7]
SpeedRpm71000120014001600180020002200
Flow rateLPM60246810---
Load%5918273645------
Table 6. BSFC fit summary.
Sourcep-ValueAdjusted R²Predicted R²
Linear<0.050.72240.7135
2FI<0.050.74820.7316
Quadratic<0.050.99390.9922
Table 7. BTE fit summary.
Sourcep-ValueAdjusted R²Predicted R²
Linear<0.050.91870.9161
2FI<0.050.93680.9335
Quadratic<0.00010.99400.9958
Table 8. ANOVA for BSFC.
SourceSum of SquaresDfMean SquareF-Valuep-Value
Model11.5191.28383.56<0.0001
A-Speed1.0611.06317.29<0.0001
B-Flow rate0.035710.035710.71<0.0001
C-Load7.7517.752324.75<0.0001
AB0.000010.00000.00320.9551
AC0.338410.3384101.49<0.0001
BC0.015610.01564.680.0317
0.060610.060618.18<0.0001
0.000110.00010.02400.8771
2.2512.25674.88<0.0001
Table 9. ANOVA for BTE.
SourceSum of SquaresDfMean SquareF-Valuep-Value
Model15229.9591692.221298.30<0.0001
A-Speed2724.0412724.042089.93<0.0001
B-Flow rate110.221110.2284.56<0.0001
C-Load11414.41111414.418757.34<0.0001
AB19.49119.4914.950.0001
AC262.831262.83201.65<0.0001
BC9.0319.036.930.0091
31.18131.1823.92<0.0001
0.348110.34810.26710.6059
658.421658.42505.15<0.0001
Table 10. Optimization setup.
FactorsDesired
Goal
Lower
Value
Upper ValueLower
Weight
Upper WeightImportance
A: Speed (rpm)Is in range10002200113
B: HHO Flow rate (LPM)Is in range010113
C: Load (%)Is in range045113
BSFC (kg/kWh)Minimum0.1968221.27606113
BTE (%)Maximum6.2222141.9617113
Table 11. ANN and RSM comparison.
Models ParametersMRE%RMSE
ANN BTE (%)1.910.27
BSFC (kg/kWh)2.640.012
RSM BTE (%)2.260.41
BSFC (kg/kWh)2.940.088
Publisher’s Note: MDPI stays neutral with regard to jurisdictional claims in published maps and institutional affiliations.

