
Examining the Relative Impact of Drivers on Energy Input for Municipal Water Supply in Africa


1
Institute for Water Quality and Resource Management, 1040 Vienna, Austria
2
Alchemia-Nova GmbH, 1140 Vienna, Austria
3
International Institute of Applied Systems Analysis, 2361 Laxenburg, Austria
*
Author to whom correspondence should be addressed.
Sustainability 2021, 13(15), 8480; https://doi.org/10.3390/su13158480
Submission received: 25 June 2021
/
Revised: 19 July 2021
/
Accepted: 26 July 2021
/
Published: 29 July 2021
(This article belongs to the Special Issue Sustainable Water–Energy–Food Nexus)
Abstract
:This study examines supply-side and demand-side drivers of municipal water supply and describes how they interact to impact energy input for municipal water supply in Africa. Several key compound indicators were parameterized to generate cluster centers using k-means cluster analysis for 52 countries in Africa to show the impact of water supply–demand drivers on municipal water supply and associated energy input. The cluster analysis produced impact scores with five cluster centers that grouped countries with similar key compound indicators and impact scores. Three countries (Gambia, Libya, & Mauritius) were classified as outliers. Libya presented a unique case with the highest impact score on energy input for raw water abstraction, associated with largescale pumping from deep groundwater aquifers. Multivariate analysis of the key indicators for 20 countries in sub-Saharan Africa that are either water-secure or water-stressed illustrate the relative impact of drivers on energy input for municipal water supply. The analytical framework developed presents an approach to assessing the impact of drivers on energy input for municipal water supply, and the findings could be used to support planning processes to build resilient drinking water infrastructure in developing countries with data challenges.
1. Introduction
Energy is needed in the municipal water sector for drinking water production and supply processes (i.e., raw water abstraction, treatment, and distribution), as well as for wastewater collection, conveyance, treatment, and disposal or reuse. Globally, 7% of total energy generation is used in the municipal water sector [1]. The intensity of energy used for drinking water supply varies widely across the world with the type of water supplied and the supply system characteristics. Energy intensity for drinking water supply could range from, for example, 0.2 kWh/m3 in Australia to 4.07 kWh/m3 in Spain [1]. In addition, about 0.0027 kWh/m3 are required to lift groundwater a distance of 1 m in a frictionless system operating at 100% efficiency [1]. Furthermore, the costs associated with energy input for municipal water supply are significant, reaching up to 40% or more, especially in water-stressed regions where utilities pump groundwater from greater depths or exploit alternative water sources such as brackish and saline water sources, which are typically energy-intensive [2]. Depending on the source and quality of raw water and the size and topography of the service area, energy input can account for up to 70% of the total operational costs of municipal water utilities [3]. Furthermore, energy input constitutes the largest single controllable operational cost factor for many municipal water utilities worldwide [2]. Therefore, managers of municipal water infrastructure must examine the implications of raw water abstraction, treatment, and supply choices to minimize or optimize energy use. As a result, there is a growing awareness of the potential for energy use planning in the municipal water sector. Planning and implementing a resilient energy management and control strategy is important, especially for small-scale operations, which are most vulnerable to fluctuations in energy prices. Adequate planning ensures that water supply infrastructure is built to cope with environmental and socio-economic transitions, especially in countries with rapidly growing water demand due to accelerated population growth and limited capacity for adaptation to climate change [4].
The growing awareness of the potential for efficient resource use has earned the interaction between water and energy, defined within the Water–energy Nexus framework as the relationship between production and consumption of water and energy resources, a prominent position in the United Nations (UN) post-2015 Development Agenda to ensure that water and energy policies are consistent with other development sector objectives through the Sustainable Development Goals (SDGs) [5,6]. For instance, the operationalization of the water–energy nexus in water supply (Figure 1) through interventions into structural energy inefficiency in the operations of municipal water utilities could translate directly into climate action on both mitigation and adaptation when interventions are carefully thought through. Many countries in sub-Saharan Africa still produce a large fraction of their electricity from coal-fired power plants. In fact, coal accounted for 99.6% (in 2018) and 87.6% (in 2019) of total electricity generation in Botswana and South Africa, respectively [7]. A switch to renewable energy sources to power decentralized water-supply infrastructure, especially in rural areas of sub-Saharan Africa, could accelerate access to drinking water supply [8] whilst reducing emissions and building the resilience of countries to deal with the impacts of climate change. Much of Africa in general is considerably affected by serious physical and or economic water security challenges. A major development constraint the UN post-2015 Development Agenda is seeking to address SDG 6 regarding universal access to water, sanitation, and hygiene. Physical water scarcity is widespread in some parts of the arid northern, eastern, and southern regions of the continent, while almost all African countries face economic water scarcity, with Eritrea, Somalia, Burkina Faso, Niger, and Senegal identified as the most vulnerable [9]. With respect to economic water scarcity, renewable freshwater recharge is sufficient to cover human and ecosystem needs, but shortages in water supply have persisted due to inadequate infrastructure and underinvestment, in addition to problems with operational inefficiencies and lack of access to energy for municipal water supply. As a result, several countries, especially in sub-Saharan Africa, are experiencing a decrease in access to safe drinking water, as progress on universal access has been outpaced by additional demand due to population growth and rapid urbanization [10]. According to the Joint Monitoring Programme (JMP) for Water Supply and Sanitation of WHO and UNICEF (the official United Nations mechanism tasked with monitoring progress on SDG 6), 400 million people in Africa still relied on limited services, unimproved water sources, or surface water for domestic use in 2017. Furthermore, the proportions of the population using at least safely managed water sources varied significantly among urban (84% and 87%) and rural populations (44% and 49%) between 2015 and 2020, respectively [11].
Municipal water supply is subject to environmental and technical constraints, which are further exacerbated by global trends and drivers such as climate change, population growth, urbanization, and changing lifestyles, as illustrated in Figure 1. These trends are driving up the operational costs of municipal water utilities [12,13]. For example, it is projected that the total population of Africa will reach 2 billion in 2050, about 67% of which will live in urban and urbanizing areas [14]. A large set of supply-side and demand-side drivers have been reported in [15,16,17]. Furthermore, a growing number of studies, e.g., [18,19], have discussed the environmental and human impacts on water systems. Drivers such as hydrological, demographic, or socio-economic changes influence water supply and demand, which consequently impact the energy input for municipal water supply [12,13]. However, most operators of municipal water utilities in sub-Saharan Africa lack the analytical tools to understand how current and future developments impact the energy requirements of water utilities. While some engineering models exist to predict and estimate the energy requirements of water utilities, it is still challenging to aggregate the impact of drivers in decision-making processes. Decision makers and operators of municipal water infrastructure in sub-Saharan Africa could learn from the results of several empirical and modeling studies on energy audits [20] and operational assessments [21] of water infrastructure management elsewhere. However, these findings cannot be generalized, as they vary in scale within and between countries, depending on a multitude of factors and processes that are usually context-specific (e.g., data availability, location, source of raw water abstracted, size of the municipal water utility, etc.). This makes planning extremely difficult in developing countries, especially in sub-Saharan Africa, where data challenge is a major constraint for decision making. One way to overcome data limitations is to derive proxy and quantifiable indicators of drivers for which data are available. By connecting environmental and socio-economic variables into technical and operational processes of municipal water infrastructure, water utilities can undertake long-term resource optimization to their advantage. Another incentive to focus on drivers is the fact that additional improvement in the technical efficiency of energy-consuming devices and processes along the water supply chain flattens at peak levels of performance [22,23].
The objective of this study was to describe supply-side and demand-side drivers of municipal water supply in Africa and demonstrate how several drivers interact to impact energy input for municipal water supply. The study applied the water–energy nexus concept to municipal water supply with a focus on Africa for the following reasons: (i) there is a widespread lag in water infrastructure expansion behind demographic change in many countries in the region due to rapid population growth, urbanization, and under-investment in water infrastructure; (ii) a large proportion of the population still lacks access to improved drinking water, sanitation, and hygiene services; (iii) improvements in energy efficiency and the potential to minimize operational costs could free financial resources for upgrading and expanding existing water services; (iv) every kWh of electricity and the associated costs that are saved by water utilities through energy efficiency operations could translate into more kWh of electricity for other productive uses and increased potential for expansion of water supply services. The key research questions this paper sought to answer included: (a) What are the key drivers of municipal water supply and demand in Africa? (b) What data sources can be explored at the country-level to quantify the identified drivers? (c) How do the identified drivers interact with each other among different countries in Africa and how do they impact energy input for water supply?
Approach of the Study
This study examines water supply and water demand drivers of municipal water supply, defined as natural as well as socio-economic, political, and technological factors that may contribute to changes in water supply and demand and ultimately the energy input for municipal water supply in the short and long term. A combined influence of these drivers on municipal water supply has created the need to explore additional, and in some cases, energy-intensive water sources to meet increasing water demand. In this regard, most water utilities in sub-Saharan Africa are faced with an increased need to understand how these drivers will influence their energy needs, energy sources, and energy costs in the future. While there is growing interest in understanding the interaction between water and energy in water utilities, the influence of water supply and demand drivers on their operations remains largely unexplored in Sub-Saharan Africa. This study advances on work performed by [19] specifically for African countries by examining and quantifying these drivers and exploring the linked influence on energy use for water supply. Figure 2 summarizes the methodological approach of the present work. Firstly, indicators for water supply and demand drivers were identified and parameterized, which were then applied to develop a conceptual flow model that illustrates the relative impact of drivers on each other. Furthermore, a cluster analysis was applied to establish which countries group together based on the identified indicators as the basis for possible similar intervention strategies. Lastly, a multi-variate analysis was performed to visualize the magnitude of impact of identified drivers on energy intensity for municipal water supply in general.
2. Materials and Methods
This section provides the review of data portals to identify the country-level water supply and demand drivers and how these drivers were categorized. The relationship between the drivers and how the countries cluster based on selected indicators for the water supply and demand drivers is provided. Furthermore, the relative impact of selected drivers on energy intensity for water supply in selected countries is visualized through principal component analysis.
2.1. Parameterization of Indicators
A systematic review of publicly available data portals, particularly those with country-wide data on national water availability, water supply and demand, and socio-economic parameters for countries in Africa, was conducted to identify and parameterize indicators of supply-side and demand-side drivers of municipal water supply. Additionally, several studies including [12,13,15,16,17,18,19] examining the following issues were included: (i) energy input for single water systems (e.g., utilities or cities/municipalities that manage them), (ii) global and regional models and assessments of climate and hydrological processes applicable to Africa, (iii) freshwater water withdrawal by water use sectors (municipal, agriculture, manufacturing, mining, power generation, etc.), and (iv) water use patterns and related impacts on water quantity and quality. It is worth noting that the following factors were not reflected in the analysis: (i) conditions at a sub-national scale, (ii) influences originating from foreign countries, (iii) topography, (iv) type of technology used and related operational efficiency, (v) economies of scale, and (vi) inter-annual variability of the indicators identified.
Indicators were identified, parameterized, and grouped into either supply-side or demand-side drivers based on the forcing factors they represent, which either directly or indirectly affect the energy input for municipal water supply due to changes in the volume of municipal water that must be produced and distributed to address a forcing factor. The following categories were used to group the indicators into supply-side and demand-side drivers for municipal water supply.
- Drivers affecting freshwater availability (water quantity):
Data on the total annual renewable freshwater resources per capita (m3/capita) were obtained for each country. Freshwater withdrawal by the main water-using sectors was divided into municipal, agricultural, and industrial water demand, as provided by the main reference data portals AQUASTAT [24] and World Bank Open Data [25]. The annual freshwater withdrawal for agricultural use as a fraction of total annual freshwater withdrawal was used to indicate the influence of agricultural water demand and its impact on water resources relative to the other two main water use sectors (i.e., manufacturing and municipal water use). The same procedure was applied to water use by the manufacturing sector. In the absence of data on actual annual abstraction by the type of raw water sourced, the ratio of total renewable surface water to total renewable groundwater was applied to indicate the relative dependency on the type of freshwater source. The present paper uses value-added (VA) growth rates of the two major competing sectors to capture the effect of rising demand for agricultural and industrial goods as a driver of freshwater withdrawal. By definition, imports are excluded from value-added growth rates, which include only domestic production. Agricultural and industrial VA growth rates were accessed from the AfDB Socio Economic Database [26], which provides more recent values than the World Bank Open Data database [25], although no data were found for South Sudan.
- 2.
- Drivers affecting freshwater availability (water quality):
Drivers of water quality were quantified based on the WorldQual model, validated for the European region [27,28,29,30,31] and applied to Africa [29]. Due to the general lack of data on contamination levels in groundwater and surface water, several parameters were compared to the results of the pollution model, which was conducted by [29] for the African continent. The distribution of national-level values for number of people living in agglomerations larger than 1 Million as a percentage of the total population and average population density per km2 [25] was compared to the modeled contamination levels, of which the latter coincided most with the outputs of [29].The portion of wastewater (%) that is treated was quantified based on updated data provided by the Yale Center for Environmental Law and Policy (YCELP), Center for International Earth Science Information Network (CIESIN), and World Economic Forum (WEF) for all countries, except Comoros, Somalia, and South Sudan [32].
Several demographic and socio-economic factors influence municipal water demand, including population growth, the share of the total population that is urban, and the rate of urbanization [33,34,35]. These factors including the annual population growth rate (%) were quantified using data by [25]. The same data portal was used to generate data on annual per capita income (GDP) (USD/cap), which were used to quantify the influence of the changing lifestyle and economic capacity of the population on improved water supply and sanitation services. The International Benchmarking Network for Water and Sanitation Utilities (IBNET) portal [36] was used to retrieve data on population with access to improved municipal water services. The total annual municipal withdrawal was estimated as the fraction of withdrawals (%) for domestic needs from total annual freshwater withdrawals (m3). In addition, the annual municipal withdrawal per capita was estimated to capture how much this metric could increase as economic development advances.
- 3.
- Utility operations directly impacting energy input for municipal water supply:
For groundwater abstraction, the median values of the depth of boreholes from which groundwater was abstracted were calculated. Data for the depth of boreholes were provided in [37,38]. Data on cost of electricity (USD/kWh) for raw water abstraction, treatment, and distribution for different countries in Africa were obtained from the World Bank database on “Doing Business: cost of electricity” [25]. Data on non-revenue water (l/capita/day), or distribution losses, were quantified from the most recent available data on [36], and the median estimates of non-revenue water loss were computed for those countries where several utilities operate within their jurisdiction. Non-revenue water loss was identified and computed as an operational driver within the operational boundaries of utilities that directly affect energy input per unit volume of municipal water produced and supplied as energy input associated with water losses.
2.2. Developing the Conceptual Flow Model and Generating Impact Scores
A conceptual flow model was developed from the output of the literature review on the demand-side and supply-side drivers to show the impact of the selected drivers on each other. The indicators identified from the review process were related to each other in a conceptual flow model using subSTance flow ANalysis (STAN), a material flow analysis software developed by the Technical University of Vienna [39]. The key indicators quantified were combined into compound indicators, and a Microsoft Excel spreadsheet was used to harmonize the data and calculate/quantify the compound indicators.
2.2.1. Generating Impact Scores to Compare Countries within a Reference Group
Compound indicators express a range of impact scores (0–1, i.e., low to high, respectively) at the country level to generate impact clusters that group of countries with the same impact scores from similar indicators and drivers. The fifty-three (53) countries in Africa were grouped by the ten compound variables. A hierarchical cluster analysis was performed in Statistical Package for the Social Sciences (SPSS Version 22.0) using median linkage and Ward’s method, with Squared Eucledian Distance [40]. The common denominator of both approaches was an optimal partition at eight (8) clusters based on the error coefficients at the subsequent clustering stage. A k-means cluster analysis (k = 8) was performed to define narrower groups. The map was generated with CartoDB.
To combine and compare data with different units and ranges, the values were standardized using z-score normalization.
where xi is the country-level values of the two original vectors (x), respectively.
In this way, the variables maintain different means and standard deviations, but the ranges are the same, which maintains reflecting single high or low values in proportion within the 0–1 scale of the impact score. The weighted indicator, or compound variable (Cvar), is the sum of normalized sub-indicators:
where V = (V1, V2 … Vn) is the vector of observed values for the defined variables measuring the impact of the drivers, and zi stands for the normalized components with values (V1, V2 … Vn) for all countries in Africa.
Finally, the weighted indicator was normalized for comparison with other weighted indicators, yielding a 0–1 value.
2.2.2. Compound Indicators Affecting Freshwater Availability by Impact on Water Quantity
The impact of an increase in net agricultural production, i.e., domestic production, using annual growth rate of agricultural value-added (%), is expressed by AGR. Using value-added growth to capture the effect of rising demand for agricultural and industrial goods as a driver of freshwater withdrawal captures only domestic production, not imports. This is weighted by the industry’s proportion of total water abstraction, i.e., annual freshwater withdrawal by agriculture as a fraction of total withdrawal (%). The indicator is corrected for overall resource use and availability, using the scalar fraction of total annual freshwater abstraction (m3/year) over total renewable freshwater (m3/year). If the fraction of annual renewable water withdrawn from overall available freshwater in a country is very low, there is room to expand total abstraction without municipal water utilities having to move to more energy-intensive freshwater sources.
The three vectors are standardized and added, yielding:
Additionally, the impact of net industrial production growth corrected for its contribution to total freshwater abstraction and water availability is expressed using IND. Annual freshwater withdrawal by agriculture as a fraction of total withdrawal (%), annual growth rate of industrial value addition (%) and total abstraction over total recharge are combined as in AGR. Furthermore, the impact from relative dependency on groundwater adjusted for different groundwater tables is expressed by GWD. The scalar fraction of total renewable surface water (m3/year) over total renewable groundwater (m3/year) is combined with the normalized values of annual renewable groundwater over land area (m3/km2). Country-level data on average groundwater tables are available only for few African countries so renewable groundwater over land area is used as a proxy. The regional distribution of the results is largely consistent with the estimates for the African mainland modeled by the Natural Environment Research Council (NERC), [41].
2.2.3. Compound Indicators Affecting Freshwater Availability by Impact on Water Quality
The impact of population density adjusted by population growth rates is abbreviated as PDEN, while the impact of wastewater collection and treatment rates against relative source dependency is expressed by WWM. Wastewater management practices influence water quality through the coverage of wastewater collection (population with access to improved sanitation facilities (%)—ACCSAN) and treatment levels (fraction of wastewater that is treated (%)—WWTREAT). Both access to sanitation and treatment levels are reversed using 1 − zi (xi). Their mentioned relationship is captured by the coefficient a(WQ), defined as the parabolic relationship between the difference of the normalized values of the two variables (range 0–1). Therefore, if there is a large disparity between wastewater collection and treatment rates, water quality is threatened most strongly. This is true for both high positive and negative values. A high positive amplitude indicates that access to sanitation is widely in place, while treatment levels are low. A high negative difference indicates that treatment levels are high, but wastewater collection covers only a small fraction of human waste, which means that water quality is again threatened more strongly than if the difference is low.
As a(WQ) does not reflect whether the absolute values of collection and treatment levels are high or low, it is multiplied with the sum of the two components as follows:
If coefficient a(WQ), ACCSAN, and WWTREAT are high, but surface water to groundwater dependency is low, this yields the least impact on water quality and is therefore represented by the lowest value of WWM. Therefore, the product γi is reversed to capture the low values, which imply high impact. High relative dependency on surface water (as surface water over groundwater, SWGWDEP) leads to a higher impact on treatment requirements for potable water if surface water is more severely polluted by municipal wastewater.
The compound variable for risk from requirements for purification is defined as follows:
where zi(γi) is the normalized value of each component, respectively, and V = (V1, V2 … Vn) is the vector of observed values for each of the variables.
The impact of agricultural sector growth on water quality is represented by WQA. The compound variable is the sum of the fraction of freshwater withdrawal by agriculture, agricultural value-added (VA) growth, renewable groundwater per land area, and reversed relative source dependency. Using annual renewable groundwater over land area (m3/km2) excludes fossil aquifers. The normalized score of relative source dependency is reversed to reflect that high relative dependency on surface water means a lower impact from agriculture, as agriculture primarily pollutes groundwater.
The impact of industrial sector growth on water quality is represented by WQI. If the relative surface water dependency ratio is high, the industrial sector has a stronger influence on potable water treatment requirements.
2.2.4. Compound Indicators Affecting Municipal Water Demand
The increase in urban inhabitants is captured by UPG, which comprises the normalized scores of annual urban population growth rates (%) and annual population growth rates (%). Both create the need to expand water services. On the other hand, increasing per capita water demand is expressed by CWD. This combines (1) rising living standards, with annual average per capita income growth, α, (%) as a proxy; (2) expected expansion of access to improved water sources, or scope for further expansion, parameterized with the reversed score of population with access to improved water sources, β, (%) as a proxy; and (3) the difference (γi) between the average municipal water withdrawal per urban inhabitant in developed countries, as the OECD mean, and the average annual municipal water withdrawal per urban inhabitant (m3/urban inhabitant) for each country i. A large distance between average OECD-level consumption and the respective volume in country i suggests that per capita water demand will steeply rise from this low level if enabled by economic development and increased access to public water services.
The compound variable is calculated as follows:
Finally, CRW reflects the contribution of water losses, using non-revenue water (NRW) as a fraction of total municipal water produced that does not reach the consumer (%) and daily volume of municipal water supply that is lost per water supply connection (m3/connection/day). Non-revenue water loss directly affects energy input for municipal water supply. It can be used to quantify potential savings in costs of electricity for municipal water supply, including other related operational costs. However, this compound indicator was not included in the cluster analyses of compound indicators due to the lack of sufficient data.
2.3. Impact Analysis of Parameterized Indicators for Water Security Clusters
Principal component analysis (PCA) was applied to fourteen (14) of the indicators that were parameterized to examine and visualize the relative impact of identified drivers on energy intensity for municipal water supply using Sigma Plot version 14.0. The indicators selected included the daily per capita water production and daily per capita water consumption, water coverage, water losses within water utilities distribution networks, the proportions of water withdrawal for agriculture and industrial use, proportions of water withdrawal for municipal water supply, annual gross domestic product per capita, median depth of boreholes, and the electricity tariff levied on water utilities by the electricity providers. PCA was chosen as a multi-variate statistical tool to identify the indicators with the highest component loadings and hence the highest influence on energy input. PCA reduces the dimensionality of the data by building up on correlation analysis to identify the indicators, which account for the largest proportion of variance in the dataset that are not captured by the correlation analysis [42,43]. As outlined in [42], only those principal components with the highest loadings were assigned attributes to show the impact on energy input. The analysis was performed for twenty (20) countries in sub-Saharan Africa, which were selected based on the best possible complete data available. Among the twenty countries selected, there was a wide range in the total renewable per capita annual freshwater available. Therefore, the countries were grouped into two categories of water-secure and water-stressed countries according to the Falkenmark Water Stress Indicator [44].
3. Results
This section provides water supply and demand drivers that were identified from the literature search and the references where these drivers can be accessed. A conceptual framework of the influence of the identified drivers showing either a positive or negative influence is also provided. In addition, a cluster analysis showing how the countries grouped together based on the indicators of water supply and demand drivers is presented. Lastly, the relative impact of selected indicators on energy use for municipal water supply in selected water-secure and water-stressed countries in Africa is illustrated through principal component analysis.
3.1. Supply-Side and Demand-Side Drivers of Municipal Water Supply
Table 1 presents the main demand-side and supply-side drivers of municipal water supply identified from the literature review, with notes on the indicators and the units used to parameterize the drivers. In addition, Table 1 shows the key data portals and additional sources from which the data for each of the quantified indicators was obtained. The drivers identified were categorized into four overarching categories: (i) drivers affecting freshwater availability (water quantity), (ii) drivers affecting freshwater availability (water quality), (iii) socio-economic factors affecting freshwater water availability (water quantity), and (iv) operational factors directly impacting energy input for municipal water supply as described in the methods section. Data portals for quantified indicators are provided as Supplementary Table S2.
3.2. Interactions between Supply-Side and Demand-Side Drivers
Figure 3 presents the conceptual flow developed with STAN software (see methods section), which illustrates the interactions between the supply-side and demand-side drivers. The arrows indicate whether the drivers amplify (+) and/or dampen (−) the influence of other drivers and indicate how the drivers contribute to the four overarching categories of drivers (Section 3.1 and Table 1), which interact to influence energy input for municipal water supply. For interactions between drivers where both amplification and dampening occur, the designation (+, −) is applied to the conceptual flow model. The colors represent different set of drivers (forcing factors) including environmental, social/demographic, and water utility operational drivers. The conceptual flow model comprises forcing factors belonging to the natural environment (green); impacts from the water productive use sectors, e.g., agriculture and the manufacturing industry (purple); demographic changes (yellow); and operational conditions/processes related to municipal water infrastructure within the operational boundaries of water utilities (red). As a natural forcing factor, climate (green) produces precipitation (which in turn increases freshwater availability) and drives potential evapotranspiration (which reduces available water from exposed surfaces and reservoirs, and through vegetation losses (evapotranspiration)). Precipitation has an amplifying effect on total runoff, which is captured as surface runoff (1a). On the other hand, evapotranspiration reduces total runoff (flow 1b) and water held in reservoirs (1c). Land-use change (blue) could amplify or dampen biophysical exchange drivers (6), which may be altered by climate forces, either by increasing or decreasing total runoff (1d) and/or by increasing or decreasing freshwater demand for agriculture (1e). Biophysical drivers such as land cover, soil type, and the nature of the topography could increase or reduce total runoff (2a), whereas topography on its own may directly influence the energy needs of water utilities for pumping and pressure maintenance (2b). Total surface runoff may increase available freshwater resources (3) for abstraction with increased storage capacity (4), which can be natural (green) or manmade (purple), although evaporation/evapotranspiration in reservoirs could decrease water availability (1c).
The productive sectors, e.g., agriculture and the manufacturing industry (purple), compete directly for available freshwater resources with demand for municipal water supply. These competing uses reduce the quantity of freshwater available for municipal water supply (7a). In addition, they impact the water quality of receiving water bodies (7b), which in turn could reduce the available freshwater for municipal water supply and/or increase the cost of drinking water treatment, with direct consequences for energy input. Structural changes can amplify or dampen the water use of the productive sectors (8), and wastewater reuse/recycling may reduce the water demand (9) of the productive use sectors, as well as their impact on water quality. The impact of productive use sectors is typically amplified by population growth (10a) and growth in per capita income (11a). High population densities, amplified by population growth (10b), especially in urban settings with inadequate solid waste and wastewater collection and treatment, could reduce water quality (12). Growth of the urban population increases municipal water demand (10d), whereas urbanization may cause urban sprawl (10c), which in turn directly increases energy input for water production and distribution (13). Additional amplifying drivers of municipal water demand include per capita income growth (11b), water losses within the distribution network of water utilities (15), and access to water services (16a). Demand for water services increases with improvements in living standards, as per capita income grows (11c). Change in household technology could either increase or decrease water demand (14). Wastewater treatment improves water quality (16b). Without adequate wastewater treatment facilities, increased access to improved sanitation could reduce ambient water quality (16d), but improved sanitation access (when combined with adequate wastewater collection, treatment, and disposal or reuse) may reduce the impact of wastewater effluents on receiving water systems (16c). Through reduced electricity tariffs, water utilities can be incentivized to adopt energy-efficient water supply technologies (17), which in turn influences the overall operational efficiency (18) and reduce energy use and the associated electricity costs for water production. Higher specific pressure that must be met within the water distribution network may reduce the operational energy efficiency and increase energy input (19) for municipal water supply.
3.3. Relative Impact of Demand-Side and Supply-Side Drivers on Energy Input
Table 2 presents a summary of the parameterized indicators of drivers for water-secure and water-stressed countries in sub-Saharan Africa, used as a basis for principal component analysis.
Agriculture was the main competing user of available freshwater resources in several countries, except for Equatorial Guinea and Central African Republic (CAR), with 15% and 17% freshwater withdrawal for agriculture, respectively. In Mali, freshwater withdrawal for agriculture accounted for up to 98% of total annual withdrawals (the highest in for the countries listed). Municipal water withdrawal as a proportion of total annual freshwater withdrawal ranged from 2% in Mali to 83% in CAR. Municipal water withdrawal was relatively low in Ethiopia, Senegal, and Tanzania with less than 10% of the total annual freshwater withdrawal for each country compared to Kenya (35%), Nigeria (40%), and Uganda (51%). In contrast, municipal water withdrawal was relatively high in Equatorial Guinea (80%), where the population with access to drinking water services (water coverage) was also relatively high (72%), although the daily per capita water production (42 l/p/d) and consumption (29 l/p/d) were low.
The GDP per capita (USD/cap) for Equatorial Guinea was relatively high (18,558) compared to South Africa (12,482), Nigeria (5135), Kenya (4329), or CAR (945). In addition, Equatorial Guinea had the second highest total annual renewable freshwater per capita among the 20 countries in sub-Saharan Africa for which data were available (Table 2). In fact, Equatorial Guinea is classified as water-secure, although the daily per capita water production (42 l/p/d) and consumption (29 l/p/d) were relatively low. Similarly, CAR has the highest total annual renewable freshwater per capita and is classified as water secure. Nevertheless, the country had the lowest water coverage (46%) among the countries listed and relatively low per capita daily water production (79 l/p/d) and consumption (39 l/p/d). In contrast, South Africa, with close to 100% coverage, had the highest per capita water production (235 l/p/d) and consumption (190 l/p/d) in the region, although the total annual renewable freshwater per capita is among the lowest in the region (786 m3/cap/yr). In addition, agriculture and industry together accounted for more than 70% of the total annual freshwater withdrawals in South Africa compared to municipal water withdrawal, which was 27%.
The price of electricity impacts the fraction of the total operating costs of water utilities that can be attributed to energy input for operational processes such as abstraction and distribution. The price of electricity was relatively high for Equatorial Guinea (0.217 USD/kWh) compared to South Africa (0.072 USD/kWh) or Zambia (0.047 USD/kWh) and Ethiopia (0.020 USD/kWh), with the lowest electricity tariffs in the region. Additionally, the cost of electricity as a proportion of total operating costs varies with water utilities due to the unique operating conditions and the varying energy requirements for water supply depending on the type of raw water supply. Based on the data available, electricity costs as a proportion of operating costs ranged between 9% in both Malawi and Mozambique and 40% in Senegal.
Both Equatorial Guinea and CAR recorded higher average water losses, i.e., 33 and 44 m3/km/day, respectively, compared to South Africa with 30 m3/km/day. Water loss has been identified as a major driver for energy use and cost multiplier in the operations of water utilities. The highest average water loss was reported for Tanzania (59 m3/km/day) and Kenya (50 m3/km/day), both with relatively lower water coverage levels, i.e., 63% and 56%, respectively. Water loss was relatively low for Benin (5.3 m3/km/day), Niger (6.6 m3/km/day), and Rwanda (7.21 m3/km/day), and the three countries had higher water service coverage (78%, 86%, and 78%, respectively) compared to Tanzania and Kenya.
Figure 4 presents the mono-plot of the selected water-secure countries in sub-Saharan Africa presented in Table 2. It was observed that Principal Component 1 (PC1) accounted for the highest variation (41.7%) in the data set compared to PC2 (27.95%) and PC3 (12.4%). Collectively, the three principal components accounted for 82% of the total variations in the data. PC1 was attributed to water demand from competing uses from the productive sectors (agriculture and industry), whereas PC3 and PC2 were ascribed to municipal water supply and water loss within the distribution system, respectively. Water loss correlated negatively with population density, a major influence on the complexity of the water supply network and energy input for municipal water supply. Daily per capita water production and per capita water consumption and GDP per capita were clustered closely with similar trajectories, implying that an increase in one indicator directly resulted in an increase in the other. GDP per capita correlated positively with industrial water demand, suggesting that the higher the GDP per capita, the higher the industrial water demand as the demand for manufactured goods increase. Agricultural water demand and municipal water demand had higher vector magnitudes in opposite directions, implying that agricultural water demand is a major competing user with municipal water demand, which correlated positively with the proportion of the population with access to water services (water coverage), which correlated negatively with water loss.
Additionally, Figure 5 shows the mono-plot of the pooled data for the selected water-stressed countries in sub-Saharan Africa (as shown in Table 2). Most of the variation in the data was explained by the first three principal components, which contributed 72% of the total variance, with PC1 accounting for 27.5%, while PC2 and PC3 were responsible for 22.9% and 21.1%, respectively. PC1 was attributed to demand-side drivers, i.e., water demand from competing uses. PC2 was assigned to the operational processes, including water loss in the distribution system and electricity costs for water production. It was difficult to assign PC3 to any compound indicator. The indicators were grouped into four clusters with non-revenue water losses, agricultural water demand, municipal water demand, and water coverage displaying the longest vector lengths. Agricultural water demand clustered with total renewable freshwater per capita, which correlated negatively with municipal water demand. Water loss, which is represented by the non-revenue water, correlated positively with population density and negatively with water coverage and per capita water consumption. Water coverage in terms of per capita production and consumption correlated positively with GDP per capita, suggesting that the ability to pay for water services reflects the proportion of the population with access to water services (water coverage), which correlated negatively with water loss, as illustrated for water-secure countries.
3.4. Cluster Centers with Identical Compound Indicators and Impacts Scores for African Countries
The compound indicators provided in Section 2.2.1 were used for the cluster analysis to group the countries with similar impact scores where the k-means cluster analysis produced five (5) cluster centers based on the dendrogram using Ward Linkage with 0.401 being the minimum Squared Eucledian Distance between clusters (Figure 6). The dendrogram was used as a first visualization of distances and possible clusters, not to allocate cases (countries) to clusters. The dendrogram shows which cases are more similar to each other. The differences are shown as the length of the clades (horizontal lines before connection to other clusters/cases). Cluster centers 1, 2, and 3 had eight (8) countries each and Cluster 4 had four (4) countries, whereas Cluster 5, which was the largest cluster center, had twenty-one (21) countries. Three countries—Gambia, Mauritius, and Libya—did not cluster, and they were classified as outliers. Figure 6 shows the map of Africa, delineating countries according to the cluster centers from the data of the key compound indicators. Mauritius deviated from the other cluster centers with a significantly lower impact arising from the manufacturing industry, extremely high impact of population density, and even greater impact of agriculture to water quality. Low impact on infrastructure management is derived from extremely low values of change in municipal water demand. The Gambia had significantly lower impact from agriculture and groundwater pumping requirements on energy intensity of water withdrawal and much lower impact of agriculture on groundwater quality than elsewhere, while experiencing much higher potential increases in surface water pollution by urban wastewater and industrial effluents. The Gambia had a remarkably high relative impact by growing numbers of the population demanding municipal water and a relatively lower increase in per capita demand compared to the average levels of impact in Clusters 1–5. Libya presented an extreme case with the highest impact score on energy input for raw water abstraction. A table of cluster membership is also provided in the Supplementary Section S3.
Figure 7 provides a further visualization of the country cluster centers. Countries in Cluster 1, which included Angola, Benin, Botswana, Ivory Coast, Lesotho, Democratic Republic of Congo, Central African Republic, and South Sudan, had a relatively low impact from agriculture compared to industry in those countries with respect to both water availability (quantity) and water quality challenges. Interestingly, South Sudan and Sudan are not in the same cluster, even though the value added (VA) growth rates of Sudan were used for South Sudan. This means hydro-climatic variations are large enough to separate the two countries, which suggests that analyzing the two countries as a homogeneous entity, as has been performed in a wide range of research, may significantly distort results. Cluster 2 countries (Djibouti, Eritrea, Mozambique, Namibia, Somalia, and Sudan) were defined by a high impact of municipal wastewater management compared to other drivers of water quality. Countries in Cluster 2 have the highest expected increase in per capita demand for municipal water supply following a combination of low demand and limited water services combined with relatively high increase in per capita income. Countries in Cluster 3 are in the arid and semi-arid zones of northern and southern Africa. Cluster 3 countries experience the highest impact of freshwater withdrawal from agriculture and lowest impact from industrial withdrawal. The impact on energy costs associated with pumping groundwater for countries in this cluster was higher compared to countries in other clusters, except for Libya, with the highest impact score on energy input for groundwater abstraction. Cluster 3 countries had the least pressure from population density and population growth. This cluster had South Africa, Swaziland (Eswatini), and Zimbabwe in the south, and Egypt, Tunisia, Algeria, and Morocco in the north, as well as Cape Verde, an island state in the Atlantic Ocean off the west coast of Africa. These countries had the least impact from wastewater due to improved wastewater management practices compared to countries in other clusters. Countries in Cluster 4—Congo, Gabon, Liberia, and Sierra Leone—are characterized by abundant freshwater resources with relatively low withdrawals for agriculture and industry and low-to-moderate withdrawal for municipal water supply. On the other hand, water withdrawal by agriculture was dominant for the countries grouped in Cluster 5, with a significant impact on water quality. Cluster 5 countries, among them Burkina Faso, Burundi, Cameroon, Chad, Ethiopia, Ghana, Guinea, Malawi, Madagascar, Nigeria, Rwanda, Senegal, Togo, and Uganda, were characterized by water withdrawals from relatively shallow groundwater reservoirs where seepage of excess irrigation water with high nutrient content could contaminate shallow groundwater reservoirs more easily compared to countries with deep groundwater aquifers. A combination of high impact from urban population growth and increasing per capita water demand for Cluster 5 countries suggests increasing energy input for municipal water supply.
4. Discussion
Examining the relative impact of key compound indicators of water supply and demand drivers is important for policy and operational considerations to identify which policy and operational interventions are required for effective water–energy consistent policies and planning to reduce energy input and associated operational costs. The cluster analysis sheds light on regions that could benefit from cross-learning and exchange both within and beyond the water sector. For example, the cluster with Egypt, Tunisia, Algeria, and Morocco in the north of Africa and South Africa and Zimbabwe in southern of Africa shows that physical water scarcity plays an important role in this cluster, although many of these countries have relatively more advanced economies with previous investments in relatively more resilient water infrastructure for different water-use categories compared to other countries. For example, Equatorial Guinea, DRC, and CAR have abundant freshwater resources but relatively low investments in water infrastructure. However, the complexity of the interactions among drivers requires thorough analysis of the key indicators even for a single country.
On the supply-side, hydroclimatic conditions are driven largely by differences in climatic factors, which determine variables such as precipitation and evapotranspiration, depending on the specific geographic position [47]. Ambient temperature, wind speed, specific humidity, atmospheric pressure, and net radiation may influence freshwater recharge rates via precipitation and potential evapotranspiration [48]. Biophysical factors such as canopy, soil type, and topography are more important to determine the actual evapotranspiration rate and effective precipitation, i.e., throughfall, thus determining how much water gained from precipitation is transpired by vegetation, evaporates from the surface, infiltrates to underground aquifers, or runs into surface water bodies. Therefore, they determine the total runoff from land along with the fraction of fast surface water runoff and infiltration or slow subsurface runoff [49]. Prolonged drought conditions on the other hand deplete freshwater reserves beyond their average annual minimum flow (base-flow), which is necessary to sustain ecosystems, and similar alterations occur from direct land use change for human activities [49]. Drought destroys land cover and soil texture, which are critical to local water storage. Water storage reduces inter-annual variability of precipitation and increases the available volume during dry periods [47]. The construction of dams and water towers helps to capture precipitation during heavy rainfall periods, but open-air basins are subject to evaporation losses, as mentioned above. However, such infrastructural investments are expensive and difficult to undertake for many countries in Africa [10,50]. Inter-basin transfers are often extremely energy-intensive so that, in some cases, seawater desalination, which is also energy-intensive, can be a cheaper alternative in water-scarce areas [50,51].
Other clusters tend to group countries largely according to the socio-economic characteristics even if other factors are important. Human-induced drivers provide useful insights into how water supply conditions may impact the operations of water utilities. This is because several demographic factors influence municipal water demand, including population growth, the fraction of the total population that is urban, and the rate of urbanization [34,36]. Urban and metropolitan areas in Africa are rapidly expanding, with many urban areas projected to host over 60% of the population by 2050 [14,52]. Rwanda, Burkina Faso, Burundi, Uganda, Tanzania, Niger, Eritrea, and Mali have the highest rates of urbanization in Africa and in the world [52]. Most of the population in urban and urbanizing areas is currently under-served because expanding metropolitan areas lack adequate water supply infrastructure. Demographic changes impact water availability through direct use of water for domestic needs. The average water intensity of urban households increases as coverage of safe drinking water connections expands. According to [33], in regions where access to water is least developed, the water resources are least exploited, also observed for Central African Republic, which had the highest available freshwater per capita but the lowest water services coverage. Water use tends to increase with proximity to the water source, and in addition, per capita water use rises further as more households gain access to sanitation facilities [53]. Where coverage with water and sanitation connections is very low, there is a high growth potential for water utilities in those areas. However, this depends on national socio-economic conditions, whether infrastructure can be developed or the fraction of the population with access to public water services remains low. Furthermore, the annual municipal water withdrawal per capita can be expected to rise with economic development in the future, especially in cities where per capita municipal water use is currently low. However, as the water withdrawal per capita rises, households eventually become saturated with water-using appliances and habits, which then assimilate/plateaus at peak levels observed in developed countries, leading to a stabilization of per capita municipal water demand [54]. Meanwhile, current trends in Africa are expected to continue as the population grows and more people live in cities and continue to demand more water [4,52]. The increase in water demand will create the need for exploration of alternative water sources in addition to increased water storage, recycling, and reuse [19]. This is already happening in many parts of the continent. Accelerated growth in water demand has led to exploration of alternative water sources including further groundwater exploration, water reuse, and desalination, especially in south Africa and the Maghreb countries in north Africa [55]. Alternative water sources including desalination and increased groundwater exploration are often highly energy intensive. As reported in [56], desalination capacity in South Africa has increased since the last decade, with energy intensities up to 3.70 kWh/m3. Energy requirements for water supply are highly dependent on the water type, the operational efficiency of energy-using devices and processes, and the elevation between water supply points and the end user [57]. Energy input for surface water supply may range from 0.002 to up to 4.07 kWh/m3 for a conveyance distance of 745 km [1]. On the other hand, energy input for groundwater is estimated at 0.0027 kWh/m3 to lift groundwater up 1 m in a frictionless system at peak efficiency, while for desalination, the requirements vary depending on treatment technology, ranging from 0.36 kWh/m3 for reverse osmosis of brackish water to 106 kwh/m3 for multiple-effect distillation of seawater [1]. Groundwater must be lifted from below to make it accessible. Depending on the water level, this can range between 0.14–0.69 kWh/m3 in California [53] or 3.3 kWh/m3 in a water utility in Arizona [58].
Per capita water consumption patterns vary with average per capita income. At the country level, GDP per capita and annual per capita GDP growth rate can give an indication of lifestyle change and the ability to pay for water services. However, water use often levels out with the rate of improvement in the water-use efficiency of domestic appliances and activities [55,59]. Household technology can either increase or decrease the volume of domestic water usage, depending on the type and efficiency of the water-using appliances. However, the greatest impact of technology on municipal water supply is connected to addressing the challenges of aging water infrastructure and poor maintenance culture in Africa. Infrastructure maintenance influences the volume of water loss across the water supply system and hence increases the volume of drinking water that must be produced and delivered to end-users. Water loss from leaking pipes and taps, also termed non-revenue water, correlated negatively with water coverage. Although the share of municipal water withdrawal in CAR and Equatorial Guinea was above 80%, average water losses were also high, at 33 and 44 m3/km/day, respectively. Such high water losses compromise the ability to accelerate water coverage and improve per capita water availability. In addition, water loss in the distribution system impacts energy input associated with water supply to compensate for water loss, which varies depending on the source and quality of raw water, the treatment technology applied, the nature of the distribution system, and the operational efficiency of energy consuming devices and processes. Consequently, the price of electricity is a major driver of energy input for water supply, especially for water utilities abstracting groundwater, which have a higher energy intensity for pumping compared to surface water. This was typically the case for water utilities in Senegal where the median depth of boreholes was reported at more than 300 m compared to the average price of electricity at a global level, which averaged at 0.173 USD/kWh in 2019 [25]. Non-revenue water loss due to leakages in the distribution system remains a serious concern for utilities in Africa. Based on data from the latest country data available in [36], water losses averaged at 45% for most countries in sub-Saharan Africa. However, at the utility level, up to 70% water losses were reported in Zimbabwe and 84% in utilities in Nigeria. Such water losses and associated energy input are unsustainable and compromise the ability to accelerate water coverage. However, most water utilities in sub-Saharan Africa concentrate on increased water production rather than addressing persistent water losses [60]. In addition, many African countries have low adaptive capacities and low uptake and adoption of highly efficient water supply technologies, including designs of new water supply systems, which are crucial for pump optimizations and overall energy efficiency improvements. Instead, water utilities in Africa undertake operational measures to overshoot demand by an average of 30% to compensate for leakages within the distribution system [36]. This means an increase in the volume of drinking water that must be produced and delivered to end-users, which in turn necessitates an increase in the energy required to produce and distribute drinking water.
Electricity price and tariffs from electricity suppliers influence the cost of energy for water supply as a proportion of the total operational costs for municipal water supply. Several tariffs exist for different countries, and the rates are also classified as peak or off-peak. Energy prices and energy tariffs for peak and off-peak power supply are drivers of energy input for water supply that influence the operational sustainability and quality of service delivery. Due to poor operational performance, lack of energy efficiency measures and limited revenue collection efficiency, most water utilities in sub-Saharan Africa face challenges in paying electricity bills, as reported in [61] for Tanzania. Furthermore, a significant challenge exists in the operation of pumps during off-peak hours due to limited storage facilities in most countries in sub-Saharan Africa. The electricity prices influence the proportion of electricity cost for water supply as part of total operational costs. Based on data available in [36], the proportion of electricity price as part of running costs for water supply has been reported to range between 5–40%. Therefore, inability to meet such costs influences service delivery and ability to expand service to under-served areas. Long-term planning of water supply in sub-Saharan Africa will require an investment in the adoption of renewable energy to reduce over-reliance on the grid and adoption of integrated strategies including hybrid grid and off-grid decentralized renewable energy systems utilizing solar, wind, wave, geothermal, and waste-to energy [8,62]. Furthermore, there is high potential in energy generation from micro-hydropower systems [63,64]. Such investment calls for policy and planning that can leverage energy-saving technologies at the national and utility levels. Differences in policy, institutional, and management frameworks across the African region will continue to influence operations and decision-making processes.
Anthropogenic activities also impact water quality [29]. Pollutant concentrations and composition entering water supply systems from municipal, industrial, and agricultural origins influence freshwater quality, especially water turbidity, which in turn has implications for the energy requirement for drinking water treatment. As described in [65], the type and concentration of contaminants present in raw water as well as the treatment technology may influence energy intensity at the treatment. The authors note that water utilities with rapid-gravity treatment technologies are more energy-efficient compared to those using pressure filtration. Furthermore, in contrast to surface water, deep well water (up to 300 m depth) is generally considered microbial-free and usually requires only basic purification through chlorination. However, if underground aquifers interact with surface water flow, they are exposed to microbial contamination from agricultural sources and human waste, as well as chemicals from industrial discharges [53]. Scattered settlements also work as diffuse sources when they lack improved human waste disposal systems [30]. Pollution through human waste is reduced with increased access to improved sanitation facilities [34], but notably only if wastewater treatment is in place [27]. Further, a high relative dependency on surface water suggests a higher impact on treatment requirements caused by wastewater discharge [28]. According to the pollution model by [29], pollution hotspots across the African continent are in regions with high population density and increased human activities. Like allocation of freshwater sources, water quality is also influenced by the institutional setting, specifically, the stringency of regulations [51], the ability to pay for effluent treatment, and the awareness or willingness to pay for water treatment impact receiving water quality [66].
Agriculture and industry water demand may increasingly compete with municipal water demand for easily accessible freshwater sources, leading to the necessity of drawing municipal water from deeper borehole depths or water sources that require more energy-efficient treatment to reach municipal water quality requirements, such as saline or brackish water. Agricultural water withdrawal was the main competing water user with over 90% of total water withdrawal in countries such as Mali, Ethiopia, Senegal, and Tanzania and only less than 10% for municipal water supply. Therefore, action to enhance water-use efficiency in competing sectors can help to preserve freshwater sources for municipal water and avoid the need to adopt more energy-intensive technologies for water extraction, treatment, and conveyance. Furthermore, the water abstracted for productive use sectors (e.g., manufacturing, agriculture, power generation, mining, etc.) may weigh strongly on water quality by discharging excessive nutrient loads, pesticides, metals, and other organic and inorganic substances into freshwater reservoirs. This creates the need for more energy-intensive treatment processes such as aeration, ozonation, and membrane treatment [53]. As heavy-polluting industries are transferred from high-income to low-income countries with lenient effluent treatment frameworks, the latter countries face a double burden with limited economic capacity and equipment to treat industrial waste. According to [67], national thermal electricity production was identified as the main driver of industrial water use. They set water consumption intensity by the energy sector as an indicator for the overall improvement of industrial water-use efficiency. Water-intensive industrial processes, such as mining or fuel production, textiles, metallurgy, and paper industries, contribute to structural water intensity of economies [66].
Finally, it was not possible to quantify all the indicators for the drivers due to data constraints. Although it was possible to include all countries in Africa for the k-means cluster analysis, it was not possible to do the same for the multivariate analysis of key indicators. Instead, data on several key indicators are presented and analyzed for twenty (20) countries in sub-Saharan Africa. The number of countries included was constrained by data availability for the parameterized indicators, given that complete data for the indicators listed were not available for some countries. In addition, there were some inconsistencies and uncertainties for some of the data used. For example, Madagascar had the highest daily per capita water production. However, these data were interpreted with caution given that the data presented were for 2005 and not suitable for comparison with more recent data presented for other countries. It was not possible to obtained more recent data for Madagascar from the same data portal where more recent data were obtained for the other countries. Similarly, the data presented for average water loss in the water distribution system per km per day for Senegal, Zimbabwe, Niger, and Benin are the 2013 data. Regular update of established data portals will address data inconsistencies and strengthen analytical work to improve understanding of the relative impact of drivers on energy input for municipal water supply.
5. Conclusions
This study shows how several supply-side and demand-side drivers interact to impact energy input for municipal water supply. A conceptual flow model illustrates how competing drivers interact and affect municipal water supply for several African countries with varying degrees of water security challenges. Key compound indicators generated impact scores that were used to delineate countries into cluster centers. Multivariate analysis of key indicators for demand-side and supply-side drivers showed that agricultural water use is a major competing user, especially in water-stressed countries. Within the operational boundaries of municipal water utilities, the volume of water loss in the distribution system was a key indicator that strongly impacted energy input for municipal water supply. The analytical framework provides an approach to assess the relative impact of drivers on energy input for municipal water supply in developing countries. Additional research could explore the use of predictive models to elucidate future systemic impacts of changing drivers on energy requirements for municipal water supply.
Supplementary Materials
The following are available online at https://www.mdpi.com/article/10.3390/su13158480/s1. S1: Paper summary. Table S2: Portals for accessing data on quantified indicators for water supply and demand drivers in Africa. Table S3: Cluster Membership of countries in Africa.
Author Contributions
Conceptualization, M.W., P.M., P.Y. and N.K.; methodology, P.M., M.W., P.Y. and N.K.; drafting, review, and editing, P.M., M.W., P.Y. and N.K.; supervision, P.Y. and N.K. All authors have read and agreed to the published version of the manuscript.
Funding
This research was funded by the Austrian Partnership Program in Higher Education and Research for Development (APPEAR), a program of the Austrian Development Cooperation (ADC) implemented by the Austrian Agency for International Cooperation in Education and Research (OeAD). The grant specification number is OEZA Project number: 0894-00/2014. The authors acknowledge TU Wien Bibliothek for financial support through its Open Access Funding Programme for the publication of this work.
Institutional Review Board Statement
Not applicable.
Informed Consent Statement
Not applicable.
Data Availability Statement
Not applicable.
Conflicts of Interest
The authors declare that the research was conducted in the absence of any commercial or financial relationships that could be construed as a potential conflict of interest. The funders had no role in the design of the study; in the collection, analyses, or interpretation of data; in the writing of the manuscript; or in the decision to publish the results.
Abbreviations
| ACCSAN | Access to improved sanitation facilities |
| AQUASTAT | The Food and Agriculture Organization global information system on water resources and agricultural water management. |
| AGRV | Annual growth rate of agricultural value-added |
| AfDB | African Development Bank |
| CWD | Per capita water demand |
| CWR | Municipal water losses |
| IBNET | International benchmarking Network for Water and Sanitation Utilities |
| IND | Net annual industrial production growth |
| GWD | Groundwater dependency |
| PDEN | Population density |
| STAN | subSTance flow Analysis |
| SWGWDEP | Relative dependency on surface and groundwater |
| UPG | Urban population growth |
| WEF | World Economic Forum |
| WQ | Water quality |
| WQA | Impact of agricultural production on freshwater quality |
| WQI | Impact of industrial production on freshwater quality |
| WWM | Wastewater management |
| WWTRT | Proportion of wastewater that is treated |
| YCELP | Yale Center for Environmental Law and Policy |
References
- Wakeel, M.; Chen, B.; Hayat, T.; Alsaedi, A.; Ahmad, B. Energy consumption for water use cycles in different countries: A review. Appl. Energy 2016, 178, 868–885. [Google Scholar] [CrossRef]
- Liu, F.; Ouedraogo, A.; Manghee, S.; Danilenko, A. A Primer on Energy Efficiency for Municipal Water and Wastewater Utilities; ESMAP: Washington, DC, USA, 2012. [Google Scholar]
- Venkatesh, G.; Chan, A.; Brattebø, H. Understanding the Water-Energy-Carbon Nexus in Urban Water Utilities: Comparison of Four City Case Studies and the Relevant Influencing Factors. Energy 2014, 75, 153–166. [Google Scholar] [CrossRef]
- McDonald, R.I.; Green, P.; Balk, D.; Fekete, B.M.; Revenga, C.; Todd, M.; Montgomery, M. Urban growth, climate change, and freshwater availability. Proc. Natl. Acad. Sci. USA 2011, 108, 6312–6317. [Google Scholar] [CrossRef] [Green Version]
- Bazilian, M.; Rogner, H.; Howells, M.; Hermann, S.; Arent, D.; Gielen, D.; Steduto, P.; Mueller, A.; Komor, P.; Tol, R.S.J.; et al. Considering the Energy, Water and Food Nexus: Towards an integrated modelling approach. Energy Policy 2011, 39, 7896–7906. [Google Scholar] [CrossRef]
- Yillia, P. Water-Energy-Food Nexus: Framing the Opportunities, Challenges and Synergies for Implementing the SDGs. Osterr. Wasser Abfallwirtsch. 2016, 68, 86–98. [Google Scholar] [CrossRef]
- IEA. Electricity Information 2020. International Energy Agency (IEA). 2020. Available online: https://www.iea.org/data-and-statistics/data-browser/?country=BOTSWANA&fuel=Energy%20supply&indicator=ElecGenByFuel (accessed on 8 May 2021).
- Richards, B.S.; Shen, J.; Schäfer, A.I. Water–Energy Nexus Perspectives in the Context of Photovoltaic-Powered Decentralized Water Treatment Systems: A Tanzanian Case Study. Energy Technol. 2017, 5, 1112–1123. [Google Scholar] [CrossRef] [Green Version]
- Burek, P.; Satoh, Y.; Fischer, G.; Kahil, M.T.; Scherzer, A.; Tramberend, S.; Nava, L.F.; Wada, Y.; Eisner, S.; Flörke, M.; et al. Water Futures and Solution, Fast Track Initiative—Final Report ADA Project Number 2725-00/2014. In IIASA Working Paper WP-16-006; International Institute for Applied Systems Analysis: Laxenburg, Austria, 2016. [Google Scholar]
- Eberhard, R. Access to Water and Sanitation in Sub-Saharan Africa: Review of Sector Reforms and Investments, Key Findings to Inform Future Support to Sector Development. 2019. Available online: http://www.giz.de (accessed on 5 January 2021).
- WHO/UNICEF. Progress on Household Drinking Water, Sanitation and Hygiene 2000–2020. Five Years into the SDGs; World Health Organization (WHO); United Nations Children’s Fund (UNICEF) Joint Monitoring Program: Geneva, Switzerland, 2021; Available online: https://un-water.org/publications/who-unicef-joint-monitoring-program-for-water-supply-sanitation-and-hygiene-2000-2020 (accessed on 12 July 2021).
- Lubega, W.N.; Farid, A.M. A Reference System Architecture for the Energy-Water Nexus. IEEE Syst. J. 2014, 99, 1–11. [Google Scholar] [CrossRef]
- Santhosh, A.; Farid, A.M.; Youcef-Toumi, K. Real-Time Economic Dispatch for the Supply Side of the Energy-Water Nexus. Appl. Energy 2014, 122, 42–52. [Google Scholar] [CrossRef]
- UN-DESA. World Population Prospects 2019, Volume I: Comprehensive Tables; Department of Economic and Social Affairs (UN-DESA); ECOSOC: New York, NY, USA, 2019; Available online: https://www.un.org/en/development/desa/population/publications/database/index.asp (accessed on 10 March 2021).
- Stoker, P.; Rothfeder, R. Drivers of urban water use. Sustain. Cities Soc. 2014, 12, 1–8. [Google Scholar] [CrossRef]
- Garcia, M.; Islam, S. The role of external and emergent drivers of water use change in Las Vegas. Urban Water J. 2018, 15, 888–898. [Google Scholar] [CrossRef] [Green Version]
- Barker, A.; Pitman, A.; Evans, J.P.; Spaninks, F.; Uthayakumaran, L. Drivers of future water demand in Sydney, Australia: Examining the contribution from population and climate change. J. Water Clim. Chang. 2021, 12, 1168–1183. [Google Scholar] [CrossRef]
- Lee, M.; Keller, A.A.; Chiang, P.C.; Den, W.; Wang, H.; Hou, C.H.; Wu, J.; Wang, X.; Yan, J. Water-energy nexus for urban water systems: A comparative review on energy intensity and environmental impacts in relation to global water risks. Appl. Energy 2017, 205, 589–601. [Google Scholar] [CrossRef] [Green Version]
- Wu, W.; Maier, H.R.; Dandy, G.C.; Arora, M.; Castelletti, A. The changing nature of the water–energy nexus in urban water supply systems: A critical review of changes and responses. J. Water Clim. Chang. 2020, 11, 1095–1122. [Google Scholar] [CrossRef]
- Mamade, A.; Loureiro, D.; Alegre, H.; Covas, D. A comprehensive and well tested energy balance for water supply systems. Urban Water J. 2017, 14, 853–861. [Google Scholar] [CrossRef]
- Loureiro, D.; Alegre, H.; Silva, M.S.; Ribeiro, R.; Mamade, A.; Poças, A. Implementing tactical plans to improve water-energy loss management. Water Sci. Technol. Water Supply 2017, 17, 381–388. [Google Scholar] [CrossRef]
- Elimelech, M.; Phillip, W.A. The Future of Seawater Desalination: Energy, Technology, and the Environment. Science 2011, 333, 712–717. [Google Scholar] [CrossRef]
- Shatat, M.; Worall, M.; Riffat, S. Opportunities for Solar Water Desalination Worldwide: Review. Sustain. Cities Soc. 2013, 9, 67–80. [Google Scholar] [CrossRef]
- FAO-AQUASTAT. FAO’s Global Information System on Water and Agriculture. FAO. 2021. Available online: http://www.fao.org/aquastat/databases (accessed on 2 March 2021).
- World Bank. Getting Electricity: Price of Electricity (US Cents per kWh) (DB16-20 Methodology). Data Catalog. 2021. Available online: http://www.worldbank.org (accessed on 24 April 2021).
- African Development Bank Group (AfDB) Data Portal. 2021. Available online: https://dataportal.opendataforafrica.org/bbkawjf/afdb-socio-economic-database-1960-2019 (accessed on 29 February 2021).
- Malve, O.; Tattar, S.; Riihimäki, J.; Jaakkola, E.; Voβ, A.; Williams, R.; Bärlund, I. Estimation of diffuse pollution loads in Europe for continental scale modelling of loads and in-stream river water quality. Hydrol. Process. 2012, 26, 2385–2394. [Google Scholar] [CrossRef] [Green Version]
- Reder, K.; Bärlund, I.; Voß, A.; Kynast, E.; Williams, R.; Malve, O.; Flörke, M. European scenario studies on future in-stream nutrient concentrations. Trans. ASABE 2013, 56, 1407–1417. [Google Scholar]
- Reder, K.; Malsy, M.; Bärlund, I.; Flörke, M. Modelling Water Pollution Posing a Risk to Human and Ecosystem Health in Africa Using FC and BOD as Indicator Substances. WIT Trans. Ecol. Environ. 2014, 182, 297–308. [Google Scholar]
- Voß, A.; Alcamo, J.; Bärlund, I.; Voß, F.; Kynast, E.; Williams, R.; Malve, O. Continental Scale Modelling of in-Stream River Water Quality: A Report on Methodology, Test Runs, and Scenario Application. Hydrol. Process. 2012, 26, 2370–2384. [Google Scholar] [CrossRef] [Green Version]
- Williams, R.; Keller, V.; Voß, A.; Bärlund, I.; Malve, O.; Riihimäki, J.; Sirkka, T.; Alcamo, J. Assessment of current water pollution loads in Europe: Estimation of gridded loads for use in global water quality models. Hydrol. Process. 2012, 26, 2395–2410. [Google Scholar] [CrossRef] [Green Version]
- YCELP, CIESIN, and WEF. Environmental Performance Index (EPI). NASA Socioeconomic Data and Applications Center (SEDAC). 2014. Available online: http://sedac.ciesin.columbia.edu/ (accessed on 30 April 2021).
- Leclerc, G.; Cros, B.; Rojot, C.; Koskas, J.; Ndombo, J.; Raes, T. Water: Challenges, Drivers and Solutions. Pricewaterhouse Coopers. 2012. Available online: https://www.pwc.com/gx/en/sustainability/publications/assets/pwc-water-challenges-drivers-and-solutions.pdf (accessed on 30 April 2021).
- Sood, A.; Smakhtin, V. Global Hydrological Models: A Review. Hydrol. Sci. J. 2014, 60, 549–565. [Google Scholar] [CrossRef]
- Padowski, J.C.; Gorelick, S.M.; Thompson, B.H.; Rozelle, S.; Fendorf, S. Assessment of Human–natural System Characteristics Influencing Global Freshwater Supply Vulnerability. Environ. Res. Lett. 2015, 10, 104014. [Google Scholar] [CrossRef]
- IBNET. Benchmarking Database, International Benchmarking Network for Water and Sanitation Utilities (IBNET). 2021. Available online: http://www.ib-net.org/) (accessed on 10 March 2021).
- Pavelic, P.; Giordano, M.; Keraita, B.; Ramesh, V.; Rao, T. Groundwater Availability and Use in Sub-Saharan Africa: A Review of 15 Countries; International Water Management Institute (IWMI): Colombo, Sri Lanka, 2012; 274p. [Google Scholar] [CrossRef] [Green Version]
- Serele, C.; Pérez-Hoyos, A.; Kayitakire, F. Mapping of groundwater potential zones in the drought-prone areas of south Madagascar using geospatial techniques. Geosci. Front. 2020, 11, 1403–1413. [Google Scholar] [CrossRef]
- Cencic, O.; Rechberger, H. Material Flow Analysis with Software STAN. J. Environ. Eng. Manag. 2008, 18, 5. [Google Scholar]
- Murtagh, F.; Legendre, P. Ward’s Hierarchical Clustering Method: Clustering Criterion and Agglomerative Algorithm. J. Classif. 2014, 31, 274–295. [Google Scholar] [CrossRef] [Green Version]
- NERC. Depth to Groundwater Map. British Geological Survey. Natural Environment Research Council (NERC). 2011. Available online: http://www.bgs.ac.uk/research/groundwater/datainfo/levels/levels_data.html (accessed on 15 May 2021).
- Hashemi, S.; Filion, Y.; Speight, V. Identification of factors that influence energy performance in water distribution system mains. Water 2018, 10, 428. [Google Scholar] [CrossRef] [Green Version]
- Zuśka, Z.; Kopcińska, J.; Dacewicz, E.; Skowera, B.; Wojkowski, J.; Ziernicka-Wojtaszek, A. Application of the principal component analysis (PCA) method to assess the impact of meteorological elements on concentrations of particulate matter (PM10): A case study of the mountain valley (the Sacz Basin, Poland). Sustainability 2019, 11, 6740. [Google Scholar] [CrossRef] [Green Version]
- Jemmali, H. Water Poverty in Africa: A Review and Synthesis of Issues, Potentials, and Policy Implications. Soc. Indic. Res. 2018, 136, 335–358. [Google Scholar] [CrossRef]
- OECD. Organization for Economic Co-operation and Development (OECD) Database. 2021. Available online: https://stats.oecd.org/Index.aspx?QueryId=101141 (accessed on 29 April 2021).
- World Bank. Data. World Development Indicators. 2019. Available online: http://data.worldbank.org/datacatalog/world-development-indicators (accessed on 30 April 2021).
- Haddeland, I.; Heinke, J.; Biemans, H.; Eisner, S.; Flörke, M.; Hanasaki, N.; Konzmann, M.; Ludwig, F.; Masaki, Y.; Schewe, J.; et al. Global Water Resources Affected by Human Interventions and Climate Change. Proc. Natl. Acad. Sci. USA 2014, 111, 3251–3256. [Google Scholar] [CrossRef] [PubMed] [Green Version]
- Iofin, Z.K. Variability of Water Resources and Water Balance. Sustain. Water Resour. Manag. 2015, 1, 155–156. [Google Scholar] [CrossRef] [Green Version]
- Döll, P.; Jiménez-Cisneros, B.; Oki, T.; Arnell, N.W.; Benito, G.; Cogley, J.G.; Jiang, T.; Kundzewicz, Z.W.; Mwakalila, S.; Nishijima, A. Integrating Risks of Climate Change into Water Management. Hydrol. Sci. J. 2014, 60, 4–13. [Google Scholar] [CrossRef] [Green Version]
- Jacobsen, M.; Webster, M.; Vairavamoorthy, K. The Future of Water in African Cities: Why Waste Water? In Directions in Development; World Bank: Washington, DC, USA, 2012. [Google Scholar] [CrossRef]
- Plappally, A.K.; Lienhard, J.H. Energy Requirements for Water Production, Treatment, End Use, Reclamation, and Disposal. Renew. Sustain. Energy Rev. 2012, 16, 4818–4848. [Google Scholar] [CrossRef]
- dos Santos, S.; Adams, E.; Neville, G.; Wada, Y.; de Sherbinin, A.; Mullin Bernhardt, E.; Adamo, S. Urban growth and water access in sub-Saharan Africa: Progress, challenges, and emerging research directions. Sci. Total. Environ. 2017, 607, 497–508. [Google Scholar] [CrossRef]
- Cooley, H.; Wilkinson, R. Implications of Future Water Supply Sources for Energy Demands. Water Reuse Research Foundation 2012. Available online: http://pacinst.org/wp-content/uploads/2013/02/report19.pdf (accessed on 30 April 2021).
- Alcamo, J.; Döll, P.; Henrichs, T.; Kaspar, F.; Lehner, B.; Rösch, T.; Siebert, S. Development and Testing of the WaterGAP 2 Global Model of Water Use and Availability. Hydrol. Sci. J. 2003, 48, 317–337. [Google Scholar] [CrossRef]
- Siddiqi, A.; Anadon, L.D. The Water-Energy Nexus in Middle East and North Africa. Energy Policy 2011, 39, 4529–4540. [Google Scholar] [CrossRef]
- Goga, T.; Friedrich, E.; Buckley, C.A. Environmental life cycle assessment for potable water production—A case study of seawater desalination and mine-water reclamation in South Africa. Water SA 2019, 45, 700–709. [Google Scholar] [CrossRef] [Green Version]
- Lam, K.L.; Kenway, S.J.; Lant, P.A. Energy use for water provision in cities. J. Clean. Prod. 2017, 143, 699–709. [Google Scholar] [CrossRef] [Green Version]
- Bartos, M.D.; Chester, M.V. The conservation nexus: Valuing interdependent water and energy savings in Arizona. Environ. Sci. Technol. 2014, 48, 2139–2149. [Google Scholar] [CrossRef] [PubMed]
- Wada, Y.; Wisser, D.; Bierkens, M.F.P. Global Modeling of Withdrawal, Allocation and Consumptive Use of Surface Water and Groundwater Resources. Earth Syst. Dyn. 2014, 5, 15–40. [Google Scholar] [CrossRef] [Green Version]
- van den Berg, C.; Danilenko, A. Performance of Water Utilities in Africa. 2017. Available online: http://www.worldbank.org/water (accessed on 11 January 2021).
- Ernedal, S.; Vauvert, J.; Moore, N.; Pesambili, L. Energy efficiency in action: GIZ tackles the water-energy nexus in Tanzania. ECEE Summer Study Proc. 2015. Available online: http://www.africaneconomicoutlook.org (accessed on 22 February 2021).
- Cloutier, M.; Rowley, P. The feasibility of renewable energy sources for pumping clean water in sub-Saharan Africa: A case study for Central Nigeria. Renew. Energy 2011, 36, 2220–2226. [Google Scholar] [CrossRef] [Green Version]
- Samora, I.; Manso, P.; Franca, M.J.; Schleiss, A.J.; Ramos, H.M. Energy recovery using micro-hydropower technology in water supply systems: The case study of the city of Fribourg. Water 2016, 8, 344. [Google Scholar] [CrossRef] [Green Version]
- Pérez-Sánchez, M.; Sánchez-Romero, F.J.; Ramos, H.M.; López-Jiménez, P.A. Energy recovery in existing water networks: Towards greater sustainability. Water 2017, 9, 97. [Google Scholar] [CrossRef] [Green Version]
- Molinos-Senante, M.; Sala-Garrido, R. Energy intensity of treating drinking water: Understanding the influence of factors. Appl. Energy 2017, 202, 275–281. [Google Scholar] [CrossRef]
- Grady, C.A.; Weng, S.; Blatchley, E.R. Global Potable Water: Current Status, Critical Problems, and Future Perspectives. In Potable Water; The Handbook of Environmental Chemistry 30; Younos, T., Grady, C.A., Eds.; Springer: Cham, Switzerland, 2014; pp. 37–60. [Google Scholar]
- Kiguchi, M.; Shen, Y.; Kanae, S.; Oki, T. Re-evaluation of Future Water Stress due to Socio-Economic and Climate Factors under a Warming Climate. Hydrol. Sci. J. 2015, 60, 14–29. [Google Scholar] [CrossRef] [Green Version]
Figure 1.
An illustration of the operationalization of the water–energy nexus framework with drivers of municipal water supply (authors’ conceptualization).
Figure 1.
An illustration of the operationalization of the water–energy nexus framework with drivers of municipal water supply (authors’ conceptualization).

Figure 2.
Summary of the methodological approach.
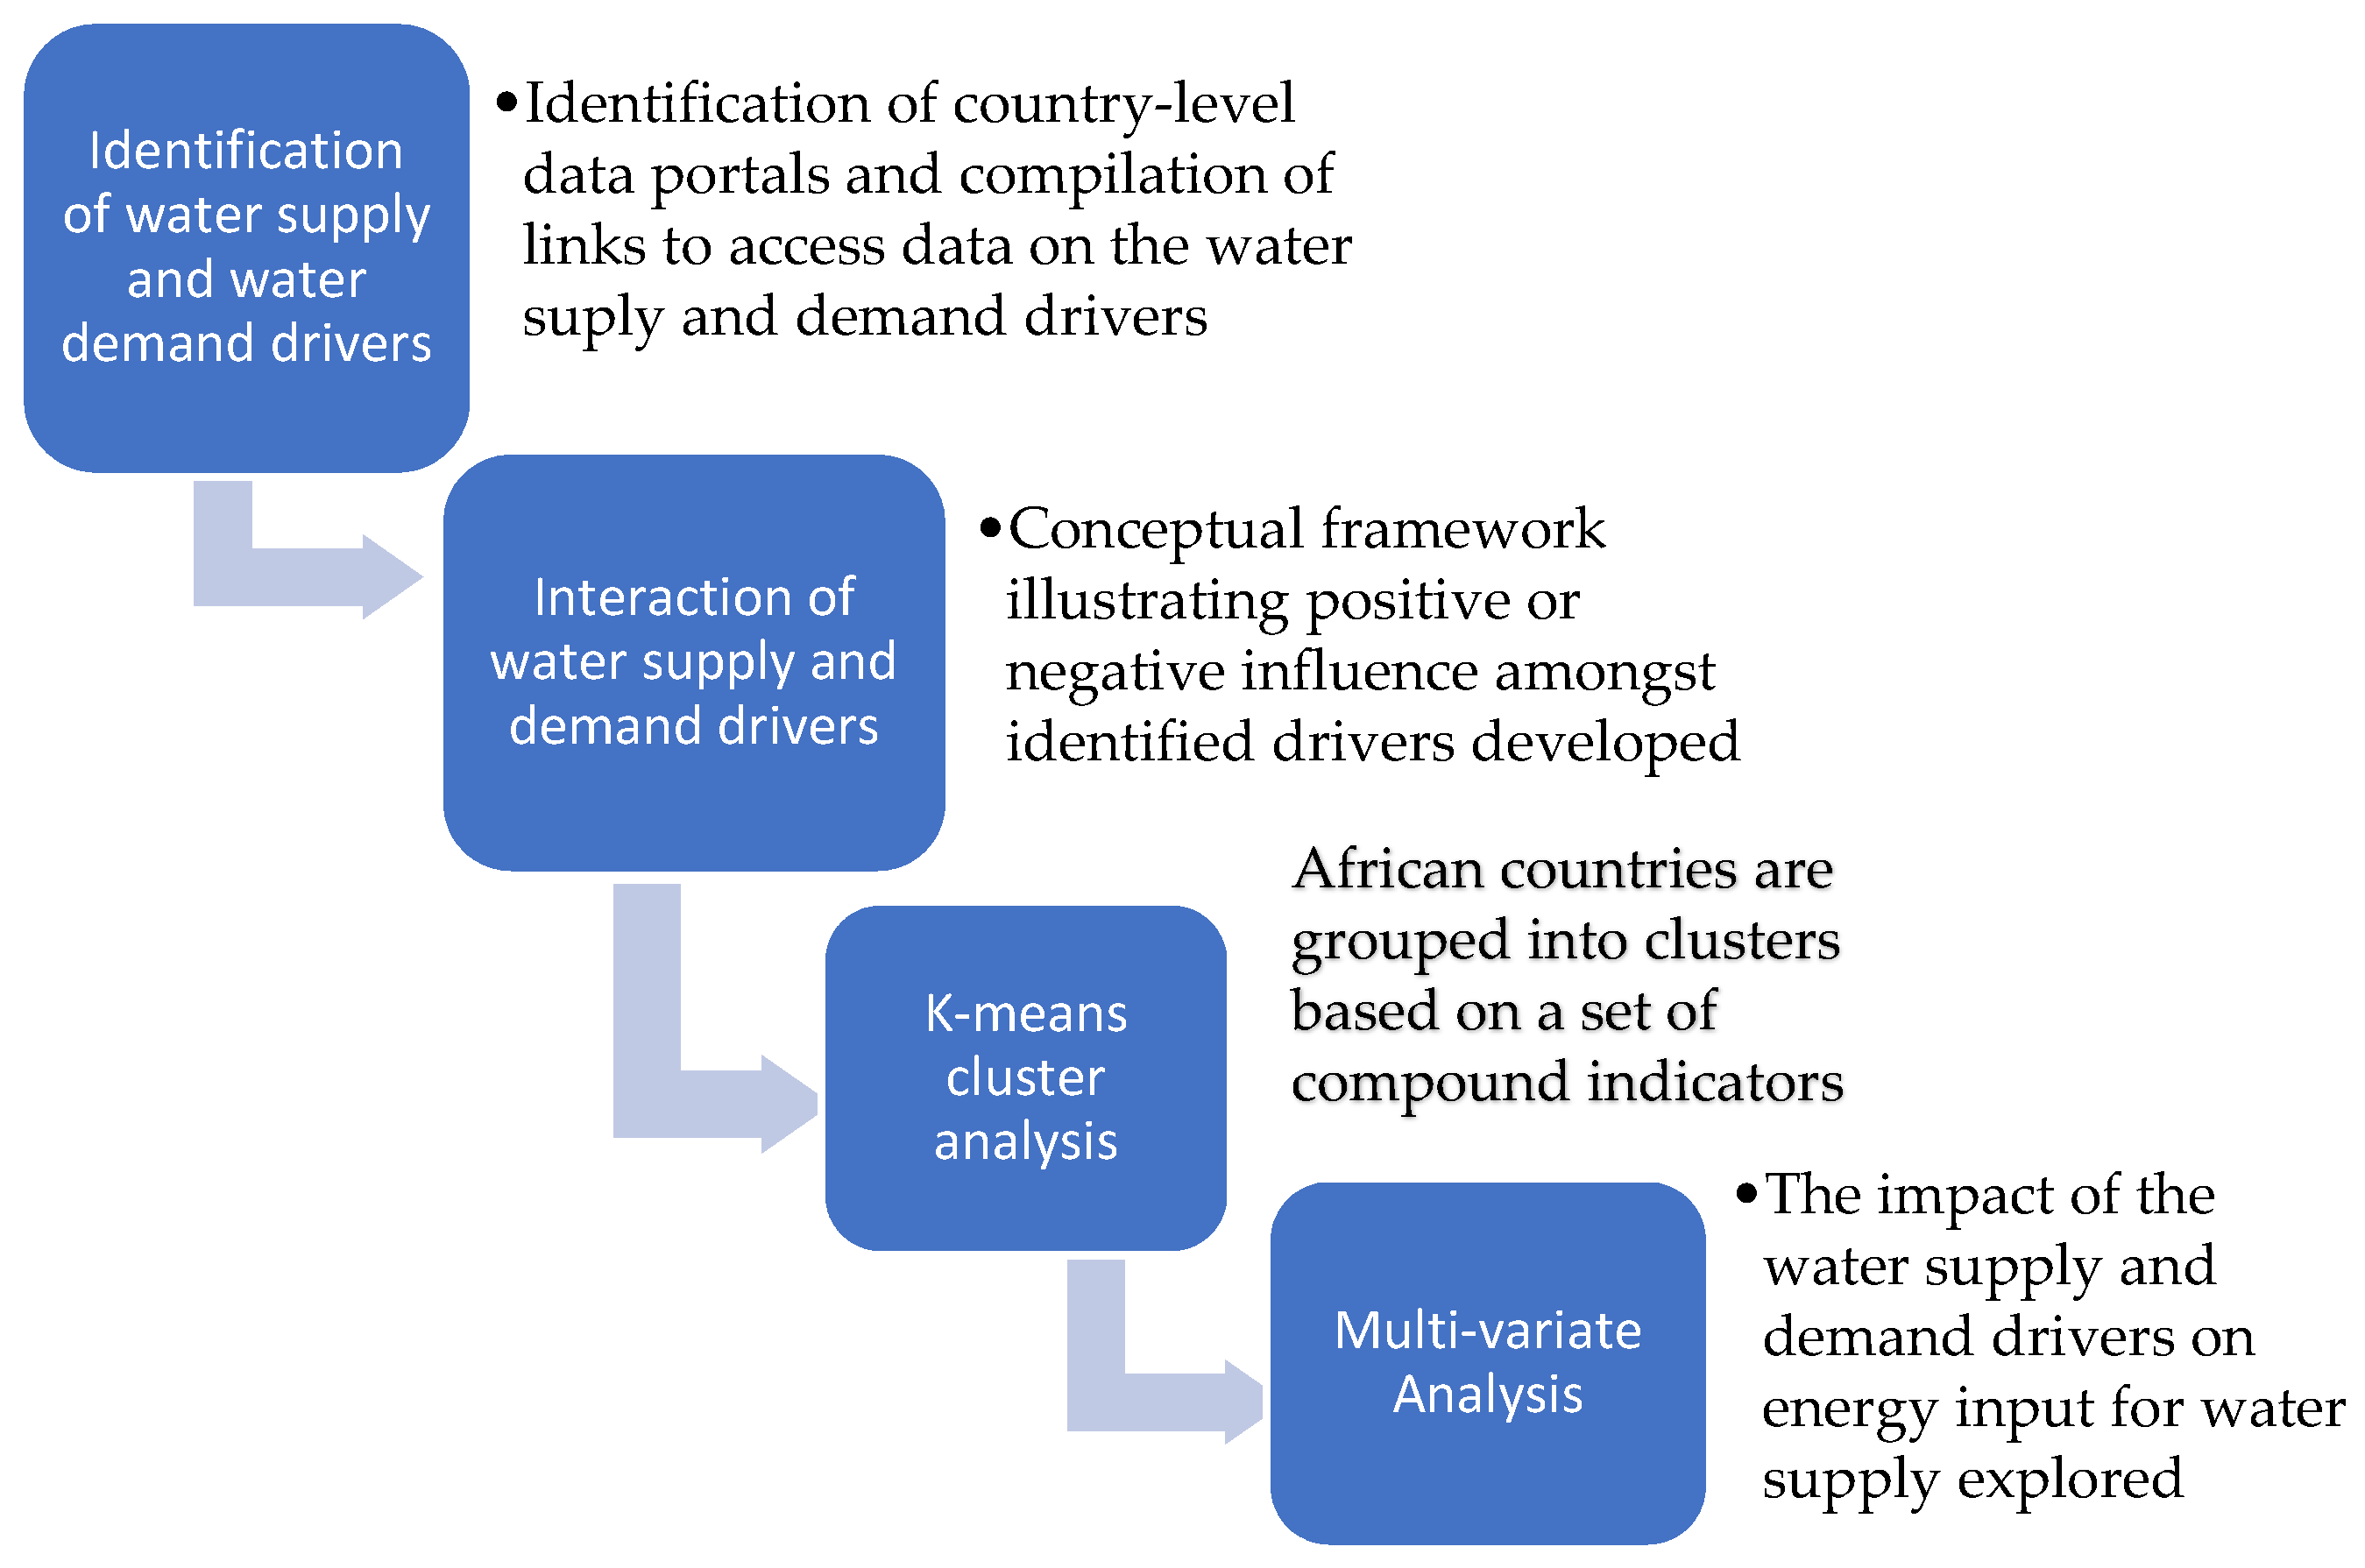
Figure 3.
Interactions between supply- and demand-side drivers of municipal water supply (designed with STAN).
Figure 3.
Interactions between supply- and demand-side drivers of municipal water supply (designed with STAN).

Figure 4.
Mono-plot of the pooled data for the selected indicators for water-secure countries.

Figure 5.
Mono-plot of the pooled data for selected indicators among water-stressed countries.
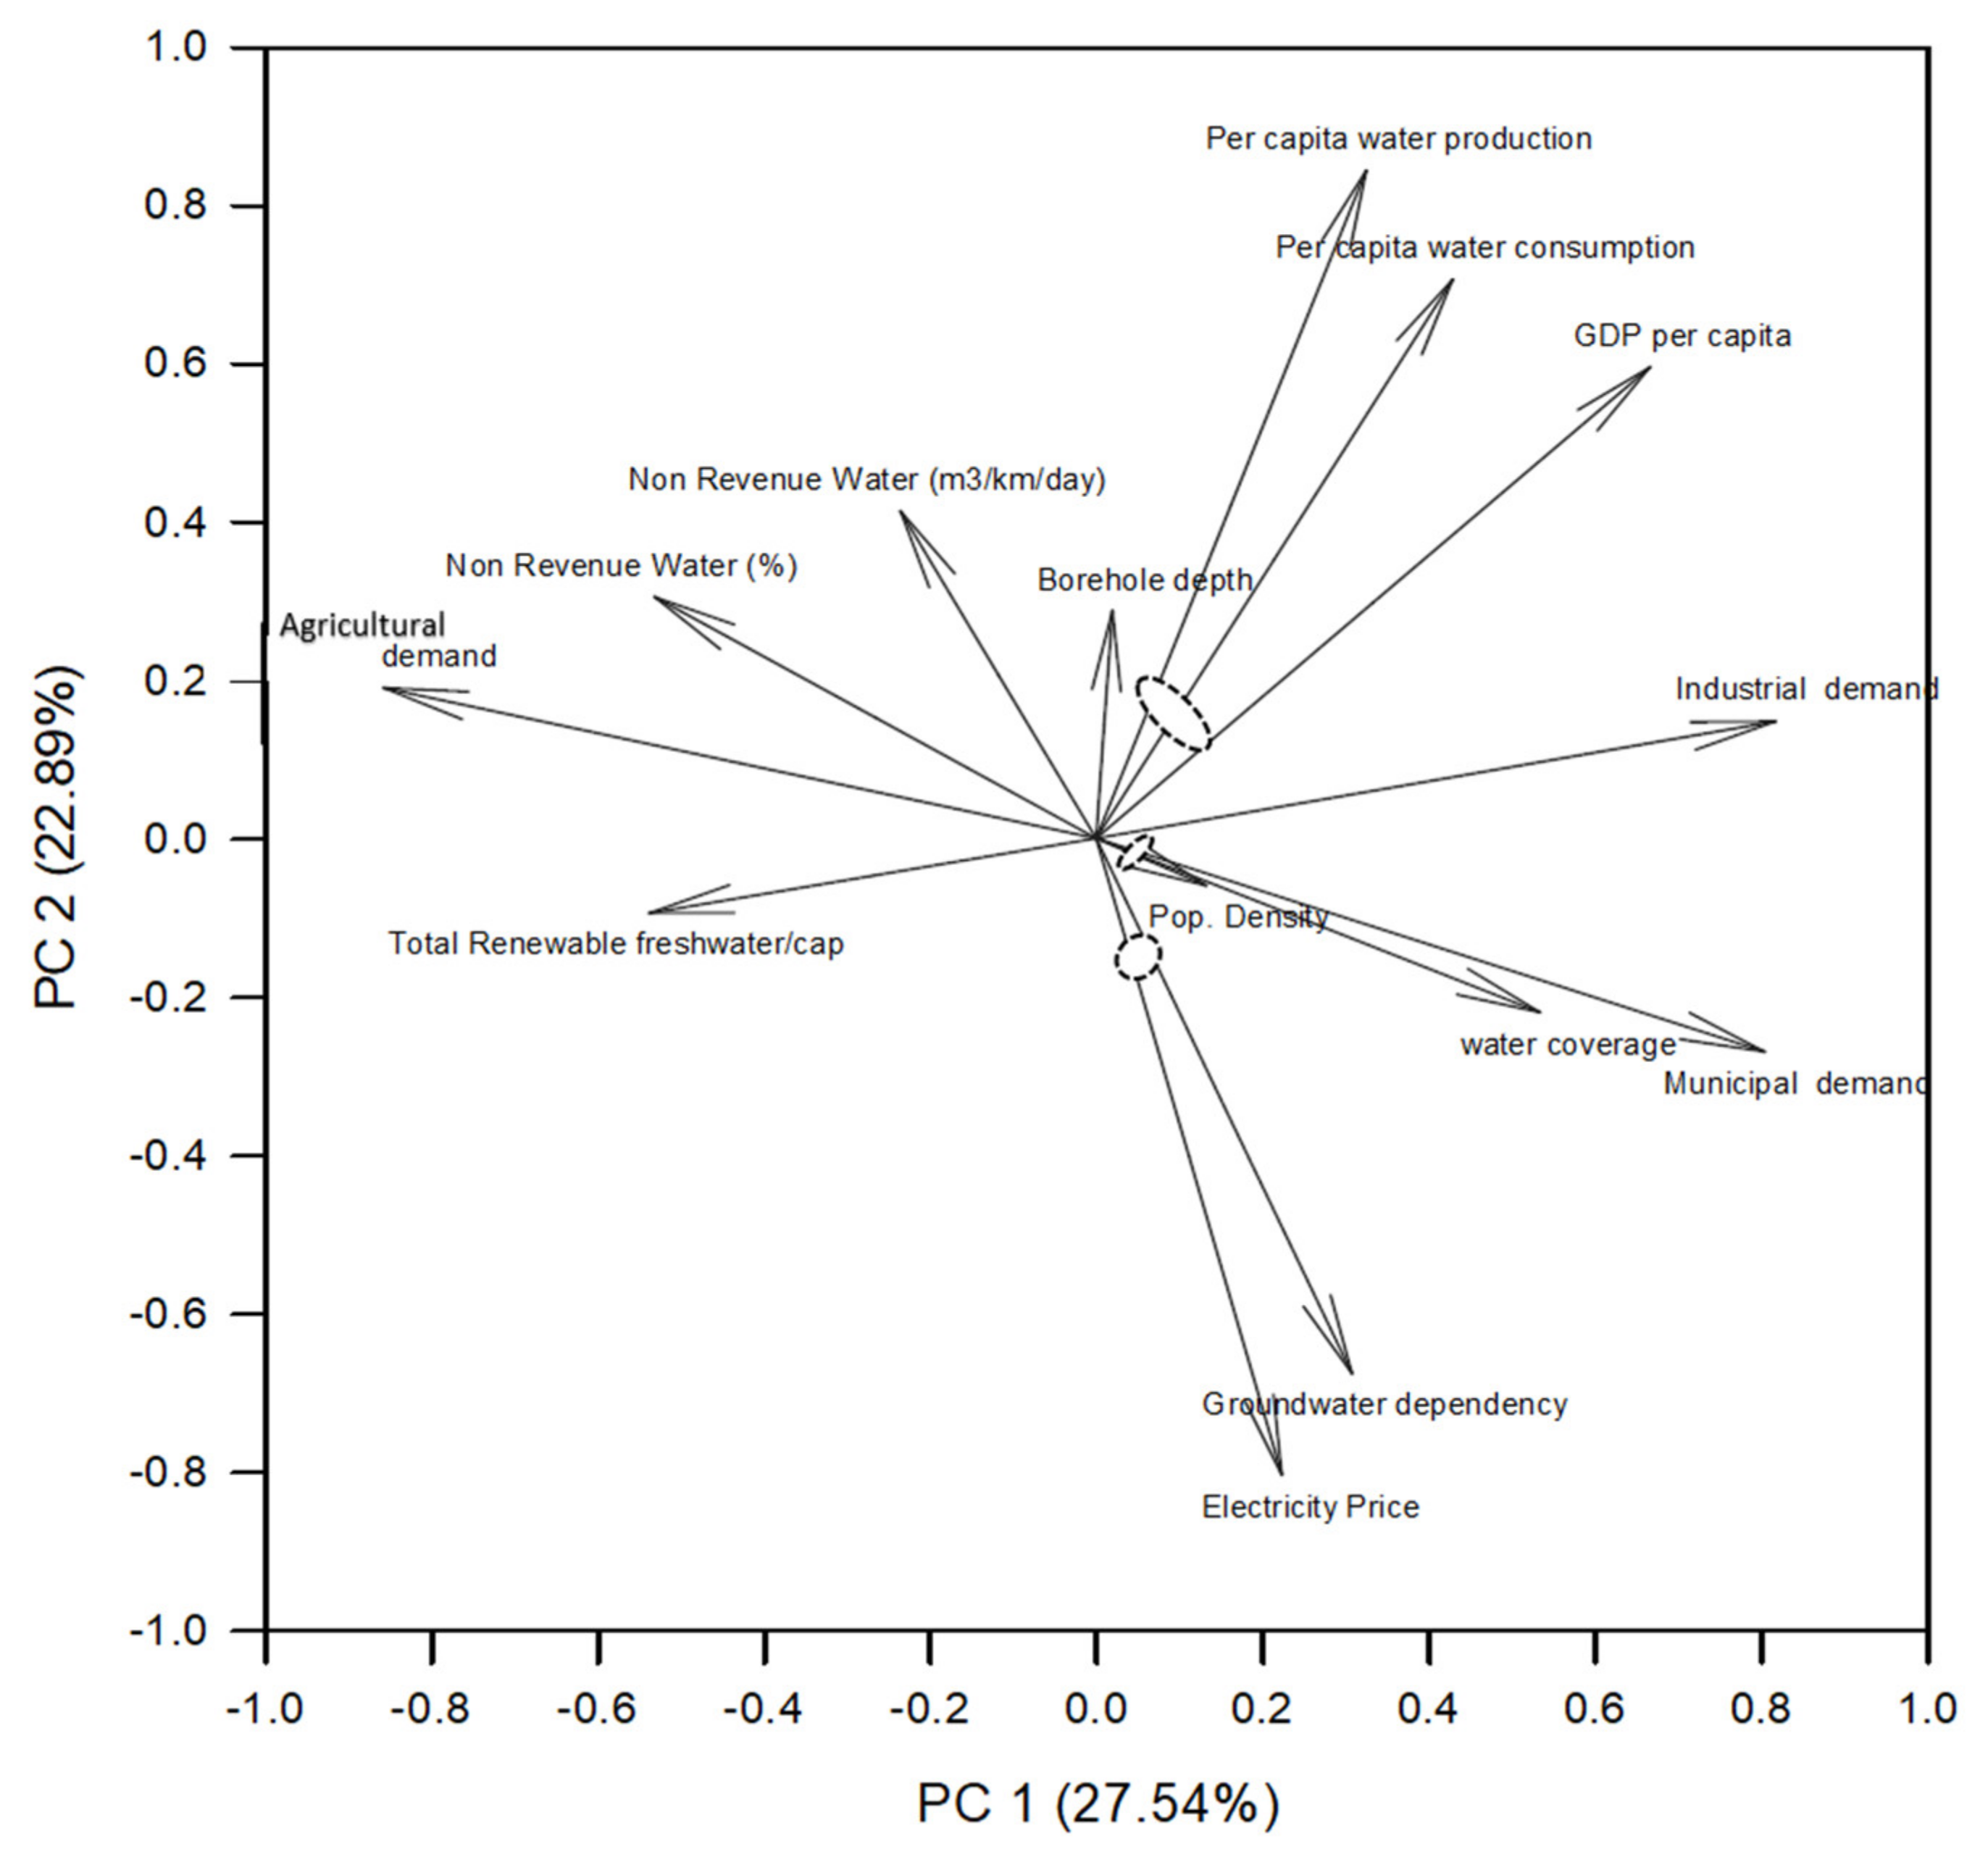
Figure 6.
Dendrogram of key compound indicators showing Squared Euclidian Distance between clusters.
Figure 6.
Dendrogram of key compound indicators showing Squared Euclidian Distance between clusters.
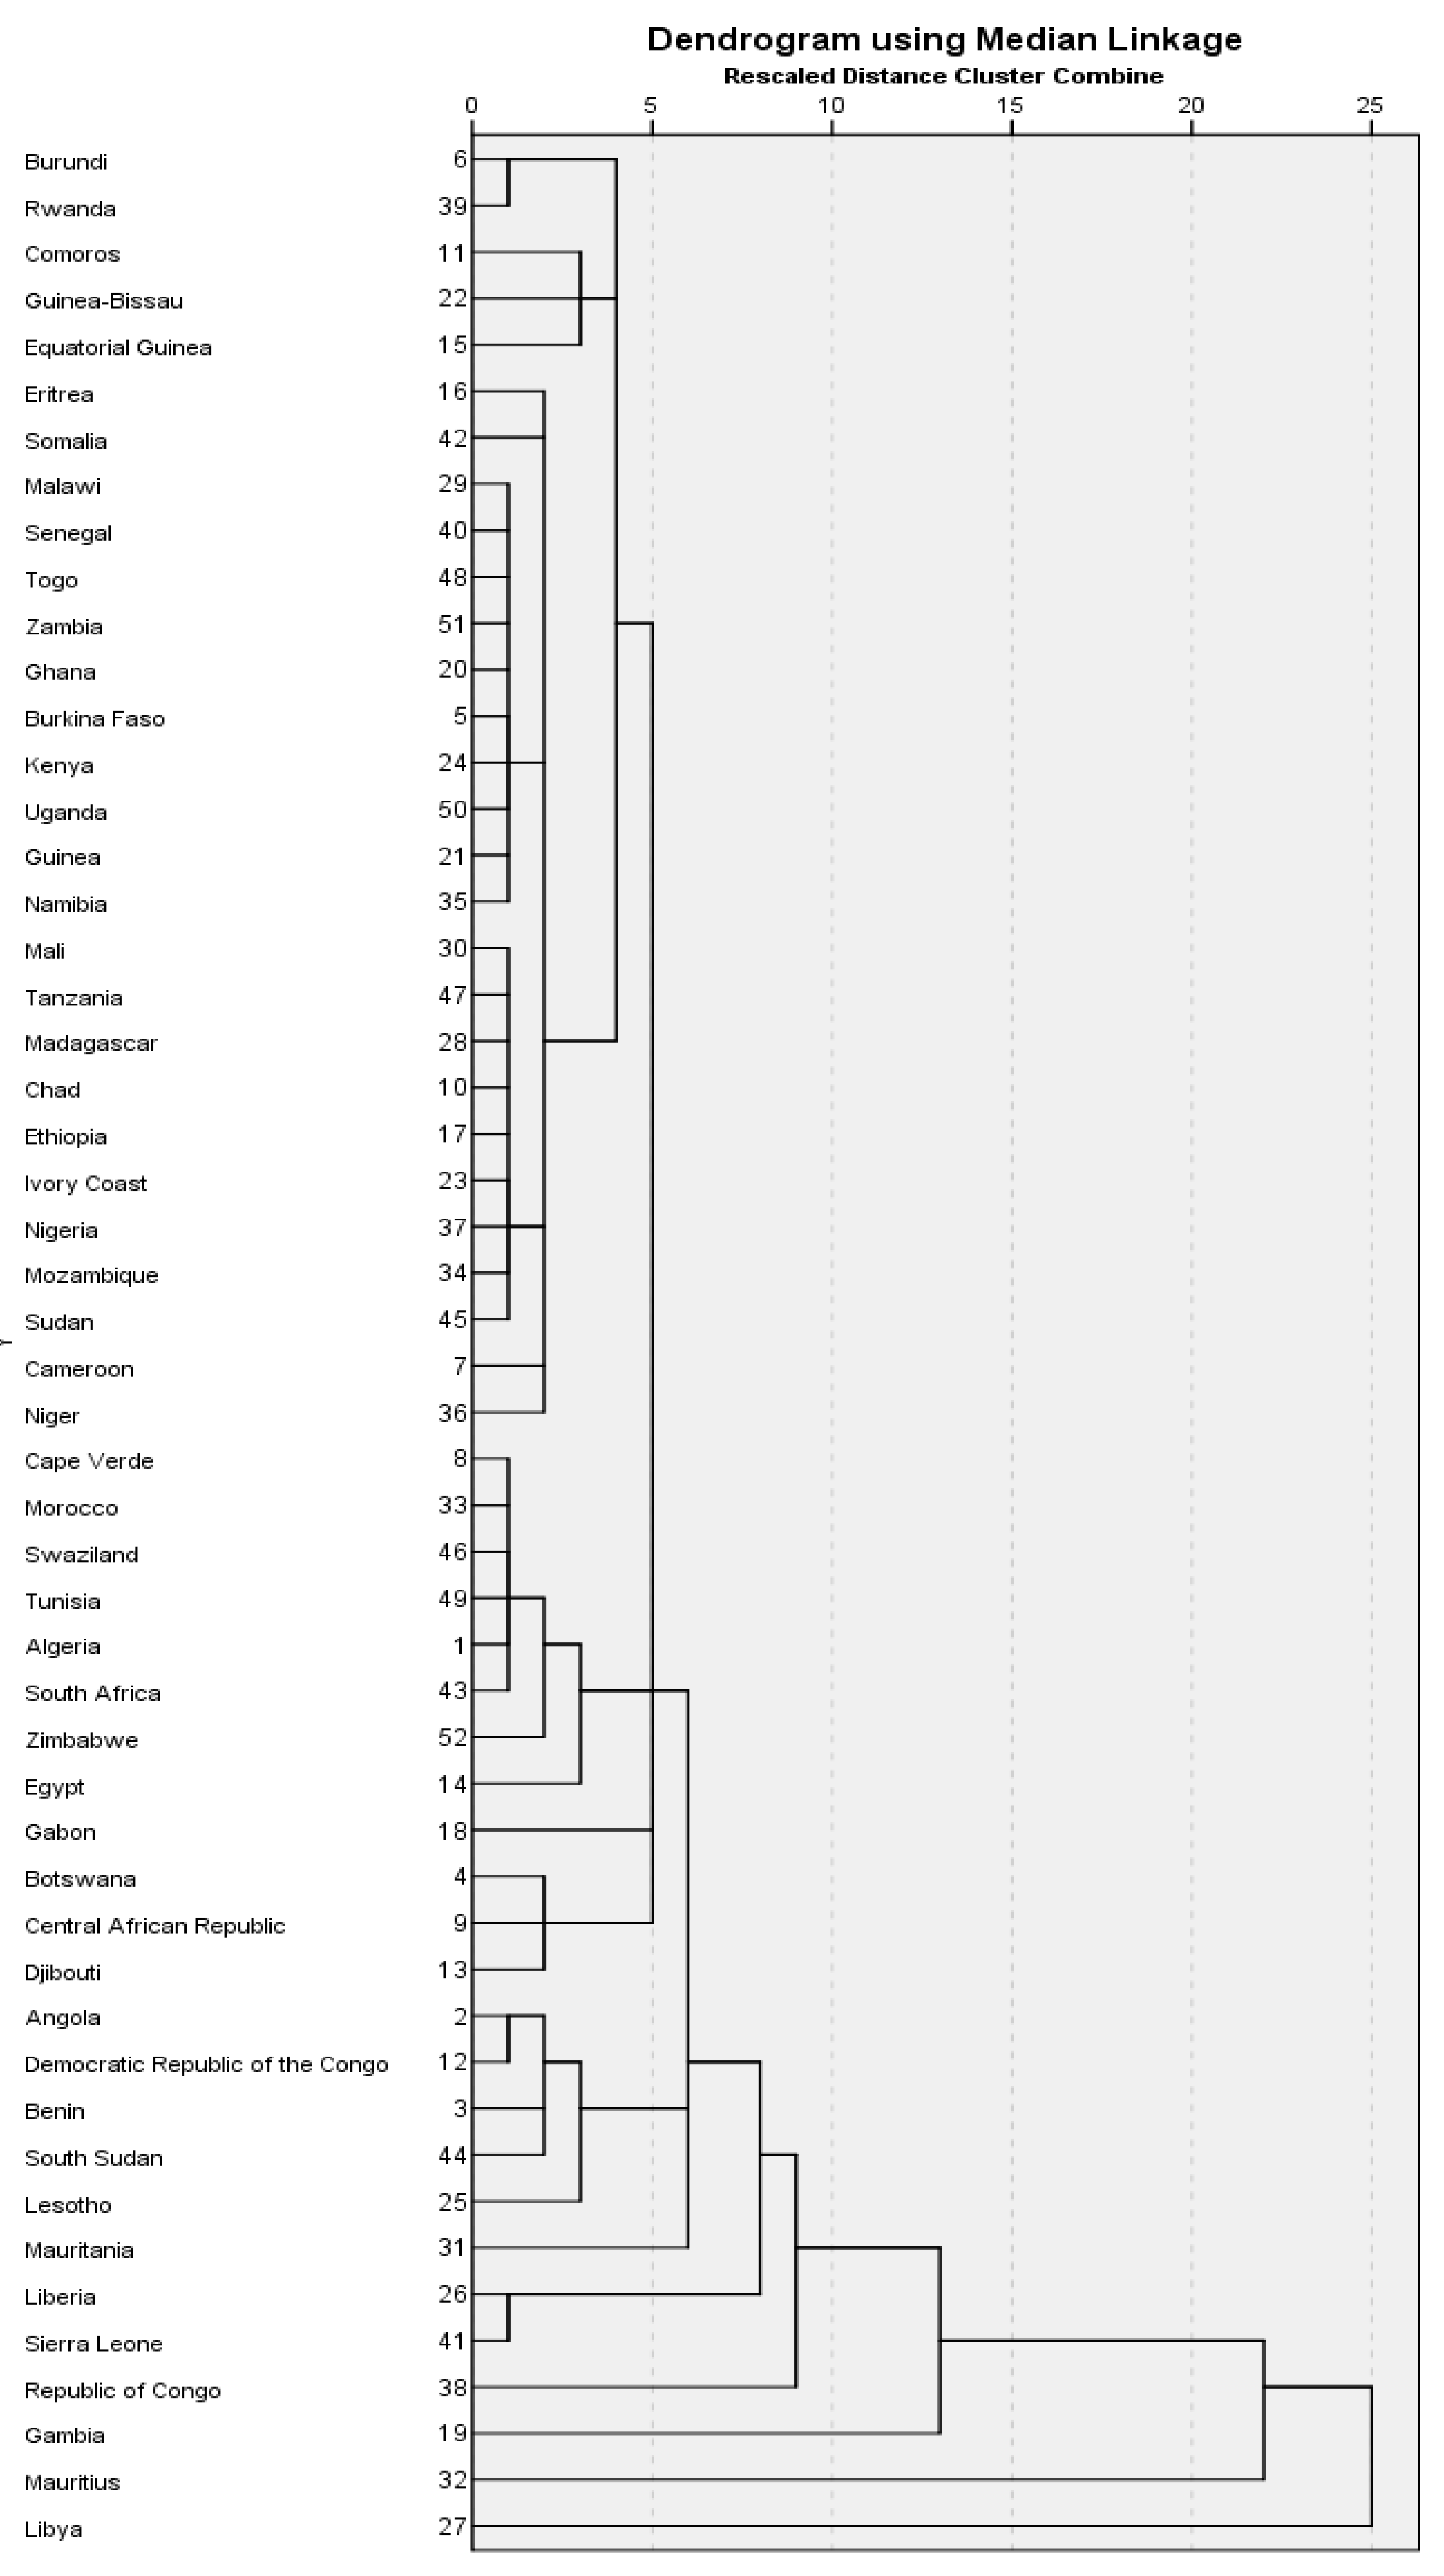
Figure 7.
Map of Africa delineating African countries according to the cluster centers in Figure 6.
Figure 7.
Map of Africa delineating African countries according to the cluster centers in Figure 6.
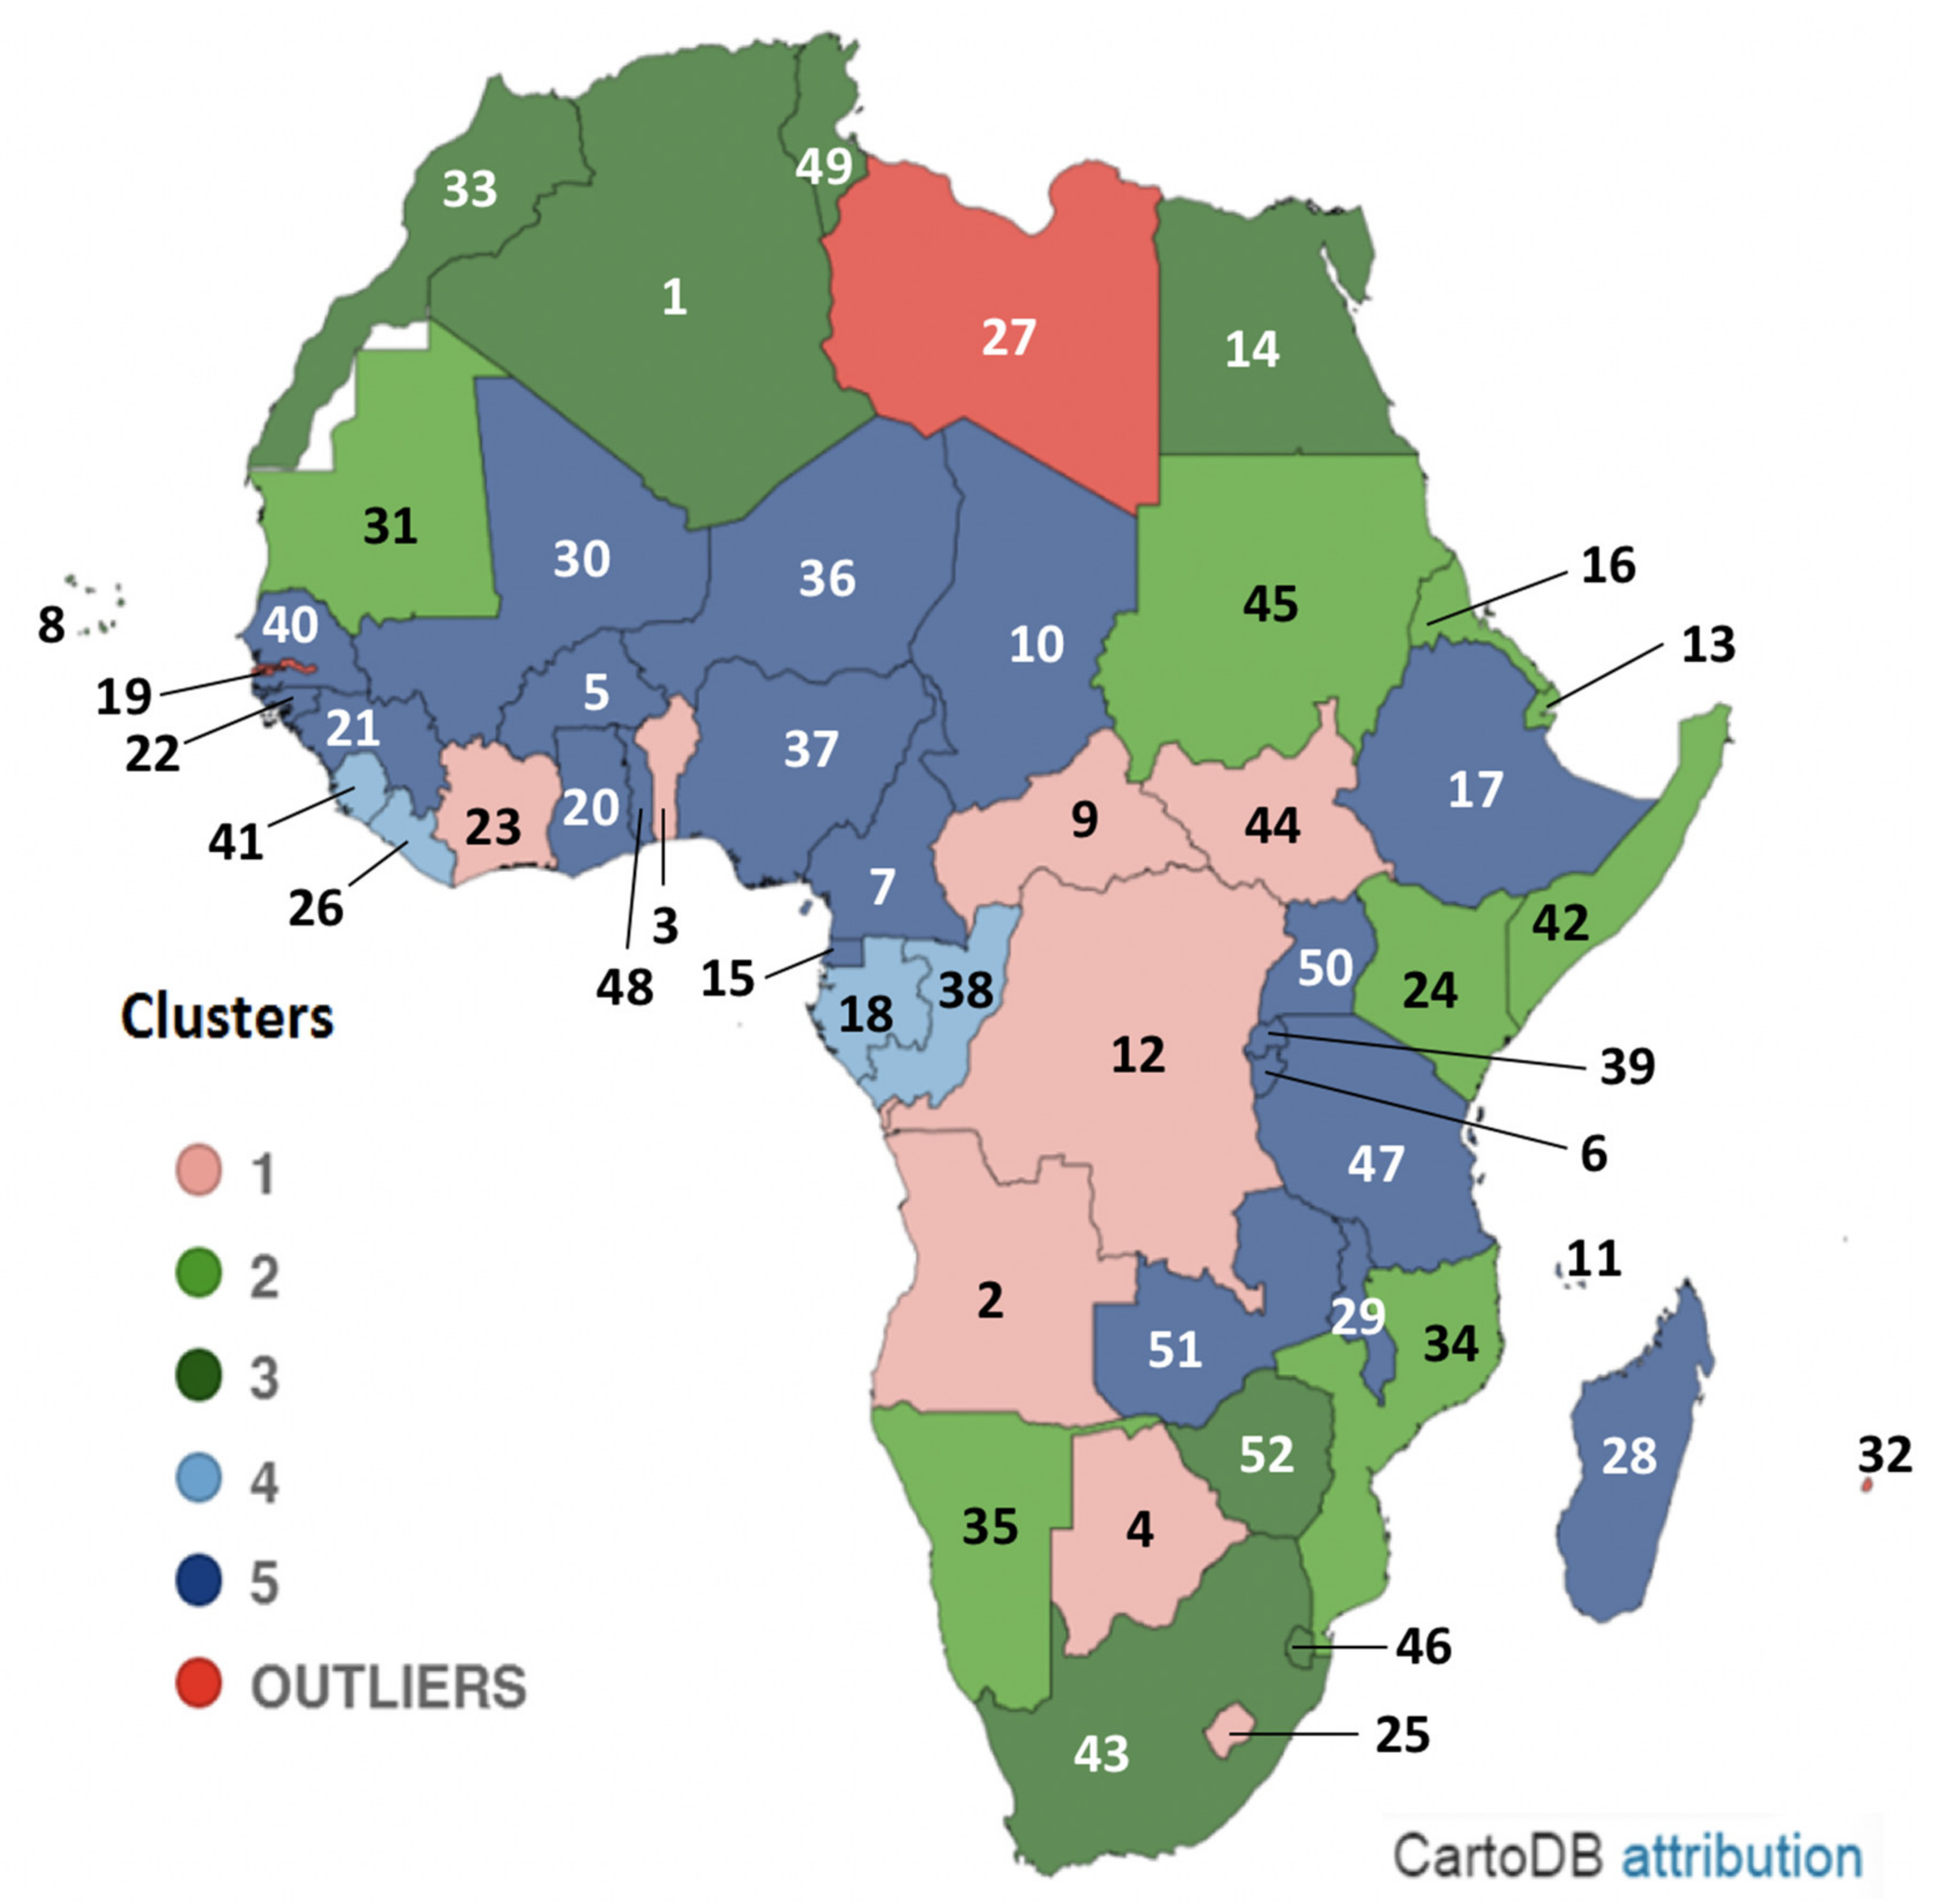

Table 1.
Supply-side and demand-side drivers of municipal water supply with indicators (ticked are those that were quantified in the present study).
Table 1.
Supply-side and demand-side drivers of municipal water supply with indicators (ticked are those that were quantified in the present study).
| Drivers | Indicators Identified | Units | Quantified | Data Sources |
|---|---|---|---|---|
| Drivers affecting freshwater availability (water quantity and quality) | ||||
| Freshwater availability | Total annual renewable freshwater per capita | m3/capita/yr | √ | [24] |
| Climate forces | Precipitation and potential evapotranspiration | mm/yr | [34,35] | |
| Biophysical exchange | Surface runoff and infiltration | mm/Km2 | [25] | |
| Exploitation of available water resources | Fraction of total annual renewable freshwater abstracted | % | [24] | |
| Relative water source dependency | Ratio of total renewable surface water to total renewable groundwater (scalar fraction) | 109 m3/yr | √ | [24] |
| Storage capacity | Capacity of dams/reservoirs | km3 | [24] | |
| Borehole depth | Median depth of boreholes for groundwater abstraction | mbg | √ | [37,38] |
| Urban sprawl | Built-up area expressed as settled area over a given land area | km2 | [45] | |
| Agricultural water demand | Fraction of total annual withdrawal due to withdrawal by agriculture | % | √ | [24] |
| Livestock densities | Number of livestock per unit area | livestock/km2 | ||
| Industry (manufacturing) water demand | Fraction of total annual freshwater withdrawal by industry (manufacturing) | % | √ | [24] |
| Increase in agricultural activity | Annual growth rate of agricultural value-added | % | [26] | |
| Increase in industrial activity | Annual growth rate of industrial (manufacturing) value-added | % | [26] | |
| Water use efficiency of productive sectors | Water use per unit produced; volume of water reuse/recycled | m3 | ||
| Vulnerability to upstream water abstraction | Total surface water and groundwater entering the country | 109 m3/yr | [26] | |
| Institutional factors/water governance | Government effectiveness, control of corruption, political stability | Governance ratings (%), corruption perception index | [10,46] | |
| Environmental drivers of water quality | Natural increase/decrease in temperature, oxygen, salinity, pH, concentrations of heavy metals, arsenic, fluoride, etc. | |||
| Wastewater treatment | Fraction of wastewater safely treated through treatment processes | % | [32] | |
| Pollution by agriculture | Fraction of freshwater abstraction by agriculture and VA growth | % | [25] | |
| Pollution by industry (manufacturing) | Fraction of freshwater abstraction by industry and VA growth | % | [25] | |
| Increased pollutant discharge | Population density, which reflects regional distribution of pollution across Africa (based on [30]) | population/km2 | √ | [25] |
| Cross-border upstream water pollution | Water quality indicators for freshwater sources beyond the jurisdiction especially Phosphorus and Nitrogen | mg/l | [27,28,29,30] | |
| Demographic factors affecting freshwater water availability (water quantity) | ||||
| Municipal water withdrawal | Total annual demand for municipal water | 109 m3/yr | √ | [25] |
| Population growth | Annual population growth rate | % | √ | [25] |
| Per capita municipal water production and per capita water consumption | Municipal water supplied per capita | l/p/d | √ | [36] |
| Lifestyle change | Annual per capita GDP growth rate | % | [25] | |
| Access to improved water sources | Population with access to improved water sources | % | √ | [36] |
| Water demand management | Household demographic and economic variables | Number of persons, age, daily per capita consumption, and income | [3,15,16,17] | |
| Per capita income | GDP per capita | USD per capita | √ | [25] |
| Operational factors directly impacting energy input for municipal water supply | ||||
| Electricity price (tariffs) | Electricity tariffs (price per kWh) levied on municipal water utilities | USD/kWh | √ | [25] |
| Energy intensity for water supply | Energy needed to deliver a unit of groundwater to the surface and to treat and deliver water from source to end user | kWh/m3 | [1] | |
| Layout of the water supply system | Pumping distance | m | [1,3] | |
| State of water infrastructure | Pipe breaks, pump efficiency | breaks/km/yr % | [25,36] | |
| Water loss in the water distribution system | Proportion of water produced that does not reach consumers | m3/km/day and % Non-Revenue Water (NRW) | √ | [36] |
| Water supply technology | Efficiency of devices and processes, especially pumps and motors used for water production, treatment, and distribution | % Efficiency | [2,20,21,36] | |
Table 2.
Cross-section of parameterized indicators for water-secure and water-stressed countries based on the Falkenmark Water Stress Indicator for 20 countries in sub-Saharan Africa.
Table 2.
Cross-section of parameterized indicators for water-secure and water-stressed countries based on the Falkenmark Water Stress Indicator for 20 countries in sub-Saharan Africa.
| Water Security Category | Total Annual Renewable Freshwater (Tarf) Per Capita * | Municipal Withdrawal (Proportion of Tarf) * | Agricultural Withdrawal (Proportion of Tarf) * | Industrial Withdrawal (Proportion of Tarf) * | GDP Per Capita ** | Water Coverage *** | Per Capita Water Production *** | Per Capita Water Consumption *** | Average Water Loss in Distribution Systems *** | Electricity Price (Tariff) ** | Electricty Cost as a Proportion of Total Operating Cost | Median Depth of Boreholes **** |
|---|---|---|---|---|---|---|---|---|---|---|---|---|
| m3/cap/yr | % | % | % | USD/cap | % | l/p/d | l/p/d | m3/km/day | USD/kWh | % | Mbg | |
| Water-secure | ||||||||||||
| CAR | 30,679 | 83 | 17 | 1 | 945 | 46 | 79 | 39 | 44 | 0.108 | 17 | 15 |
| Eq. Guinea | 20,602 | 80 | 15 | 5 | 18,558 | 72 | 42 | 29 | 33 | 0.217 | λ | 120 |
| Ivory Coast | 3144 | 28 | 52 | 21 | 5212 | 69 | 49 | 37 | 12 | 0.124 | 11 | 58 |
| Mali | 3241 | 2 | 98 | 0 | 2321 | 68 | 116 | 75 | 18 | 0.148 | 17 | 85 |
| Mozambique | 3501 | 25 | 73 | 2 | 1218 | 64 | 131 | 82 | 25 | 0.087 | 9 | 100 |
| Madagascar | 13,179 | 3 | 96 | 1 | 1647 | 90 | 282 | 187 | 30 | 0.146 | λ | 27 |
| Zambia | 4759 | 18 | 73 | 8 | 3470 | 85 | 152 | 61 | 35 | 0.047 | 14 | 70 |
| Water-stressed | ||||||||||||
| Benin | 922 | 31 | 45 | 24 | 3287 | 78 | 51 | 39 | 5.3 | 0.150 | 21 | 15 |
| Ethiopia | 1147 | 6 | 93 | 1 | 2221 | 54 | 127 | 65 | 38.6 | 0.020 | 10 | 165 |
| Ghana | 1040 | 20 | 73 | 6 | 5412 | 80 | 95 | 46 | 42.0 | 0.138 | 26 | 35 |
| Kenya | 412 | 35 | 60 | 5 | 4329 | 56 | 70 | 35 | 50.0 | 0.102 | 13 | 276 |
| Malawi | 913 | 11 | 85 | 4 | 1060 | 77 | 90 | 65 | 18.0 | 0.167 | 9 | 53 |
| Niger | 162 | 30 | 67 | 3 | 1225 | 86 | 75 | 63 | 6.6 | 0.120 | α | 100 |
| Nigeria | 1158 | 40 | 44 | 16 | 5135 | 70 | 98 | 46 | 36.0 | 0.105 | 18 | 220 |
| Rwanda | 793 | 22 | 68 | 10 | 2626 | 78 | 53 | 31 | 7.2 | 0.098 | λ | 35 |
| Senegal | 1673 | 6 | 92 | 2 | 3395 | 98 | 73 | 59 | 9.4 | 0.250 | 40 | 353 |
| South Africa | 786 | 27 | 63 | 11 | 12,482 | 99 | 235 | 190 | 30 | 0.072 | α | 130 |
| Tanzania | 1537 | 9 | 90 | 1 | 2660 | 63 | 119 | 71 | 59.0 | 0.102 | 16 | 110 |
| Uganda | 947 | 51 | 41 | 8 | 2187 | 75 | 72 | 48 | 12.0 | 0.157 | 22 | 45 |
| Zimbabwe | 861 | 12 | 82 | 6 | 2836 | 67 | 101 | 62 | 9.0 | 0.155 | 25 | 90 |
Publisher’s Note: MDPI stays neutral with regard to jurisdictional claims in published maps and institutional affiliations. |
© 2021 by the authors. Licensee MDPI, Basel, Switzerland. This article is an open access article distributed under the terms and conditions of the Creative Commons Attribution (CC BY) license (https://creativecommons.org/licenses/by/4.0/).
Share and Cite
MDPI and ACS Style
Macharia, P.; Wirth, M.; Yillia, P.; Kreuzinger, N. Examining the Relative Impact of Drivers on Energy Input for Municipal Water Supply in Africa. Sustainability 2021, 13, 8480. https://doi.org/10.3390/su13158480
AMA Style
Macharia P, Wirth M, Yillia P, Kreuzinger N. Examining the Relative Impact of Drivers on Energy Input for Municipal Water Supply in Africa. Sustainability. 2021; 13(15):8480. https://doi.org/10.3390/su13158480
Chicago/Turabian StyleMacharia, Pauline, Maria Wirth, Paul Yillia, and Norbert Kreuzinger. 2021. "Examining the Relative Impact of Drivers on Energy Input for Municipal Water Supply in Africa" Sustainability 13, no. 15: 8480. https://doi.org/10.3390/su13158480
Note that from the first issue of 2016, this journal uses article numbers instead of page numbers. See further details here.