
The Influence of the Duration of Journey Stages on Transport Mode Choice: A Case Study in the City of Tarnow


1
Department of Transportation Systems, Cracow University of Technology, 31-155 Kraków, Poland
2
Department of Rail Vehicles and Transport, Cracow University of Technology, 31-155 Kraków, Poland
*
Author to whom correspondence should be addressed.
Sustainability 2021, 13(11), 5922; https://doi.org/10.3390/su13115922
Submission received: 31 March 2021
/
Revised: 4 May 2021
/
Accepted: 13 May 2021
/
Published: 24 May 2021
(This article belongs to the Special Issue Innovations towards Greener and Smarter Mobility for Sustainable Development)
Abstract
:In this paper, we present the effect of making too many private car journeys on city transport systems. A sustainable approach for the development of transport infrastructure is needed, which takes into account local conditions and needs, especially for areas with a high density of origins and destinations. The criteria for evaluating public transport and bicycle transport are presented, which, if acceptable to city residents, may lead to changes in transportation behaviors and, thus, a more efficient use of transport in daily travels. Factors affecting the mode of transport choice include the duration of particular stages of a journey, such as reaching the location where the first ride commences/driving from the travel origin, waiting for a vehicle (bus journeys) or ride/drive, and reaching the travel destination of the last ride/drive. Additionally, the possibility of using a car and having a seasonal ticket for public transport were taken into account. In this study, the results of detailed travel research in the Polish city of Tarnow were used. It has been proven that the low share of public transport in daily travels is due, among other things, to excessive time to reach a stop and due to walking to journey destinations, whereas the low share of cycling is mainly due to a lack of comfort and safe cycling infrastructure.
1. Introduction
The basic role of a municipal transport system is to provide travel opportunities, taking into account the constantly growing needs of its inhabitants. However, this does not mean unconditionally striving to expand transport systems but rather development involving the optimal use of various transport subsystems. The essence of this method of operation is to strengthen the advantages of individual transport subsystems while minimizing their disadvantages, taking into account transportation needs and the possibility of meeting them as well as considering current and potential conditions, including limitations, which have been described in [1,2,3]. Until recently, it was relatively common to believe that, in order to reduce the loss of time of road users, one should look for new transportation corridors or expand the existing street cross sections, mainly for the needs of personal car traffic [4]. However, this approach was not effective because uncritical expansion of transport systems does not solve transport problems but only increases them because, even a well-developed transport system is not able to meet the needs of travel on transit routes leading to places with a high concentration of origins and destinations of travel [5,6].
That is, unless a significant share of these journeys is made using public transport, which uses space in the most efficient way, and another significant part of the journey is made on foot or by bicycle [7]. This means that the development of a city must take place in a sustainable manner also in terms of transport. First, it is necessary to maintain a balance between the development of urban structures and the transport network that supports these structures now and in the future [8,9,10]. On the one hand, the transport system cannot dominate urban structures; on the other hand, it must ensure their functioning. In this respect, the needs vary, among others, in terms of the density of origins and destinations, depending on the location and function of a given housing estate or district.
In most cities, downtown areas are the largest travel generators, where especially all-day services are located, as reported in [11,12]. It is in downtown areas that most schools and offices or cultural institutions as well as institutions related to entertainment and leisure are located. In downtown areas, through traffic is often present in relation to the city center, and in the absence of a bypass system, inter-district traffic and through traffic are present throughout the city [13]. The effect is congestion of varying intensity and duration, especially during the morning and afternoon peak traffic [14].
One of the most effective ways to solve this problem is to ensure a public transport system that can be an alternative to individual car transport, at least for a part of daily journeys, especially those of a repetitive nature, and therefore especially related to work and study. Such a system must, however, fulfill social functions (accessibility to users who have no other travel possibilities) and must provide something more, i.e., a real incentive to use it frequently [15,16]. Thus, it should offer high quality in all aspects of its function as follows:
- High accessibility to public transport in terms of space and time (proximity and easy access to stops, and satisfactory frequency of journeys);
- High reliability of public transport (acceptable time of the entire journey (door-to-door), competitive to car journeys, constant duration of the entire journey, and high punctuality);
- High level of personal and transportation safety at every stage of the journey (safe roads and stop infrastructures, and the ability of emergency services to react quickly);
- High comfort at every stage of the journey (convenient access to stops, friendly stop infrastructures, modern rolling stocks, rare cases of vehicle overcrowding, and high levels of passenger information (at a stop, in the vehicle, on the Internet, and on the phone));
- Favorable tariff system, with a preference for regular public transport users (relatively inexpensive periodic tickets for residents, ensuring the profitability of regular use of collective transport), ticket integration with other forms of public transport, and relatively expensive single-journey tickets to provide for people using public transport infrequently; and
- Connection scheme attractive for the passenger (line layout adapted to current needs, and a high level of temporal and spatial synchronization).
Failure to meet any of the conditions reduces the effectiveness of shifting travel from individual car transport, a problem that is described in detail in [17]. The problem is all the more serious as a high quality must be ensured at every stage of the journey and not only during the journey by the selected means of transport.
The same applies to bicycle traffic, which is also a tool for relieving road systems in cities. Its specificity is completely different; it is primarily a form of individual transport. However, even in this case, certain quality conditions must be met if a bicycle is to be a really attractive alternative to car journeys. These conditions are set out in the CROW program, in the form of the following five requirements for an attractive bicycle transport system, defined in [18,19]:
- Network coherence, which means that 100% of city-wide journey origins and destinations are accessible by bicycle;
- Directness of connections, i.e., the fact that the extension of the travel route in relation to the shortest possible travel path may not exceed 1.3 (130%);
- Ease of travel, i.e., no more than 15 s of stopping per 1 km of the route, and no elevations and rolling resistance;
- Road safety, i.e., minimizing the number of collisions and accidents thanks to the use of safe infrastructure solutions; and
- Attractiveness, for example, aesthetics, service functions, social security, etc.
This mainly translates into the necessity to take measures to increase the directness and safety of bicycle journeys in a city [20]. Additionally, it remains highly significant in this case that all of the specified conditions are met. It is important for the improvement of bicycle traffic not to be pursued at the cost of public transport and vice versa.
This paper uses the Polish city of Tarnow as an example to address the issue of a modal split, with a view to potentially increase the share of journeys made by public transport and bicycle at the expense of private cars. The classic approach based on trip motivation and comparison of total trip duration was abandoned. Instead, we focused on determining the impact of the duration of individual journey elements on the mode choice in city residents ‘everyday trips, taking into account access to a private car and possession of a season ticket for public transport. It is often the duration and conditions of making the first (walking) stage of a journey or the possibility of reaching a particular mode of transport that determines the choice of that particular mode. This approach relates to the concept of a 15-min city, where the majority of trips should be made in 15 min or less.
2. Materials and Methods
One of the possibilities for examining the influence of the duration of journey stages on transport mode choice is to use the results of travel research conducted among users of a city’s transport system, concerning already completed journeys by various means of transport [21].
The concept of journey was defined first, as there are fundamental differences in accounting for and classifying people movement, not only between countries but also between cities. This is a serious problem because it is difficult to compare test results at different times and places if they are performed at different standards. Handbook [22] attempted to standardize a method of transport behavior study. A journey is defined as the movement of a person on foot or by using one or more means of transport between a specific origin and destination, with an attribution of the motivation to travel. The definition also specifies the minimum length of a pedestrian movement, above which a movement is classified as a journey—the value of 100 m was adopted.
Handbook [22] also provided a list of activities that are not treated as a journey, even though they involve movement. These are recreational walks, jogging, or recreational bicycle rides. Journeys do not include business trips of persons professionally engaged in the transport of people or goods (for example, drivers of public transport vehicles, truck drivers, taxis, couriers, postmen, or ticket inspectors).
Each journey may comprise of numerous stages, which vary depending on the means of transport used [23,24]. In the considerable majority of cases, the initial and final journey stages are made on foot. They always take place when the origin and/or destination are remote from the place where a vehicle is parked (car or bicycle for example) or where a vehicle stops (e.g., public transport stops and taxis). Reaching a vehicle on foot is then a prerequisite for a journey, similar to the final stage entailing reaching the travel destination. If a journey is made by means of individual transport vehicles, the times performing operational activities at the beginning and end of a journey should be added to the journey time. These activities include all activities related to starting a vehicle and may include opening and closing a garage, preparing a vehicle (e.g., clearing snow and detaching a bike), or paying a parking fee. When terminating a journey, the list of activities may be extended to include the parking process itself (car or bike) and additional parking-related activities (e.g., downloading a parking ticket and logging into the city bike network). When a trip by a given means of transport (car and bicycle) takes place directly from the place where the journey begins (e.g., a home garage) or the place where it ends (e.g., an underground garage under an office building), the trip time is practically non-existent, but other operational activities take place related to the start or end of the trip because no trip begins when the car’s engine is turned on or when the bicycle pedal is pressed. Interestingly, these activities are often overlooked by traffic participants themselves, often not recognizing how much time these seemingly trivial but still necessary activities take up. It is also a problem that appears in the process of travel modeling; access time to means of transport is usually included only in public transport journeys, whereas it is often either overlooked or underestimated when it comes to car journeys.
For public transport journeys, transfers between vehicles operating on particular lines are of significant importance, as was described in [25]. They constitute unwanted elements of a journey, as they are characterized by high nuisance, which translates into high equivalent travel times. However, they are accepted by users in the case of high frequencies on individual lines and a high level of integration of transfer points in terms of time and length of access between platforms—transfers within the same platform are preferred. A transfer includes the transition between leaving one vehicle and entering the next vehicle, taking into account waiting for a public transport vehicle. It may also include additional activities associated with the use of services within the transfer point for example. The number of changes may vary, but it is preferable to plan a public transport system in such a way that the majority of journeys can be made either without a transfer or with only one transfer. A greater number of transfers (two and three) usually occurs in large cities only [26]. It is also worth adding that journeys with a greater number of transfers result not from the necessity to perform a transfer but from a travel strategy based on the principle of passing consecutive sections as quickly as possible with transfers to subsequent vehicles (the so-called “driving forward”), and therefore, these are largely voluntary transfers. In smaller cities, the contribution of journeys with more than one transfer is low.
There are also transfers for mixed journeys, where different means of transport are used (e.g., car—public transport in the P&R system; bicycle—public transport in the B&R system [27]). In this case, they include pedestrian travel between means of transport and possibly operational activities related to ending a journey stage using one mode of transport and commencing another stage using a different mode of transport. If such a journey requires a transfer to a public transport vehicle, the transfer usually also includes waiting at a stop because it is often difficult to separate pedestrian movement and waiting, and in principle, it is unnecessary.
In the descriptive sense, traveling by a vehicle is the simplest component of a journey, although at the same time, the ride time is often characterized by the greatest randomness of all journey stages and is affected by many disruptive factors. For travel by public transport, a journey includes rides between individual stops and stoppage at the stops. For a car or bicycle, the search for a parking spot should be added to the drive/ride time. Table 1 lists possible individual journey stages assigned to types of vehicles. This list omits pedestrian movement completely.
Travel duration is typically used in the process of travel modeling [28,29,30,31]. It is either the real time or the time taking into account the nuisance associated with the performance of individual journey stages, i.e., equivalent travel time. The latter is much more difficult to determine as it requires detailed research into the valuation of the individual components of a journey. Such studies are conducted only rarely, typically separately from standard travel studies. However, the sole division of journeys into individual stages opens up an opportunity to better understand the mechanisms of choosing a mode of transport by transport system users.
The time of a single journey can be defined as the sum of the times required for individual stages of a journey and expressed by the following Formula (1):
where
tac1 (min)—time to reach a place of commencing the first ride/drive from the travel origin;
top1,i (min)—duration of operational activities associated with commencing a ride/drive i;
tw,i (min)—wait time for a vehicle to take a ride/drive i;
tr,i (min)—ride/drive time i;
ttr,i (min)—transfer time between rides/drives i and i + 1, occurs only where a journey comprises of at least two rides/drives with the same or different means of transport;
top2,i (min)—duration of operational activities associated with completion of a ride/drive i;
tac2 (min)—time to reach a travel destination from the place of completion of the last ride/drive; and
n (–)—number of subsequent rides/drives.
This formula is universal, which makes it applicable for virtually any journey. Travel stages that are not present simply assume a zero duration value.
This paper analyzes in detail the duration of journeys made mainly by public transport, car, and bicycle. For this purpose, data from a travel study conducted in the Polish City of Tarnow were used. This nearly 700-year-old city is currently inhabited by close to 110,000 residents [32], placing Tarnow close to the boundary between a medium and a large city. It is an important economic center in the Lesser Poland Voivodeship, with over 12,000 business entities and 5300 students. Public transport is based on buses with different service standards in terms of the frequency of running [33]. Only one city line (out of a total of 28 city and suburban lines) runs every 10 min during peak periods, and the operation of the remaining lines is reduced to 1–3 runs per hour in the morning or afternoon rush hour. The city has not yet implemented any measures to improve the traffic flow of public transport vehicles, but the city has 70 km of bicycle paths (6.45 km per 10,000 inhabitants [34]).
Tarnow is a typical representative of a group of cities too large to be classified as medium-sized and too small to be large, which raises specific problems, including transport problems. With the mobility of residents usually slightly higher than that recorded in large cities, the global number of journeys is much lower than in large cities, which on one hand means less demand for the development of transport infrastructure, but on the other hand, it constitutes a significant barrier in planning public transport and thus it performs a social function rather than a city-forming one. The process of obtaining new passengers is therefore impeded. Additionally, the shortfalls in bicycle infrastructure do not favor the growth of bicycle traffic in the city.
This study of transport behavior concerns journeys made by residents of Tarnow on an average working day (Tuesday, Wednesday, or Thursday). A total of 506 interviews were conducted regarding the travel patterns of Tarnow residents during the period from 30 May to 23 June 2018. The research was conducted using a face-to-face interview method (F2F) at the respondents’ place of residence for randomly selected households representing all city districts [35]. The selection of addresses for study purposes was carried out using a fixed path method from a total of 100 start points. Each time, one member of a household participated in the study.
The participants of the survey presented a detailed description of all trips made on the day preceding the survey, specifying the places where the journey commenced and ended (address and characteristic place). Motivations for the beginning and end of each trip were also recorded (home; work; school/university; shopping, services, and entertainment in a large shopping center; shopping, services, and entertainment outside a large shopping center; and other motivations indicated by the respondent). The respondents were also asked to indicate the mode of transport used for each stage of the journey (by passenger car as a driver, by passenger car as a passenger, by bus, by train, by bicycle, by motorcycle (or by scooter or moped), by other vehicle, and on foot). They also provided the duration of each journey stage (in full minutes), and if the journey took place by public transport, also the wait time at a stop and the total transfer time—if applicable for the given journey.
A simplification was made in the study carried out in Tarnow by including operational activities related to the commencement of a journey and the completion of a drive/ride: moving on foot from the origin of the travel to the place where the first drive/ride begins and moving on foot from the place where the last drive/ride ends to the destination. Such a simplification was also possible because no journeys with transfers were registered due to the size of the city. On the other hand, wait times only occurred in the case of journeys made with public transport. In this view, after simplification, formula (1) assumed the following form:
where
tao1 (min)—total time travelled on foot to reach the location where the first ride commences/to drive from the travel origin and operational activities associated with the commencement of the drive/ride,
tao2 (min)—total time taken for operational activities related to the completion of a drive/ride and duration travelled on foot to reach the travel destination from the place of drive/ride completion, and
Other symbols used as in (1).
In addition, the times for commencement and completion of the journey were recorded in order to assign individual trips to periods of the day.
During the study, standard data on the participants of the study were also obtained, such as gender, age, and basic occupation (pupil, student, working outside the home, working at home, pensioner, and unemployed) as well as information important from the point of view of the possibility of using a car (as a driver or a passenger) and information about the respondent’s possession of a season public transport ticket (monthly or quarterly). In order to capture weekly travel habits, questions were also asked about the average number of days per week in which individual means of transport are used (passenger car—as a driver, passenger car—as a passenger, public transport bus, minibus, train, and bicycle).
3. Results
A total of 501 full questionnaire interviews were completed with respondents who declared that they had made at least one trip a day. The respondents made a total of 1363 trips, which translates into an average mobility of a statistical resident at a level of 2.72 journeys per day, which is a value similar to those observed in other Polish cities of a similar size. Out of the 1363 journeys, as many as 836 were made by car, which is 61.3% of all journeys made. Public transport journeys were considerably less numerous at 131 (9.6%), and 77 (5.6%) were travelled by bicycles. The remaining 23.4% of journeys were made on foot (Table 2).
Journeys made by car constitute as much as 80.1% of non-pedestrian journeys declared by the respondents; thus, this mode of transport can be viewed as predominant in daily journeys. At the same time, it is a starting point for actions aiming to make a change if this ratio is unfavorable for the city.
Total journey times (door-to-door) differ depending on the mode of transport used. The shortest recorded journey lasted only 1.0 min, and it was a journey made on foot; the longest was made by bus, and it took a total of 62 min. Pedestrian only journeys are the shortest—the mean time of such a journey is 13.4 min (Table 3). However, the average travel times by bicycle and passenger car are only slightly longer—respectively, 14.3 and 15.6 min—while the average travel times by car differ depending on whether they were performed as a driver or a passenger.
The longest average journey time is for public transport by bus: 21.2 min. In all cases, a significant travel time variation was observed—standard deviation values range from 6.82 to 9.73 min, which is surprising—and the highest variability coefficient (47%) was obtained for a bicycle journey. Table 3 presents confidence intervals for mean travel times, calculated at a 95% confidence level: the broadest was obtained for travel by bus (the error of mean estimation is 1.7 min).
A better look at the manner in which Tarnow residents travel is offered by dividing journeys into individual stages. Below is a detailed comparison of durations of individual bus (Table 4), bicycle (Table 5), and car (Table 6) journey stages.
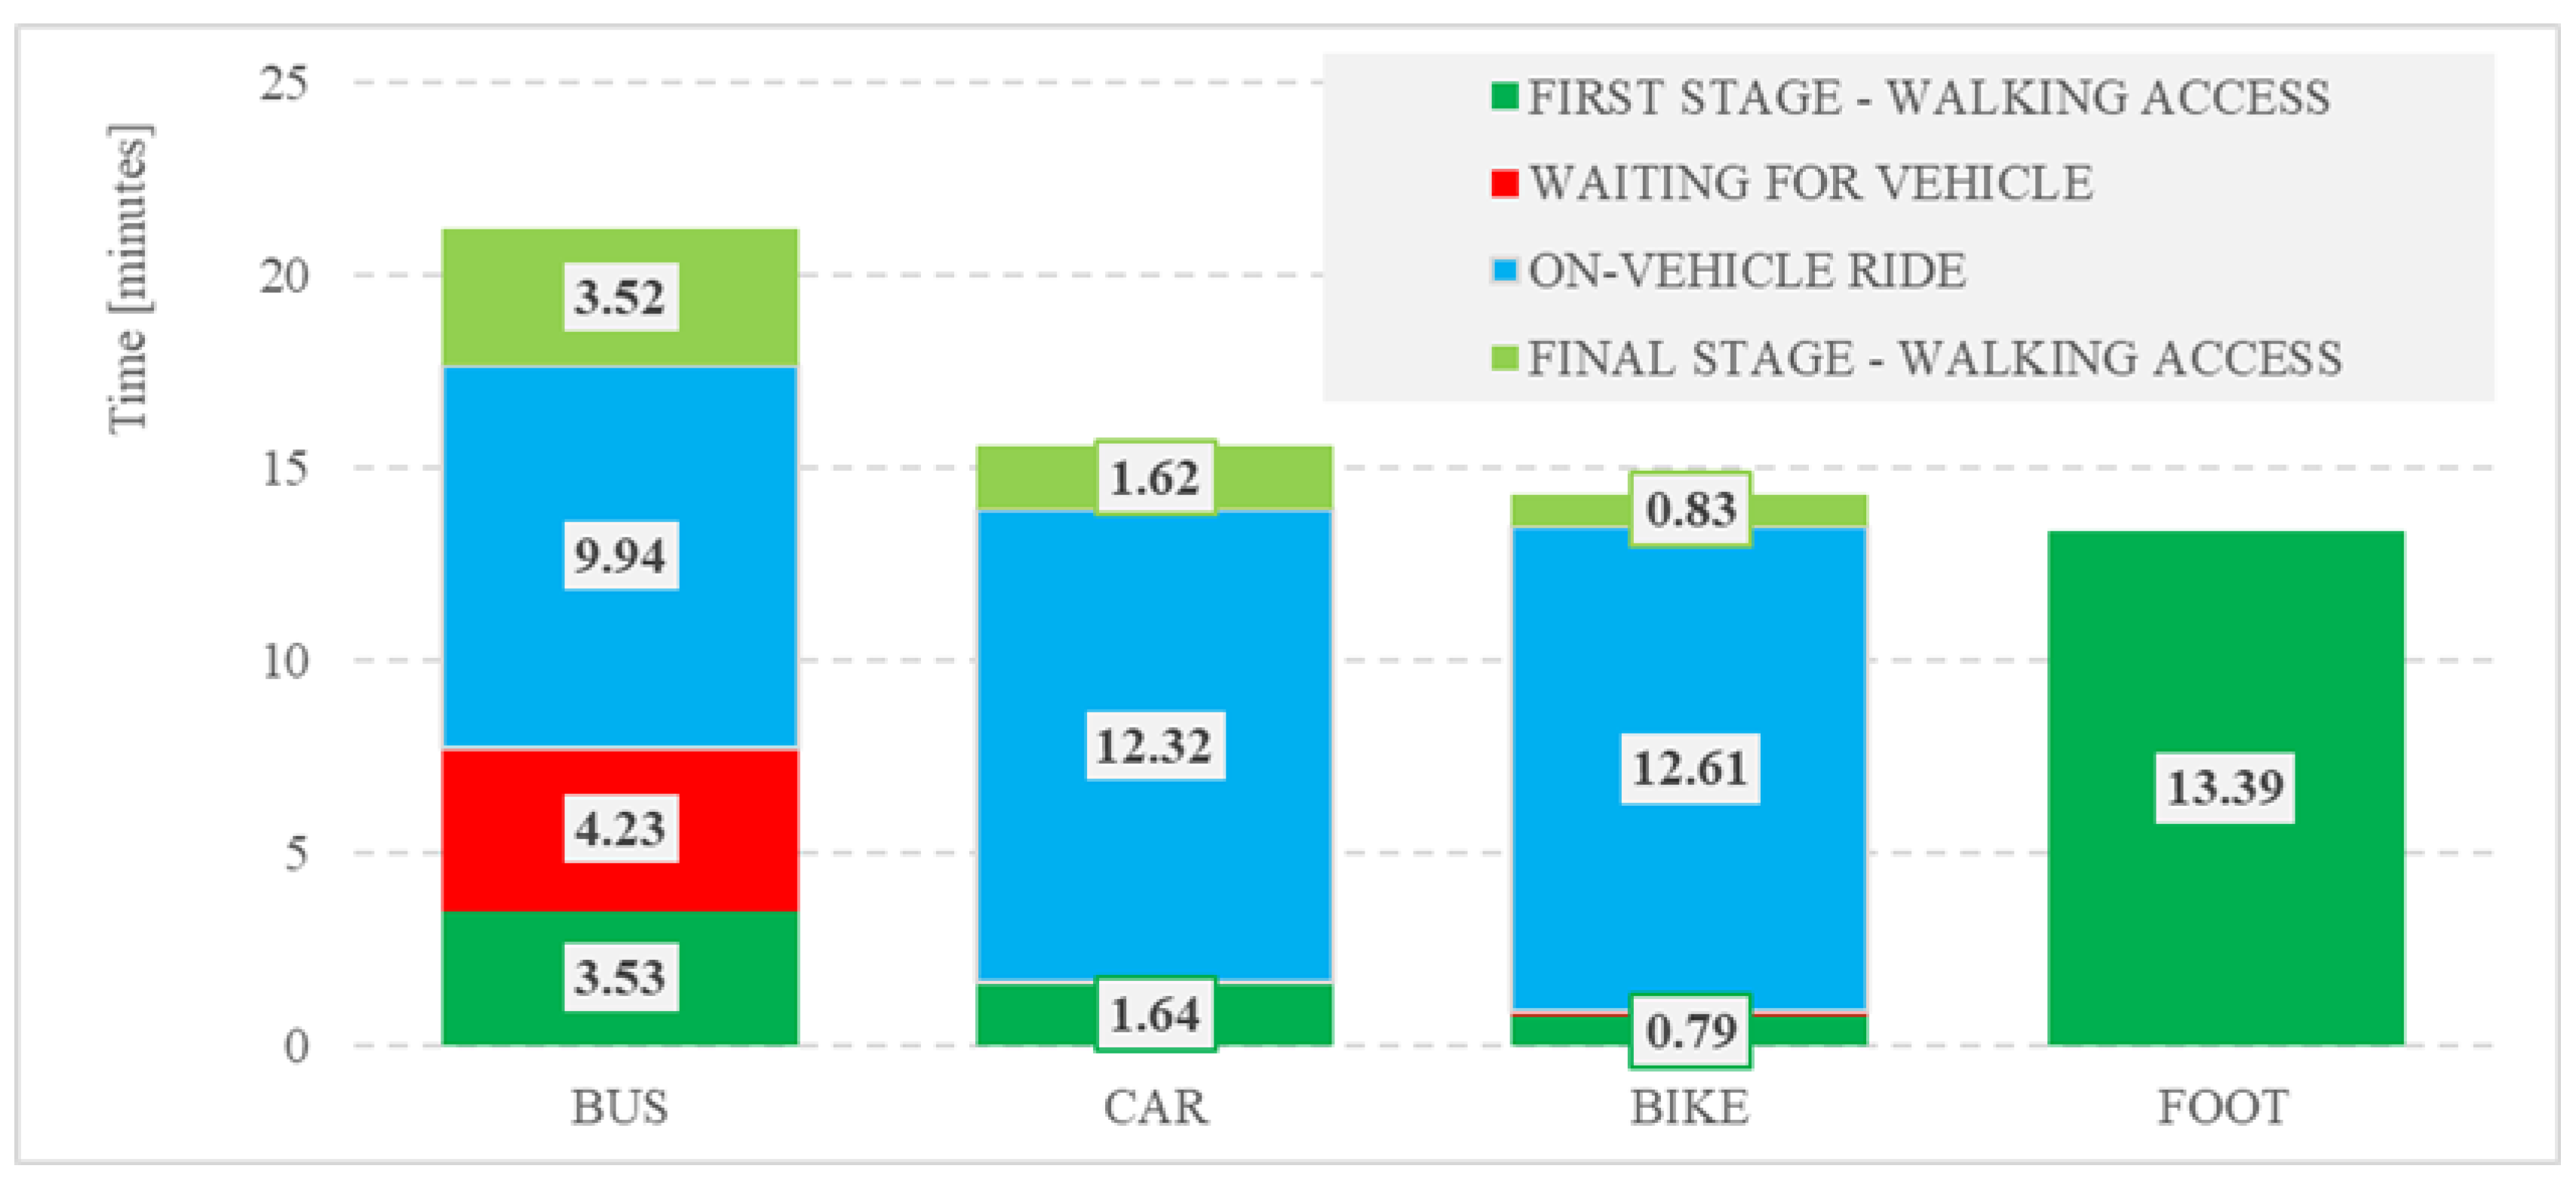
Figure 1 shows a comparison of the average duration of individual stages of a journey performed by various means of transport. Although the average total travel time is the longest for a bus journey, it mainly comes from longer average travel times (to a stop and to a destination)—a total of more than 7 min than for journeys by car (3.2 min) and especially by bike: only 1.6 min. In addition, for travel by bus, wait time at a stop is added, which was 4.2 min on average.
It is noteworthy that similar average travel times were obtained for journeys made by car and bicycle: approximately 2.5 min longer than by bus. The above results indicate that the times allocated by residents for daily travel during a working day are significantly different in terms of the duration of their individual stages.
The impact of unlimited or occasional access to a car on the daily use of various means of transport (Table 7) and the ownership of a season public transport ticket (at least monthly) was also examined (Table 8). Unlimited access to a private car is defined as the ability to use the vehicle at any time, while occasional access is defined as the ability to use it for single trips when the vehicle is not being used by another family member. Only non-pedestrian journeys were taken into account.
People declaring unlimited access to a car used it in the vast majority of their journeys (91.5%). On the other hand, people who do not have such access, apart from a bus also use a bicycle. However, in this case, the number of observations makes it impossible to draw far-reaching conclusions. However, it is worth paying attention to a fairly large number of journeys made by people with occasional access to a car—in this case, the use of available means of transport is the most varied. Ownership of a public transport season ticket is also important. Season tickets are usually bought by people who plan to use public transport frequently, but the very fact of having a season ticket encourages holders to use public transport more often, which results in less frequent use of a car.
Considering the above divisions of travel by Tarnow residents, mean duration values of individual journey stages were obtained. Significant differences were found for journeys made by bus. For journeys made by people without access to a car, all subsequent stages were longer (Figure 2). Interestingly, the average travel times by individual means of transport are similar, but again, it is the time that it takes to reach a stop and the wait time for a bus that are the reasons why a journey by public transport is longest. For journeys made by people without access to a car, the average travel time by bicycle is nearly twice as short as the average travel time by bus—with very similar average ride durations. This means that it is walking to a stop, waiting for a vehicle, and leaving the vehicle that make public transport less attractive—the total duration of these stages is longer than the ride time in the vehicle itself.
When it comes to considering journeys depending on the possession of a season ticket, a shorter average travel time by bus applies to people who have a season ticket, and the difference is mainly due to the much longer wait time for a vehicle (by 1.5 min) by people who do not have such a ticket (Figure 3). It can also be seen that season ticket holders generally make shorter-in-time journeys than non-season ticket holders (except for journeys made by bike). This may be due to the fact that season ticket holders tend to make repetitive trips, often to the city center area, where most destinations are located. These are often journeys that are shorter in terms of distance—this applies to both public transport and car. In this case, the differences come from ride times, while the times for reaching a vehicle are similar.
However, once again, it is possible to point out that walking distances for bus travel are much longer than for car journeys—for a bus, it is on average just over 7 min compared to just over 3 min for a car. The bicycle has no competition in this field—only about 1.5 min of total walking time from travel origin to a destination.
In the next step, access to a car and ownership of a public transport season ticket were linked. However, the emphasis was placed only on people who have access to a car because these people are the target group for possible changes in transport behavior. A list of journey contributions made by this group of residents is presented in Table 9.
For people who held a season ticket, the advantage of journeys made by car over those made by bus is minor: only 6.2%. However, the absence of a season ticket basically means exclusive use of a car (92.3%), and bus usage is lower than that of a bicycle. However, people who have a season ticket also use bicycles more frequently (6.4% more journeys) compared with people who do not have such a ticket. The comparison of the duration of individual stages of a journey for people with access to a car is presented in Figure 4.
In general, journeys made by people who hold a season ticket are shorter than journeys by those who do not have such a ticket—this applies to both travel by public transport as well as by car. Journeys made on bicycle constitute an exception—the owners of season tickets make longer journeys.
People who own season tickets had an average bus waiting of 2.3 min, and the ride time was on average shorter. For car journeys, journeys by people with a season ticket were almost 5 min shorter, and most of this difference resulted from the difference in driving time.
Once again, these results confirm that the greatest variation in the duration of individual stages of a journey between the analyzed means of transport occurs for walking from the origin of travel and to the destination itself. For bus journeys, these are twice as long as for car journeys, regardless of whether they are carried out by persons with season tickets (regular users) or occasional public transport customers. People who do not have season tickets declare slightly longer (about half a minute) walking times to a destination than owners of season tickets.
4. Discussion
The results obtained indicate the predominance of the car in journeys by Tarnow city residents on an average working day, as 80% of non-pedestrian journeys are made by this mode of transport. This predominance partially derives from the relatively easy access to a car; however, such decisions by residents are also affected by the public transport system (as well as bicycle path system). People who have unlimited access to a car would be particularly difficult to convince to change that mode of transport at least in part of their journeys, without making significant improvements to the conditions (bicycle) and time (bus) of travel. Greater opportunities can be seen with regard to people who declare occasional access to a car. These residents are characterized by the most universal use of different means of transport. In this case, even a less extensive scope of actions enhancing traveling by bus and on bicycle can bring positive outcomes. On the other hand, having a public transport ticket does not constitute such a strong commitment as car ownership. A ticket can be bought or not, and there are no additional costs for not using public transport. Therefore, this group of residents must be encouraged to use public transport at all costs because they are its most reliable users. As such, when implementing actions enhancing bus transport, their habits should be taken into account.
However, significant changes to the use of individual modes of transport are possible by reducing average travel times for public transport and bicycle. This is not only a question of the generally shorter total travel times by car (at this point in time) but also above all a question of the much shorter duration of the most burdensome travel stages when travelling by bus. This primarily includes bus wait times (on average 4.23 min), applicable only to public transport. Walking times from a travel origin and to a destination are present in almost every journey. They are decidedly longest for journeys made by public transport (a total of 7.05 min), over twice the walking time recorded for journeys made by car (total of 3.25 min). Close to 4 min means less than 300 m of walking distance, but with relatively short journeys around the city, this is apparently important. Bicycles are most favorable in this context—here, respondents declared a total walking time of only 1.62 min.
Such analyses always produce a dilemma about whether the transport mode choice depends more on the length of journey in terms of the distance or whether it is the journey duration that bears more significance. Where data on traveling are collected in the form of interviews with residents, results concerning a journey and its individual stage duration are more reliable. This stems from the fact that time is controlled by residents and information about time is available at all times. At the same time, distances are far more difficult to estimate, particularly when they are not directly measured. Therefore, it was decided that travel time is the most appropriate variable explaining the potential impact on the selection of means of transport in daily journeys.
With this in mind, how can one change this situation? It can be observed that having omitted the hypothetical wait time for a public transport vehicle, travel times by individual means of transport are similar. Therefore, measures should be taken to limit the duration of this journey stage to the furthest possible extent. In this case, it is possible to take diverse measures:
- Increase the frequency of bus runs on the city scale—however, this is very difficult due to strict financial limitations of the city;
- Increase the frequency of runs of the most important bus lines with the greatest transporting potential—however, this is also linked to significant expenditures, which are however, lower than in the preceding case;
- Further expansion and distribution of a dynamic passenger information system at stops—with the use of information boards about bus departures from given stops and possibly the use of boards located elsewhere near the largest clusters of travel origins, where information about departures from the nearest stops would be provided (strict city center and shopping malls), meaning the continuation of activities that already started; and
- Construction of a web-based passenger information system about real bus departure times from any stop, including a smartphone app, which currently constitutes the most efficient support for the journey planning process.
Naturally, it is not possible to completely eliminate wait time, but every time it is shortened will favor increasing the attractiveness of the public transport system.
However, it will be more difficult to develop an advantage within the scope of pedestrian access, particularly within housing estates. Then, it is typically a parking lot located near a travel origin/destination rather than a bus stop. The situation is better for city centers, where thanks to the exclusion of individual transport vehicles from selected squares and streets, it is sometimes possible to obtain a shorter access route from a bus stop than from a parking lot.
Solutions favoring shortening walking times to stops include the following:
- Designing pedestrian pavement traffic flows that directly ensure intuitive guidance to stops;
- Liquidation of spatial barriers on access routes to stops;
- Use of comfortable surfaces;
- Safe pedestrian crossings;
- Introduction of a commuting service to housing estate areas;
- More widespread use of commuting routes solely for public transport as well as pedestrian and bicycle traffic; and
- More frequent use of custom solutions, such as public transport on demand, which would enable reaching areas traditionally not served by public transport lines.
With this in mind, bicycle transport should not be forgotten. Here, access time is not a problem, as it is extremely short. However, an issue found in many cities is the lack of infrastructure continuity, which results in both prolonged ride time as well as reduced safety of bicycle users.
The results obtained are local in nature. However, the above observations may also be applicable to other cities with similar characteristics.
5. Conclusions
This study presents the problems of the impact of individual journey stage durations on transport mode selection. It was demonstrated that the stages associated with greatest arduousness—wait time for a vehicle and pedestrian access time—have the greatest impact. For journeys made by public transport, they may jointly exceed the travel time, which is unfavorably perceived by public transport system users. It is difficult to ascertain whether it is an effect of the drive/ride time itself or partially of comfort. Nevertheless, if possible, the time needed to reach stops should be shortened, bearing in mind that too short distances between stops result in an extension of the travel time. Therefore, the best solution is comprehensive planning of stop locations, ensuring the best possible conditions for reaching them thanks to the shortest possible access, which is among others thanks to the location of safe and comfortable pedestrian crossings in the immediate vicinity of stops.
For further research, there are plans to expand the questionnaire forms to include questions about reasons for choosing a given mode of transport. This was not possible in the described Tarnow survey due to cost constraints, but this type of information would be extremely helpful to better understand transport system users’ motives. It is also planned to extend the analyses to other cities and to expand travel studies by a detailed specification of the duration of operational activities related to the start and end of a journey as well as the duration of transfers.
Author Contributions
Conceptualization, M.B. and P.K.; methodology, M.B.; software, P.K.; validation, M.B., P.K. formal analysis, M.B.; investigation, M.B.; resources, P.K.; data curation, M.B.; writing—original draft preparation, M.B.; writing—review and editing, P.K.; visualization, M.B.; supervision, P.K.; project administration, M.B.; funding acquisition, P.K. All authors have read and agreed to the published version of the manuscript.
Funding
This research received funding from EU project no POIR.01.01.01-00-0970/17-00.
Conflicts of Interest
The authors declare no conflict of interest.
References
- European Commission. Green Paper. Towards a New Culture for Urban Mobility; No. 9; European Commission: Brussels, Belgium, 2007. [Google Scholar]
- Okraszewska, R.; Romanowska, A.; Wołek, M.; Oskarbski, J.; Birr, K.; Jamroz, K. Integration of a multilevel transport system model into sustainable urban mobility planning. Sustainability 2018, 10, 479. [Google Scholar] [CrossRef] [Green Version]
- Zawieska, J.; Pieriegud, J. Smart city as a tool for sustainable mobility and transport decarbonisation. Transp. Policy 2018, 63, 39–50. [Google Scholar] [CrossRef]
- Rudolph, F.; Mátrai, T. Congestion from a multimodal perspective. Period. Polytech. Transp. Eng. 2018, 46, 215–221. [Google Scholar] [CrossRef] [Green Version]
- Wang, Y.; Szeto, W.Y. Multiobjective environmentally sustainable road network design using Pareto optimization. Comput.-Aided Civ. Infrastruct. Eng. 2017, 32, 964–987. [Google Scholar] [CrossRef]
- Bueno-Suárez, C.; Coq-Huelva, D. Sustaining what is Unsustainable: A Review of Urban Sprawl and Urban Socio-Environmental Policies in North America and Western Europe. Sustainability 2020, 12, 4445. [Google Scholar] [CrossRef]
- Hebel, K.; Wolek, M. Perception of modes of public transport compared to travel behaviour of urban inhabitants in light of marketing research. Sci. J. Sil. Univ. Technol. Ser. Transp. 2016, 92, 65–75. [Google Scholar] [CrossRef]
- Brost, W.; Funke, T.; Lembach, M. Spatial analysis of the public transport accessibility for modelling the modal split in the context of site identification for charging infrastructure. Infrastructures 2018, 3, 21. [Google Scholar] [CrossRef] [Green Version]
- Mendiola, L.; González, P. Temporal dynamics in the relationship between land use factors and modal split in commuting: A local case study. Land Use Policy 2018, 77, 267–278. [Google Scholar] [CrossRef]
- D’Cruz, J.J.M.; Alex, A.P.; Manju, V.S.; Peter, L. Impact assessment of short-term management measures on travel demand. Arch. Transp. 2020, 53, 37–52. [Google Scholar] [CrossRef]
- McConnell, P. Rebuilding downtown: The importance of activity generators in downtown revitalization. Pap. Can. Econ. Dev. 2016, 15, 1–12. [Google Scholar] [CrossRef] [Green Version]
- Walker, P. Downtown Planning for Smaller and Midsized Communities; Routledge Taylor & Francis Group: London, UK; New York, NY, USA, 2017. [Google Scholar]
- Rao, A.M.; Rao, K.R. Measuring urban traffic congestion-a review. Int. J. Traffic Transp. Eng. 2012, 2, 286–305. [Google Scholar] [CrossRef]
- Essien, A.; Petrounias, I.; Sampaio, P.; Sampaio, S. The impact of rainfall and temperature on peak and off-peak urban traffic. In Database and Expert Systems Applications; Part II; Hartmann, S., Ma, H., Hameurlain, A., Pernul, G., Wagner, R.R., Eds.; Springer: Cham, Switzerland, 2018; pp. 399–407. [Google Scholar] [CrossRef] [Green Version]
- Mugion, R.G.; Toni, M.; Raharjo, H.; Di Pietro, L.; Sebathu, S.P. Does the service quality of urban public transport enhance sustainable mobility? J. Clean. Prod. 2018, 174, 1566–1587. [Google Scholar] [CrossRef]
- Gao, Y.; Rasouli, S.; Timmermans, H.; Wang, Y. Trip stage satisfaction of public transport users: A reference-based model incorporating trip attributes, perceived service quality, psychological disposition and difference tolerance. Transp. Res. Part A Policy Pract. 2018, 118, 759–775. [Google Scholar] [CrossRef]
- Holmgren, J. The effect of public transport quality on car ownership—A source of wider benefits? Res. Transp. Econ. 2020, 83, 100957. [Google Scholar] [CrossRef]
- Platform CROW. Knowledge and Information about Infrastructural Challenges. Available online: www.crowplatform.nl (accessed on 20 December 2020).
- Zhao, C.; Carstensen, T.A.; Nielsen, T.A.S.; Olafsson, A.S. Bicycle-friendly infrastructure planning in Beijing and Copenhagen-between adapting design solutions and learning local planning cultures. J. Transp. Geogr. 2018, 68, 149–159. [Google Scholar] [CrossRef]
- Okraszewska, R. Impact of Cyclist Facility Availability at Work on the Number of Bike Commuters. In Integration as Solution for Advanced Smart Urban Transport Systems; Sierpinski, G., Ed.; Springer: Cham, Switzerland, 2018; pp. 95–105. [Google Scholar] [CrossRef]
- Sun, Z.; Wang, Y.; Zhou, H.; Jiao, J.; Overstreet, R.E. Travel behaviours, user characteristics, and social-economic impacts of shared transportation: A comprehensive review. Int. J. Logist. Res. Appl. 2019, 23, 417–442. [Google Scholar] [CrossRef]
- Turek, D.; Alke, E.; Kaczor, M.; Mokrzanski, M. Survey of Passenger Transport Mobility at a Local Level; Research Studies; Statistics Poland: Warsaw, Poland, 2017. (In Polish) [Google Scholar]
- Krygsman, S.; Dijst, M.; Arentze, T. Multimodal public transport: An analysis of travel time elements and the interconnectivity ratio. Transp. Policy 2004, 11, 265–275. [Google Scholar] [CrossRef]
- Venter, C.J. Measuring the quality of the first/last mile connection to public transport. Res. Transp. Econ. 2020, 83, 100949. [Google Scholar] [CrossRef]
- Chowdhury, S.; Ceder, A. A psychological investigation on public-transport users’ intention to use routes with transfers. Int. J. Transp. 2013, 1, 1–20. [Google Scholar] [CrossRef]
- Schakenbos, R.; La Paix, L.; Nijenstein, S.; Geurs, K.T. Valuation of a transfer in a multimodal public transport trip. Transp. Policy 2016, 46, 72–81. [Google Scholar] [CrossRef]
- Garcia-Martinez, A.; Cascajo, R.; Jara-Diaz, S.R.; Chowdhury, S.; Monzon, A. Transfer penalties in multimodal public transport networks. Transp. Res. Part A Policy Pract. 2018, 114, 52–66. [Google Scholar] [CrossRef]
- Cieśla, M.; Sobota, A.; Jacyna, M. Multi-Criteria Decision Making Process in Metropolitan Transport Means Selection Based on the Sharing Mobility Idea. Sustainability 2020, 12, 7231. [Google Scholar] [CrossRef]
- Jacyna, M.; Wasiak, M.; Lewczuk, K.; Kłodawski, M. Simulation model of transport system of Poland as a tool for developing sustainable transport. Arch. Transp. 2014, 31, 23–35. [Google Scholar] [CrossRef]
- Macioszek, E.; Sierpiński, G.; Staniek, M.; Celiński, I. Transport planning organisation and management. In Proceedings of the 2nd World Congress on Civil, Structural and Environmental Engineering (CSEE’17), Barcelona, Spain, 2–4 April 2017; p. 122-1. [Google Scholar] [CrossRef]
- Szarata, A. The multimodal approach to the modelling of modal split. Arch. Transp. 2014, 29, 55–63. [Google Scholar] [CrossRef]
- Statistical Office in Krakow. Statistical Vademecum for Local Government Officials 2020. Available online: https://krakow.stat.gov.pl/vademecum/vademecum_malopolskie/portrety_miast/miasto_tarnow.pdf (accessed on 16 December 2020).
- Road and Transport Administration in Tarnow. Bus Routes and Timetables. Available online: http://rozklad.komunikacja.tarnow.pl (accessed on 16 December 2020).
- Statistics Poland. Local Data Bank, Transport and Communication: Bicycle Lanes. Available online: https://bdl.stat.gov.pl/BDL/dane/podgrup/tablica (accessed on 18 December 2020).
- Bauer, M.; Drabicki, A.; Duda, U.; Dudek, M.; Dzwigon, W.; Nosal Hoy, K.; Solecka, K.; Szarata, A.; Wlazly, W.; Wojnarowski, A.; et al. Optimization of Public Transport Network in Tarnow; Research Studies; Cracow University of Technology: Cracow, Poland, 2019. (In Polish) [Google Scholar]
Figure 1.
Comparison of mean travel times for individual journey stages (min).

Figure 2.
Comparison of the duration of individual journey stages depending on access (a) and no access (b) to a passenger car.
Figure 2.
Comparison of the duration of individual journey stages depending on access (a) and no access (b) to a passenger car.

Figure 3.
Comparison of the duration of individual journey stages depending on ownership (a) and non-ownership (b) of a public transport season ticket by the respondent.
Figure 3.
Comparison of the duration of individual journey stages depending on ownership (a) and non-ownership (b) of a public transport season ticket by the respondent.

Figure 4.
Comparison of individual journey stages durations for people with unlimited or at least occasional access to a car depending on whether the respondent owns (a) or not (b) a public transport season ticket.
Figure 4.
Comparison of individual journey stages durations for people with unlimited or at least occasional access to a car depending on whether the respondent owns (a) or not (b) a public transport season ticket.


Table 1.
Individual possible stages of travel assigned to types of vehicles.
| Travel Stage | Journey Using One Mode of Transport | Journey Using Two Different Means of Transport | ||||
|---|---|---|---|---|---|---|
| Public Transport | Car | Bicycle | Public Transport | Car | Bicycle | |
| Reaching the location where the first ride commences/driving from the travel origin | Yes | Rather Yes | Yes/No | Rather Yes | Yes/No | Yes/No |
| Operational activities associated with the commencement of a ride/drive | No | Yes | Yes | Yes | Yes | Yes |
| Waiting for a vehicle | Rather Yes | No | No | Rather Yes | Rather Yes | No |
| Ride/drive | Yes | Yes | Yes | Yes | Yes | Yes |
| Transfer | Yes/No | No | No | Yes | Yes | Yes |
| Operational activities associated with the completion of a ride/drive | No | Yes | Yes | Yes | Yes | Yes |
| Reaching a travel destination from the place of completion of the last ride/drive | Yes | Rather Yes | Yes/No | Rather Yes | Yes/No | Yes/No |
Table 2.
List of journeys on an average working day.
| Variable | On Foot | Bus | Car | Bicycle | Total |
|---|---|---|---|---|---|
| Total number of journeys | 319 | 131 | 836 | 77 | 1363 |
| Contribution of journeys to a given mode of transport | 0.234 | 0.096 | 0.613 | 0.056 | 1.000 |
| Contribution of journeys to a given mode of transport (only non-pedestrian journeys) | - | 0.125 | 0.801 | 0.074 | 1.000 |
Table 3.
Comparison between travel times with different means of transport on an average working day.
Table 3.
Comparison between travel times with different means of transport on an average working day.
| Journey | Basic Characteristics of Journey Time (min) | Confidence Interval (min) | |||||
|---|---|---|---|---|---|---|---|
| Count | Min | Max | Average | Standard Deviation | Lower Limit | Upper Limit | |
| On foot | 319 | 1 | 40 | 13.39 | 8.28 | 12.48 | 14.30 |
| Bus | 131 | 7 | 62 | 21.21 | 9.73 | 19.53 | 22.90 |
| Bicycle | 77 | 5 | 32 | 14.34 | 6.82 | 12.79 | 15.89 |
| Car | 836 | 3 | 44 | 15.58 | 7.00 | 15.10 | 16.05 |
| Car—as driver | 725 | 3 | 40 | 15.27 | 7.02 | 14.76 | 15.79 |
| Car—as passenger | 111 | 5 | 44 | 17.54 | 6.55 | 16.31 | 18.77 |
Table 4.
Comparison of individual bus journey stage travel times.
| Travel Stage | Basic Characteristics of Journey Stage Time (min) | Confidence Interval (min) | |||||
|---|---|---|---|---|---|---|---|
| Count | Min | Max | Average | Standard Deviation | Lower Limit | Upper Limit | |
| time taken to reach the bus stop on foot from travel origin | 131 | 1 | 15 | 3.53 | 2.84 | 3.04 | 4.02 |
| bus wait time | 131 | 0 | 26 | 4.23 | 5.46 | 3.29 | 5.17 |
| in-vehicle ride time | 131 | 2 | 26 | 9.94 | 5.17 | 9.04 | 10.83 |
| time taken to reach the travel destination from bus stop on foot | 131 | 1 | 12 | 3.52 | 2.54 | 3.08 | 3.96 |
Table 5.
Comparison of individual bicycle journey stage travel times.
| Travel Stage | Basic Characteristics of Journey Stage Time (min) | Confidence Interval (min) | |||||
|---|---|---|---|---|---|---|---|
| Count | Min | Max | Average | Standard Deviation | Lower Limit | Upper Limit | |
| time taken to reach the bicycle on foot from travel origin | 77 | 0 | 3 | 0.79 | 0.83 | 0.60 | 0.98 |
| ride time | 77 | 3 | 30 | 12.61 | 6.38 | 11.16 | 14.06 |
| time taken to reach the travel destination on foot | 77 | 0 | 3 | 0.83 | 0.83 | 0.64 | 1.02 |
Table 6.
Comparison of individual car journey stages travel times.
| Travel Stage | Basic Characteristics of Journey Stage Time (min) | Confidence Interval (min) | |||||
|---|---|---|---|---|---|---|---|
| Count | Min | Max | Average | Standard Deviation | Lower Limit | Upper Limit | |
| time taken to reach the car on foot from the travel origin | 836 | 0 | 12 | 1.64 | 0.88 | 1.58 | 1.69 |
| in-vehicle ride time | 836 | 1 | 40 | 12.32 | 6.46 | 11.89 | 12.76 |
| time taken to reach the travel destination on foot | 836 | 0 | 6 | 1.62 | 0.79 | 1.56 | 1.67 |
Table 7.
Number and contribution of journeys made by different means of transport depending on access to a passenger car on an average working day.
Table 7.
Number and contribution of journeys made by different means of transport depending on access to a passenger car on an average working day.
| Declared Access to a Private Car | Frequency (Journeys) | Frequency (%) | |||||
|---|---|---|---|---|---|---|---|
| Bus | Car | Bicycle | Total | Bus | Car | Bicycle | |
| Unlimited | 17 | 744 | 52 | 813 | 0.021 | 0.915 | 0.064 |
| Occasional | 75 | 92 | 13 | 180 | 0.417 | 0.511 | 0.072 |
| No access | 39 | 0 | 12 | 51 | 0.765 | 0.000 | 0.235 |
Table 8.
Number and contribution of journeys made by different means of transport depending on the ownership of a public transport season ticket on an average working day.
Table 8.
Number and contribution of journeys made by different means of transport depending on the ownership of a public transport season ticket on an average working day.
| Declared Ownership of a Season Ticket | Frequency (Journeys) | Frequency (%) | |||||
|---|---|---|---|---|---|---|---|
| Bus | Car | Bicycle | Total | Bus | Car | Bicycle | |
| Held | 91 | 84 | 21 | 196 | 0.464 | 0.429 | 0.107 |
| Not held | 40 | 752 | 56 | 848 | 0.047 | 0.887 | 0.066 |
Table 9.
The number and contribution of journeys made by different means of transport depending on public transport season ticket ownership on an average working day.
Table 9.
The number and contribution of journeys made by different means of transport depending on public transport season ticket ownership on an average working day.
| Access to Car and Ownership of Season Ticket | Frequency (Journeys) | Frequency (-) | |||||
|---|---|---|---|---|---|---|---|
| Bus | Car | Bicycle | Total | Bus | Car | Bicycle | |
| Access to a car, season ticket | 73 | 84 | 21 | 178 | 0.410 | 0.472 | 0.118 |
| Access to a car, no season ticket | 19 | 752 | 44 | 815 | 0.023 | 0.923 | 0.054 |
Publisher’s Note: MDPI stays neutral with regard to jurisdictional claims in published maps and institutional affiliations. |
© 2021 by the authors. Licensee MDPI, Basel, Switzerland. This article is an open access article distributed under the terms and conditions of the Creative Commons Attribution (CC BY) license (https://creativecommons.org/licenses/by/4.0/).
Share and Cite
MDPI and ACS Style
Bauer, M.; Kisielewski, P. The Influence of the Duration of Journey Stages on Transport Mode Choice: A Case Study in the City of Tarnow. Sustainability 2021, 13, 5922. https://doi.org/10.3390/su13115922
AMA Style
Bauer M, Kisielewski P. The Influence of the Duration of Journey Stages on Transport Mode Choice: A Case Study in the City of Tarnow. Sustainability. 2021; 13(11):5922. https://doi.org/10.3390/su13115922
Chicago/Turabian StyleBauer, Marek, and Piotr Kisielewski. 2021. "The Influence of the Duration of Journey Stages on Transport Mode Choice: A Case Study in the City of Tarnow" Sustainability 13, no. 11: 5922. https://doi.org/10.3390/su13115922
Note that from the first issue of 2016, this journal uses article numbers instead of page numbers. See further details here.