
Sustainability and Digital Transformation in the Visegrad Group of Central European Countries


1
Department of Environmental Economics, Faculty of Economic and Social Sciences, Budapest University of Technology and Economics, 1111 Budapest, Hungary
2
Department of Electric Power Engineering, Faculty of Electrical Engineering and Informatics, Budapest University of Technology and Economics, 1111 Budapest, Hungary
*
Author to whom correspondence should be addressed.
Sustainability 2021, 13(11), 5833; https://doi.org/10.3390/su13115833
Submission received: 22 April 2021
/
Revised: 15 May 2021
/
Accepted: 18 May 2021
/
Published: 22 May 2021
Abstract
:The evolution of the digital transformation presents new challenges and many new opportunities, and provides unique solutions to individual issues, both for sectors and regions. The challenges posed by the digital world have a significant impact on social and economic processes, as well as our environment. This paper aims to provide an indicator-based understanding of the main characteristics of digitalization promoting sustainable development in the member countries of the Visegrad Cooperation. The main goal of this research is to study the relationship between digitalization transformation and sustainability together. One of the basic indicators of the article is the Digital Economy and Society Index (DESI). We examined interconnections between the dimensions of the DESI index and the indicators of the Sustainable Development Goal (SDG) targets together in the V4, presented the change, evaluated the selected countries based on these aspects, and set up their ranking. Competitiveness performance data shed light on the situation in Hungary within the V4 countries, pointing out the strengths and shortcomings. The results show the extent of digital performance in each country and the relationship between their digital performance and sustainability indicators.
1. Introduction
Nowadays, digital transformation, innovation and sustainability are all relevant and significant dimensions of transition processes and development policies. The importance of these phenomena increases with the emergence and intensification of various and more complex problems on diverse spatial levels, also enhancing the prominence of inter and transdisciplinary, and moreover, multidimensional solutions. Examples of such problems are climate change, environmental pollution, migration, pandemics and so on [1,2]. The digital transformation presents new challenges as well as many new opportunities and solutions for individual stakeholders, companies, sectors, and regions [3].
Digital technologies, big data analytics, information, and communication technologies (ICTs), the Internet of Things (IoT), and other developments impact our everyday lives [4]. The Industry 4.0 transformation makes it easy to obtain and analyze large amounts of data [5]. Digital technologies, processes and competencies span all levels and functions, and due to their smart strategic integration, digital transformation also has an impact on cultural, organizational, and operational change in an industry or ecosystem [6]. Digital technologies are influencing the transformation of the economy, driving it towards prosperity [7]. Policymakers have also noticed this phenomenon as there is more and more smart solution-related ambition in the different sectoral development strategies on national and international levels [8]. Decision-makers want to use a powerful and easy-to-use tool to select and develop appropriate strategies to cover the causal structure of a given complex system [9]. Thanks to digital actors, we are able to manage and accelerate cross-sectoral transitions in geographical areas [10,11]. Digitization has made it possible to cover a wide range of resources that can be shared and to operate beyond the boundaries of small groups and personal relationships [12]. The different smart and innovative solutions and a change of mindset can offer new planning, management, and development opportunities [13].
Digital transformation is defined as “the profound transformation of business and organizational activities, processes, competencies and models to fully leverage the changes and opportunities of a mix of digital technologies and their accelerating impact across society in a strategic and prioritized way, with present and future shifts in mind” [14,15]. Nowadays, the assessment and monitoring of digital transition can play a pivotal role in policy planning. It is also essential to be able to underpin different sectoral and spatial development programs on various scales from diverse perspectives according to the challenges of climate change, digitalization, and sustainability [16,17,18,19].
The digital switchover is essential to achieving the adaptation objectives of the Green Agreement [20]. The sustainable and smart concepts are not substitutable; however, from the policy perspective today, it is expected, on the strategic level of the European Union, to contribute to the digitalization transformation to sustainable development [21]. This paper aims to provide an indicator-based understanding of the main characteristics of digitalization promoting sustainable development.
Considering the sustainable development-related literature, there are few clear scientific results or opinions regarding the exact role of digitalization toward sustainability, especially in Central Europe. Due to the limited number of assessments focusing on the interrelations between digitalization and each dimension of sustainable development [22,23,24,25,26], there is a definite research gap that needs to be filled in, and it is especially true for the examined area. Digital technology-driven methods and solutions can play a pivotal role in different areas of environmental sustainability as pollution control, waste management, sustainable production, sustainable transport and logistics or sustainable urban development [16,23,27,28,29,30]. However, to examine the three pillars of sustainability and digital transformation from regional perspectives is uncertain, thus it motivated our study conducted in Central Europe. The effects of digitalization on socio-economic and environmental sustainability are diverse [22,31].
With regional development aspects in mind, several social, economic, and environmental aspects need to be taken into account [32]. The current study explores the potential role of digital transformation in the transition toward sustainability. The understanding of this requires a change in mindsets, structures, and practices. Digital transformation can have the potential to support the achievement of Sustainable Development Goals (SDGs) effectively [33], due to the created new opportunities. Furthermore, these new opportunities can have lower transaction costs [14]. Digital transformation also holds the ability to support the endeavors of the national and local governments to develop the socio-economic environment in a resilient and sustainable way.
Based on the scientific literature review, it can be stated that there is insufficient knowledge considering sustainability and digitalization linkages, especially in the examined region. The aim of this assessment is to give a clear overview in relation to the current status of the digital transformation in the four countries of the Visegrad Group (V4). Furthermore, to provide an indicator-based assessment considering, on the one hand, the main characteristics of digitalization and, on the other hand, highlighting the interrelations in promoting sustainable development. This indicator-based assessment is based on the Digital Economy and Society Index (DESI).
The DESI is a composite indicator to measure and monitor the process in digitalization performance of the EU member countries [34,35]. Considering the possible tools in evaluating sustainability transition, the United Nations Sustainable Development Goals (SDGs) [36] can be a powerful and comprehensive tool in performance evaluation on the country level. Based on the comparative analyses of the DESI and SDGs, the interrelations of the two transition processes can be highlighted, improving scientific knowledge concerning synergistic effects and interdependencies at the same time.
As can be seen from reading the literature, most of the publications on the subject relate to Western countries, with little to do with the Visegrad Group. That is why we consider it particularly important to demonstrate the digital and sustainability performance of this region. Based on the literature and analysis presented, the article focuses on the dimensions affected by the digital transformation, such as connectivity, mobile coverage, and human digital capital. Digitization technologies themselves are not the focus of this article.
2. Materials and Methods
In the focus of the recent research is the examination of the digital transformation in the four countries of the Visegrad Group (V4) considering sustainability. In the analysis, the four member countries were compared and ranked based on different criteria. The main goal of this assessment was to examine the interrelations between sustainability and digital transformation in Central Europe. First of all, the economic and social situation of the research area was in the focus of our evaluation.
The economic situation of countries correlates with the degree of innovation and digital transformation [37]. For this reason, as the first step of our research, the economic issue in terms of SDG goals were explored. To underpin this phase, we collected economic data from 2015 to 2020 from Eurostat databases and processed them in the form of charts. In this way, we made the economic differences of each country visible. The main hypothesis of this research is the size of GDP influencing the extent of digital transformation. We examined the period between 2015 and 2020 because the DESI indicator, which is important for digital transformation, is calculated from 2015 onwards. To be able to map the economic situation, we also needed population data, the real GDP values of the given countries in euros, and PPS (purchasing power standards).
For the above-mentioned sustainability-oriented assessment, it is not enough to compare the GDP performance of the evaluated countries, however, it was also necessary to examine social processes considering the social dimension of sustainability. For this purpose, we chose two indicators in our research, the HDI (Human Development Index) and the SPI (Social Progress Index) indicators [38,39,40]. The former indicator can emphasize social development and living standards at the same time on a comparable basis for the V4 countries. This is also available from Eurostat. The article presents the latest HDI dataset for 2020, which includes 2019 data, compared to the 10-year-old data of 2010. We have indicated the places in the 2019 HDI rankings of the selected countries and the changes in the rankings of the last 5 years, i.e., 2014–2019. We then examined the average HDI growth between 2000 and 2010 and between 2010 and 2019, respectively. This clearly shows the difference in HDI growth between the two decades in the selected countries. We collected the 2019 GNI (Gross National Income) values per capita and compared them with the sustainability goals, and they can be ranked based on the selected member states in terms of social development and living standards. Another important social indicator we have chosen is the SPI, which takes social and environmental aspects also into account. This is closely related to economic growth, yet it is different from it. In terms of SPI data, we also ranked the V4 member states between 2015 and 2020 and presented the differences.
After examining the social and economic aspects, we move on to the digital transformation. Our second hypothesis is that sustainability and digitization are closely related. For this, we used the data of the DESI. Thanks to a comparative analysis of Digital Europe 2011–2015, new composite indexes have been created, including the DESI index. Greater emphasis has been placed on systematic data collection and monitoring of policy developments for a digital single market strategy. The DESI index has been calculated since 2015 [41]. The index includes Connectivity, Human Capital, Use of the Internet, Integration of Digital Technology, and Digital Public Services. During the research, we examined the data between 2015 and 2020 specifically from the point of view of Hungary. Each component is added to the DESI index in different percentages, so each value is weighted by us accordingly and presented year by year. Thus, the change in the index and the change in each dimension over time can also be tracked.
According to our hypothesis, the member states of V4 are not on the same level through the digitization transformation. In order to prove this, we set up rankings according to several aspects during the research. We selected 10 different indicators out of the 43 listed in the article of [42] that make up the main 5 dimensions of DESI based on Eurostat data; we ranked the selected countries according to each indicator. The 10 indicators were selected as follows. We looked at the DESI index 5 dimensions as well as the subdimensions within them. Indicators were selected from all 5 dimensions to examine each dimension through at least one indicator. Based on that, we examined which indicators are most relevant to sustainability goals. The indicators range between the value of 0 and the given percentage, so we illustrated the increasing performance of the member states based on the indicators, and all this was supplemented with a ranking between the member states.
We focused on companies from the four-member states based on three perspectives: social media, e-commerce sales, and websites. In doing so, we also set up a ranking among the four-member states.
Finally, based on the composition of the literature and indicators, we examined which SDG goals are most influenced by the digital transformation. This also demonstrates the link between digitalization and sustainability, moreover, the relevance of joint research to enlighten the interrelations between the two types of the transition process. The 10 selected SDG targets were examined in more detail and 2-2 specific indicators were selected for each. We collected data about V4 member countries based on these indicators and set up rankings based on SDG targets. The results obtained were weighted by us and an overall ranking was made.
3. Results
Our research aims to jointly examine the aspects of digital transformation and sustainable development among the members of the Visegrad Cooperation. To be able to examine countries from a sustainability perspective, economic and social processes also need to be examined as a matter of priority. The results of [43] show that digitization is significantly correlated with components of sustainable development, which means this research confirms our hypothesis. Based on their research, it can be said that the higher the digital transformation, the more competitiveness, innovation, and entrepreneurship grow, which contributes significantly to economic development. According to that article, the more digitized countries also have higher GDP. Nevertheless, not only economic development but also the social aspect has a positive impact on digital transformation.
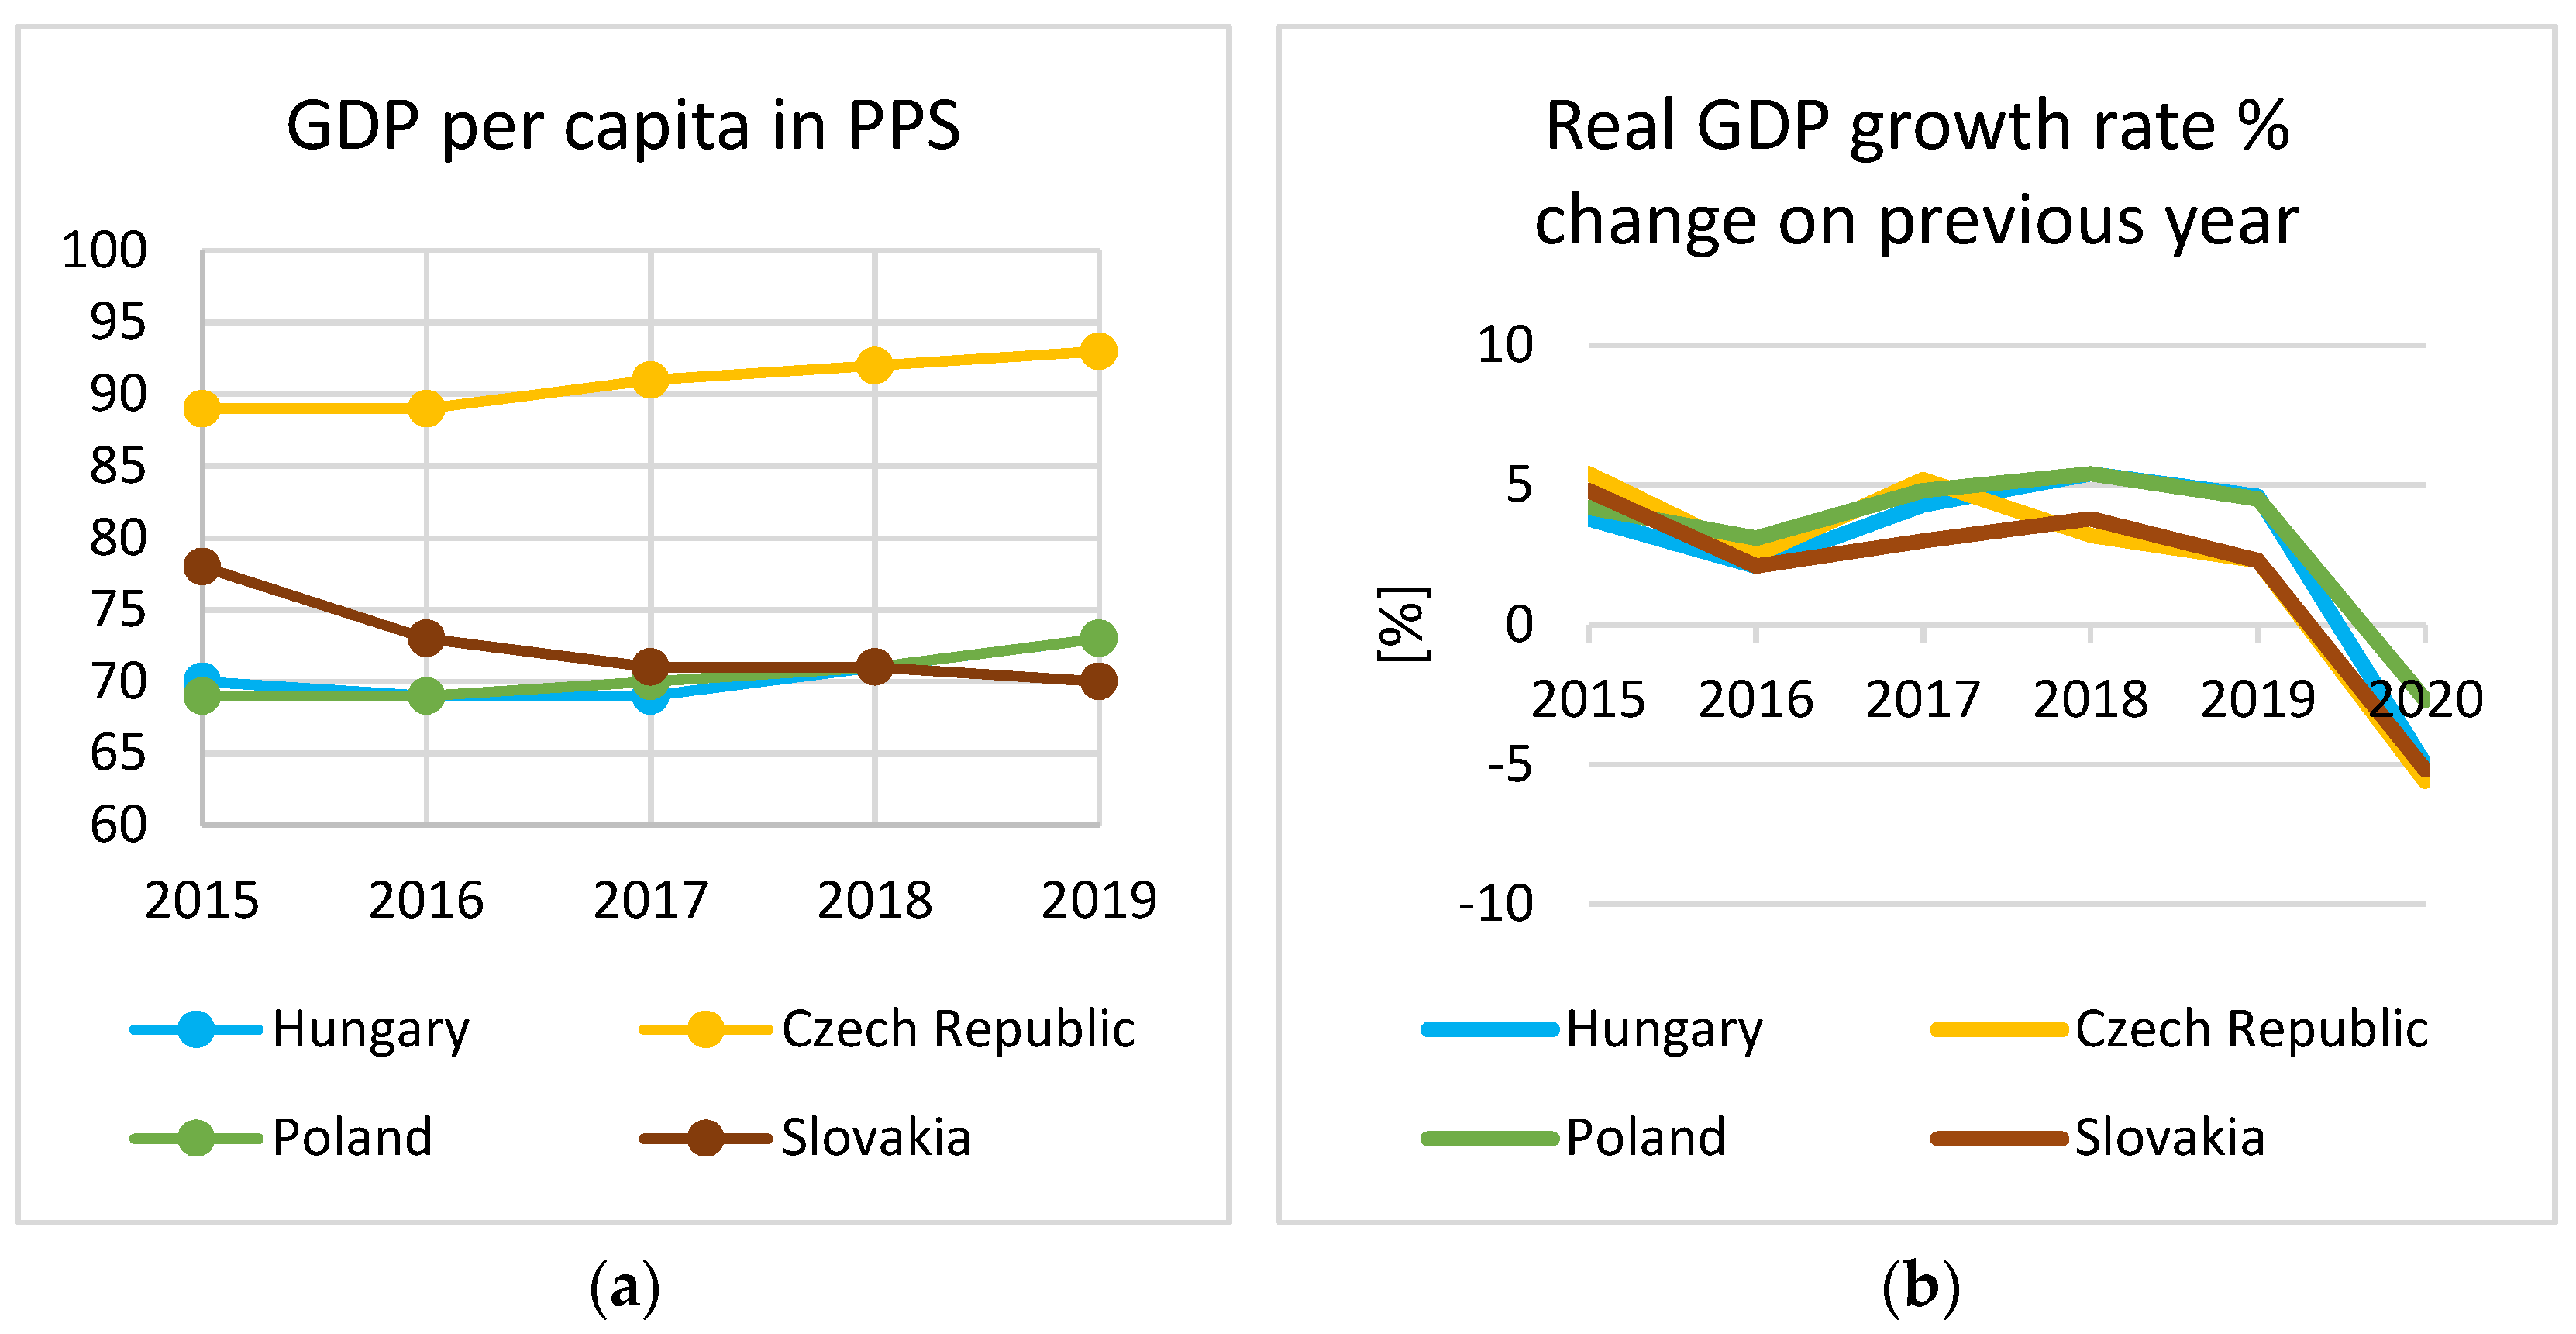
Gross domestic product (GDP) is a good indicator for a nation’s economic situation. It allows us to compare the economic situation of the V4 countries. Based on our assumption, GDP influences the extent of the digital transformation, so we compared the GDP of the studied countries from three perspectives. We examined the growth rate of real GDP, which shows the percentage change in GDP compared to the previous year (Figure 1a). This value was the lowest in Hungary in 2015, while in 2019, it was the highest in Hungary. However, this one indicator is not enough to show GDP between the selected countries, because it only shows the percentage change. In 2020, real GDP growth was drastic compared to the previous year. For the first time in this period (2015–2020) under review, the rate of growth became negative. As a result of the COVID-19 epidemic [44], GDP has declined significantly in all countries. For the several member states, real GDP in 2020 is approaching 2–3 years ago. This results in a significant economic downturn.
GDP/capita index is expressed in purchasing power standards (PPS) compared to the European Union average of 100. If a country has an index higher than 100, its GDP per capita is higher than the EU average. In this case, all V4 countries lag behind the EU average, as shown in Figure 1b. The Czech Republic is the closest of the examined countries to the EU average [45]. The GDP data for the chart was provided by the Eurostat database in Figure 1a,b [45].
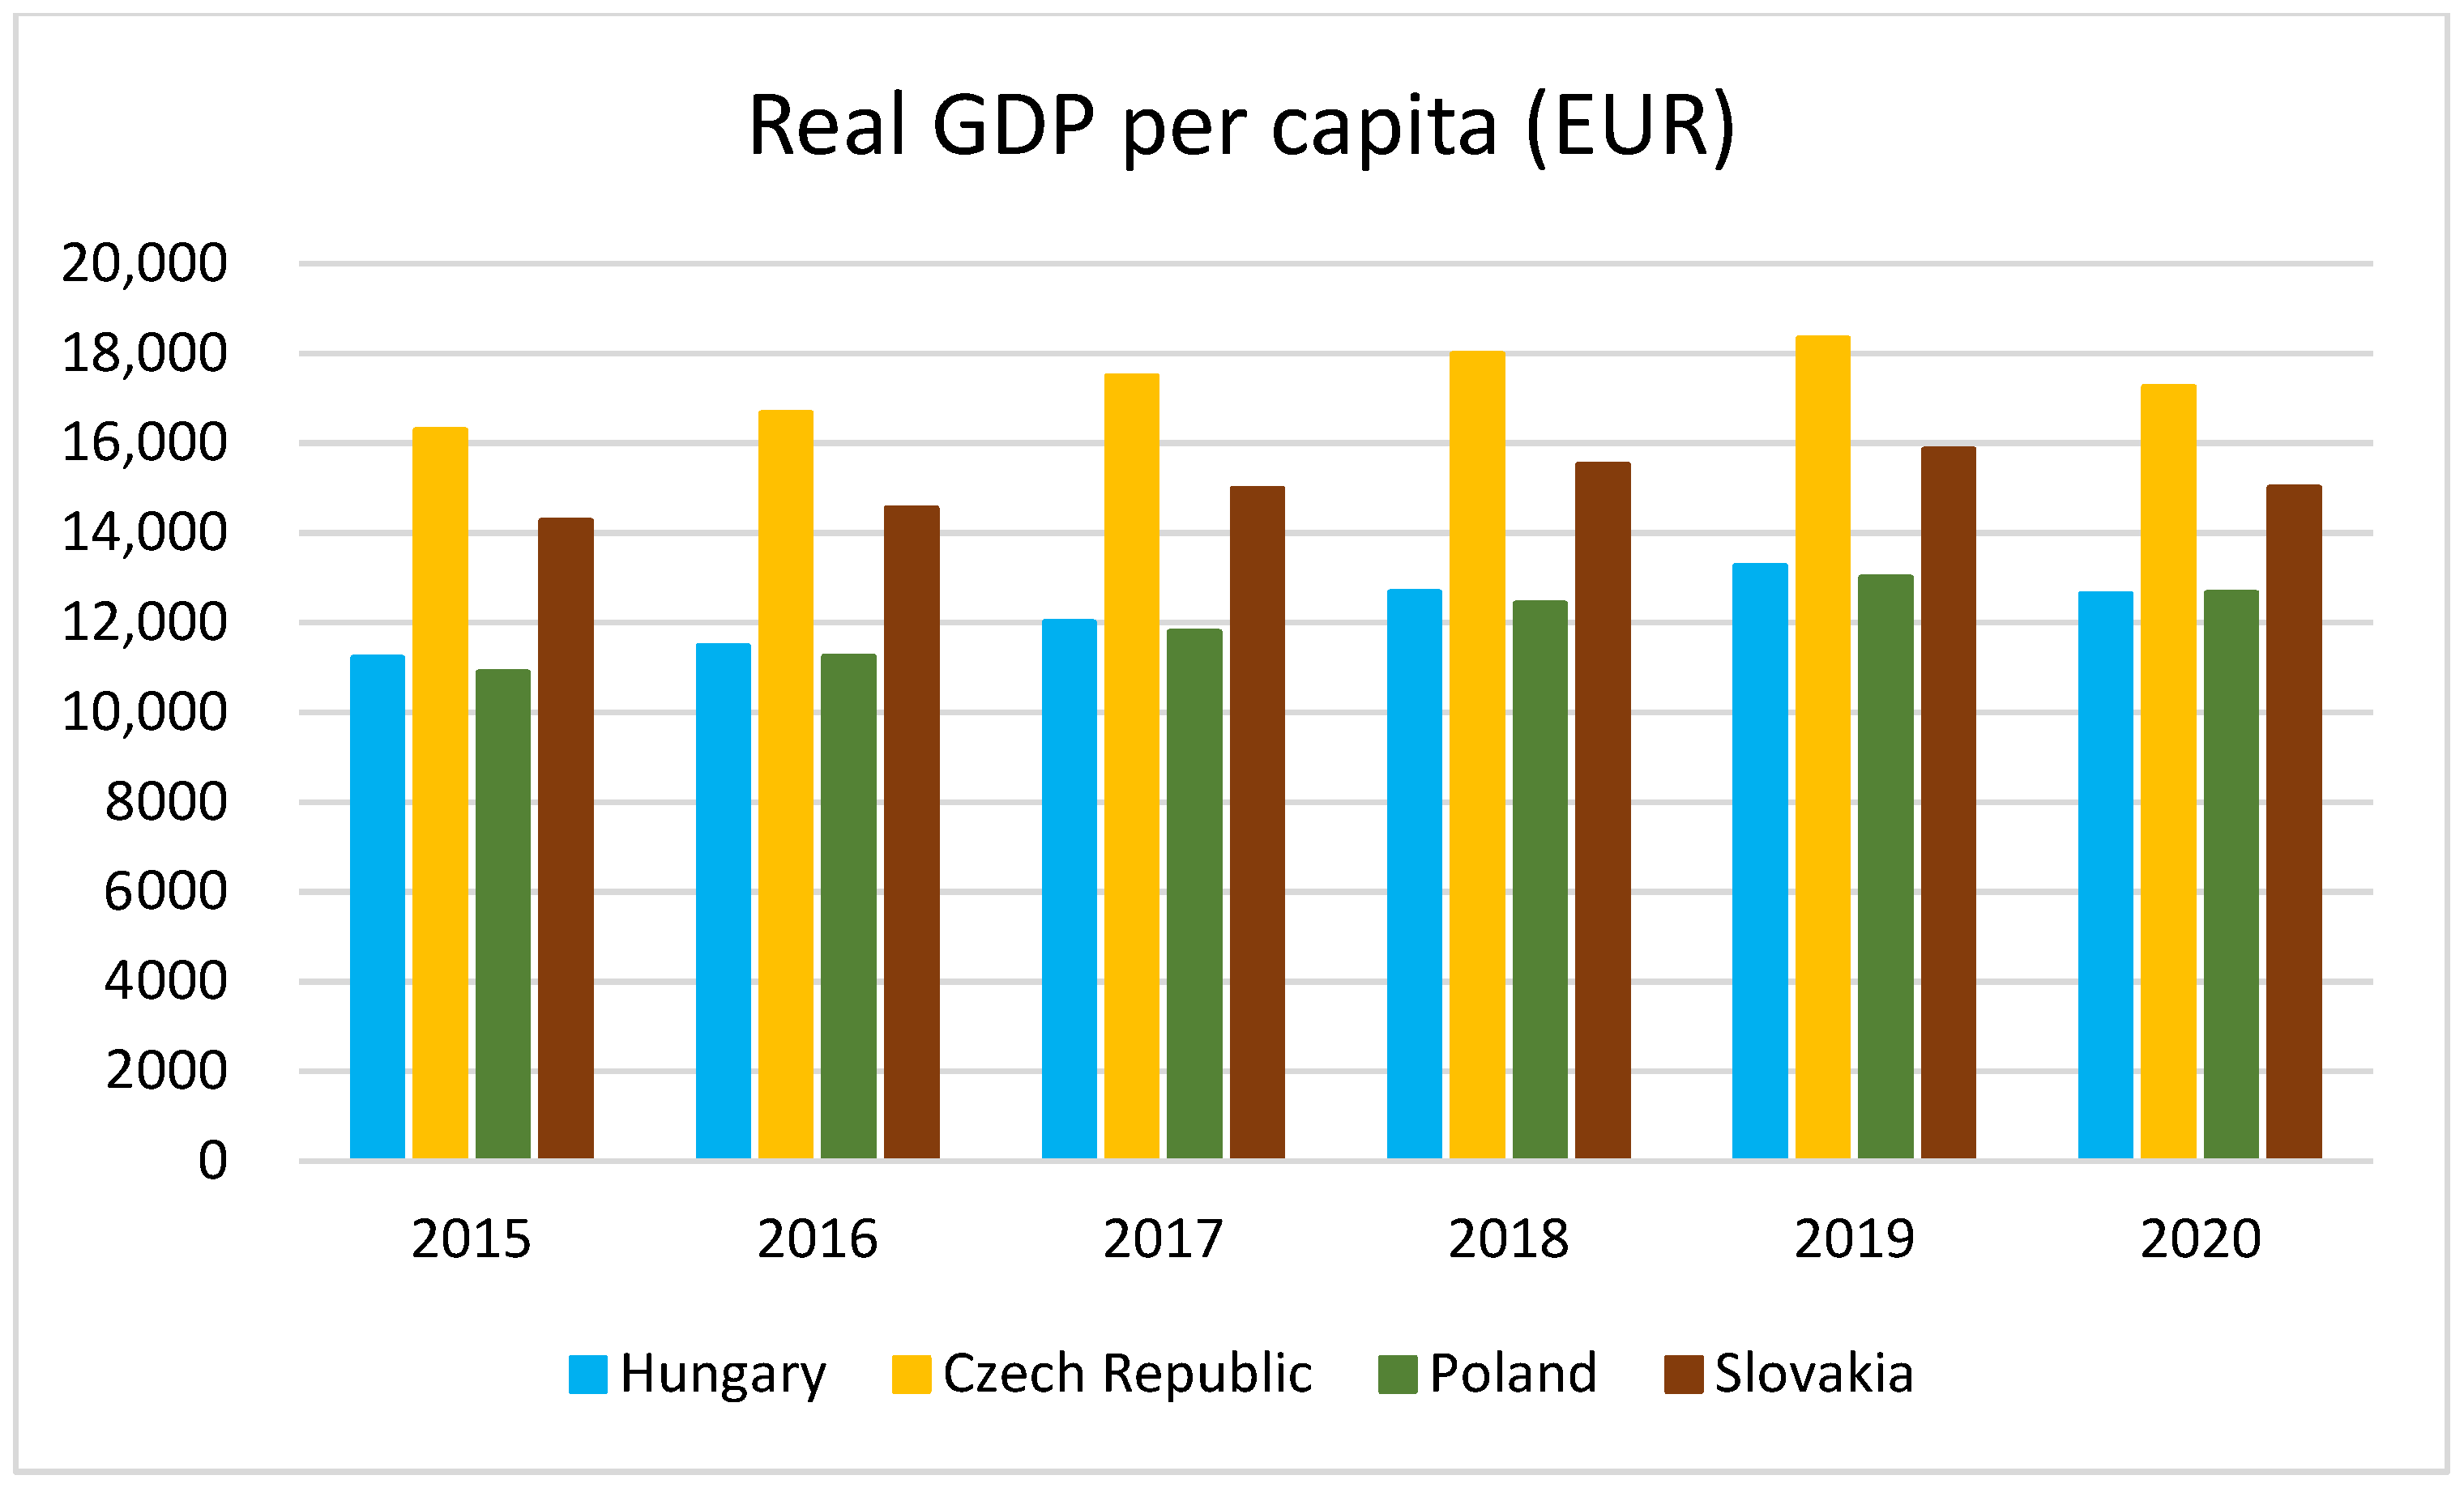
On the other hand, the values of Hungary also increased between 2015–2019. It declined in 2020 for the first time. Figure 2 illustrates the real GDP per capita from 2015 to 2020; the data for the figure was provided by the Eurostat database [45]. This is where the differences between the member states are the most significant. Between 2015 and 2019, the Czech Republic is an outstanding leader among the member states. Slovakia is in second place during the period under review. Hungary is in third place on the podium during this period, although the position is quite close to Poland. In 2020, the Czech Republic was also first, and Slovakia second, but Poland overtook Hungary probably due to the pandemic situation. The EU average real GDP per capita is €27,970 in 2019, while in 2020, was €26,220. V4 member states are significantly below the EU average. The comparison shows an increase in the value of real GDP per capita in the Visegrad countries until 2019, followed by a drastic decrease in 2020. The decline in GDP caused by the COVID-19 pandemic will also have a major impact on achieving the objectives of the SDG, in particular:
- SDG1: no poverty.
- SDG2: zero hunger.
- SDG3: good health and well-being.
- SDG4: quality education.
- SDG8: decent work and economic growth.
- SDG13: climate action.
As indicated at the beginning of our article, to examine the relationship between sustainability and digital transformation, it is not enough to map only digital transformation and economic aspects, but social and environmental aspects must also be considered when examining the member states.
An important factor in examining social aspects is the standard of living in each member state. One of the best indicators for measuring social development and living standards is the HDI index. This revised index was created not only to look at the development of countries from an economic perspective but also to take social development into account. This requires prioritizing people and their abilities. The use of the HDI index is becoming more widespread in the member states of the European Union. Based on the description of the Eurostat, we can say index values can be between 0–1. The key dimensions of HDI are long and healthy life, being knowledgeable, and a decent standard of living. HDI is obtained as the geometric mean of these normalized indices.
The long and healthy life dimension is measured by life expectancy at birth, the educational dimension by the average school years of adults aged 25 and over, and the expected school years of children of entry age. In the standard of living dimension, we measure gross national income per capita [46].
Table 1 shows us the HDI values and changes in the V4 member countries between 2010 and 2019. The HDI of the countries studied increased steadily during this period, so we can say that they developed economically and socially. The selected countries are ranked based on the HDI index. Based on 2019 data, the Czech Republic is first, Poland the second, Slovakia the third, and Hungary is the fourth V4 ranking of member states. However, in terms of the ranking change between 2014–2019, only Hungary was in a better position in the 2019 ranking compared to the 2014 ranking. Between 2000 and 2010, the HDI of each member state increased more than in the period 2010–2019. SDG targets are related to global problems, thereby also seeking to alleviate social problems. The table shows one of the 17 targets: Sub-target 8: Decent work and economic growth, 8.5: to achieve full decent employment for all women and men by 2030, including young people and people with disabilities, and that there may not be a pay gap for the same job; and the associated 2019 GNI per capita data in PPP $. Unfortunately, the COVID-19 pandemic could worsen the effectiveness of achieving goals, causing more than 100 million people to lose their jobs and drift into extreme poverty.
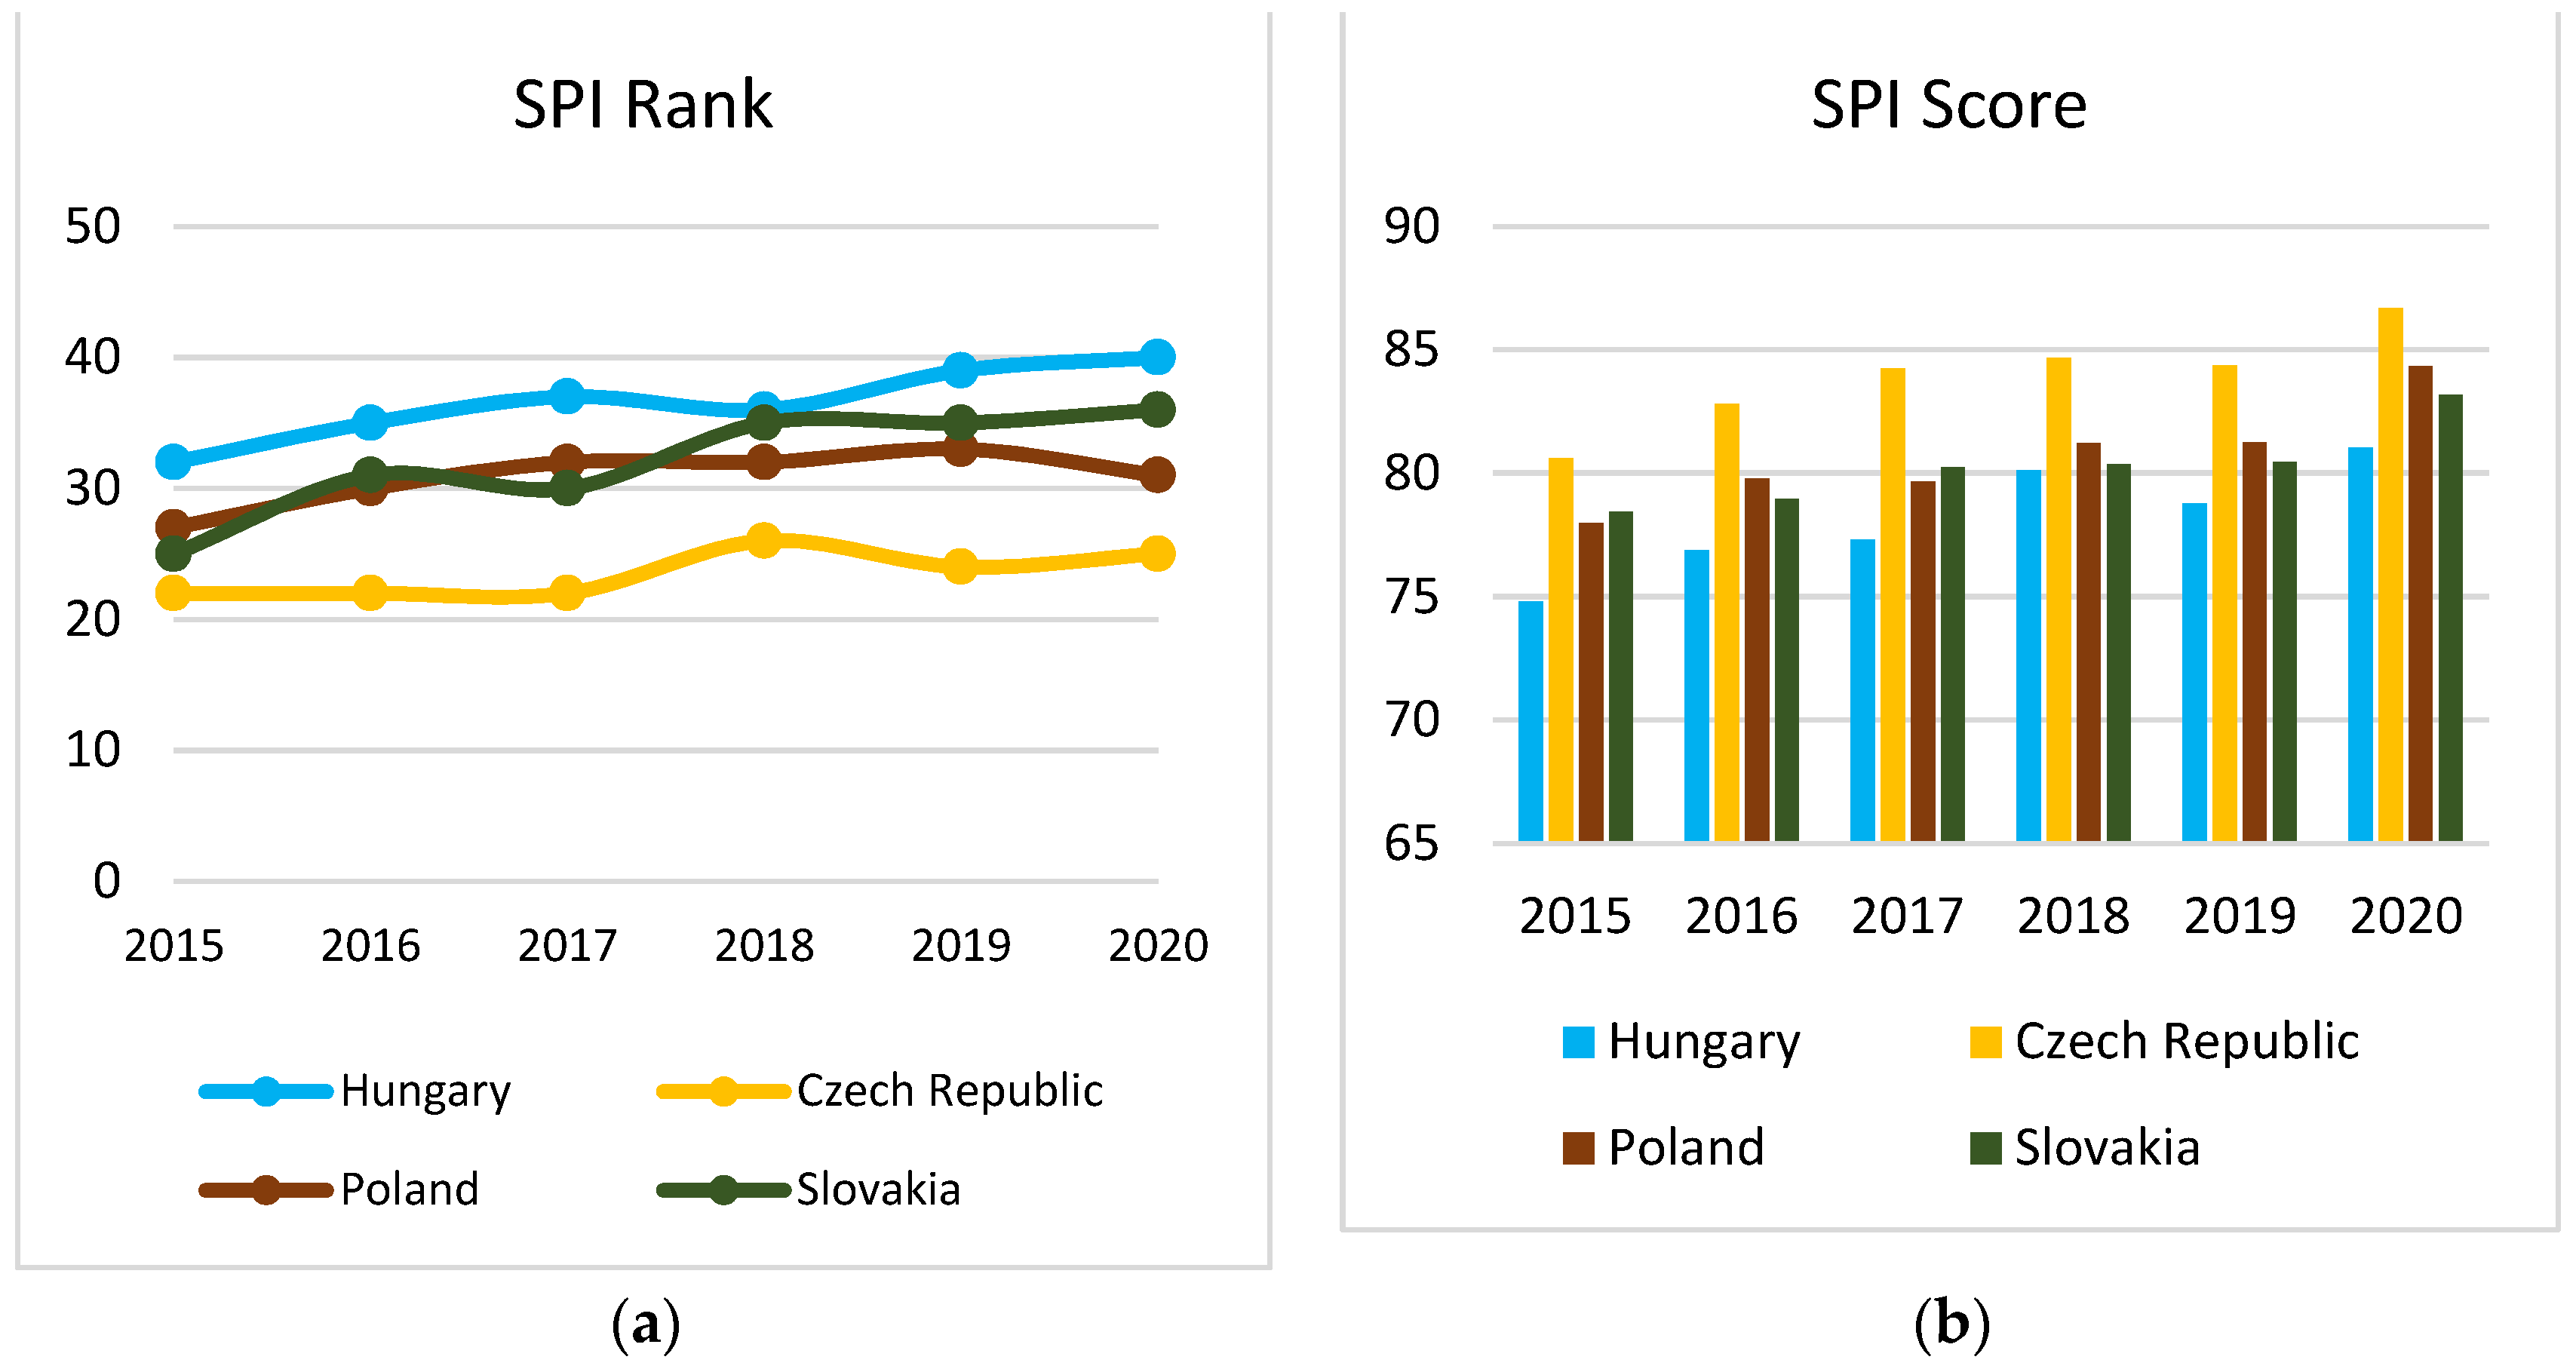
Another important social index is the SPI. The SPI also goes beyond GDP, taking social and environmental considerations into account. This index consists of three key dimensions: basic human needs, foundations of well-being, and opportunity for personal development. This indicator does not take the increase in economic performance into account, so it allows us to measure social and environmental development entirely. Of course, social development is strongly related to economic development, but their relationship cannot be considered linear [40,47].
In our research, we examined the SPI score in the V4 countries and their SPI ranking between 2015 and 2020, as shown in Figure 3a,b. The SPI data for the figures was provided by the Eurostat database [48]. Of the V4 countries, the Czech Republic is the first in this ranking continuously between 2015 and 2020, while Hungary is the fourth in this interval. Hungary approached Poland in 2018, but by 2020, the differences between the member states have widened again [48].
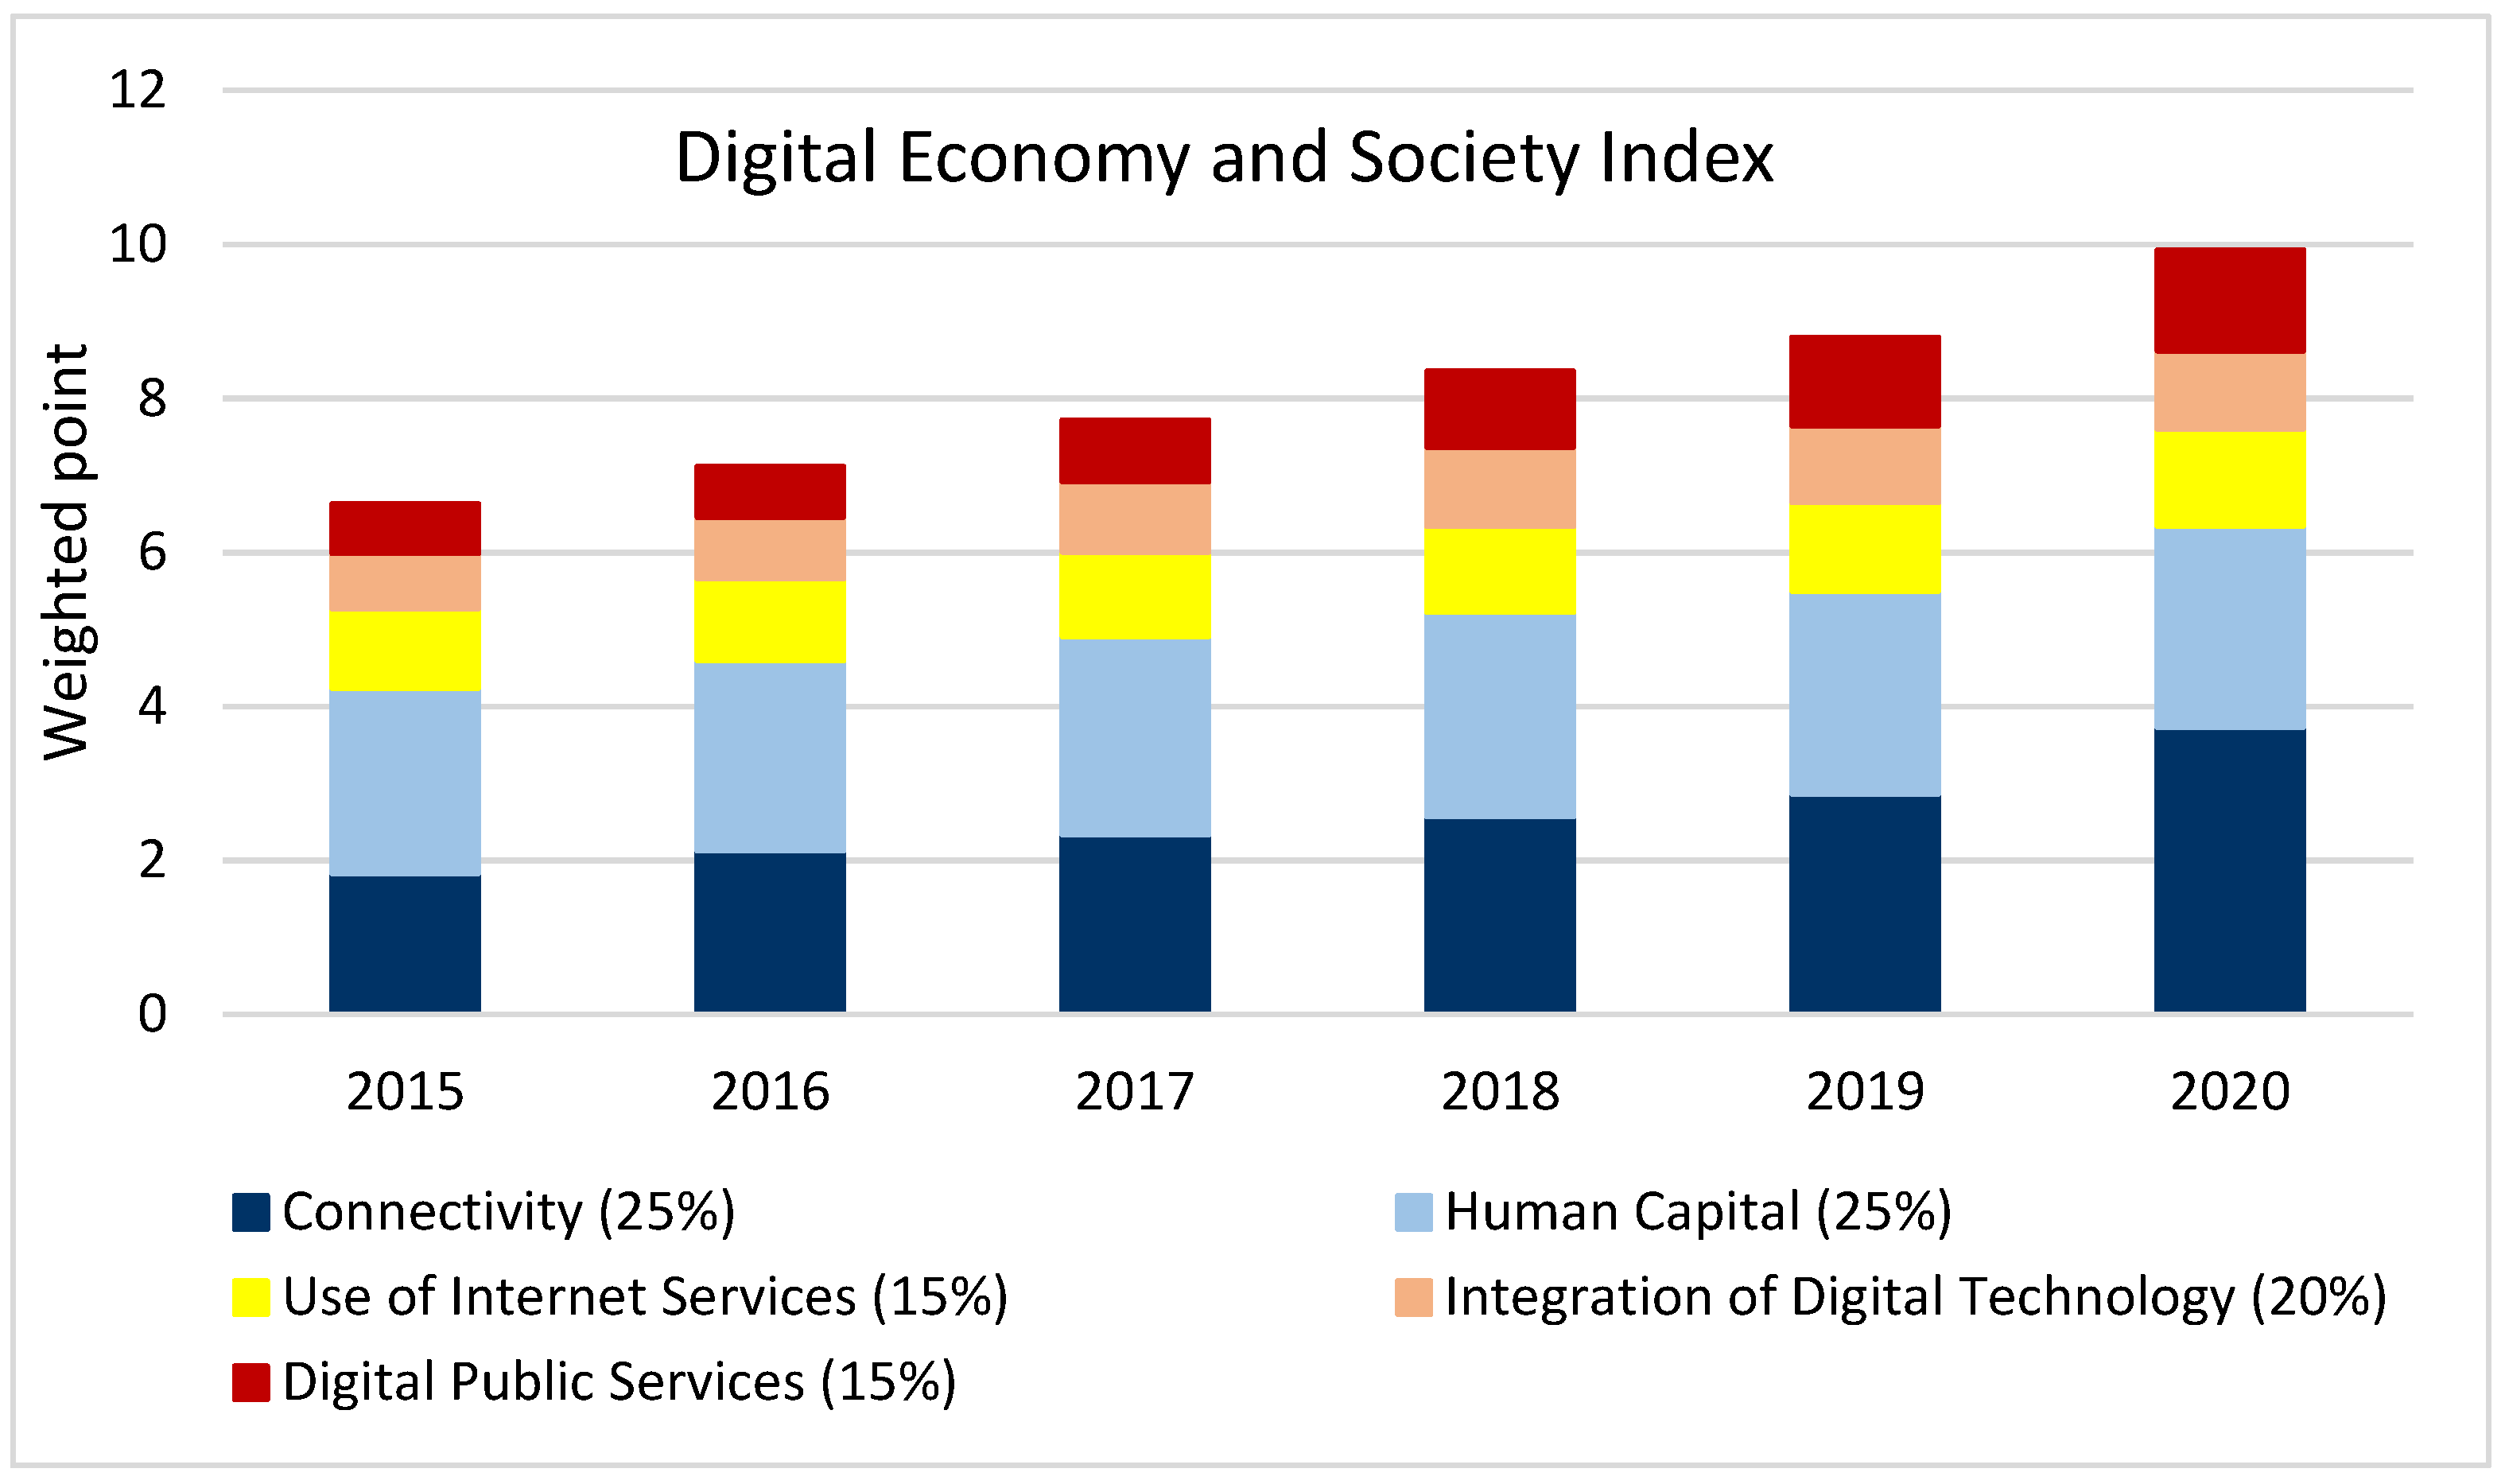
One of the most important indicators for measuring digitalization is the DESI. This index is an overall index calculated as a weighted average of the five main DESI dimensions:
- Connectivity (25%),
- Human capital (25%),
- Internet use (15%),
- Integration of digital technology (20%),
- Digital public services (15%).
Countries receive a score between 0 and 100. The index has been used since 2015.
Projected for Hungary, we examined the main dimensions of DESI between 2015 and 2020, and the changes that took place during this period are shown in Figure 4; the DESI data for the chart was provided by the European Commission database [35]. Each dimension is given a different weight in the overall DESI index, which is why we also weighted the values of the dimensions of each year and plotted it on this basis of the DESI. Its value has increased every year, but the biggest change is seen in 2020. The individual dimensions and the overall DESI index increased this year, due to the COVID-19 pandemic. Much of the education has shifted to digital platforms that have never been seen before, which is why ISPs (Internet Service Providers) also have a huge responsibility. Coverage in the country had to be increased, and those who had been better forced so far had to learn online as well. The older age group could not meet their grandchildren, so using the internet became of paramount importance. Due to the curbing of the pandemic, the population was mostly unable to conduct their official affairs in person, which is why the state had to develop the digital public service, which will lay the foundation for one of the biggest developments in 2020. It is likely that even after the pandemic, more people will use the digital public service because they have realized how much easier and faster, they can handle their affairs. Overall, there has been significant growth in the country’s digital potential in 2020.
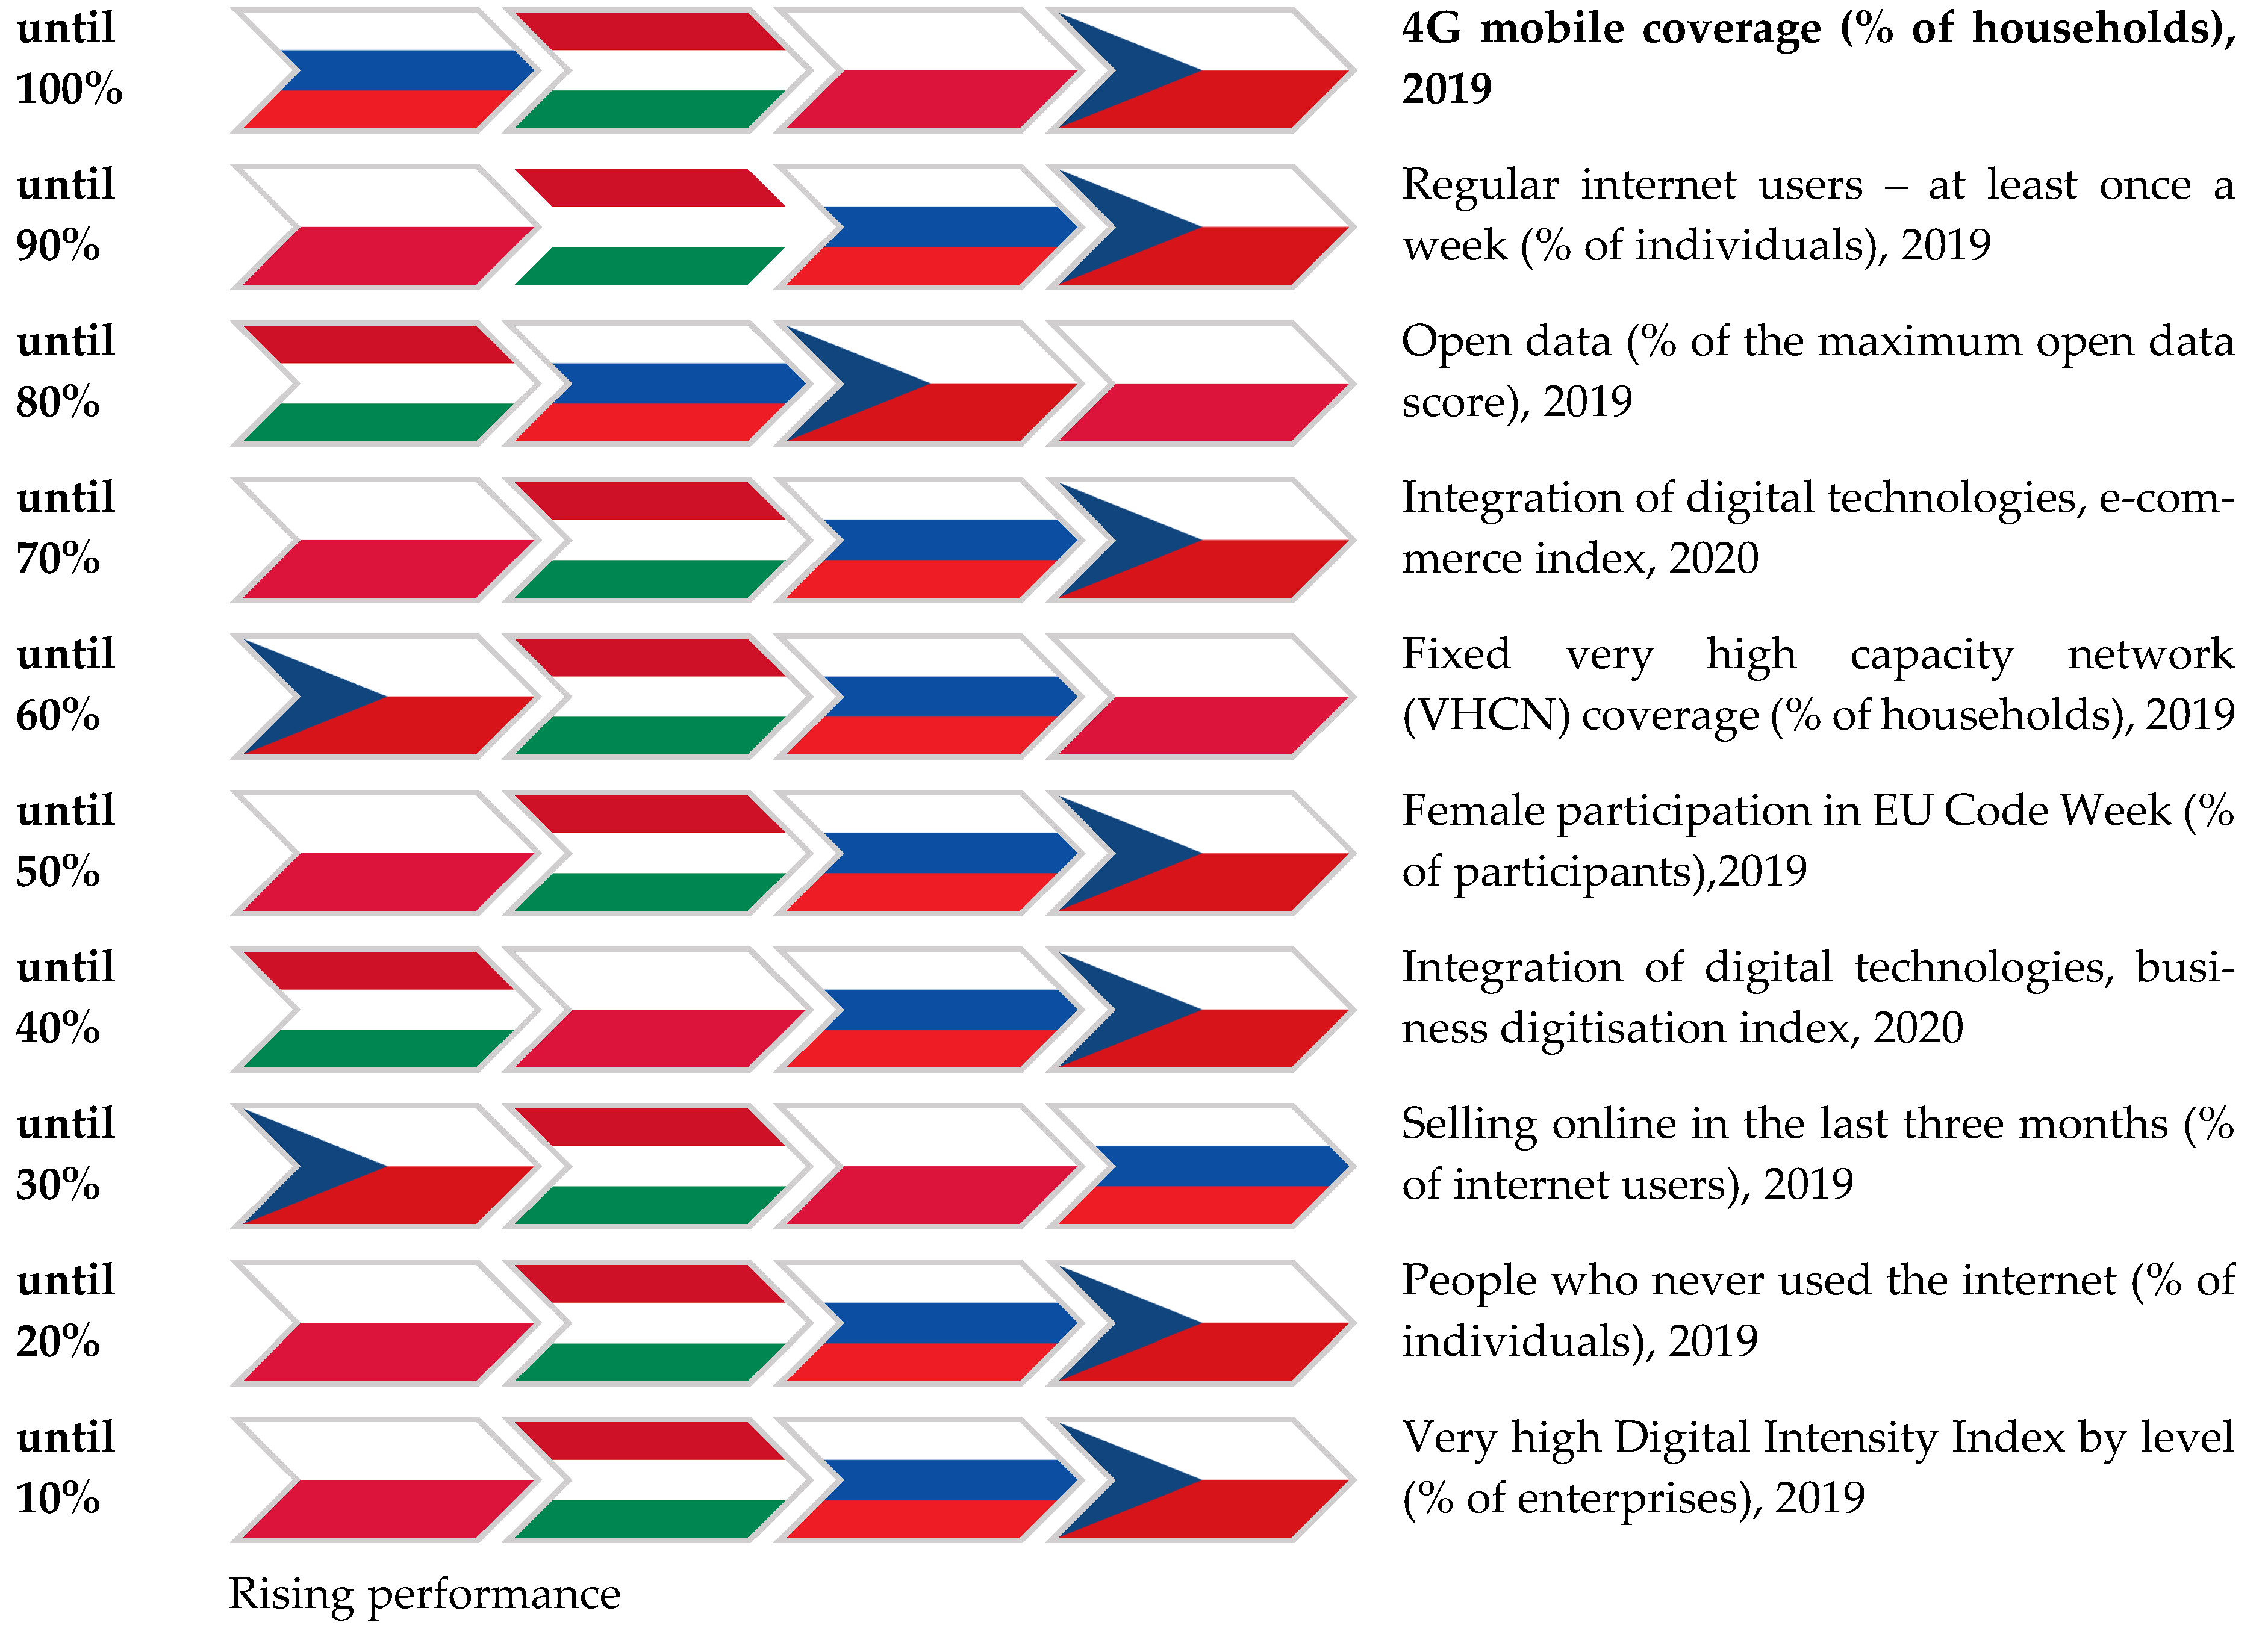
From the elements of the DESI indicator, we selected 10 indicators that belong to different dimensions of DESI, i.e., to the main dimensions mentioned above: Connectivity, Human Capital, Internet of Use, Digital Technology, and Digital Public Services. Using the Eurostat database, we calculated how many points the countries received based on the selected indicators. We ranked the V4 countries according to each indicator. Figure 5 shows the ranking thus obtained; the data for the chart was provided by the European Commission database [35].
In Figure 5, the flags mark the member countries and their performance increases from left to right. On a percentage scale, 100% is the maximum that each country can achieve. We can see the percentages on the left side. The percentages are shown on the left, which shows the percentage of the selected subdimension on the right in those countries. Its values are between 0 and the given percentage. Take, for example, the first indicator, the 2019 4G mobile coverage data of households. All V4 member states have reached higher values in this sub-dimension, so it is between 0 and 100%. The flags indicate the V4 position, so the Czech Republic is in the first place, followed by Poland, then Hungary and finally, Slovakia in the coverage scale of mobile 4G households. While regular internet users (those who use the internet at least once a week) are between 0–90% in the V4 member states according to 2019 data, Poland is the last according to this indicator, as it does not even reach 80%, while the Czech Republic is in the first place at already close to 90%. Among the selected indicators, the percentage of companies is at the bottom of the scale according to the very high Digital Intensity Index by level. This means that the majority of companies (more than 90%) in the member states do not achieve the very high digital intensity index.
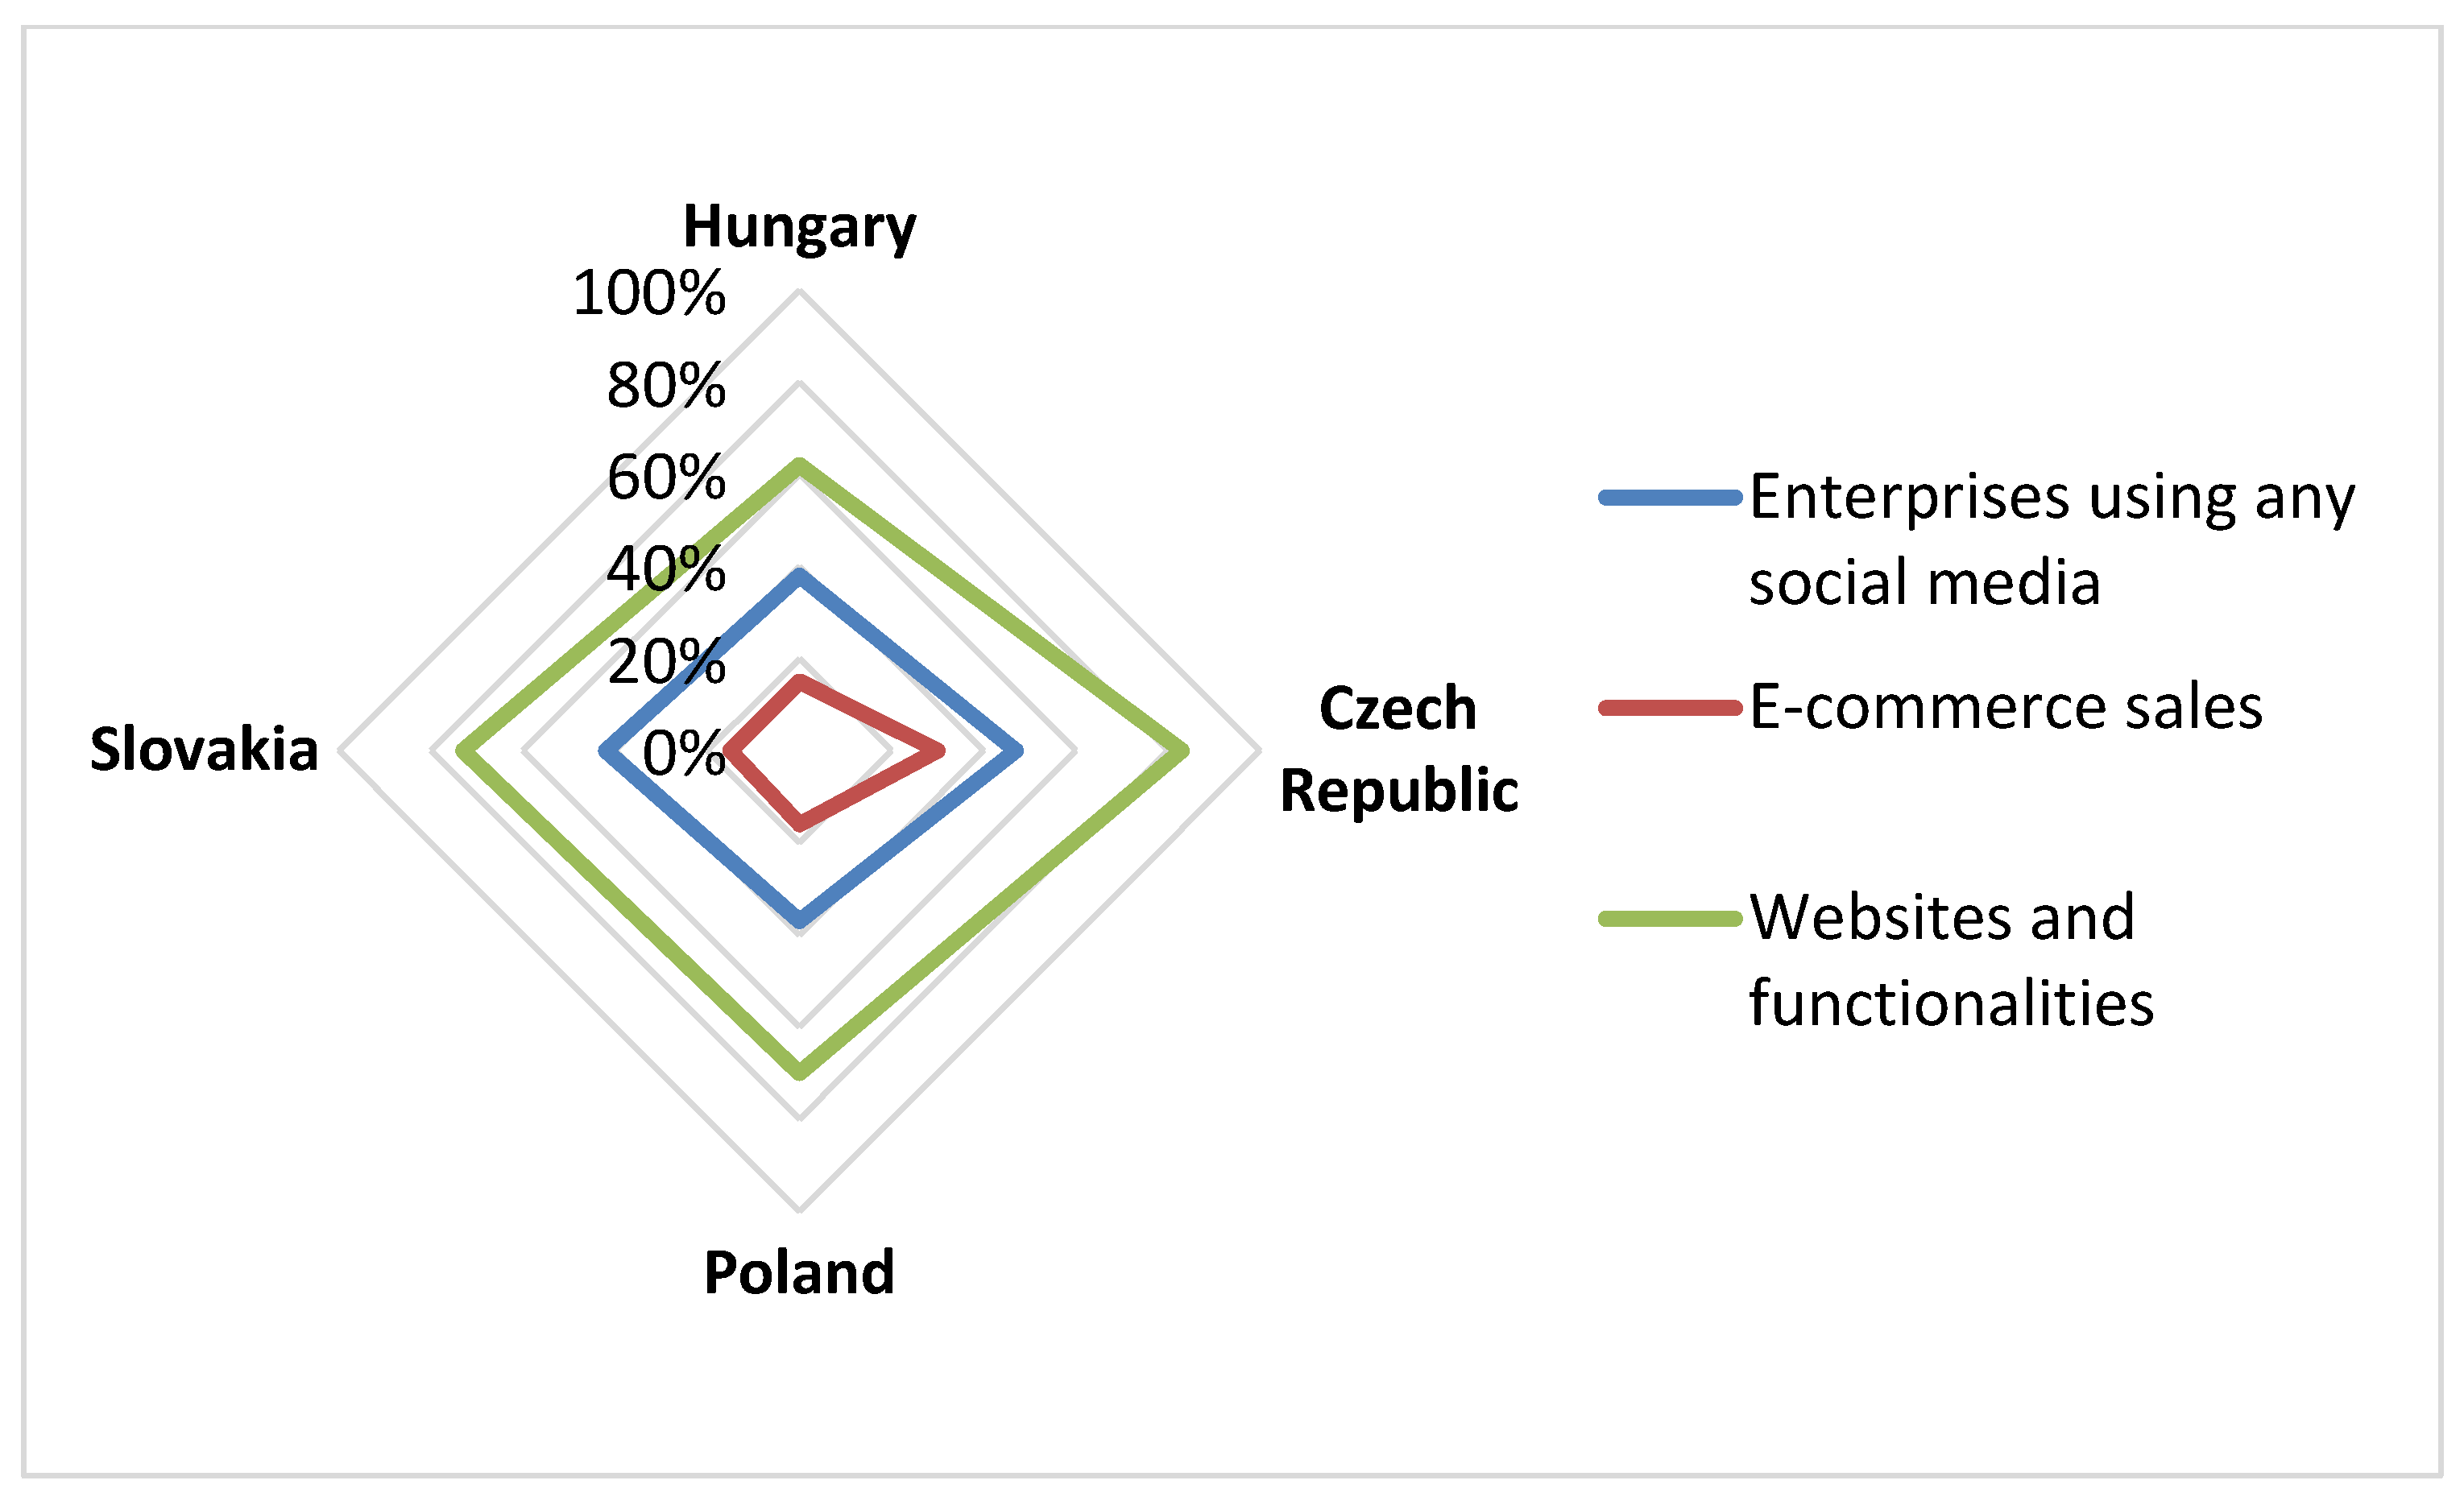
In our research, we examined companies of the V4 countries in terms of ICT usage and e-commerce (Figure 6); the data for the chart was provided by the European Commission database [35]. We examined enterprises in the four countries from three perspectives:
- Usage of social media,
- E-commerce sales,
- Websites and functionalities.
In all areas, the Czech Republic has had outstanding achievements; 83% of companies in the Czech Republic have a website, 47% of the company uses some form of social media, and 30% of them sell through e-commerce. Slovakia ranks second in terms of the percentage of companies in the selected perspectives. Overall, based on these criteria, Poland is third and Hungary is fourth in 2019. Most companies have websites, but few sell through the web. The use of social media by enterprises in neither country is very strong.
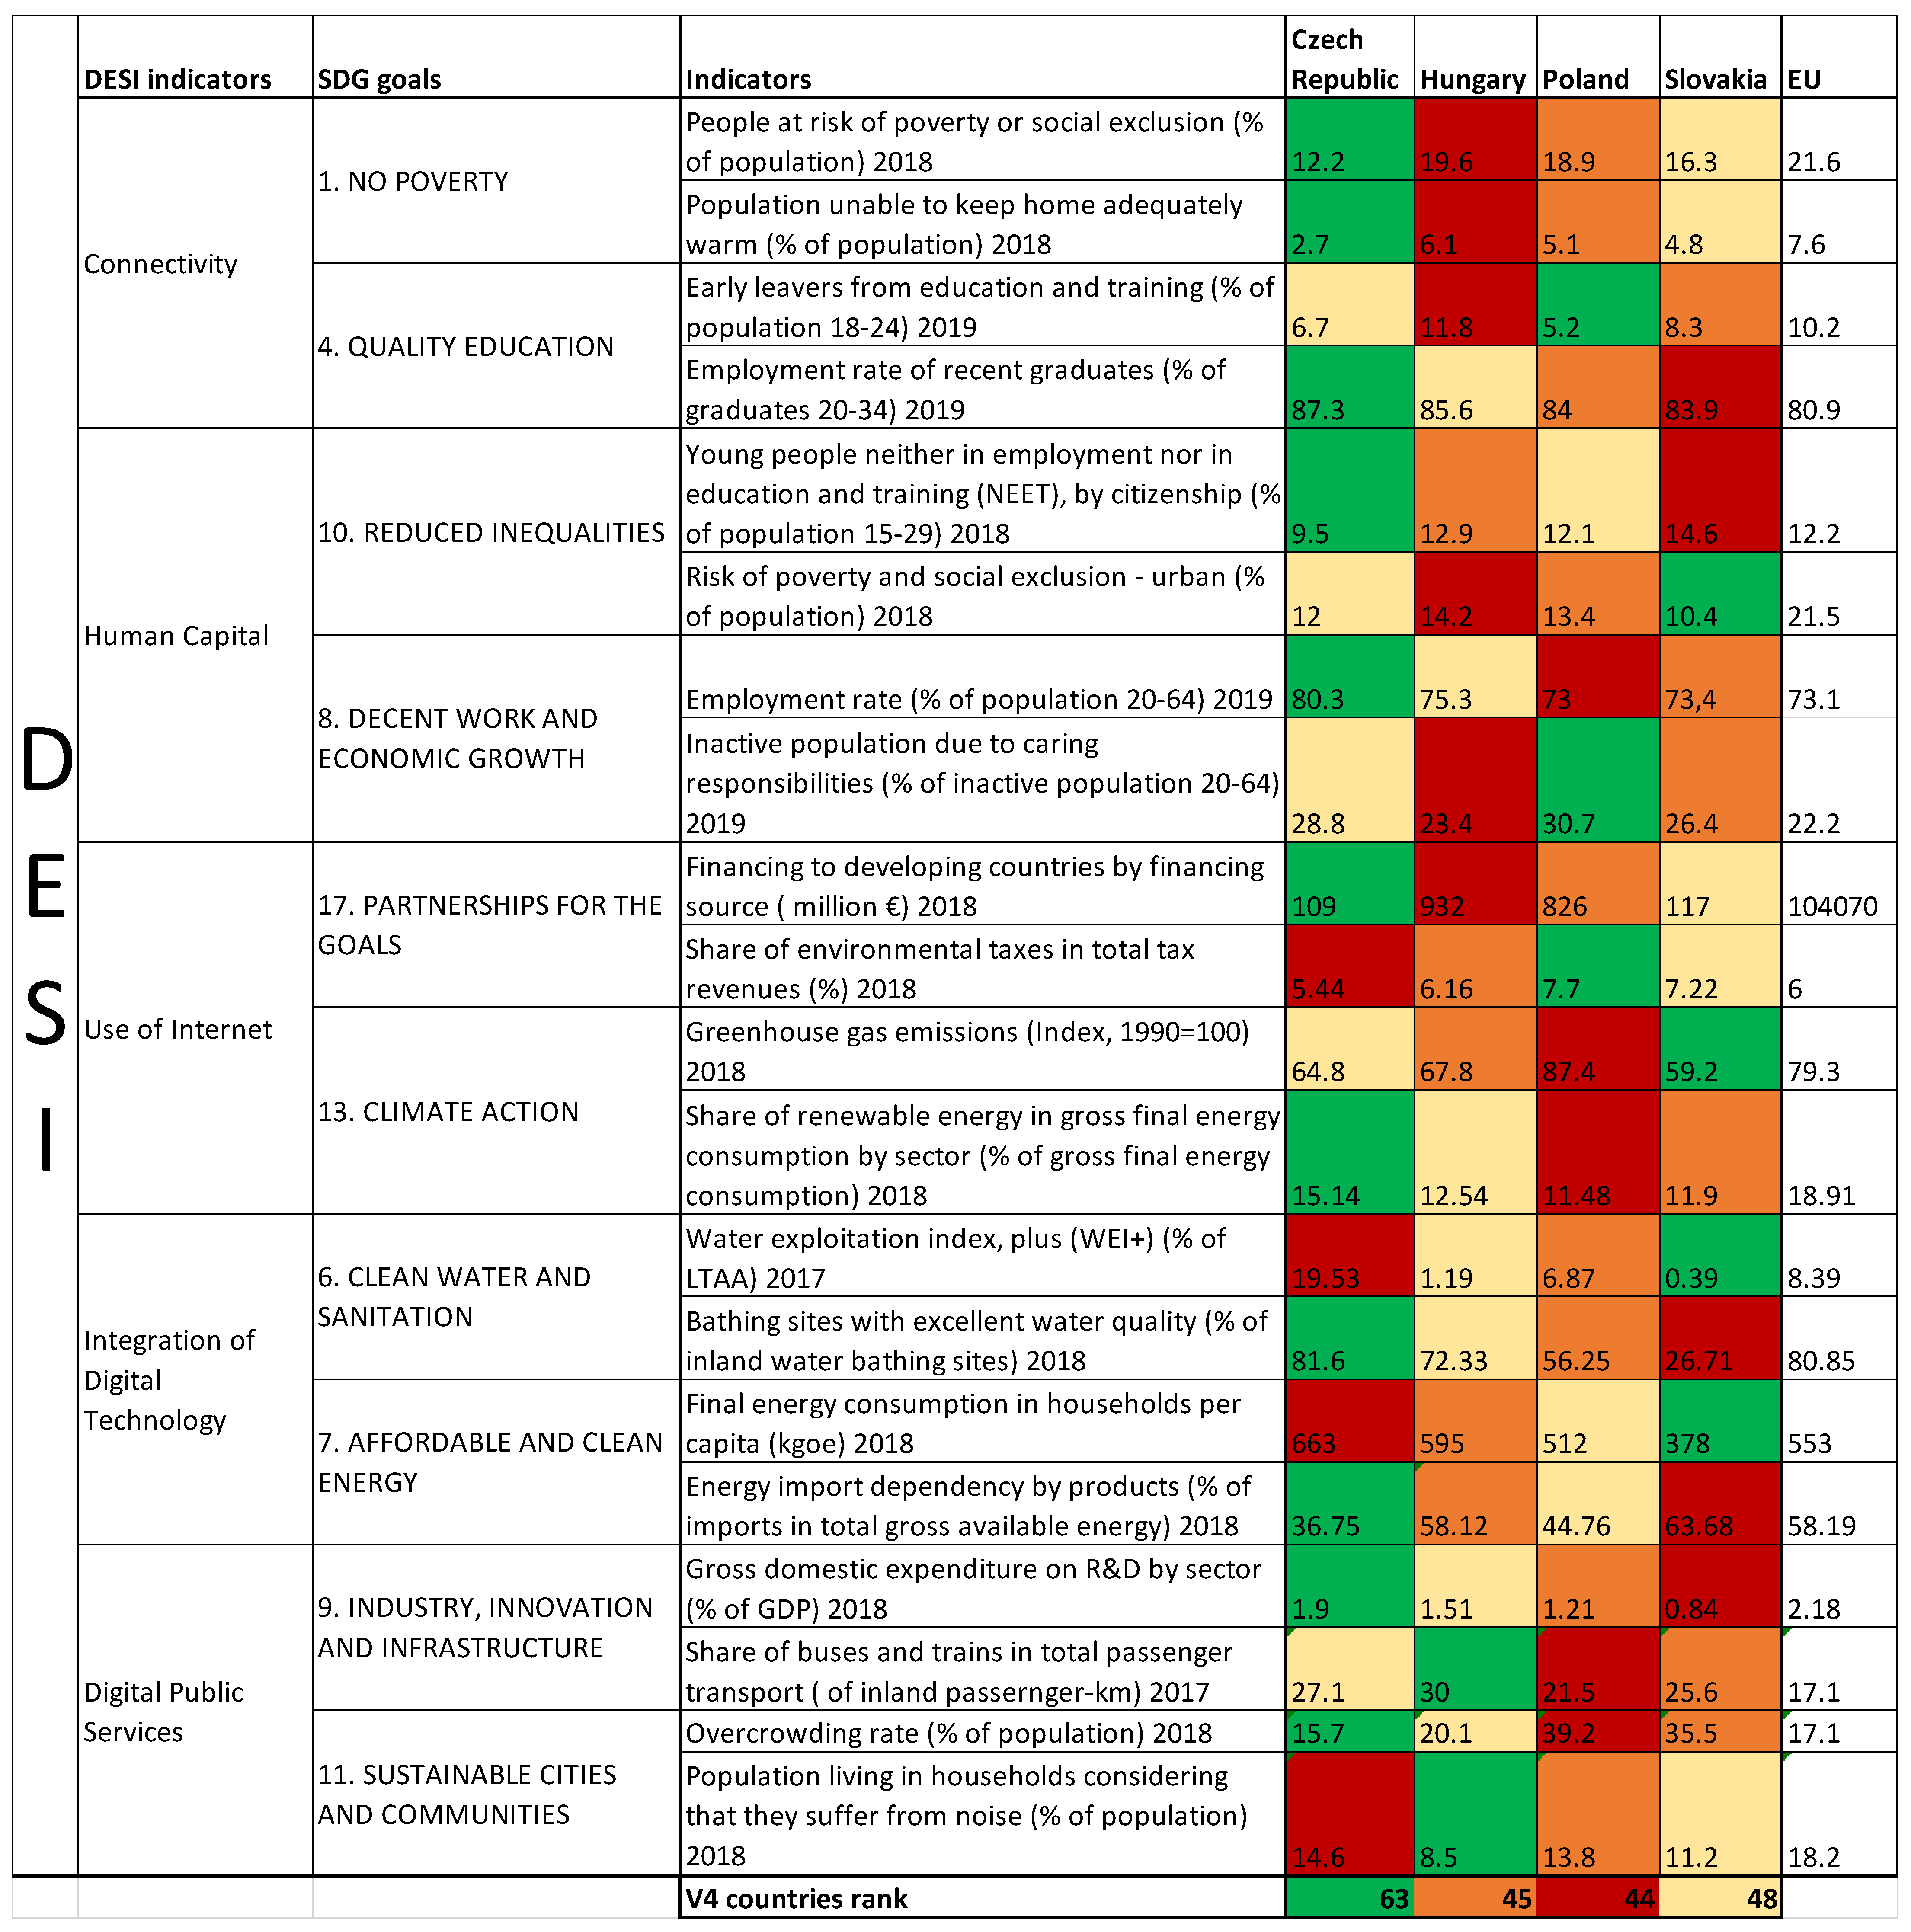
A limited number of literature deals with the examination of the relationship between sustainability and digital transformation, although this is an important area to explore, as nowadays, everything revolves around digitalization and the issue of sustainability is unavoidable, therefore, the transition in case of both examined terms is in progress. For this reason, we have tried to highlight and grasp this interrelation in the frame of recent research. To do this, we looked at the above-mentioned DESI dimensions, and based on the literature and digitization indicators, we selected the SDG targets that best fit the given dimension. For each dimension, 2-2 sustainability goals are indicated in Figure 7. The data for the chart was provided by the European Commission database [35]. In terms of indicators selected based on the SDG goals, we looked at the V4 member states and also included the EU average data. The rankings per indicator are marked with different colors. Green is the absolute first for a given indicator, while red is the last of the member states. Yellow is second and orange is third. The ranking varies by indicator. At the bottom of the figure are the overall rankings of the V4 countries. For this, the first place per indicator was 4 points, the second place 3 points, the third place 2 points, and the fourth place 1 point; these were added together, so the Czech Republic is first in terms of total points, second is Slovakia, third is Hungary, and fourth is Poland. Compared to the EU average, the V4 countries need to improve in terms of some indicators. Examples include early leavers from education and training between the ages of 18 and 24. In this respect, Hungary exceeds the EU average. Young people neither in employment nor in education and training (NEET) between the ages of 15 and 29, Hungary and Slovakia also lag behind the EU average. Among the employment rate of 20–64-year-olds, Poland lags behind the EU average, while according to the indicator share of environmental taxes in total tax revenues the Czech Republic does not reach the EU average.
4. Discussion
First of all, this paper looks at the economic aspects, where we also present the effects caused by the current pandemic. By 2019, GDP has grown in all four member states, but in 2020 there was a radical decline. GDP per capita in euros has been the highest in the Czech Republic since 2015, followed by Slovakia, followed by Hungary and Poland. GDP is highly correlated with SDG targets in the literature and in this research too, therefore, it is also an indispensable indicator for sustainability. The decline in GDP caused by the pandemic also affects several SDG targets, such as no poverty, zero hunger, good health and well-being, quality education, decent work and economic growth, and climate action. One of the main hypotheses is that the extent of digitization depends on GDP which has been confirmed in the research.
From the point of view of sustainability and digitalization, it is not good to map the economic situation only by using GDP, it is also necessary to get to know the social processes of the given country. The article also presents the HDI and SPI indicators as important social indicators. In terms of HDI, too, the Czech Republic is outstanding among the four member states, while Hungary is the fourth in this ranking. However, it is also important to highlight that in the period between 2014 and 2019, only Hungary improved its overall HDI ranking. Between 2000 and 2010, a larger increase in HDI results is observed in countries than in the period 2010–2019. The HDI indicator influences the 8th SDG target, Decent Work and Economic Growth. In 2020, more than 100 million people have lost their jobs as a result of the pandemic, increasing their risk of poverty for those living in extreme poverty. The SPI indicator, which already includes environmental development, ranks the Czech Republic first, second Slovakia, third Poland, and fourth Hungary. Based on the results of the research, it can be stated that social aspects influence the extent of digitization and are closely linked to the goal of sustainability. Analysis of HDI data also resulted in a similar ranking for the ranking of digital and sustainability performance.
The change of DESI is presented by this article between 2015 and 2020, broken down by each major dimension, and weighting them. It can be stated that the index increased every year, but the biggest change took place in 2020, probably due to the COVID-19 pandemic. The biggest change was in the connectivity dimension, where it grew the most. This is followed by digital public services, where a dynamic development can be seen in 2020 as well. This paper presents different methods in terms of digital transformation. Based on each selected indicator, we established a ranking based on digital performance among the V4 member states, categorized according to the SDG targets, and compared the results of the countries with the EU average values, thus highlighting the strengths and areas for improvement.
Overall, year by year, the digital potential of countries has increased, with particularly strong developments in 2020 due to the COVID-19 pandemic. The selected member states performed better than the EU average based on most of the indicators examined. Among the selected indicators are those in which the examined member states lagged behind the EU average. Examples include early leavers from education and training between the ages of 18 and 24. In this respect, Hungary exceeds the EU average. Young people neither in employment nor in education and training between the ages of 15 and 29, Hungary and Slovakia also lag behind the EU average. Among the employment rate of 20–64-year-olds, Poland lags behind the EU average, while according to the indicator share of environmental taxes in total tax revenues the Czech Republic does not reach the EU average. Each member state has developed a lot since 2015, but for the time being, these countries are a moderate innovator in the EU [49,50,51,52]. In the future, it is worthwhile to further examine and observe these indicators with the degree and tendency of development.
5. Conclusions
In our research, we found that there is little literature that examines digitalization and sustainability together. Recognizing this shortcoming, we prepared our article. Our main hypothesis, that there is a strong relationship between sustainability and digitalization transformation, is also supported by the results of our research.
The article examines V4 member countries in terms of digital transformation and sustainability considerations. The COVID pandemic is of great importance for digitization and sustainability. The results of the research clearly reflect its impact.
One of the best indicators of digital transformation is the DESI composite index which we examined in several ways in the article. The main analysis was the relationship between sustainability goals and digitization performance. Based on these, it can be said that several correlations can be observed between digital transformation and sustainability goals. One of the biggest added values of the article is the selected area in addition to the joint examination of digitization and sustainability. Most publications focus on Western countries, but this article examines a smaller, more disadvantaged area. The results of the research highlight the rankings between the V4 countries, thus highlighting the strengths and presumed shortcomings of the countries. Overall, the selected member states performed better than the EU average based on most of the indicators examined. Therefore, the results of this research lead to the possibilities of further research.
Author Contributions
Conceptualization, M.S.C. and B.N.; methodology, D.E. and M.S.C.; validation, M.S.C., B.N., and D.E.; formal analysis, D.E. and M.S.C.; investigation, D.E. and M.S.C.; resources, M.S.C., B.N., and D.E.; data curation, D.E.; writing—original draft preparation, D.E. and M.S.C.; writing—review and editing, M.S.C.; visualization, D.E.; supervision, B.N.; project administration, D.E.; funding acquisition, B.N. All authors have read and agreed to the published version of the manuscript.
Funding
This research received no external funding.
Institutional Review Board Statement
Not applicable.
Informed Consent Statement
Not applicable.
Data Availability Statement
Acknowledgments
This paper was supported by the János Bolyai Research Scholarship of the Hungarian Academy of Sciences and supported by the ÚNKP-20-5 new national excellence program of the Ministry for Innovation and Technology from the source of the national research, development and innovation fund. The research reported in this paper and carried out at the Budapest University of Technology and Economics has been supported by the National Research Development and Innovation Fund (TKP2020 Institution Excellence Subprogram, grant number BME-IE-MISC) based on the charter of bolster issued by the National Research Development and Innovation Office under the auspices of the Ministry for Innovation and Technology.
Conflicts of Interest
The authors declare no conflict of interest.
References
- Ordieres-Meré, J.; Remón, T.P.; Rubio, J. Digitalization: An Opportunity for Contributing to Sustainability from Knowledge Creation. Sustainability 2020, 12, 1460. [Google Scholar] [CrossRef] [Green Version]
- Szalmáné Csete, M. Climate Change Impacts on Society and the Economy. In International Climate Protection; Palocz-Andresen, M., Szalay, D., Gosztom, A., Sípos, L., Taligás, T., Eds.; Springer International Publishing: Cham, Switerland, 2019; pp. 277–282. [Google Scholar]
- Trașcă, D.L.; Ștefan, G.M.; Sahlian, D.N.; Hoinaru, R.; Șerban-Oprescu, G.L. Digitalization and Business Activity. The Struggle to Catch Up in CEE Countries. Sustainability 2019, 11, 2204. [Google Scholar] [CrossRef] [Green Version]
- Meneghello, F.; Calore, M.; Zucchetto, D.; Polese, M.; Zanella, A. IoT: Internet of Threats? A Survey of Practical Security Vulnerabilities in Real IoT Devices. IEEE Internet Things J. 2019, 6, 8182–8201. [Google Scholar] [CrossRef]
- Rüßmann, M.; Lorenz, M.; Gerbert, P.; Waldner, M.; Engel, P.; Harnisch, M.; Justus, J. Industry 4.0: The Future of Productivity and Growth in Manufacturing Industries. 2015. Available online: https://www.bcg.com/publications/2015/engineered_products_project_business_industry_4_future_productivity_growth_manufacturing_industries (accessed on 30 January 2021).
- SCOOP.eu. Digital Transformation Strategy: The Bridges to Build. 2021. Available online: https://www.i-scoop.eu/digital-transformation/digital-transformation-strategy/ (accessed on 15 March 2021).
- Matthess, M.; Kunkel, S. Structural change and digitalization in developing countries: Conceptually linking the two transformations. Technol. Soc. 2020, 63, 101428. [Google Scholar] [CrossRef]
- OECD. Business Dynamics and Digitalisation; Policy Paper No. 62; OECD: Paris, France, 2019. [Google Scholar]
- Papageorgiou, K.; Singh, P.K.; Papageorgiou, E.; Chudasama, H.; Bochtis, D.; Stamoulis, G. Fuzzy Cognitive Map-Based Sustainable Socio-Economic Development Planning for Rural Communities. Sustainability 2019, 12, 305. [Google Scholar] [CrossRef] [Green Version]
- Kolk, A.; Ciulli, F. The potential of sustainability-oriented digital platform multinationals: A comment on the transitions research agenda. Environ. Innov. Soc. Transit. 2020, 34, 355–358. [Google Scholar] [CrossRef]
- Sipos, T.; Mekonnen, A.A.; Szabó, Z. Spatial Econometric Analysis of Road Traffic Crashes. Sustainability 2021, 13, 2492. [Google Scholar] [CrossRef]
- Pouri, M.J.; Hilty, L.M. The digital sharing economy: A confluence of technical and social sharing. Environ. Innov. Soc. Transit. 2021, 38, 127–139. [Google Scholar] [CrossRef]
- Schieferdecker, I.; Mattauch, W. ICT for Smart Cities: Innovative Solutions in the Public Space. In Computation for Humanity: Information Technology to Advance Society; Zander, J., Mosterman, P.J., Eds.; Taylor Francis Group LLC.: Boca Raton, FL, USA, 2014; p. 30. [Google Scholar]
- ElMassah, S.; Mohieldin, M. Digital transformation and localizing the Sustainable Development Goals (SDGs). Ecol. Econ. 2020, 169, 106490. [Google Scholar] [CrossRef]
- SCOOP.eu. Digital Transformation: Online Guide to Digital Business Transformation. 2021. Available online: https://www.i-scoop.eu/digital-transformation/ (accessed on 15 March 2021).
- Buzási, A.; Pálvölgyi, T.; Szalmáné Csete, M. Assessment of climate change performance of urban development projects—Case of Budapest, Hungary. Cities 2021, 114, 103215. [Google Scholar] [CrossRef]
- Salvia, M.; Reckien, D.; Pietrapertosa, F.; Eckersley, P.; Spyridaki, N.A.; Krook-Riekkola, A.; Olazabal, M.; Hurtado, S.D.G.; Simoes, S.G.; Geneletti, D.; et al. Will climate mitigation ambitions lead to carbon neutrality? An analysis of the local-level plans of 327 cities in the EU. Renew. Sustain. Energy Rev. 2021, 135, 110253. [Google Scholar] [CrossRef]
- Szalmáné Csete, M. IoT based mitigation and adaptation planning as a tool for sustainable urban development in Budapest. In Sustainability in Transforming Societies: Proceedings of the 26th Annual Conference of the International Sustainable Development Research Society; Zilahy, G., Ed.; Budapesti Műszaki és Gazdaságtudományi Egyetem, Gazdaságés Társadalomtudományi Kar: Budapest, Hungary, 2020; p. 151. [Google Scholar]
- Nagy, Z.; Szendi, D.; Szép, T. Linking smart city concepts to urban resilience. Theory Methodol. Pr. 2021, 17, 31–40. [Google Scholar] [CrossRef]
- European Commission. Communication from the Commission to the European Parliament, the Council, the European Economic and Social Committee and the Committee of the Regions. 2021. Available online: https://ec.europa.eu/clima/sites/clima/files/adaptation/what/docs/eu_strategy_2021.pdf (accessed on 10 March 2021).
- Wallace, H.; Pollack, M.A.; Roederer-Rynning, C.; Young, A.R. Policymaking in the European Union, 8th ed.; Oxford University Press: Oxford, UK, 2020; p. 471. [Google Scholar]
- Beier, G.; Fritzsche, K.; Kunkel, S.; Matthess, M.; Niehoff, S.; Reißig, M.; van Zyl-Bulitta, V. Green Digitized Economy? Challenges and Opportunities for Sustainability; Institute for Advanced Sustainability Studies: Potsdam, Germany, 2020. [Google Scholar]
- Feroz, A.K.; Zo, H.; Chiravuri, A. Digital Transformation and Environmental Sustainability: A Review and Research Agenda. Sustainability 2021, 13, 1530. [Google Scholar] [CrossRef]
- Kamble, S.S.; Gunasekaran, A.; Gawankar, S.A. Sustainable Industry 4.0 framework: A systematic literature review identifying the current trends and future perspectives. Process Saf. Environ. Prot. 2018, 117, 408–425. [Google Scholar] [CrossRef]
- Kunkel, S.; Matthess, M. Digital transformation and environmental sustainability in industry: Putting expectations in Asian and African policies into perspective. Environ. Sci. Policy 2020, 112, 318–329. [Google Scholar] [CrossRef]
- De Sousa Jabbour, A.B.L.; Jabbour, C.J.C.; Godinho-Filho, M.; Roubaud, D. Industry 4.0 and the circular economy: A proposed research agenda and original roadmap for sustainable operations. Ann. Oper. Res. 2018, 270, 273–286. [Google Scholar] [CrossRef]
- Balogun, A.L.; Marks, D.; Sharma, R.; Shekhar, H.; Balmes, C.; Maheng, D.; Arshad, A.; Salehi, P. Assessing the Potentials of Digitalization as a Tool for Climate Change Adaptation and Sustainable Development in Urban Centres. Sustain. Cities Soc. 2020, 53, 101888. [Google Scholar] [CrossRef]
- Lekić, M.; Rogić, K.; Boldizsár, A.; Zöldy, M.; Ádám, T. Big Data in Logistics. Period. Polytech. Transp. Eng. 2019, 49, 60–65. [Google Scholar] [CrossRef] [Green Version]
- Szalmáné Csete, M.; Buzási, A. Hungarian regions and cities towards an adaptive future: Analysis of climate change strategies on different spatial levels. Időjárás 2020, 124, 253–276. [Google Scholar] [CrossRef]
- Vokony, I.; Hartmann, B.; Kiss, J.; Sőrés, P.; Farkas, C. Business Models to Exploit Possibilities of E-mobility: An Electricity Distribution System Operator Perspective. Period. Polytech. Transp. Eng. 2019, 48, 1–10. [Google Scholar] [CrossRef]
- Majchrzak, A.; Markus, M.; Wareham, J. Designing for Digital Transformation: Lessons for Information Systems Research from the Study of ICT and Societal Challenges. MIS Q. 2016, 40, 267–277. [Google Scholar] [CrossRef]
- Randall, L.; Berlina, A.; Teräs, J.; Rinne, T. Digitalisation as a Tool for Sustainable Nordic Regional Development: Preliminary Literature and Policy Review. Discussion Paper Prepared for Nordic Thematic Group for Innovative and Resilient Regions; Nordregio: Stockholm, Sweden, 2018. [Google Scholar]
- Alvarez-Risco, A.; Arcentales, S.D.A.; Rosen, M.A. Sustainable Development Goals and Cities. In Building Sustainable Cities; Springer: Berlin, Germany, 2020; pp. 313–330. [Google Scholar]
- Bánhidi, Z.; Dobos, I.; Nemeslaki, A. What the overall Digital Economy and Society Index reveals: A statistical analysis of the DESI EU28 dimensions. Reg. Stat. 2020, 10, 46–62. [Google Scholar] [CrossRef]
- European Commission. The Digital Economy and Society Index. 2020. Available online: https://ec.europa.eu/digital-single-market/en/digital-economy-and-society-index-desi (accessed on 30 January 2021).
- United Nations. Department of Economic and Social Affairs. Sustainable Development Goals. 2015. Available online: https://sdgs.un.org/goals. (accessed on 13 January 2021).
- Afonasova, M.A.; Panfilova, E.E.; Galichkina, M.A.; Ślusarczyk, B. Digitalization in Economy and Innovation: The Effect on Social and Economic Processes. Pol. J. Manag. Stud. 2019, 19, 22–32. [Google Scholar] [CrossRef]
- Benítez, R.; Liern, V. Unweighted TOPSIS: A new multi-criteria tool for sustainability analysis. Int. J. Sustain. Dev. World Ecol. 2021, 28, 36–48. [Google Scholar] [CrossRef]
- Mulliqi, A.; Adnett, N.; Hisarciklilar, M.; Rizvanolli, A. Human Capital and International Competitiveness in Europe, with Special Reference to Transition Economies. East. Eur. Econ. 2018, 56, 541–563. [Google Scholar] [CrossRef]
- Weresa, M.A. Innovation, Human Capital and Competitiveness in Central and Eastern Europe with Regard to the Challenges of a Digital Economy. 2017. Available online: https://www.semanticscholar.org/paper/Innovation%2C-human-capital-and-competitiveness-in-to-Weresa/35dbfe78da812905fbef3bdd5c4c0c9835a77e79. (accessed on 13 January 2021).
- European Comission. Monitoring the Digital Economy & Society 2016–2021. 2015. Available online: https://ec.europa.eu/eurostat/documents/341889/725524/Monitoring+the+Digital+Economy+%26+Society+2016-2021/7df02d85-698a-4a87-a6b1-7994df7fbeb7 (accessed on 30 January 2021).
- Bánhidi, Z.; Dobos, I. Az Európai Unió digitális gazdaság és társadalom indexének statisztikai elemzése. Stat. Szle. 2020, 98, 149–168. [Google Scholar] [CrossRef]
- Jovanović, M.; Dlačić, J.; Okanović, M. Digitalization and society’s sustainable development: Measures and implications. Zb. Rad. Ekon. Fak. Rijeci. 2018, 36, 905–928. [Google Scholar]
- European Comission. Building a Climate-Resilient Future: A new EU Strategy on Adaptation to Climate Change. 2021. Available online: https://ec.europa.eu/commission/presscorner/detail/en/ip_21_663 (accessed on 30 January 2021).
- Eurostat GDP: 2020. Available online: https://ec.europa.eu/eurostat/web/products-datasets/-/sdg_08_10 (accessed on 30 January 2021).
- Eurostat HDI: 2020. Available online: http://hdr.undp.org/en/content/human-development-index-hdi (accessed on 30 January 2021).
- Porter, M.E.; Stern, S.; Green, M. Social progress index 2016, Washington, Social Progress Imperative. 2016. Available online: https://www2.deloitte.com/content/dam/Deloitte/mx/Documents/about-deloitte/Social-Progress-Index-2016-Report.pdf (accessed on 10 March 2021).
- Eurostat SPI: 2020. Available online: https://ec.europa.eu/regional_policy/en/information/maps/social_progress (accessed on 30 January 2021).
- European Comission. European Innovation Scoreboard. Czechia. 2020. Available online: https://ec.europa.eu/docsroom/documents/41871 (accessed on 30 January 2021).
- European Comission. European Innovation Scoreboard. Hungary. 2020. Available online: https://ec.europa.eu/docsroom/documents/41878 (accessed on 30 January 2021).
- European Comission. European Innovation Scoreboard. Poland. 2020. Available online: https://ec.europa.eu/docsroom/documents/41886 (accessed on 30 January 2021).
- European Comission. European Innovation Scoreboard. Slovakia. 2020. Available online: https://ec.europa.eu/docsroom/documents/41889 (accessed on 30 January 2021).
Figure 1.
It shows the changes in GDP in V4 countries: (a) Real GDP growth rate % change on previous year; (b) GDP per capita in PPS.
Figure 1.
It shows the changes in GDP in V4 countries: (a) Real GDP growth rate % change on previous year; (b) GDP per capita in PPS.

Figure 2.
Real GDP per capita (EUR).

Figure 3.
(a) Social progress index rank; (b) Social progress index score.

Figure 4.
Digital economy and society index.

Figure 5.
V4 countries ranked based on selected DESI indicators.

Figure 6.
V4 countries’ ICT usage and e-commerce in enterprises.

Figure 7.
SDG goals and digitalization in V4 countries.


Table 1.
Ranking and average growth of the Human Development Index between 2010–2019.
| Country | HDI | HDI Rank | HDI Rank Change | Average HDI Growth (%) | Gross National Income (GNI) per Capita (PPP $) SDG 8.5 | ||
|---|---|---|---|---|---|---|---|
| 2010 | 2019 | 2019 | 2014–2019 | 2000–2010 | 2010–2019 | 2019 | |
| Hungary | 0.831 | 0.854 | 40 | 1 | 0.74 | 0.30 | 31,329 |
| Czech Republic | 0.870 | 0.900 | 27 | −1 | 0.79 | 0.38 | 38,109 |
| Poland | 0.840 | 0.880 | 35 | 0 | 0.62 | 0.52 | 31,623 |
| Slovakia | 0.831 | 0.860 | 39 | −2 | 0.83 | 0.38 | 32,113 |
| OECD | 0.874 | 0.900 | - | - | 0.46 | 0.33 | - |
| Global | 0.699 | 0.737 | - | - | 0.82 | 0.59 | - |
Publisher’s Note: MDPI stays neutral with regard to jurisdictional claims in published maps and institutional affiliations. |
© 2021 by the authors. Licensee MDPI, Basel, Switzerland. This article is an open access article distributed under the terms and conditions of the Creative Commons Attribution (CC BY) license (https://creativecommons.org/licenses/by/4.0/).
Share and Cite
MDPI and ACS Style
Esses, D.; Csete, M.S.; Németh, B. Sustainability and Digital Transformation in the Visegrad Group of Central European Countries. Sustainability 2021, 13, 5833. https://doi.org/10.3390/su13115833
AMA Style
Esses D, Csete MS, Németh B. Sustainability and Digital Transformation in the Visegrad Group of Central European Countries. Sustainability. 2021; 13(11):5833. https://doi.org/10.3390/su13115833
Chicago/Turabian StyleEsses, Diána, Mária Szalmáné Csete, and Bálint Németh. 2021. "Sustainability and Digital Transformation in the Visegrad Group of Central European Countries" Sustainability 13, no. 11: 5833. https://doi.org/10.3390/su13115833
Note that from the first issue of 2016, this journal uses article numbers instead of page numbers. See further details here.