Article

Dynamic Interrelationship and Volatility Spillover among Sustainability Stock Markets, Major European Conventional Indices, and International Crude Oil

Department of Accounting and Finance, Cyprus International University Haspolat, Mersin 10, Turkey
*
Author to whom correspondence should be addressed.
Sustainability 2020, 12(9), 3908; https://doi.org/10.3390/su12093908
Submission received: 1 April 2020 / Revised: 25 April 2020 / Accepted: 7 May 2020 / Published: 11 May 2020
(This article belongs to the Section Economic and Business Aspects of Sustainability)

Abstract

:
This study examines the dynamic interrelationship and volatility spillover among stainability stock indices (SSIs), international crude oil prices and major stock returns of European oil-importing countries (UK, Germany, France, Italy, Switzerland and The Netherlands) and oil-exporting countries (Norway and Russia). We employ the DCC-MGARCH model and use daily data for the sample period from 28 September 2001 to 10 January 2020. We find that the dynamic interrelationship between SSIs, stock returns of European oil importing/exporting countries and oil markets is different. There is higher correlation between SSIs and oil-importing countries, while oil-exporting countries have higher correlation with the oil market. Notably, the correlation between oil and stock returns became higher during and after the global financial crisis. This study also reveals the existence of significant volatility spillover between sustainability stock returns, international oil prices and the major indices of oil importing/exporting countries. These results have important implications for investors who are seeking to hedge and diversify their assets and for socially responsible investors.

1. Introduction

The dependence on energy of both emerging and developed economies indicates that oil price shocks have a significant impact on the variables of a country’s economics [1]. The oil market is the largest commodity market [2]. The relationship between oil prices and stock returns receives much interest since oil price shocks have a major impact on stocks, and changes in price directly affect the inputs of the production process that affect the cost of production. The cost of production necessarily reflects the cash flow and profitability of the firm and eventually affects dividends and stock returns. Oil prices also have an indirect effect on stock prices; stock prices, in theory, equal the present value for future cash flows [3,4].
The oil market is very volatile: a barrel of oil rose from around $20 per barrel at the beginning of this study period sample in October 2001 to its highest historical price of $145 per barrel during the global financial crisis in July 2008. The oil market continued to fluctuate, dropping to $30 per barrel in the oil crash of 2016 and then rising to $70 at the beginning of 2020. Therefore, the nature of the relationship between oil prices and stock returns has particular importance and represents an ongoing need for exploration. This relationship is of extreme importance to many parties: primarily policymakers, including local and international investors and various decision-makers, as well as for many products and service sectors within the economy.
Volatility spillover between the oil market and other assets is considered an important and timely topic, as it provides new concepts with which to hedge, diversify and manage portfolio risk [5]. Socially responsible investing (SRI) is represented by SSIs; SRI is one of the fastest-growing areas in the investment field, however, little is known about the volatility spillover between SRI and other main financial assets like oil and gold [6]. SRI is a combination of financial and nonfinancial considerations that include environmental, social and governance (ESG) factors in the investment process that reflect mainly on companies’ long-term returns, selections of investment portfolio elements and positive behaviors towards society.
SRI is growing more than conventional investment [7]. Researchers have developed several sustainability indicators, such as DJSI, FTSE4Good and the KLD index, to allow investors to include non-financial factors in their investment [8]. The number of investors who include SRI in their portfolios is constantly increasing [9]; consequently, the importance of SRI has increased significantly in recent years [10]. In general, SRI excludes investment activities related to tobacco, weapons and gambling [6,11]. This type of socially conscious investing attracts many investors; they believe investing in companies that adhere to sustainability standards creates new value in the long term and such investing is considered safer in that it avoids risks resulting from environmental and social developments [11].
To the best of our knowledge, there are no studies that consider the SRI and major European oil-importing/exporting stock markets. In addition, previous studies analyzing the relationship between SRI and international crude oil prices are limited. Thus, this study analyses the dynamic interrelationship and volatility spillover among crude oil prices and conventional stock markets represented by major indices for European oil-importing countries (UK, Germany, France, Italy, Switzerland and the Netherlands) and oil-exporting countries (Norway and Russia) and the SRI stock return. In this study, we primarily focus on Europe, one of the largest global markets, because it is considered one of the most important, mature and attractive markets in terms of investment, especially with regard to SRI. SRI is represented by two SSIs: the Dow Jones Sustainability World Index (DJSI-W) and the Dow Jones Sustainability Europe Index (DJSI-E).
The Dow Jones Sustainability Indices include general and sector-specific standards and take into account financial and nonfinancial criteria represented by ESG factors to assess sustainability performance [8,12]. Furthermore, as stated by Schaeffer et al. [12], DJSI-W is a guide for investors who seek to meet financial and nonfinancial criteria. According to Arai et al. [13], the total assets in sustainable investing for the five major markets (Europe; US; Canada; Australia and New Zealand; and Japan) in 2016 were $22.89 trillion, which increased to $30.683 trillion in 2018 (a growth of 34% in two years). The total asset breakdown in 2018: Europe with $14.08 trillion (45.9%); US with $12.00 trillion (39.1%); Japan with $2.18 trillion (7.1%); Canada with $1.70 trillion (5.5%); and Australia and New Zealand with $0.73 trillion (2.4%).
To investigate the dynamic interrelationship and volatility spillover between crude oil prices, DJSI-W, DJSI-E and major stock indices of European oil-importing/exporting countries, We employed Dynamic Conditional Correlation (DCC)-Multivariate Generalized Autoregressive Conditional Heteroscedasticity (MGARCH), using daily data for the sample period of the study (28 September 2001 to 10 January 2020). We found there is higher integration between SSIs and oil-importing countries, while oil-exporting countries have higher integration with the oil market. The spillover tests indicate the significant volatility transmission between SSIs, international oil prices and the major indices of oil importing/exporting countries.
This study is useful for portfolio managers, especially with regard to futures, hedging and management of portfolio risks. It will also be beneficial for policymakers and investors in general, particularly SRI investors. The organization of this article is as follows: Section 2 is devoted to a literature review, Section 3 contains the data and methodology, Section 4 presents the empirical results and Section 5 draws conclusions.

2. Literature Review

Researchers have widely studied the relationship between the oil market as a major source of energy and economic activity (e.g., [14,15,16,17,18,19,20]), as well as the impact of oil prices on conventional stock returns (e.g., [21,22,23,24,25,26,27,28,29]). Some authors have investigated the nexus between oil prices and the stock market in oil-exporting countries. For instance, Trabelsi [30] investigated three exporting countries (Saudi Arabia, UAE and Russia) using aggregate and sector levels. Trabelsi found a positive relationship between oil prices and stock returns for both aggregate and sector levels. Similarly, Basher et al. [31] investigated the effects of oil prices in oil-exporting countries, finding a significant effect of oil prices in Canada, Norway, Russia, Kuwait, Saudi Arabia and UAE, but not for Mexico.
On the other hand, some authors investigated the oil price relationship of oil-importing countries. For instance, Cunado and Gracia [32] investigated the effect of oil price shocks on 12 European oil-importing countries and found a negative effect of oil price shock on most countries studied. Along the same lines, Silvapulle et al. [33] found a positive relationship between oil prices and the stock returns of oil-importing countries during the pre–post financial crisis, although between 2003 and 2005 and in 2010, the relationship became negative for short periods. Sarwar et al. [34] investigated the spillover effect between major stock market returns for China, Japan and India and the WTI crude oil market by employing the GARCH family and using daily data from 1 January 2000 to the end of 2017. Sarwar et al. revealed that these Asian countries were minimally affected by oil shocks; India was the most affected.
Further studies, (e.g., [35,36,37,38,39,40]), investigated the oil price relationship of oil-importing/exporting countries. Among these studies Filis et al. [35] used monthly data and employed DCC-GARCH-GJR to investigate the dynamic conditional correlation for oil-exporting countries, such as Canada, Mexico and Brazil and oil-importing countries like the US, Germany and the Netherlands. They found no difference in the time-varying correlation for both oil-importing and oil-exporting countries. Guesmi and Fattoum [37] also used monthly data and employed DCC-GARCH-GJR for a sample of five oil-importing countries (US, Italy, Germany, the Netherlands and France) and four oil-exporting countries (UAE, Kuwait, Saudi Arabia and Venezuela). Similar to Filis et al., Guesmi and Fattoum also revealed there no difference in the time-varying correlation for both oil-importing and oil-exporting countries. While Salisu and Isah [39] showed linearity between oil prices and stock prices in oil exporting/importing countries, they also found an asymmetric effect between oil prices and stock prices.
A few studies have investigated the relationship between economic variables and SRI. In one of these studies, Sariannidis et al. [41] employed a GARCH model using monthly data from 2000 to 2008 to investigate the effects of economic variables on DJSI for the US. They found a negative effect of oil price changes on the US stock market and that the change in the value of bonds had a positive impact on the US stock market. Also, Sariannidis et al. [8] investigated the effects of oil prices, the consumer sentiment index and the European/US exchange rate on DJSI-E. Using data from November 2001 to March 2015, they employed the GARCH model and found that the three elements mentioned above affect DJSI-E. Particularly, the rise of oil prices had a negative effect on the performance of DJSI-E. Mensi et al. [42] utilized daily data from 9 November 1998 to 5 March 2015 to investigate the time-varying correlations and volatility spillovers between oil, gold and the Dow Jones sustainability/conventional and Islamic stock index and (10) Islamic stock sector indices by employing the multivariate DECO-FIAPARCH model. They revealed that there is time-varying spillover between oil, gold and the DJ index. Giannarakis et al. [10] investigated the effect of maritime transportation costs, gold, oil and the trade balance of goods and services for the US on DJSI-W by employing the GARCH model and using monthly data from October 1999 to July 2016. They found a positive effect on DJSI-W from these factors, particularly from maritime transportation costs.
In addition to the studies investigating the relationship between economic variables and SRI, previous studies have examined SRI and financial market issues, focusing on other areas. A few studies examined the ability of SRI to diversify portfolios. For example, Balcilar et al. [43] investigated volatility transmission and time-varying correlations between SSIs and conventional stocks. They used daily data from January 2004 through September 2015 for North America, Europe and Asia-Pacific countries; they found that SRI provided diversification benefits for conventional portfolios globally.
Some studies have investigated the performance of SRI indices compared to traditional indicators. For example, Schröder [44] considered the difference between the performance of SRI stocks compared to conventional stock returns. Schröder employed a sample of 29 SRI stock indices and revealed that SRI stocks show higher risk relative to conventional stock indices, but there are no returns that offset this higher risk. Cortez et al. [45] used data from 88 European socially responsible funds from seven countries to compare the performance of socially responsible funds and conventional funds; they found comparable performance between them. Managi et al. [46] investigated the difference between conventional and SRI stock performance for the UK, the US and Japan, finding comparable performance for both conventional and SRI stock returns within each country.
Additional authors have investigated the impact of additions and deletions from SSIs on companies’ performances. For example, Cheung [47] investigated the impact of stock return, risk and liquidity for the joined and omitted companies on the sustainability index of the US. According to a sample of 139 US firms and data from 2002 to 2008, the results displayed no clear evidence that the entry and exit of companies from the US SSI had an effect on stock return risk and liquidity. Similarly, Robinson et al. [48] investigated the effect of additions and deletions from DJSI-W on firms values in North America. They found an ongoing rise of firms’ values due to inclusion on DJSI-W and an insignificant effect on omitted firms’ values. In line with this, Roca [49] investigated the impact of stock return, risk and liquidity for the added and omitted companies on the sustainability world index for the Asia Pacific markets between 2002 and 2010. Surprisingly, in both cases, the author found a decrease in return, a rise in trading volume and unsystematic risk. However, the author found no change in systematic risk for the added and omitted companies on the index. None of these studies investigated the dynamic interrelationship and spillover effect between crude oil prices, DJSI-W, DJSI-E and major stock indices of European oil-importing/exporting countries.
To the best of our knowledge, there are no studies that consider the SRI and major European oil-importing/exporting stock markets. In addition, previous studies analyzing the relationship between SRI and international crude oil prices are limited. Therefore, our study is the first to analyze the dynamic interrelationship and volatility spillover among SSIs, major European conventional indices and international crude oil.

3. Data and Methodology

3.1. Data

Our study examined the dynamic interrelationship and volatility spillover between crude oil prices, SSIs and major indices for oil importing/exporting countries. This study utilized daily data collected from 28 September 2001 to 10 January 2020, which include 4770 observations from each index. The time of this sample period, depending on the availability of data from DJSI-E, began in 2001.
OSLO EXCHANGE ALL SHARE of Norway and RTS of Russia represented the oil-exporting countries for the European major stock market indices. The indices of importing countries included DAX 30 (Germany), FTSE100 (UK), CAC 40 (France), FTSE MIB (Italy), SMI (Switzerland) and AEX (Netherlands). We considered Brent crude oil as a proxy for crude oil prices since Brent is used as a benchmark and accounts for 70% of global trade. For the SRI stock market indices, we employed two SSIs: DJSI-E as a proxy for the European Sustainability Index and DJSI-W as a proxy for the world sustainability index.
According to Robecosam [50], DJSI-W and DJSI-E are considered the most-important members of the Dow Jones Sustainability Index family, which includes DJSI North America, DJSI Asia Pacific, DJSI Emerging Markets, DJSI Korea, DJSI Australia, DJSI Chile and DJSI MILA Pacific Alliance. Furthermore, DJSI-E, the leading SSI in Europe, represents the top 20% of companies among the largest 600 European companies, which are based on long-term economic, environmental and social factors. DJSI-W, comprising 2500 companies, represents 10% of the largest companies. The data for the indices were obtained from the Thomson Reuters Datastream. All the indices are expressed in Euros to help account for the local inflation rate [51]. The European countries chosen in this study are the largest economies within the European Union and are also major oil-importing/exporting countries.

3.2. Descriptive Statistics and Primary Analysis

As shown in Table 1, panel A there is a difference between oil-importing and oil-exporting countries; for example, the mean of oil-exporting countries, such as Russia (0.042) and Norway (0.037), is higher than that of oil-importing markets. The German (0.024) market achieved the highest returns among oil-importing countries, followed by Switzerland (0.018), with only the Italian (−0.004) market recording a negative return during the sample period of the research.
Considering the SSIs components’ return, the Global Sustainability Index achieved significantly higher returns than the European Index, which were 0.012 and 0.008, respectively. This indicates that, in general, the return for companies included in DJSI-E is lower than that for companies included in DJSI-W. As for oil, it achieved moderate returns compared to the returns of other indicators but is considered a high risk with a standard deviation of 2.11. Russia’s high risks (1.94)
May indicate the extent of the Russian economy’s influence on fluctuating oil prices. The same conclusion applies to the second oil-exporting country, Norway, but to a lesser degree than for Russia; Norway’s standard deviation is 1.52.
Italy has the highest risk among the oil-importing countries, followed by Germany and the Netherlands, while Switzerland has the lowest risk within the indicators studied. However, DJSI-W and DJSI-E have relatively low risks, with a global index preference over the European index. This indicates that the risk and return of oil-exporting countries is higher than both the oil-importing countries and SSIs. In order to investigate the unconditional correlation in Table 1, panel B we find that the value of the unconditional correlation between SSIs and oil-exporting countries is significantly lower than the value of oil-importing countries. It is worth noting that the unconditional correlation between SSIs and the other indices studied is higher for DJSI-E in all cases, excluding the unconditional correlation with Brent crude oil. The unconditional correlation between the Brent crude oil price and the oil-exporting countries of Norway (0.414) and Russia (0.310) is higher than the unconditional correlation between Brent crude oil price and both of oil-importing countries and SSIs.
With regard to the normal distribution, we used skewness, kurtosis and the Jarque–Bera test. We found that all indices, except oil and Switzerland, possessed a negative skewness. In particular, the oil-exporting countries that have the most-negative skewness are Norway (−0.545) and Russia (−0.339). As for kurtosis, all indices are leptokurtic with kurtosis values above 7. Given the probability of Jarque–Bera, we accept the null hypothesis, which means all the indices are not distributed normally. The significant autoregressive conditional heteroscedasticity (ARCH) indicated the presence of ARCH effects in all the indices studied. The Ljung–Box Q statistics as well as the Q statistics on the standardized squared residuals of the lag (20) confirmed the significant ARCH effects. To test the stationarity in the return series, we applied the Augmented Dickey and Fuller [52] (ADF) test. The results of this test accepted the null hypotheses, meaning that all the series were nonstationary at all levels. The returns were obtained by converting all series into a logarithm and then taking the difference between the current and the previous returns and multiplying it by 100, expressing the formula as, U t = l o g ( C t C t 1 ) 100 where U t is the daily return and C t is the price in time (t).

3.3. Methodology and Model Specification

To investigate the dynamic interrelationship and volatility spillover, researchers can employ many techniques, such as causality tests, vector autoregressive (VAR) models, cointegration and correlation analyses. However, modeling volatility and forecasting for financial and economic variables requires the use of GARCH/ARCH. Since the appearance of GARCH/ARCH has earned the attention of researchers and practitioners [53], most researchers employ the GARCH family to measure the volatility transmission, correlation and hedging ratio between oil and other assets [5] among these studies (e.g., [5,37,54,55,56,57]).
Among others, the DCC-MGARCH model may be the most popular because it has specifications to investigate the time-varying conditional correlation [58]. Many studies, such as [59,60,61], have employed the DCC-MGARCH model. In our research, we used the GARCH family to capture the dynamic interrelationship and spillover effect between DJSI-W and DJSI-E, international oil market prices and conventional stock market returns. We employed the DCC-MGARCH model created by Engle [62]; this model is compatible for controlling endogeneity, heteroscedasticity and omitted variable bias [63]. To utilize the DCC-MGARCH model, we first estimated the univariate GARCH parameter for each index. In the second step, which is dependent on the first step, we estimated the time-varying conditional correlation by employing the DCC model, which is as follows:
D t = G t K t G t
D t is the conditional covariance matrix, G t is a diagonal matrix with time varying conditional standard deviation and K t is the time varying conditional correlation matrix.
G t = d i a g ( w 1 , 1 , t 1 / 2 , , w N , N , t 1 / 2 )
Here, w i , i , t is any univariate GARCH process.
K t = d i a g ( z 11 , t 1 / 2 , , z N N , t 1 / 2 ) Z t ( z 11 , t 1 / 2 , , z N N , t 1 / 2 )
Z t is a symmetric positive definite matrix that defines the dynamic correlation structure as
Z t = ( 1 a b ) Z ¯ + a c t 1 c t 1 + Z b t 1
where Z ¯ is an unconditional correlation matrix of the vector standardized residuals c t , a and b are non-negative autoregressives and the coefficients of variance meet a + b < 1 . Eventually, the dynamic conditional correlation between Brent crude oil price, DJSI-W/E and the major indices for eight European oil-exporting and importing countries can be estimated as
L i j , t = o i j , t o i i , t o j j , t
where L i j , t is the dynamic conditional correlation. To estimate GARCH parameters, we employed the quasi-maximum likelihood method (QMLE) by using the student’s t-distribution.

4. Empirical Results and Discussion

Table 2, panel A shows the results of the GARCH (1,1) model, which reveal that the lagged conditional volatility for each index is statistically significant. In addition, the shock squared term in the variance equation is statistically significant, which means the lagged volatility and current news immediately reflect the price of the index.
Table 2, panels B, C and D represent the conditional correlation, volatility spillover and the student’s t-distribution resulting from DCC. The result shows that the student’s t-distribution has a statistical significance in panels B, C and D; this indicates that the choice of this distribution is appropriate for studying the time series for this study’s indices. Furthermore, the results show the existence of volatility spillover in all three panels and that the value of the volatility spillover coefficients (a and b) are positive, statistically significant, and have a summation of less than one (i.e., a + b < 1). These results indicate that there is volatility spillover between the indices of the Brent crude oil price, DJSI-W, DJSI-E and the eight European oil-importing/exporting countries.
With regards to the conditional correlation for panels B, C and D in Table 2, it is evident that the correlation is positive in the sample period of the study and has statistical significance. Notably, the conditional correlation between Brent, DJSI-W, DJSI-E and the oil-exporting countries (Russia and Norway) is different from the conditional correlation for the indices of the six European oil-importing countries addressed in this research. Table 2, panel B shows a higher conditional correlation between Brent and Russia (0.349) and Norway (0.344), which may indicate that the economies of the oil-exporting countries in Europe are affected more significantly by the oil price shock. The UK followed the exporting countries in terms of the conditional correlation with the Brent crude oil price by 0.265. According to Tang et al. [64] the UK was a net energy exporter from the 1980 s until 2005; after this time period, it became a net energy importer. This study examined data covering a period from 2001 to 2020, hence the time overlap may explain this trend.
DJSI-W comes in fourth place in terms of the conditional correlation with Brent (0.241), followed by DJSI-E (0.206). The remaining indices for the European oil-importing countries (The Netherlands 0.195, France 0.187, Italy 0.163, Switzerland 0.159 and Germany 0.159) have a relatively close conditional correlation with the Brent crude oil price.
In Table 2, panels C and D, the results show that the European oil-exporting countries Russia and Norway are less-integrated with SSIs, as seen in DJSI-W (0.525, 0.599) and DJSI-E (0.48, 0.653). While European oil importing countries have higher integration with DJSI-W and DJSI-E, they slightly increase in DJSI-E. The rankings for the conditional correlation between DJSI-W and European oil-importing countries are as follows: UK (0.855), The Netherlands (0.844), France (0.840), Germany (0.823), Italy (0.755) and Switzerland (0.754). The rankings for the conditional correlation between DJSI-E and oil-importing countries is as follows: France (0.944), The Netherlands (0.927), Germany (0.916), UK (0.911), Italy (0.857) and Switzerland (0.832).
In Table 1, panel B we show the calculations of the unconditional correlation for comparison reasons. We found that the result of unconditional correlation between DJSI-W, DJSI-E and the eight European stock markets is similar to the conditional correlation result. Moreover, the result is similar for the oil and stock markets. But, there is a slightly higher unconditional correlation over the conditional correlation in all cases with exception to the correlation between Russia and the oil market. This result is important and valuable to a portfolio manager’s ability to better diversify the assets of a financial portfolio, particularly for Russia and Norway. Since the risks are high in these countries, portfolio managers can minimize risk by investing in Socially responsible investing firms. This result is in line with Basher et al. [31] and Bein’s [63] findings that Russia and Norway are strongly affected by oil-price volatility spillover because their economies depend on the export of energy; accordingly, this reduces the opportunity to allocate assets between them and the global oil market.
In view of DCC in Figure 1, we note that DCC between the Brent crude oil price and both DJSI-W and DJSI-E returns demonstrate very similar co-movement and show positive correlations for most of the study period. However, the relationship pattern changed over time, specifically after and during the global financial crisis. The correlation increased in the second quarter and in the beginning of the third quarter of 2010. During this period, the correlation value peaked between the Brent crude oil price and DJSI-W and DJSI-E is 0.58 and 0.56, respectively. We further note that, in general, the time varying co-movement between the Brent crude oil price and the indices of Russia and Norway increased significantly after mid-2008.
As for DCC between the Brent crude oil price and the returns of the six oil-importing countries’ indices (Germany, UK, France, Italy, the Netherlands and Switzerland), the correlation is almost identical. Noticeably, the integration increased in the period between the last quarter of 2008 through the first quarter of 2011. After this period, the nature of the relationship returned to what it was before the last quarter of 2008, but with a relatively higher integration than before the financial crisis. This result is in line with many previous studies that revealed that the integration between oil price and the stock market increased during and after the global financial crisis (e.g., [65,66]).
Although, Filis et al. [35] and Guesmi and Fattoum [37] found no differences in DCC between the price of crude oil and the indices of oil importing/exporting countries, our results indicate that European oil exporting countries, Russia and Norway, have higher integration with oil price than the six European oil importing countries. This discrepancy in the results may be attributed to the difference in the sampled countries between our study and their studies.
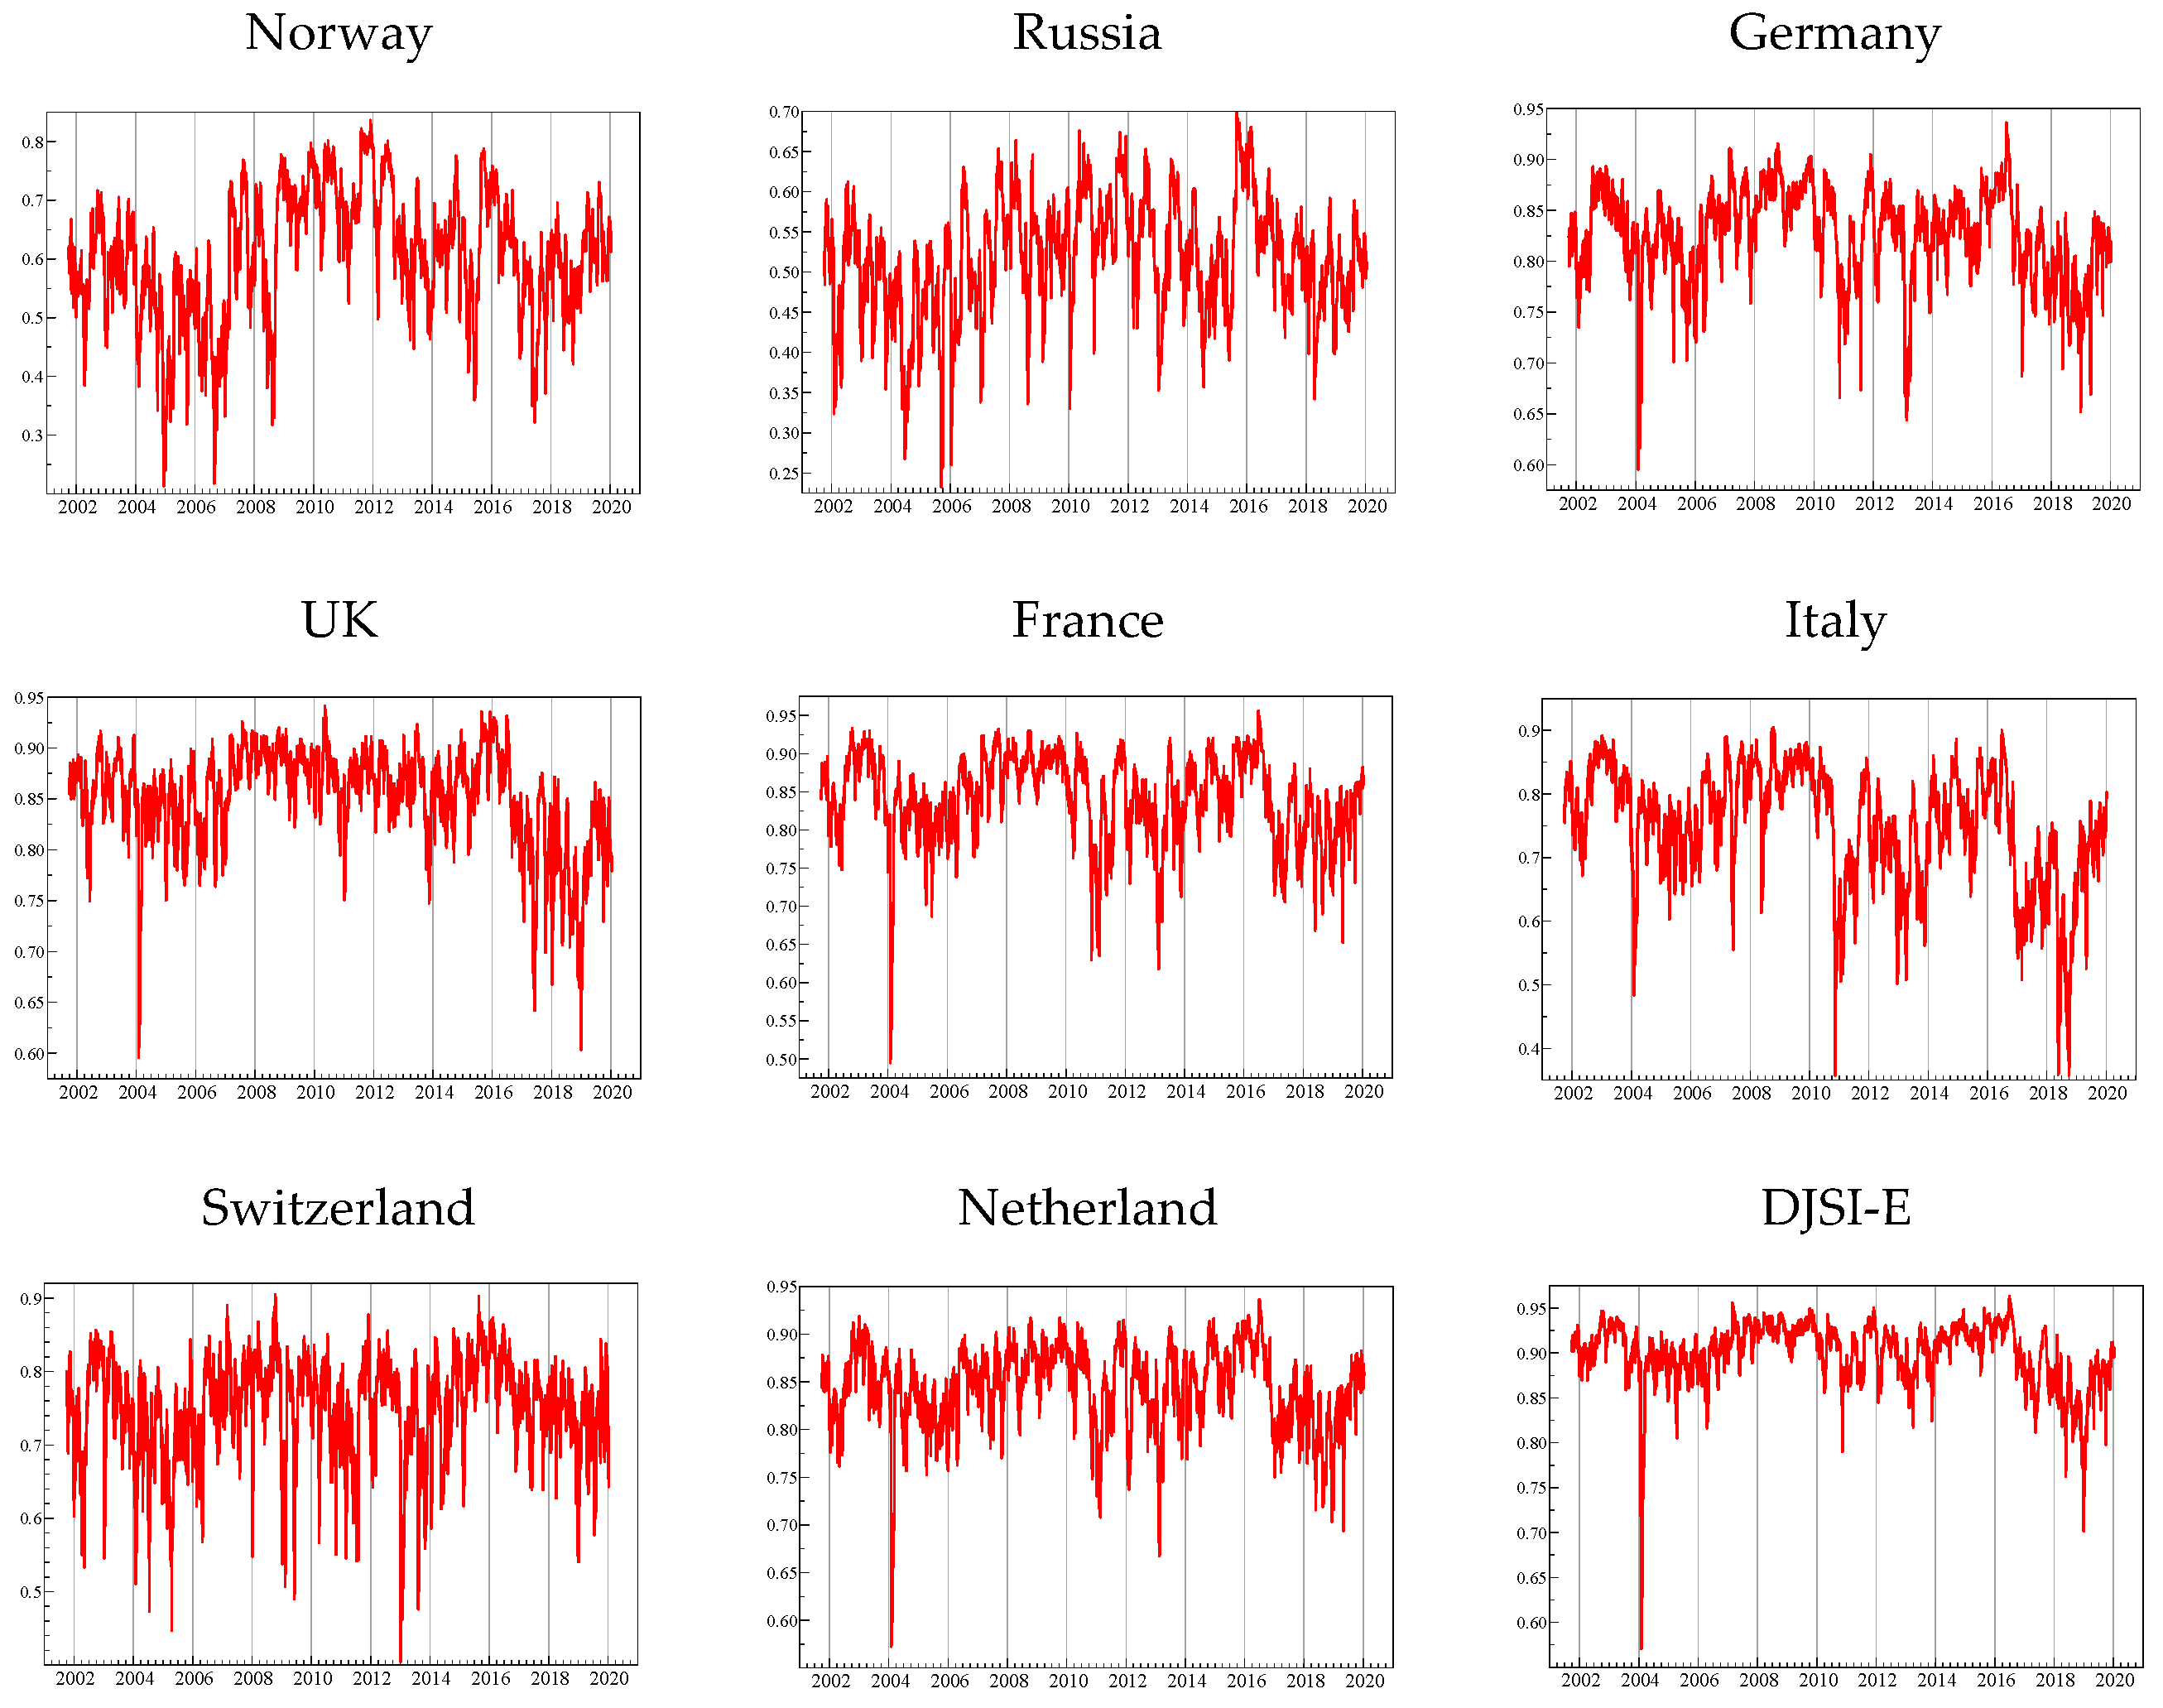
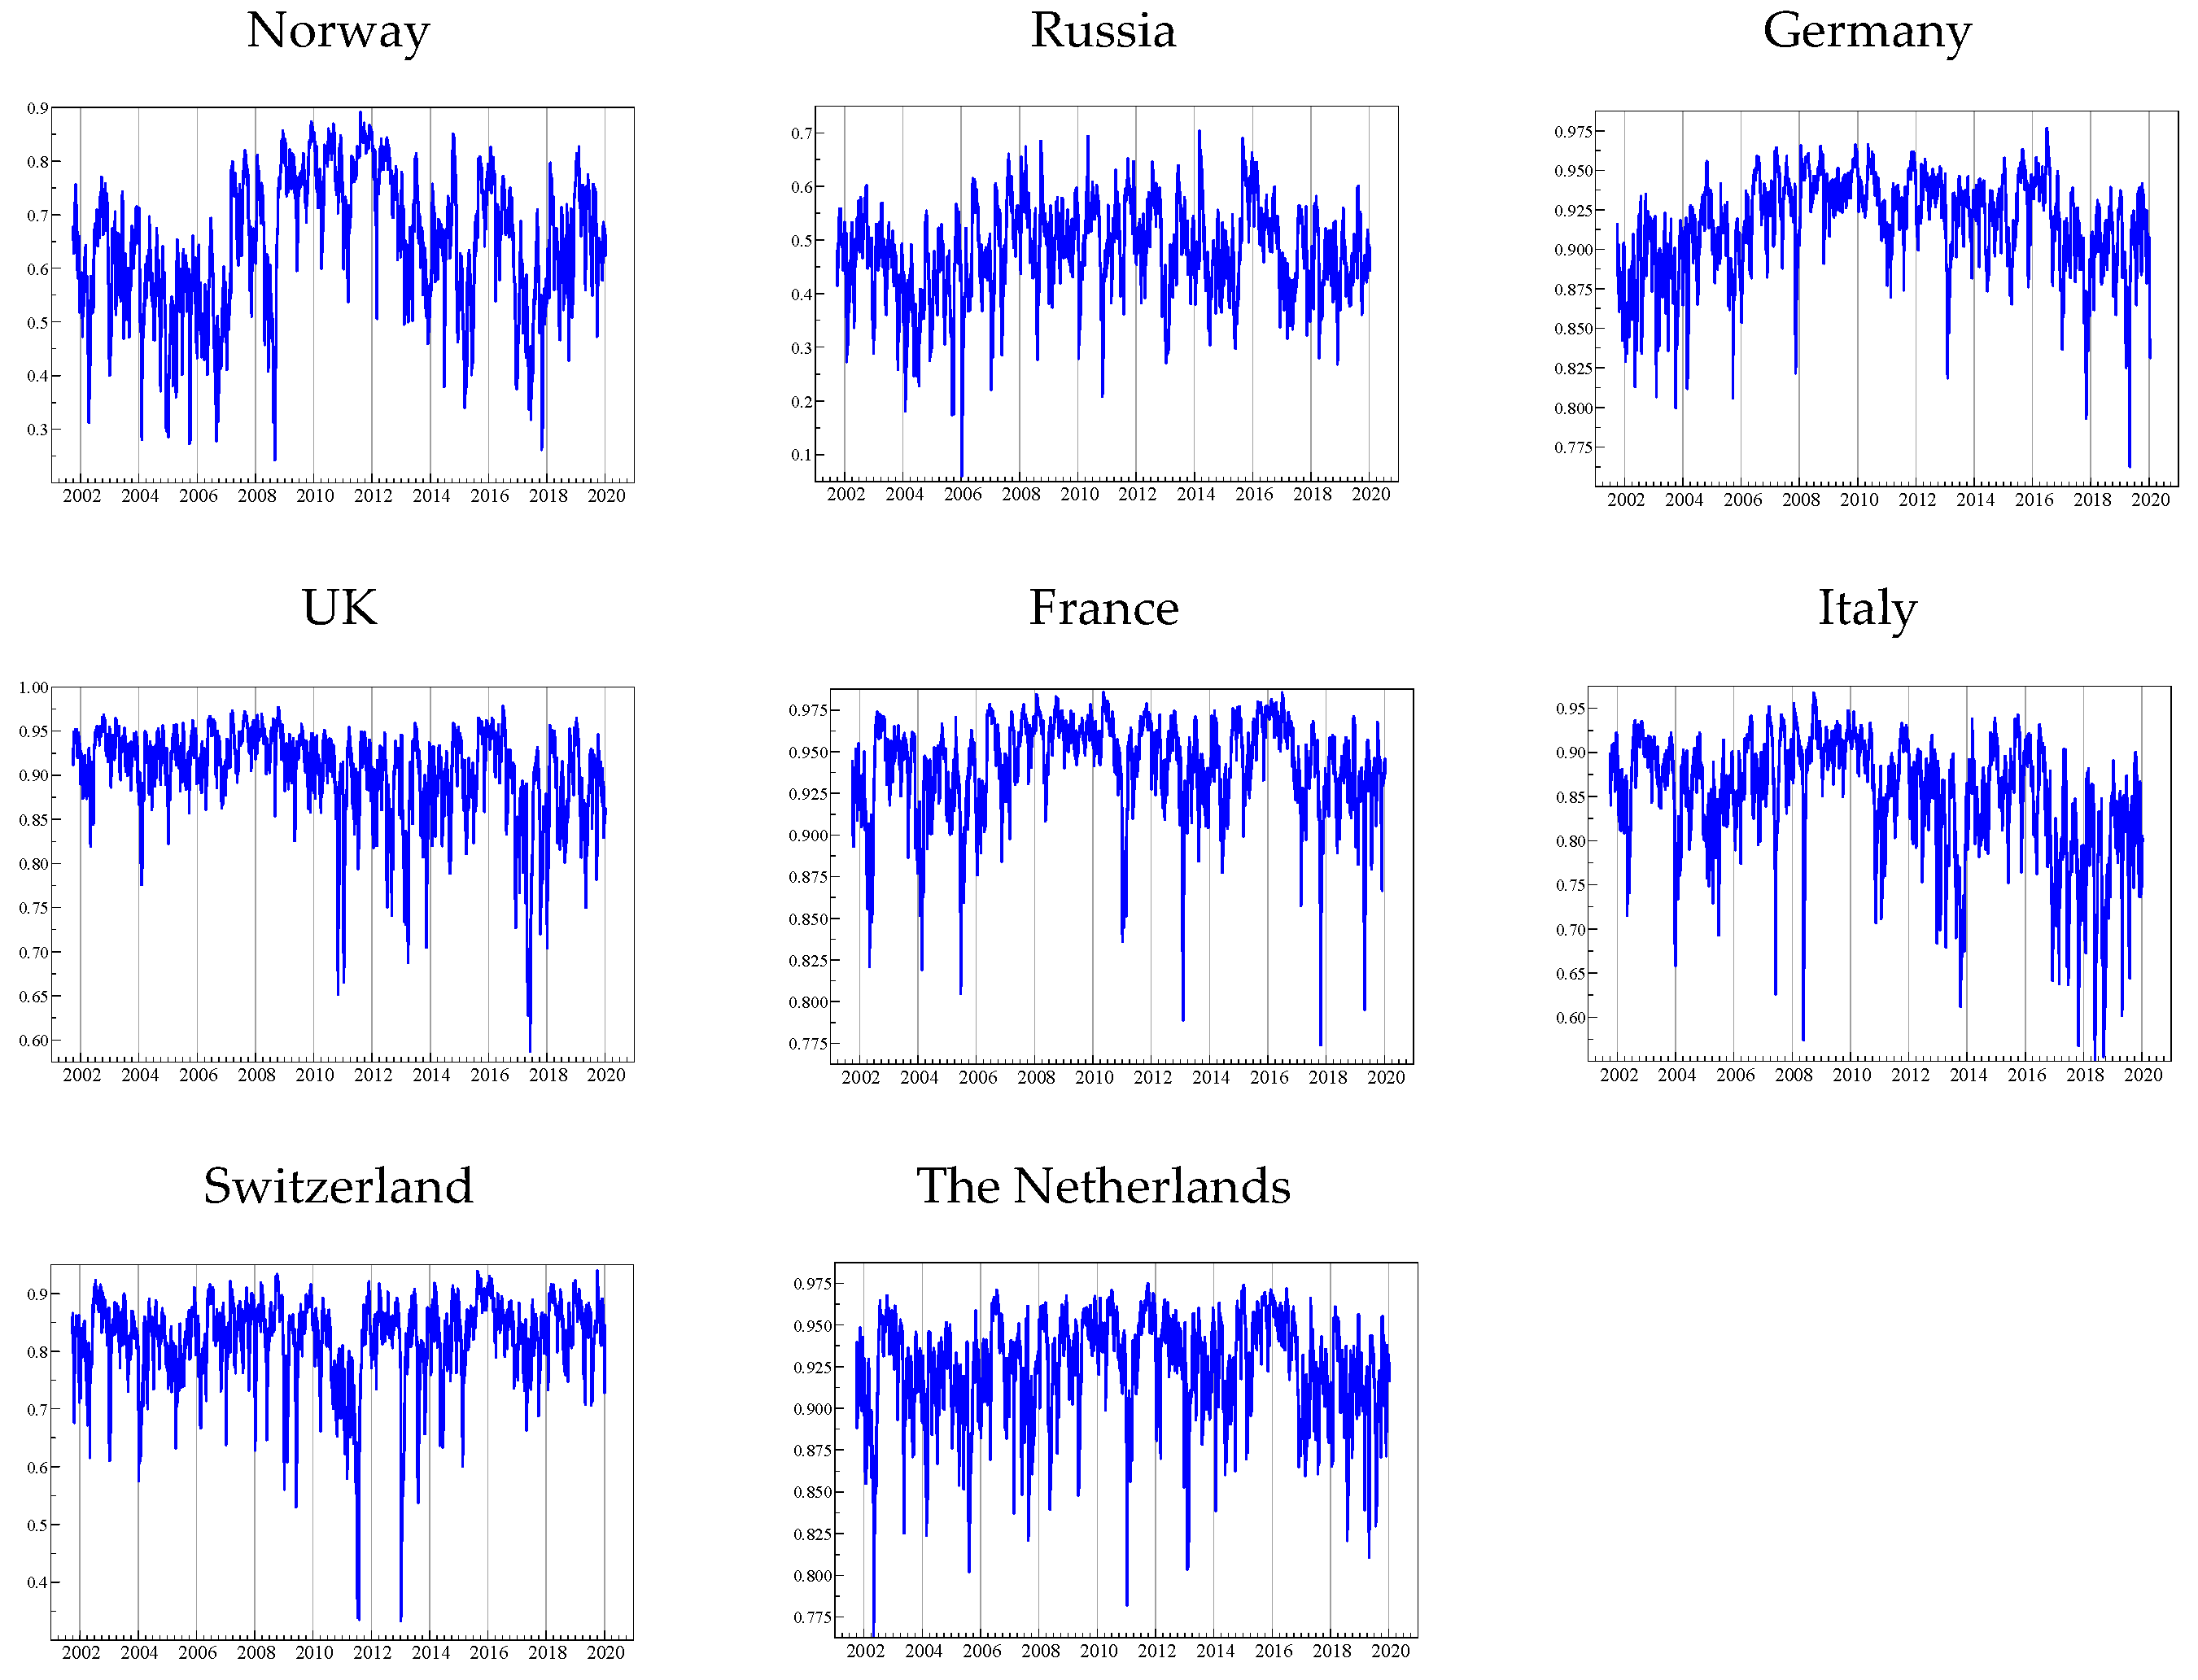
Figure 2 and Figure 3 show DCC between DJSI-W/E and major stock indices of European oil-importing/exporting countries. The time varying co-movement between oil-importing countries’ major indices and DJSI-W/E is generally higher and more stable than that with the oil-exporting countries’ indices. Although it is worth mentioning, as an oil-exporting country, Norway has high integration after mid-year 2008 until the beginning of 2012.

5. Conclusions

The number of investors who include SRI in their portfolios is constantly increasing; consequently, SRI is represented by two SSIs (DJSI-W/E), covers financial and nonfinancial criteria such as ESG factors. This type of investment attracts many investors who consider investing in companies that adhere to sustainability standards. Many authors have examined the comparison of the sustainability markets with conventional markets, while some have analyzed the impact of returns for companies that joined and left SSIs. A few studies have investigated the impact of sustainability investments on the diversification of investment portfolios. There are no studies that have considered SSIs and major indices for European oil-importing/exporting countries. In addition, a few studies have been made on the sustainability markets and international crude oil prices. Therefore, in this study, we investigated the dynamic interrelationship and volatility spillover between SRI, international crude oil prices and stock returns for major European oil-importing countries (UK, Germany, France, Italy, Switzerland and the Netherlands) and oil-exporting countries (Norway and Russia).
To capture the dynamic interrelationship and volatility spillover, we used daily data for the period between 2001 September 28 and 2020 January 10 by employing a DCC-MGARCH model. We found that the dynamic interrelationship between SSIs, oil-importing/exporting countries and oil markets are different. First, we observed that there is a higher integration between DJSI-W/E and the oil-importing countries than oil-exporting countries. Consequently, the integration between DJSI-W/E and the European oil-importing countries indices is higher than the oil-exporting countries’ indices of Russia and Norway. Next, there was a positive relationship between Brent and each of the main European indices and DJSI-W/E.
By analyzing the value of the correlation between the Brent crude oil price and the oil-exporting countries of Russia (0.349) and Norway (0.344), we determined that there was a higher correlation than with the six European oil-importing countries’ indices: The Netherlands (0.195), France (0.187), Italy (0.163) and Switzerland (0.159) and Germany (0.159) all had smaller, slightly positive correlations. Among the oil-importing countries, the UK had the highest conditional correlation (0.265). Furthermore, DCC between the Brent crude oil price and the European oil-importing countries indices fluctuated more than the European oil-exporting countries’ indices.
It was notable that the conditional correlation became higher between the fourth quarter of 2008 until the end of the sample period (10 January 2020), particularly between the fourth quarter of 2008 and the first quarter of 2011. The European oil-exporting countries’ indices tended to be positive for most of the study period, except Russia, which had a slightly negative correlation for a short period in 2004 and in 2014. We concluded that there was a positive relationship between the Brent crude oil price and the sustainability stock returns. In addition, we revealed that the conditional correlation co-movement is almost similar for both DJSI-W/E and the Brent crude oil price. It is worth mentioning that the integration between DJSI-W/E and the Brent crude oil price generally became higher during and after the global financial crisis.
The higher correlation between international oil market and stock markets in oil exporting countries, namely Norway and Russia, calls on policymakers in oil exporting countries to diversify their source of income and reduce their heavy reliance on oil income; this in return could minimize the damaging effect of the high correlation.
Furthermore, the results of our research on the relationship between oil market, conventional indices and SSIs is fruitful to policymakers. Our results indicate that the returns of SSIs are somewhat close to the returns of conventional indices. This, consequently, could encourage policymakers to pave the way for more companies to adhere to sustainability standards, since that entails adhering to the underlying environmental, social and governance (ESG) factors. In addition, policymakers in emerging countries where sustainability markets are in their infancy could find our results useful in a way that encourages the strengthening of their sustainability markets.
On the other hand, our results have important implications for investors and portfolio managers to diversify their risks. Given that the relationship between the global oil market, conventional stocks and SSIs is fairly close, investors could view sustainability more favorably. In particular, in the long term, sustainability firms have an added-value over conventional firms by reducing risks associated with ESG factors.
Ultimately, our study may introduce a new approach for researchers to investigate the relationship between commodity markets, the aggregate/sector conventional country indicators and unconventional investment like SSIs, Islamic stock market and cryptocurrency market. These types of research could be of wide-ranging value for policymakers, portfolio managers and investors, both during periods of stability as well as periods of crisis and turmoil.

Author Contributions

The first author (B.M.) presented the idea of the research paper and conducted the various aspect of the research from inception and literature review to data collection, empirical analysis, discussion, and conclusion. The second author (M.B.) provided general supervision and review of the research and contributed immensely to the formulating of the methodology. All authors have read and agreed to the published version of the manuscript.

Funding

This research received no external funding.

Acknowledgments

I would like to thank Mohammad Jadoon, Mutaz Maraqa, Mohammed Shaheen and Alaa Shaheen for the technical help and support.

Conflicts of Interest

The authors declare no conflict of interest.

References

  1. Polat, O. Time-Varying Propagations between Oil Market Shocks and a Stock Market: Evidence from Turkey. Borsa Istanb. Rev. 2020, A, 100–110. [Google Scholar] [CrossRef]
  2. Mensi, W. Global financial crisis and co-movements between oil prices and sector stock markets in Saudi Arabia: A VaR based wavelet. Borsa Istanb. Rev. 2019, 19, 24–38. [Google Scholar] [CrossRef]
  3. Fisher, I. Theory of Interest: As Determined by Impatience to Spend Income and Opportunity to Invest It; Augustusm Kelly Publishers: Clifton, NJ, USA, 1930. [Google Scholar]
  4. Williams, J.B. The Theory of Investment Value; Harvard University Press: Cambridge, MA, USA, 1938. [Google Scholar]
  5. Basher, S.A.; Sadorsky, P. Hedging emerging market stock prices with oil, gold, VIX, and bonds: A comparison between DCC, ADCC and GO-GARCH. Energy Econ. 2016, 54, 235–247. [Google Scholar] [CrossRef] [Green Version]
  6. Sadorsky, P. Modeling volatility and conditional correlations between socially responsible investments, gold and oil. Econ. Model. 2014, 38, 609–618. [Google Scholar] [CrossRef]
  7. Cortez, M.C.; Silva, F.; Areal, N. Socially responsible investing in the global market: The performance of US and European funds. Int. J. Finance Econ. 2012, 17, 254–271. [Google Scholar] [CrossRef] [Green Version]
  8. Sariannidis, N.; Giannarakis, G.; Zafeiriou, E.; Billias, I. The effect of crude oil price moments on socially responsible firms in Eurozone. Int. J. Energy Econ. Policy 2016, 6, 356–363. [Google Scholar]
  9. Kempf, A.; Osthoff, P. The effect of socially responsible investing on portfolio performance. Eur. Financ. Manag. 2007, 13, 908–922. [Google Scholar] [CrossRef] [Green Version]
  10. Giannarakis, G.; Lemonakis, C.; Sormas, A.; Georganakis, C. The effect of Baltic Dry Index, gold, oil and usa trade balance on dow jones sustainability index world. Int. J. Econ. Financ. Issues 2017, 7, 155. [Google Scholar]
  11. Knoepfel, I. Dow Jones Sustainability Group Index: A global benchmark for corporate sustainability. Corp. Environ. Strateg. 2001, 8, 6–15. [Google Scholar] [CrossRef]
  12. Schaeffer, R.; Borba, B.S.M.C.; Rathmann, R.; Szklo, A.; Castelo Branco, D.A. Dow Jones sustainability index transmission to oil stock market returns: A GARCH approach. Energy 2012, 45, 933–943. [Google Scholar] [CrossRef]
  13. Arai, M.; Lanz, D.; O’Connor, S.O.; Oulton, W.; Woll, L. 2018 Global Sustainable Investment Review. 2018. Available online: http://www.gsi-alliance.org/wp-content/uploads/2019/03/GSIR_Review2018.3.28.pdf (accessed on 15 December 2019).
  14. Hamilton, J.D. Oil and the macroeconomy since World War II. J. Polit. Econ. 1983, 91, 228–248. [Google Scholar] [CrossRef]
  15. Cunado, J.; De Gracia, F.P. Oil prices, economic activity and inflation: Evidence for some Asian countries. Q. Rev. Econ. Financ. 2005, 45, 65–83. [Google Scholar] [CrossRef] [Green Version]
  16. Cologni, A.; Manera, M. The asymmetric effects of oil shocks on output growth: A Markov–Switching analysis for the G-7 countries. Econ. Model. 2009, 26, 1–29. [Google Scholar] [CrossRef] [Green Version]
  17. Papapetrou, E. Oil prices and economic activity in Greece. Econ. Chang. Restruct. 2013, 46, 385–397. [Google Scholar] [CrossRef]
  18. Wang, Q.; Sun, X. Crude oil price: Demand, supply, economic activity, economic policy uncertainty and wars–From the perspective of structural equation modelling (SEM). Energy 2017, 133, 483–490. [Google Scholar] [CrossRef]
  19. Alquist, R.; Bhattarai, S.; Coibion, O. Commodity-price comovement and global economic activity. J. Monetary Econ. 2019. [Google Scholar] [CrossRef] [Green Version]
  20. Raghavan, M. An analysis of the global oil market using SVARMA models. Energy Econ. 2020, 86, 104633. [Google Scholar] [CrossRef] [Green Version]
  21. Jones, C.M.; Kaul, G. Oil and the stock markets. J. Financ. 1996, 51, 463–491. [Google Scholar] [CrossRef]
  22. Sadorsky, P. Oil price shocks and stock market activity. Energy Econ. 1999, 21, 449–469. [Google Scholar] [CrossRef]
  23. Basher, S.A.; Sadorsky, P. Oil price risk and emerging stock markets. Glob. Financ. J. 2006, 17, 224–251. [Google Scholar] [CrossRef]
  24. Park, J.; Ratti, R.A. Oil price shocks and stock markets in the US and 13 European countries. Energy Econ. 2008, 30, 2587–2608. [Google Scholar] [CrossRef]
  25. Arouri, M.E.H.; Lahiani, A.; Nguyen, D.K. Return and volatility transmission between world oil prices and stock markets of the GCC countries. Econ. Model. 2011, 28, 1815–1825. [Google Scholar] [CrossRef] [Green Version]
  26. Awartani, B.; Maghyereh, A.I. Dynamic spillovers between oil and stock markets in the Gulf Cooperation Council Countries. Energy Econ. 2013, 36, 28–42. [Google Scholar] [CrossRef]
  27. Hamdi, B.; Aloui, M.; Alqahtani, F.; Tiwari, A. Relationship between the oil price volatility and sectoral stock markets in oil-exporting economies: Evidence from wavelet nonlinear denoised based quantile and Granger-causality analysis. Energy Econ. 2019, 80, 536–552. [Google Scholar] [CrossRef]
  28. Lv, X.; Lien, D.; Yu, C. Who affects who? Oil price against the stock return of oil-related companies: Evidence from the US and China. Int. Rev. Econ. Financ. 2020, 67, 85–100. [Google Scholar] [CrossRef]
  29. Nguyen, V.N.; Nguyen, D.T. Can Crude Oil Price be a Predictor of Stock Index Return? Evidence from Vietnamese Stock Market. Asian Econ. Financ. Rev. 2020, 10, 13–21. [Google Scholar] [CrossRef] [Green Version]
  30. Trabelsi, N. Tail dependence between oil and stocks of major oil-exporting countries using the CoVaR approach. Borsa Istanb. Rev. 2017, 17, 228–237. [Google Scholar] [CrossRef]
  31. Basher, S.A.; Haug, A.A.; Sadorsky, P. The impact of oil-market shocks on stock returns in major oil-exporting countries. J. Int. Money Financ. 2018, 86, 264–280. [Google Scholar] [CrossRef]
  32. Cunado, J.; de Gracia, F.P. Oil price shocks and stock market returns: Evidence for some European countries. Energy Econ. 2014, 42, 365–377. [Google Scholar] [CrossRef]
  33. Silvapulle, P.; Smyth, R.; Zhang, X.; Fenech, J.-P. Nonparametric panel data model for crude oil and stock market prices in net oil importing countries. Energy Econ. 2017, 67, 255–267. [Google Scholar] [CrossRef]
  34. Sarwar, S.; Khalfaoui, R.; Waheed, R.; Dastgerdi, H.G. Volatility spillovers and hedging: Evidence from Asian oil-importing countries. Resour. Policy 2019, 61, 479–488. [Google Scholar] [CrossRef]
  35. Filis, G.; Degiannakis, S.; Floros, C. Dynamic correlation between stock market and oil prices: The case of oil-importing and oil-exporting countries. Int. Rev. Financ. Anal. 2011, 20, 152–164. [Google Scholar] [CrossRef]
  36. Wang, Y.; Wu, C.; Yang, L. Oil price shocks and stock market activities: Evidence from oil-importing and oil-exporting countries. J. Comp. Econ. 2013, 41, 1220–1239. [Google Scholar] [CrossRef]
  37. Guesmi, K.; Fattoum, S. Return and volatility transmission between oil prices and oil-exporting and oil-importing countries. Econ. Model. 2014, 38, 305–310. [Google Scholar] [CrossRef]
  38. Boldanov, R.; Degiannakis, S.; Filis, G. Time-varying correlation between oil and stock market volatilities: Evidence from oil-importing and oil-exporting countries. Int. Rev. Financ. Anal. 2016, 48, 209–220. [Google Scholar] [CrossRef] [Green Version]
  39. Salisu, A.A.; Isah, K.O. Revisiting the oil price and stock market nexus: A nonlinear Panel ARDL approach. Econ. Model. 2017, 66, 258–271. [Google Scholar] [CrossRef]
  40. Vu, T.K.; Nakata, H. Oil price fluctuations and the small open economies of Southeast Asia: An analysis using vector autoregression with block exogeneity. J. Asian Econ. 2018, 54, 1–21. [Google Scholar] [CrossRef]
  41. Sariannidis, N.; Litinas, N.; Konteos, G.; Giannarakis, G. A GARCH examination of Macroeconomic effects on US stock market: A distinguish between the total market index and the sustainability index. SSRN Electron. J. 2009. [Google Scholar] [CrossRef]
  42. Mensi, W.; Hammoudeh, S.; Al-Jarrah, I.M.W.; Sensoy, A.; Kang, S.H. Dynamic risk spillovers between gold, oil prices and conventional, sustainability and Islamic equity aggregates and sectors with portfolio implications. Energy Econ. 2017, 67, 454–475. [Google Scholar] [CrossRef]
  43. Balcilar, M.; Demirer, R.; Gupta, R. Do Sustainable Stocks Offer Diversification Benefits for Conventional Portfolios? An Empirical Analysis of Risk Spillovers and Dynamic Correlations. Sustainability 2017, 9, 1799. [Google Scholar] [CrossRef] [Green Version]
  44. Schröder, M. Is there a difference? The performance characteristics of SRI equity indices. J. Bus. Financ.Account. 2007, 34, 331–348. [Google Scholar] [CrossRef]
  45. Cortez, M.C.; Silva, F.; Areal, N. The performance of European socially responsible funds. J. Bus. Ethics 2009, 87, 573–588. [Google Scholar] [CrossRef]
  46. Managi, S.; Okimoto, T.; Matsuda, A. Do socially responsible investment indexes outperform conventional indexes? Appl. Financ. Econ. 2012, 22, 1511–1527. [Google Scholar] [CrossRef] [Green Version]
  47. Cheung, A.W.K. Do stock investors value corporate sustainability? Evidence from an event study. J. Bus. Ethics 2011, 99, 145–165. [Google Scholar] [CrossRef]
  48. Robinson, M.; Kleffner, A.; Bertels, S. Signaling sustainability leadership: Empirical evidence of the value of DJSI membership. J. Bus. Ethics 2011, 101, 493–505. [Google Scholar] [CrossRef]
  49. Roca, E. The effect on price, liquidity and risk when stocks are added to and deleted from a sustainability index: Evidence from the Asia Pacific context. J. Asian Econ. 2013, 24, 51–65. [Google Scholar] [CrossRef] [Green Version]
  50. Robecosam. DJSI Index Family. Available online: https://www.robecosam.com/csa/indices/djsi-index-family.html (accessed on 10 December 2019).
  51. Bein, M.A.; Tuna, G. Comparing spillover effects among emerging markets with a higher (lower) share of commodity exports: Evidence from the two major crises. Econ. Comput. Econ. Cybern. Stud. Res. 2016, 50, 265–284. [Google Scholar]
  52. Dickey, D.A.; Fuller, W.A. Distribution of the estimators for autoregressive time series with a unit root. J. Am. Stat. Assoc. 1979, 74, 427–431. [Google Scholar] [CrossRef]
  53. Arouri, M.E.H.; Lahiani, A.; Nguyen, D.K. World gold prices and stock returns in China: Insights for hedging and diversification strategies. Econ. Model. 2015, 44, 273–282. [Google Scholar] [CrossRef] [Green Version]
  54. Arouri, M.E.H.; Lahiani, A.; Lévy, A.; Nguyen, D.K. Forecasting the conditional volatility of oil spot and futures prices with structural breaks and long memory models. Energy Econ. 2012, 34, 283–293. [Google Scholar] [CrossRef] [Green Version]
  55. Bai, X.; Lam, J.S.L. A copula-GARCH approach for analyzing dynamic conditional dependency structure between liquefied petroleum gas freight rate, product price arbitrage and crude oil price. Energy Econ. 2019, 78, 412–427. [Google Scholar] [CrossRef]
  56. Franses, P.H.; Van Dijk, D. Forecasting stock market volatility using (non-linear) Garch models. J. Forecast. 1996, 15, 229–235. [Google Scholar] [CrossRef]
  57. Hung, J.-C.; Lee, M.-C.; Liu, H.-C. Estimation of value-at-risk for energy commodities via fat-tailed GARCH models. Energy Econ. 2008, 30, 1173–1191. [Google Scholar] [CrossRef]
  58. Caporin, M.; McAleer, M. Scalar BEKK and indirect DCC. J. Forecast. 2008, 27, 537–549. [Google Scholar] [CrossRef]
  59. Ashfaq, S.; Tang, Y.; Maqbool, R. Volatility spillover impact of world oil prices on leading Asian energy exporting and importing economies’ stock returns. Energy 2019, 188, 116002. [Google Scholar] [CrossRef]
  60. Ghosh, I.; Sanyal, M.K.; Jana, R. Co-movement and Dynamic Correlation of Financial and Energy Markets: An Integrated Framework of Nonlinear Dynamics, Wavelet Analysis and DCC-GARCH. Comput. Econ. 2020. [Google Scholar] [CrossRef]
  61. Khalfaoui, R.; Sarwar, S.; Tiwari, A.K. Analysing volatility spillover between the oil market and the stock market in oil-importing and oil-exporting countries: Implications on portfolio management. Resour. Policy 2019, 62, 22–32. [Google Scholar] [CrossRef]
  62. Engle, R. Dynamic conditional correlation: A simple class of multivariate generalized autoregressive conditional heteroskedasticity models. J. Bus. Econ. Stat. 2002, 20, 339–350. [Google Scholar] [CrossRef]
  63. Bein, M.A. Time-varying co-movement and volatility transmission between the oil price and stock markets in the Baltics and four European countries. Inž. Ekon. 2017, 28, 482–493. [Google Scholar] [CrossRef]
  64. Tang, X.; Snowden, S.; Höök, M. Analysis of energy embodied in the international trade of UK. Energy Policy 2013, 57, 418–428. [Google Scholar] [CrossRef] [Green Version]
  65. Mollick, A.V.; Assefa, T.A. US stock returns and oil prices: The tale from daily data and the 2008–2009 financial crisis. Energy Econ. 2013, 36, 1–18. [Google Scholar] [CrossRef]
  66. Tsai, C.-L. How do US stock returns respond differently to oil price shocks pre-crisis, within the financial crisis, and post-crisis? Energy Econ. 2015, 50, 47–62. [Google Scholar] [CrossRef]
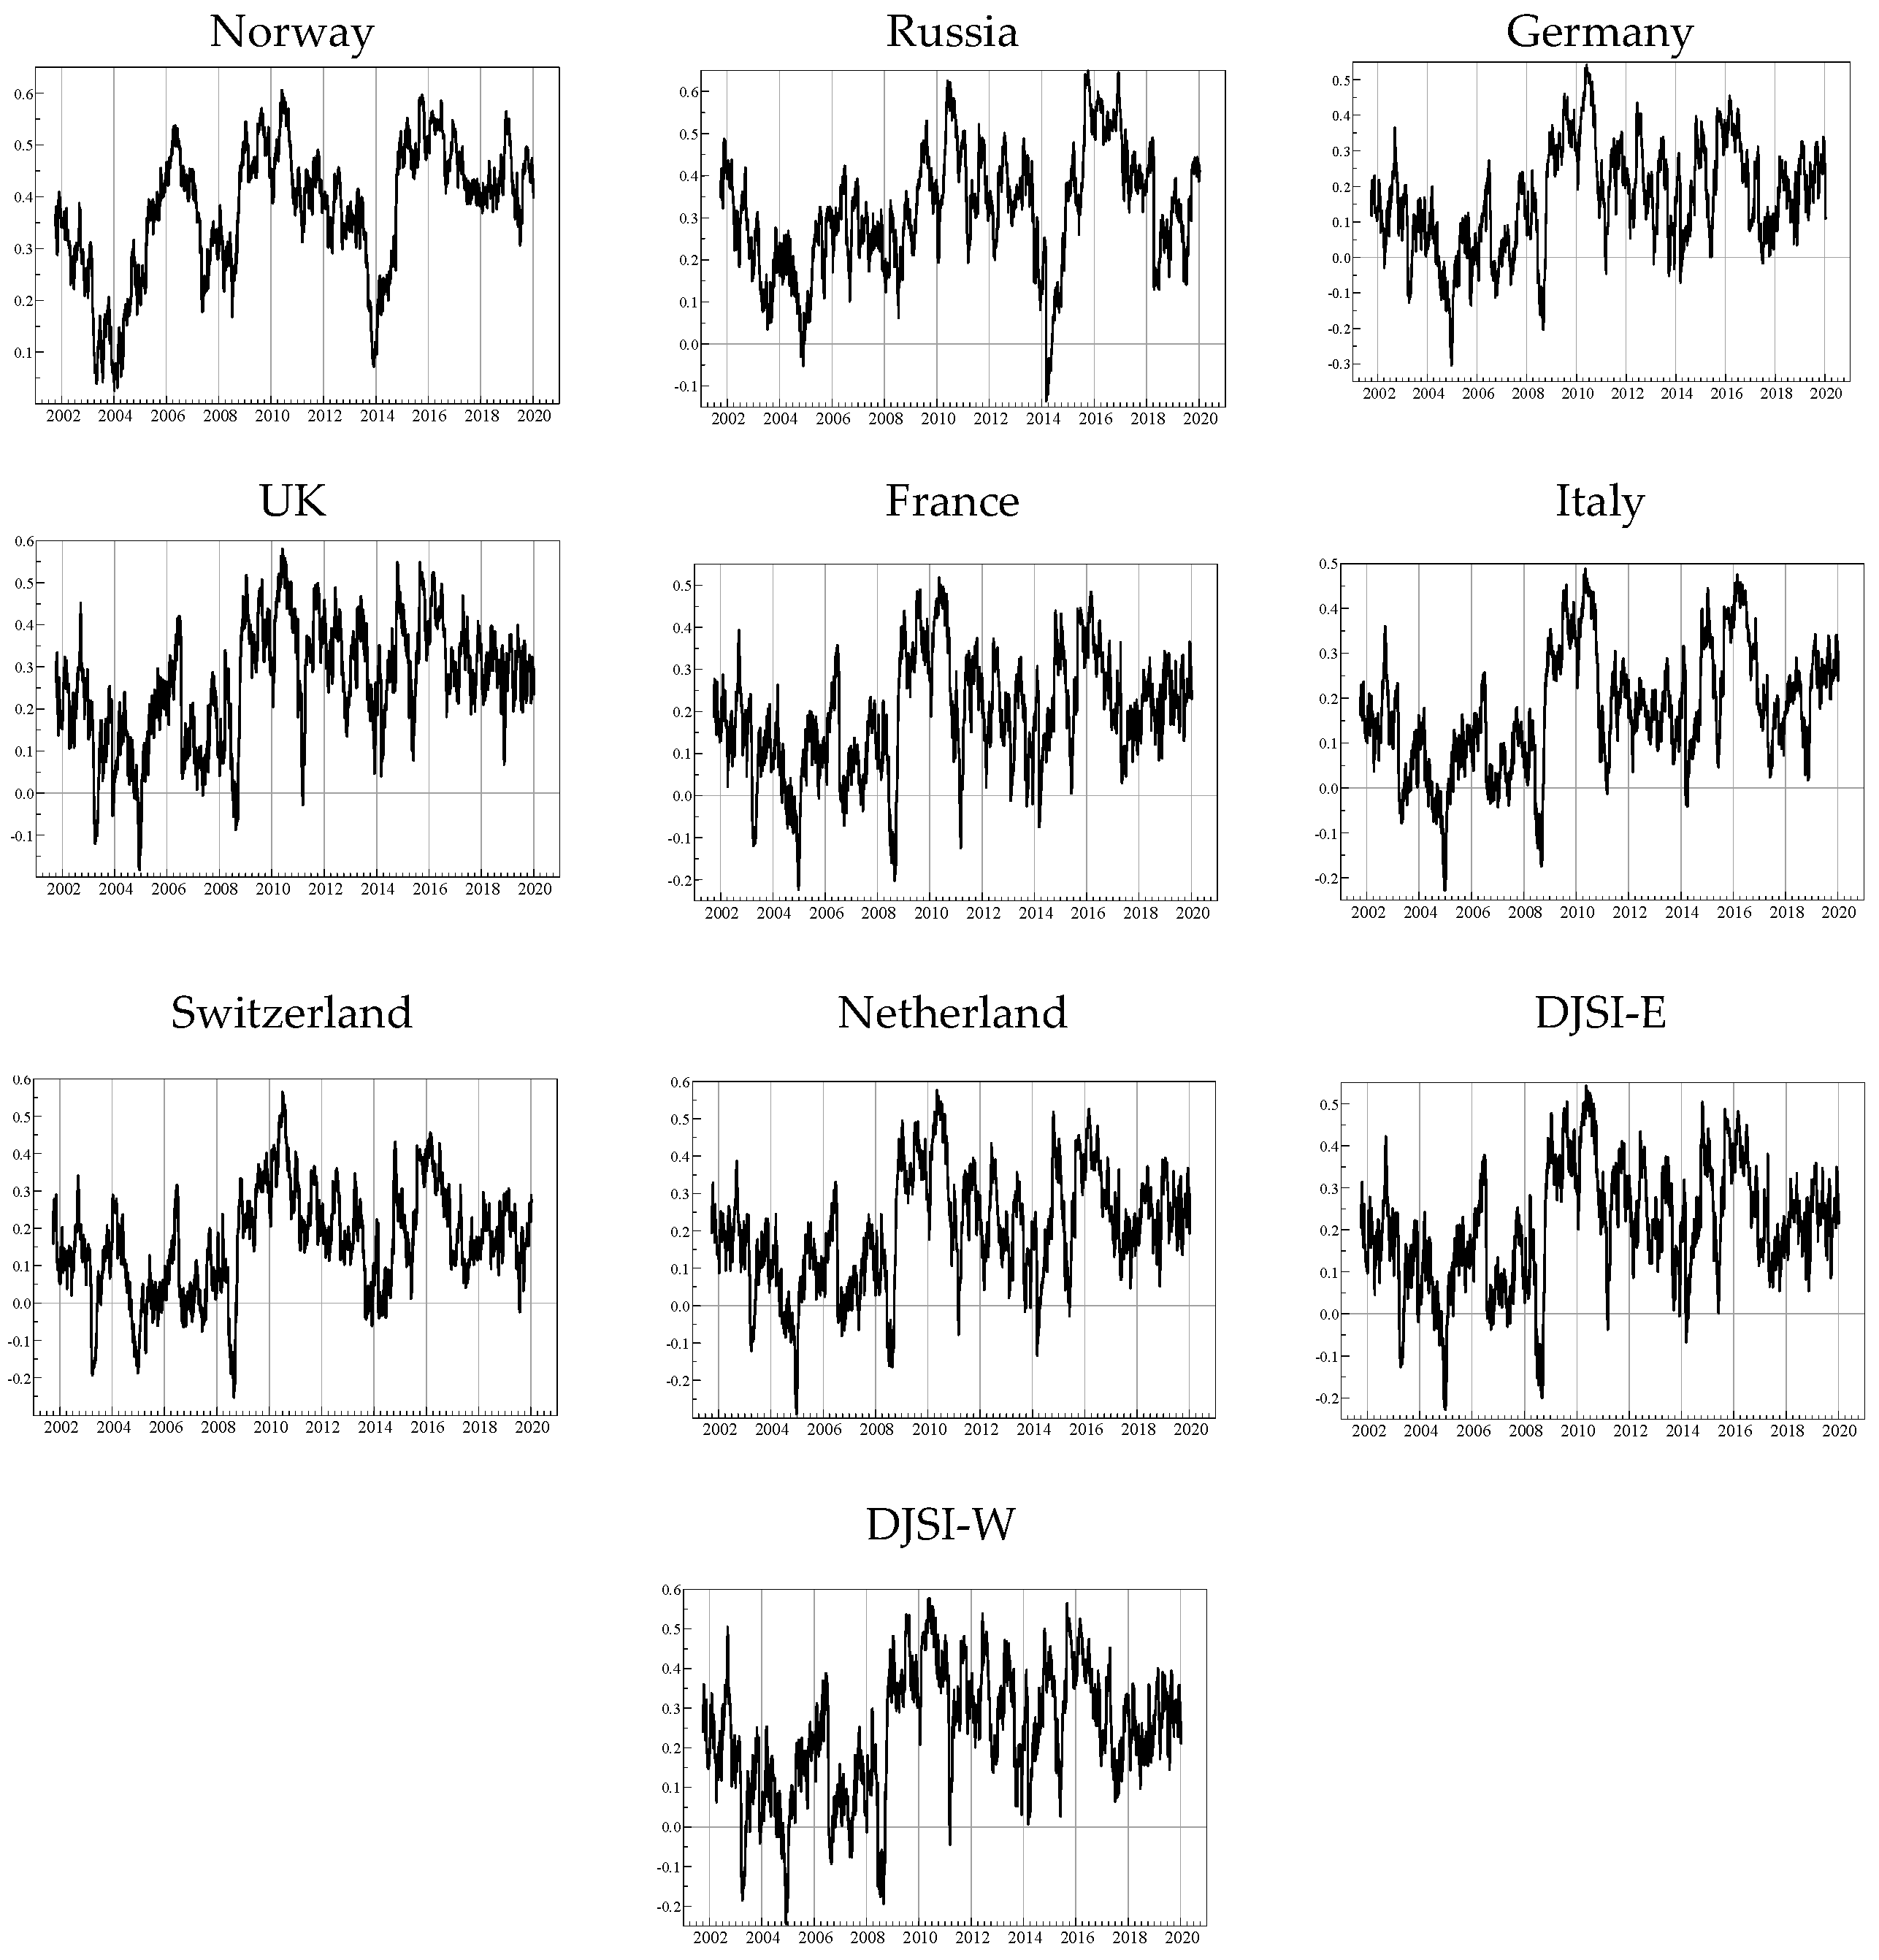
Figure 1. Dynamic conditional correlation (DCC) between Brent oil price and (Dow Jones Sustainability World/Europe Index (DJSI-W/E) and European countries indices).
Sustainability 12 03908 g001
Figure 2. DCC between DJSI-W and (DJSI-E and European countries indices).
Sustainability 12 03908 g002
Figure 3. DCC between DJSI-E and European countries indices.
Sustainability 12 03908 g003
Table 1. Descriptive statistics and unconditional correlations.
Panel A: Descriptive Statistics
NAMEBRENTDJSI-WDJSI-ENORRUSGERUKFRAITLSWISNETH
Mean0.0200.0120.0080.0370.0420.0240.0030.008−0.0040.0180.006
Maximum17.8958.2469.29410.80219.98710.7979.64710.59510.8779.42610.028
Minimum−16.349−6.749−8.524−11.336−18.934−7.433−9.480−9.472−13.331−6.241−9.590
Std Dev2.1141.0121.2041.5281.9461.4141.2411.3821.4771.0391.364
Skewness0.050−0.203−0.135−0.545−0.339−0.002−0.213−0.007−0.2070.017−0.071
Kurtosis7.4118.9869.4519.16113.6778.21510.7048.9608.5188.65610.355
J.B.3869a7155a8284a7780a22,749a5406a11,832a7059a6085a6359a10,755a
ARCH (5)72.2a264.4a2403a275a126.1a184.1a263.1a187.4a118a258.5a311.4a
Q 2 (20)1547a5873a5133a7200a3344a4767a5151a4228a2523a5420a6945a
Q (20) Ljung13.734.919.416.225.111.228.622.122.212.915.0
ADF−28.5a−3.0.3a−31.1a−29.8a−28.8a−30.1a−32.1a−31.6a−29.7a−30.8a−30.6a
Panel B:Unconditional Correlations between Indices
BRENT1.0000.2630.2470.4140.3100.1970.2910.2300.2240.1860.238
DJSI-W0.2631.0000.9210.6630.5100.8550.8830.8770.7780.8000.873
DJSI-E0.2470.9211.0000.7100.4860.9120.9340.9590.8710.8540.939
Note: Std Dev (Standard deviation), J.B. (Jarque–Bera), ARCH (autoregressive conditional heteroscedasticity), ADF (augmented Dickey and Fuller), the value of J.B., ARCH(5), Q 2 (20), Q (20) Ljung and ADF are statistically significant for a at 1%.
Table 2. Estimation results of the GARCH (1,1) and the derived DCC equations.
Panel A: GARCH (1,1) Estimation
BRENTDJSI-WDJSI-ENORRUSGERUKFRAITLSWISNETH
M EquationM0.0340.049a0.053a0.084a0.093a0.072a0.042a0.057a0.042a0.054a0.058a
W0.018b0.013a0.016a0.035a0.079a0.022a0.022a0.023a0.014a0.019a0.019a
V EquationARCH0.046a0.09a0.109a0.089a0.092a0.084a0.117a0.103a0.08a0.098a0.104a
GARCH0.951a0.895a0.88a0.893a0.885a0.904a0.869a0.886a0.916a0.882a0.884a
Panel B: DCC equations for Brent with each stock market indices
RHO0.241a0.206a0.344a0.349a0.159a0.265a0.187a0.163a0.159a0.195a
A0.023a0.02a0.012a0.017a0.018a0.02b0.02a0.015a0.017a0.021a
B0.967a0.97a0.985a0.978a0.974a0.97b0.97a0.98a0.975a0.969a
Df7.818a7.657a8.558a6.849a7.533a7.854a7.688a7.742a8.227a7.863a
Panel C: DCC equations for DJSI–W with DJSI–E and European countries indices
RHO0.902a0.599a0.525a0.823a0.855a0.840a0.755a0.754a0.844a
A0.03a0.027a0.018b0.027a0.033a0.038a0.032a0.042a0.033a
B0.952a0.963a0.965b0.957a0.943a0.947a0.957a0.924a0.947a
Df7.737a8.668a6.433a7.591a7.866a7.939a7.212a7.925a7.995a
Panel D: DCC equations for DJSI–E with European countries indices
RHO0.653a0.480a0.916a0.911a0.944a0.857a0.832a0.927a
A0.037a0.027a0.037a0.062a0.052a0.049a0.051a0.052a
B0.953a0.941a0.947a0.912a0.929a0.933a0.918a0.923a
Df8.104a6.519a6.917a7.941a7.655a6.558a7.19a7.42a
Note1. Brent (Brent crude oil), NOR (Norway), RUS (Russia), GER (Germany), UK (United Kingdom), FRA (France), ITL (Italy), SWIS (Switzerland), NETH (The Netherlands), M Equation(Mean equation), V Equation (Variance equation). a and b are statistically significant at 1% and 5%, respectively.