Article

Human Activities Inducing High CH4 Diffusive Fluxes in an Agricultural River Catchment in Subtropical China

1
Institute of Environment and Sustainable Development in Agriculture, Chinese Academy of Agricultural Sciences, Beijing 100081, China
2
School of Geography and Tourism, Anhui Normal University, Wuhu 241000, China
3
Key Laboratory of Agro-ecological Processes in Subtropical Region, Institute of Subtropical Agriculture, Chinese Academy of Sciences, Changsha 410125, China
4
College of Life Sciences, Capital Normal University, Beijing 100048, China
5
Soils and Fertilizer Institute of Hunan Province, Changsha 410125, China
6
Changsha Environmental Protection College, Changsha 410004, China
*
Author to whom correspondence should be addressed.
Sustainability 2020, 12(5), 2114; https://doi.org/10.3390/su12052114
Submission received: 15 January 2020 / Revised: 21 February 2020 / Accepted: 2 March 2020 / Published: 9 March 2020
(This article belongs to the Section Sustainable Agriculture)

Abstract

:
Methane (CH4) is one of the key greenhouse gases (GHGs) in the atmosphere with current concentration of 1859 ppb in 2017 due to climate change and anthropogenic activities. Rivers are of increasing concern due to sources of atmospheric CH4. However, knowledge and data limitations exist for field studies of subtropical agricultural river catchments, particularly in southern China. The headspace balance method and the diffusion model method were employed to assess spatiotemporal variations of CH4 diffusive fluxes from April 2015 to January 2016 in four order reaches (S1, S2, S3, and S4) of the Tuojia River, Hunan, China. Results indicated that both the dissolved concentrations and diffusive fluxes of CH4 showed obvious spatiotemporal variations. The observed mean concentration and diffusive flux of CH4 were 0.40 ± 0.02 μmol L−1 and 41.19 ± 2.50 µg m−2 h−1, respectively, showing the river to be a strong source of atmospheric CH4. The CH4 diffusive fluxes during the rice-growing seasons were significantly greater than the winter fallow season (an increase of 80.26%). The spatial distribution of CH4 diffusive fluxes increased gradually from (17.58 ± 1.42) to (55.56 ± 4.32) µg m−2 h−1 due to the organic and nutrient loading into the river waterbodies, with the maximum value at location S2 and the minimum value at location S1. Correlation analysis showed that the CH4 diffusive fluxes exhibited a positive relationship with the dissolved organic carbon (DOC), salinity, and water temperature (WT), while a negative correlation occurred between CH4 diffusive fluxes and the dissolved oxygen (DO) concentration, as well as the pH value. Our findings highlighted that a good understanding of exogenous nutrient loading in agricultural catchments will clarify the influence of human activities on river water quality and then constrain the global CH4 budget.

1. Introduction

Methane (CH4) is a powerful greenhouse gas (GHG), which has a 28 times greater global warming potential (GWP) than carbon dioxide (CO2) over a 100-year time period [1], accounting for approximately 20% of the radiative forcing added to the atmosphere [2]. Therefore, when GWP is expressed in CO2 equivalents, CH4 is an important contributor to GHG emissions [3]. The current global concentration of atmospheric CH4 (~1859 ppb) reached 257% of the preindustrial level (~722 ppb) due to increased emissions from anthropogenic sources and, at present, is increasing by 7 ppb percent year [4]. In addition, as a consequence of increasing CH4 concentrations, global atmospheric temperature will rise by 1.5–4.8 °C by the end of this century [1]. Terrestrial freshwater has been well documented as a major source of atmospheric CH4. The global CH4 emission rate from global freshwater is estimated to be 26.8–103.3 Tg yr−1, accounting for a significant share of 50% of anthropogenic CH4 emissions to the atmosphere [5,6,7]. However, recent studies have shown that CH4 emissions from freshwater are the most uncertain component of this current estimate of terrestrial freshwater systems, primarily due to the small amount of data, limited geographic distribution of measurements, and the great diversity of hydrology and climates across terrestrial freshwaters [3,8], particularly in the riverine types, which vary in terms of different CH4 emissions under different river systems [9]. Therefore, more comprehensive data from riverine areas are required to accurately represent, within global CH4 budgets, the continental CH4 fluxes associated with terrestrial rivers.
Across the world, rivers are impacted by urbanization and industrialization, and they are generally highly variable in terms of CH4 emissions [10,11,12]. Up to now, few measurements of CH4 fluxes from rivers impacted by agriculture (rice paddies) have been reported, despite being an anthropogenic source of CH4 [8]. Previous studies have shown that CH4 emissions from riverine areas are close to levels of organic material and nutrient inputs [7,8,13], whose high nutrient levels (available carbon and nitrogen) and sediment loads can synergistically enhance the activity of microorganisms [14] and, as a consequence, these environments contribute significantly to CH4 emissions. Rivers draining into agricultural watersheds, particularly in rice cultivation, increase the availability of nutrients in rivers via drainage, leaching, runoff, and soil erosion more easily than with rivers that are unaffected by agriculture [15]. Previous studies have suggested that organic carbon (DOC), ammonium nitrogen (NH4+–N), and nitrate nitrogen (NO3–N) have increased from the river draining rice paddy watershed with the increase of Strahler stream order [16,17]. Recent research has attempted to quantify irrigation-induced CH4 emissions in the rivers draining into rice paddy watersheds and those that are not impacted by agriculture [8]; however, they exhibit wide variations. Therefore, further investigation is recommended on CH4 emissions from rivers impacted by agriculture as a key promoter of climate change.
Given that terrestrial freshwater is an important potential source of atmospheric CH4 and plays a significant role in global CH4 budgets, the pathways of CH4 production have therefore received an increasing amount of attention [18]. CH4, produced naturally in the sediment under anaerobic conditions via microbial processes, can be transported to the atmosphere by molecular diffusion, bubble ebullition, and plant-mediated transportation [6]. Numerous studies have reported the pathways responsible for CH4 production in terrestrial freshwater, which include fermentation of acetate and reduction of carbon dioxide [18,19]. Numerous studies have demonstrated that the pathways of CH4 production are affected by temperature, acid concentration, pH, and nutrient levels [18,19,20,21,22]. At a low acetate concentration (50 mmol L−1), acetoclastic methanogenesis dominated, regardless of the ammonium concentration, while at higher acetate concentrations (150 and 250 mmol L−1) and at low–medium ammonium levels (1–4 g N L−1), hydrogenotrophic methanogenesis dominated [19]. Surveys such as those conducted by Holmes et al. (2013) [18] showed that in nutrient-poor soil, amounts of CH4 were produced via acetate fermentation, while at the nutrient-impacted site, the proportion of CH4 produced via hydrogenotrophic methanogenesis increased from 25% to 50%.
China is now the second largest region for rice cultivation and the largest producer of rice in the world, accounting for approximately 20% the world’s rice-producing area and 28.1% of global rice production [23,24,25]. Simultaneously, a consequence of extensive rice cultivation, China is the country with the largest amount of irrigation in the world [23]. In addition, China also has one of the largest amounts of pig breeding in the world, with approximately 42,800 pigs situated there in 2018 [26]. However, Hunan, a central province of China, is a traditional and major area of rice cultivation and grain production, and it has the second largest annual output of pigs in China [27]. In order to increase the crop grain yields draining into a subtropical rice paddy in China, large amounts of nitrogen fertilizer and frequent irrigation are applied in the rice paddies. However, excessive use of nitrogen has led to decreasing nitrogen use efficiency, and unused N from drainage and runoff flows may be transported to rivers and increase sediment loading and nutrient enrichment, resulting in water pollution and CH4 emissions [16,17,28,29]. Rice paddies have been identified as a source of atmospheric CH4, and as much as 50% of dissolved CH4 in soils and drainage water can also be transported into rivers that are draining into rice paddy watersheds [29,30]. Moreover, livestock and poultry breeding can annually produce as many as 380 million tons of manure and wastewater and may contribute 1.78–2.68 Tg CH4 yr−1 outgassing to the atmosphere in China [31,32]. Moreover, when high carbon and nitrogen inputs change dissolved oxygen, pH, and microbial activity and population structures in soils and water, the pathways of CH4 production will change dramatically [14,18,33,34]. Unfortunately, rivers impacted by agriculture (rice planting and livestock breeding) as an anthropogenic source of CH4 are poorly represented in the subtropical region, China, particularly in the pathways of CH4 production. However, up to now, the above situation is still uncertain.
Therefore, to clarify CH4 diffusive fluxes in rivers draining into a rice paddy watershed affected by agriculture, a 10-month field measurement was undertaken to examine the effects of anthropogenic activities on CH4 diffusive fluxes in Changsha, Hunan Province, China. In the present study, CH4 emissions were measured by the headspace balance method and the diffusion model method. The main objectives of this study were first to capture spatiotemporal variations in dissolved concentrations and diffusive fluxes of CH4 from rivers draining into rice paddy watersheds. Then, we aimed to examine the dependence of CH4 diffusive fluxes on water parameters and nutrients. Finally, we also attempted to reveal the main pathway of CH4 production in terrestrial rivers impacted by agriculture.

2. Materials and Methods

2.1. Experimental Sites

The Tuojia River, a tributary of the Xiangjiang River, represents a typical river impacted by agriculture in subtropical central China. The study is located in Changsha, Hunan Province, China (112°56′–113°36′E, 27°55′–28°40′ N), with a 52.10 km2 area and an elevation ranging from 56 m to 434.8 m above sea level from the estuary to headwaters [35]. The experimental area represented a typical subtropical humid monsoon climate, with an annual mean air temperature of 17.2 °C and precipitation of 1300 mm. Most of the rainfall occurs from April to July due to moist summer monsoons, with the precipitation in this period accounting for approximately 70% of the total annual rainfall. The study area is a typical hilly, agricultural catchment in subtropical central China, where forest and paddy fields are the main land use types, accounting for 33% and 61.1% of the total catchment area, respectively [36,37]. The experimental area has been dominated by paddy rice-cropping systems for hundreds of years, with high amounts of organic materials and nitrogen fertilizer inputs (typically applied at a fertilization rate of ~374 kg hm−2 yr−1) [27]. In general, early rice is planted in mid-April and harvested in mid-July, while late rice is planted in late July and harvested in late October in the experimental area. Midseason drainage and moist irrigation episodes are currently practiced in rice paddies. In addition, the whole catchment area has a population of approximately 28,000, and the 60 farmers and urban residents surveyed have approximately 500 poultry and 500 pigs [35]. Of specific interest is the density of average breeding being as high as 3.46 AU hm−2 [27]. Moreover, there are dense settlements and scattered small factories and livestock farms along the river valley. The sampling area is about 10 km from upstream to downstream of the river, the water body is 5 m wide, and the water depth ranges from 0.1 m to 1 m.

2.2. Sample Design and Collection

Surface water samples were collected weekly at 20 cm below the surface from the Tuojia River over a 10-month period (April 2015 to January 2016) and analyzed for dissolved CH4 concentrations and other water parameters. According to the grading characteristics of the river system and land use types of the catchment, four order reaches were identified along the Tuojia River (S1, S2, S3, and S4) from the origin to the estuary, and twelve locations (Figure 1) were selected for sampling along the four reaches, with every three locations representing the upstream, midstream, and downstream section in each reach, respectively. The four reaches were S1, S2, S3, and S4, in which S1 included numbers 1, 2, and 3, S2 included numbers 4, 5, and 6, S3 included numbers 7, 8, and 9, and S4 included numbers 10, 11, and 12 [36].
To prevent the temperature being able to affect CH4 emission rates and other parameters, water samples were taken from the Tuojia River using a bucket within the 09:00–11:00 period (UTC + 8). Three replicate water samples were transferred from the bucket to sample bottles and medical syringes to avoid bubbling from the dissolved methane and nutrient elements analyses, respectively. Samples for determining ammonium (NH4+–N), nitrate (NO3–N), and dissolved organic carbon (DOC) concentrations were collected using 300 mL serum bottles, while samples for dissolved CH4 analysis were collected in 60 mL medical syringes. Then, 0.5 mL of saturated HgCl2 solution (10 mg L−1) was added to the water samples to stop biological activity [38]. At the same times and locations, several auxiliary measures were taken in parallel with the water samples including river temperature, dissolved oxygen (DO), pH value, and salinity by a calibrated portable handheld meter (Thermo Scientific, Singapore). The wind speeds were obtained by a wind monitor at about 10 m above the river surface. Immediately after sample collection, all syringes and bottles were sent to a laboratory for analysis within 3 hours. If they were not analyzed on the same day, the samples were stored in the dark at 4 °C until required for analysis.
In July and August of 2016, we investigated 60 local farmers and community and village committees and obtained information from the Tuojia River Catchment on population, livestock, poultry, agricultural production, and other relevant information.

2.3. Dissolved CH4 Concentration

The headspace equilibrium method was used to measure the dissolved CH4 concentrations. The 30-mL water samples in the syringes were accurately replaced by 30 mL of ultrahigh-purity helium gas (>99.999%) in the lab and were subsequently shaken for 10 minutes (on an oscillator) before standing for 5 minutes so the samples could reach equilibrium. Gases in the headspace were then manually and gently injected into a pre-evacuated vial (12 mL, Labco, UK) and automatically analyzed within 72 hours of collection by using a gas chromatographer (Agilent 7890A, USA) equipped with a Flame Ionization Detector (using 99.999% N2 as the carrier gas) and a microelectron capture detector (using 99.999% N2 and 10% CO2 + 90% N2 as the carrier gas and backup gas, respectively). The accuracy of the CH4 and N2O measurements were within ±3% and had detection limits of ~0.001 μg L−1 and ~0.0008 μg L−1, respectively.

2.4. CH4 Diffusive Fluxes

Exchange fluxes of CH4 from river water bodies to the atmosphere were estimated by the double-layer diffusive model method, as previously reported by Liss & Merlivat (1986) [39] (their Equation (1)) [40] (Zhang et al., 2016). The original CH4 concentration before equilibrium was calculated using the headspace balancing method, where the diffusive flux was calculated based on an estimation of the gas exchange rate (Kw) by using the wind speed (U10) with the Schmidt coefficient (Sc) [41] (Table 1). The detailed calculation processes for dissolved CH4 concentration and its exchange flux is provided in previous studies and presented briefly here:
F = c · K w C o b s   C e q
where F is the diffusive flux of CH4 between the water surface and the atmosphere (μmol m−2 h−1), c is a dimensional coefficient, Kw is the gas exchange rate of CH4 from the water surface to the atmosphere (cm S−1), Cobs is the dissolved CH4 concentration in the surface water before equilibrium (μmol L−1), and Ceq is the dissolved CH4 concentration at the balance situation, in which the partial air pressure is equal to the water pressure under the actual water temperature (μmol L−1).

2.5. Environmental Parameters

The determination of the water quality parameters was carried out simultaneously with the collection of the water samples. The dissolved oxygen (DO), water temperature (WT, in units of °C), pH, electric conductivity (EC), and total dissolved solids (TDSs) were measured in situ with a portable multi-parameter water quality instrument (Thermo Scientific, Singapore). The concentrations of nitrate nitrogen (NO3–N) and ammonium nitrogen (NH4+–N) were determined by using a flow injection AA3 HR AutoAnalyser (Seal, Germany), which has a coefficient of variation of 0.2% and a detection limit of 0.003 mg N L−1. The dissolved organic carbon (DOC) content was analyzed with a total organic carbon analyzer (TOC–Vwp, Shimadzu, Japan), which has a detection range of 0–3000 mg L−1 and a limit of 2 μg L−1. The meteorological data were obtained from a weather station installed in the catchment area (InteliMent Adavantage, Dynamax, Inc., USA).

2.6. Statistical Analysis

Statistical analyses were performed using the IBM SPSS 17.0 software package, Excel 2013, and R 2.1.1.1. Linear and nonlinear regressions were applied to test the relationship between the CH4 fluxes and the environmental factors. A one-way analysis of variance was used to examine the effects of the river’s water quality on the CH4 fluxes. This was followed by calculating the least significant difference at the 0.05 significance level.

3. Results

3.1. Precipitation, Air Temperature, and Wind Speed

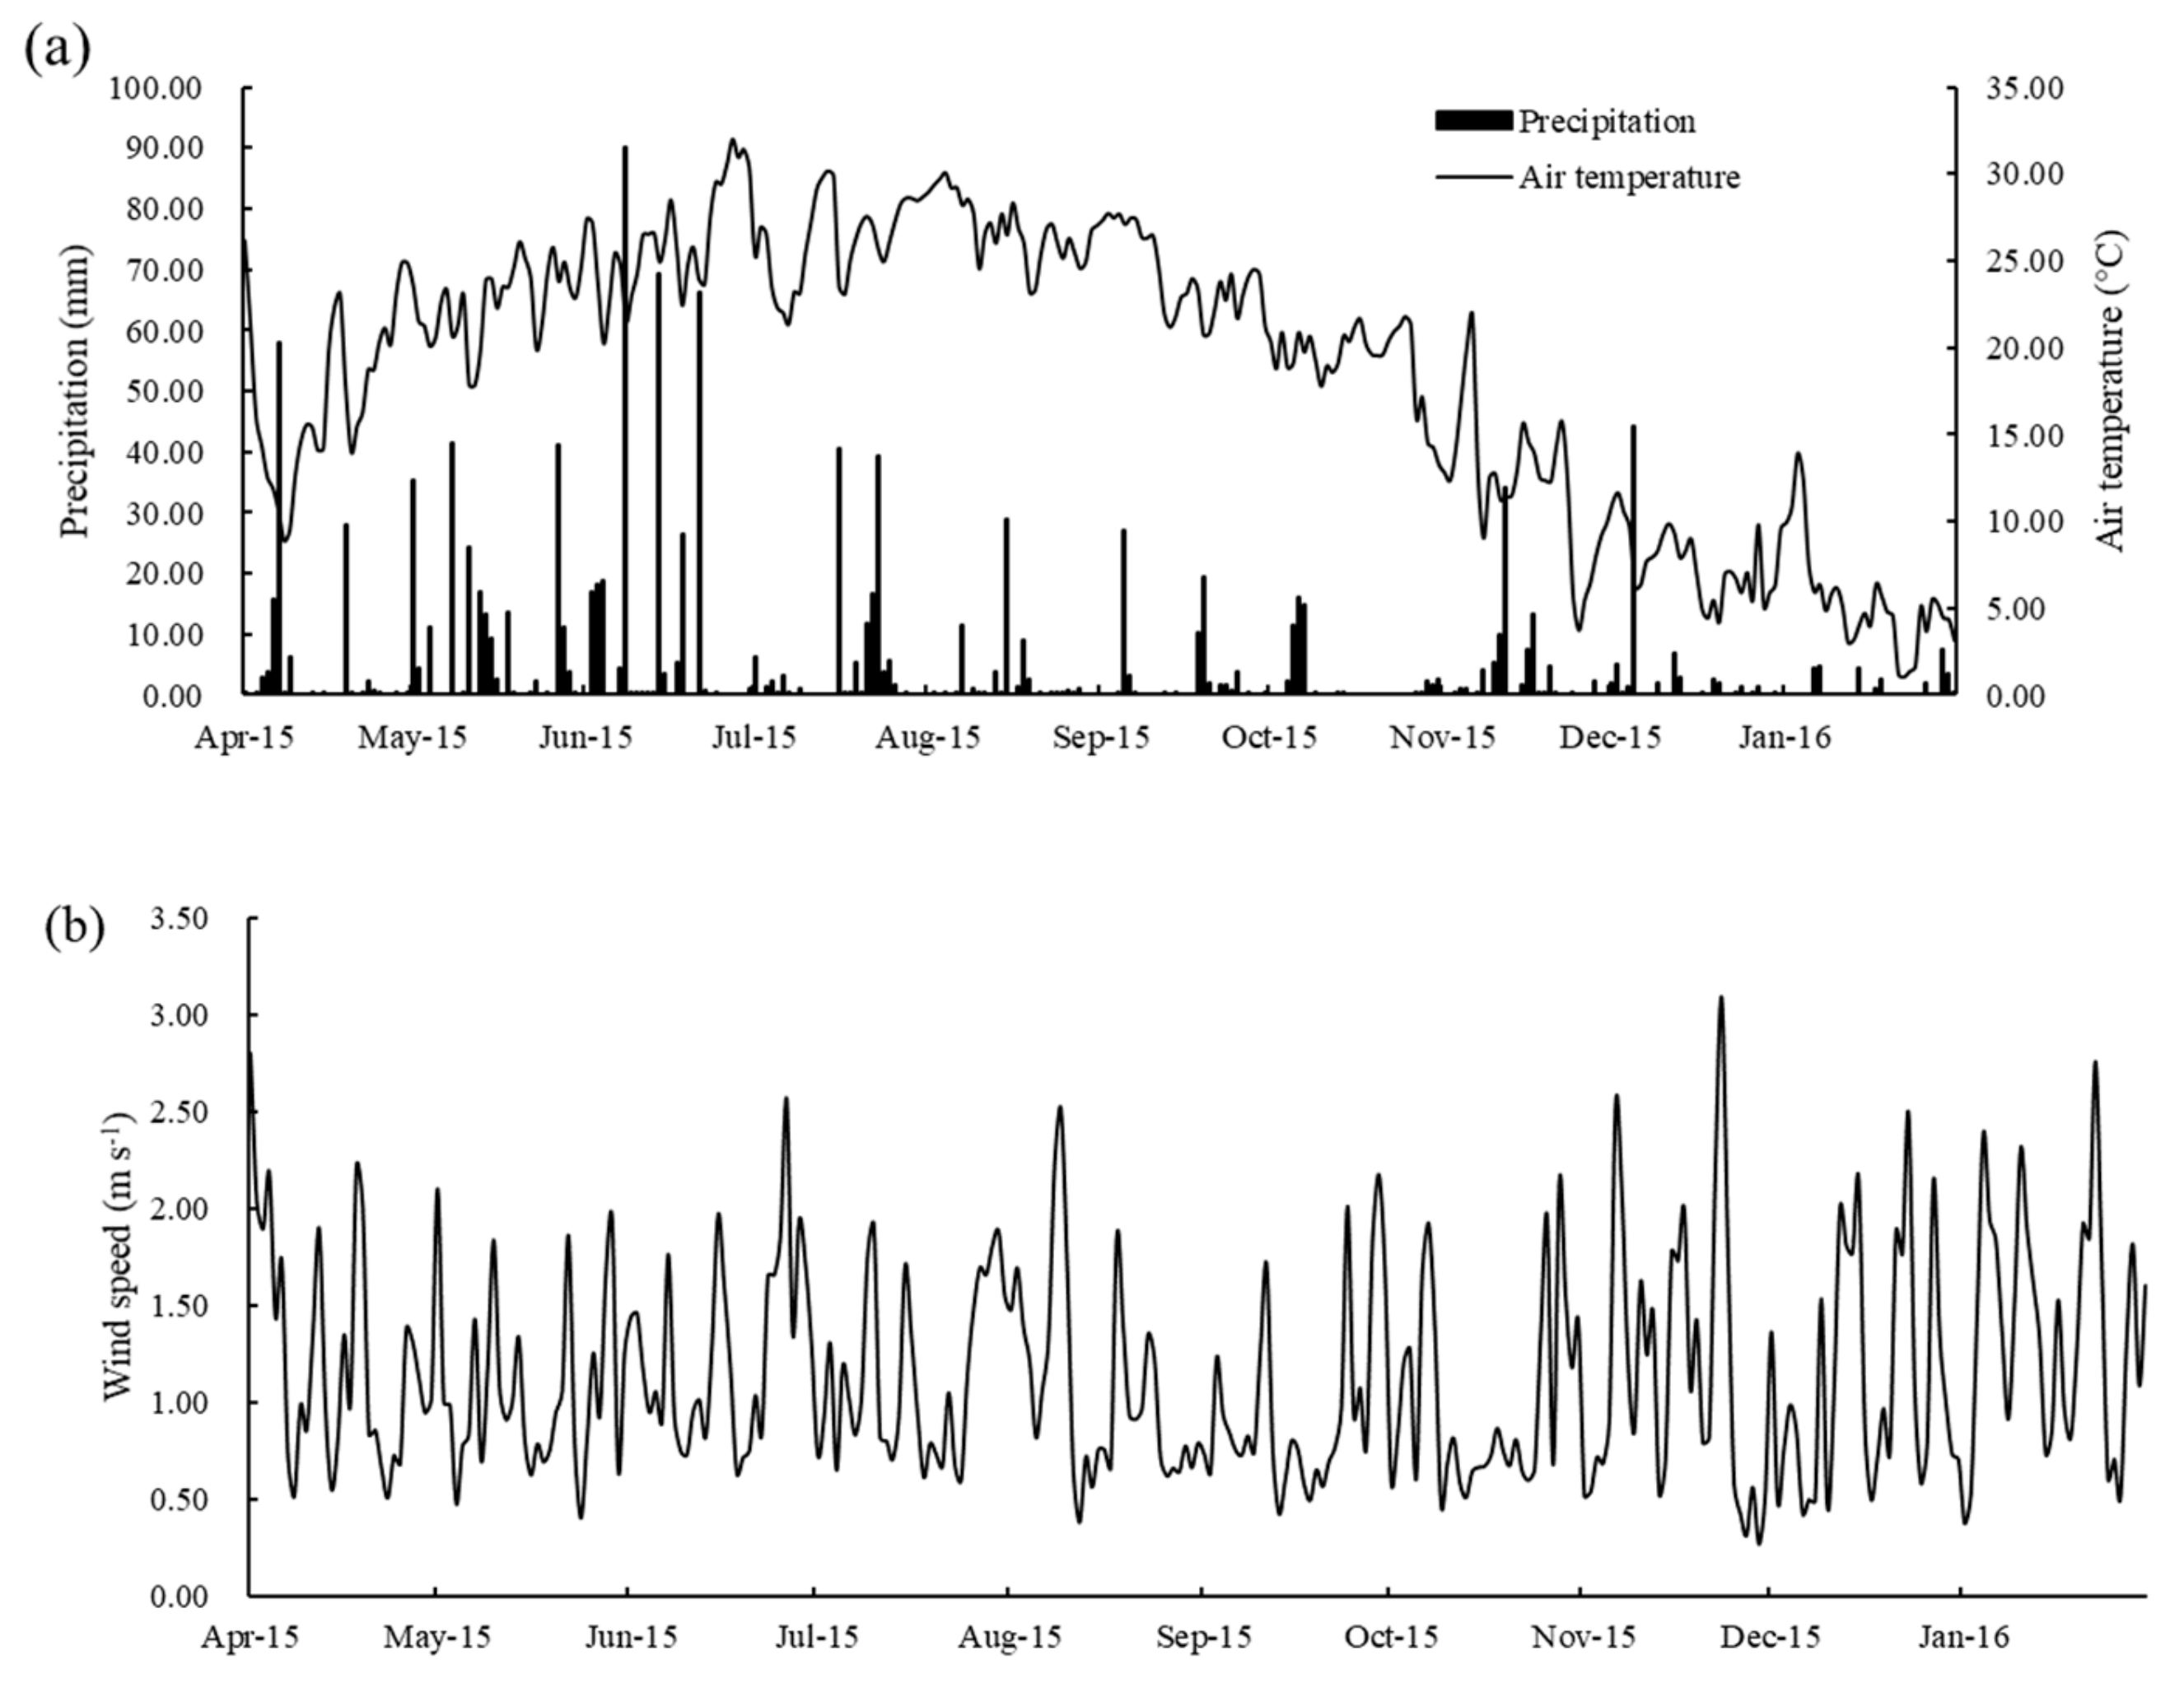
Over the 10 months of the study, the precipitation, air temperature, and wind speed showed clear seasonal patterns. The total precipitation was 1185.59 mm during the experimental period, and the precipitation was mainly concentrated from April to July (Figure 2a). The mean air temperature and wind speed were 18.78 °C and 1.15 m s−1, respectively (Figure 2a–b). There was no significant difference in monthly average wind speed (Figure 2b).

3.2. Water Parameters

Spatially, the average value variations of water parameters are shown in Table 2. Except for pH and water temperature, all other water parameters showed a certain spatial variation difference between the spatial samplings. During the sampling reaches, surface water pH was found to be close to neutral (mean value of 6.83 ± 0.01), with a variation from 6.77 ± 0.07 to 6.88 ± 0.08. Spatial concentrations of dissolved organic carbon (DOC) and nitrate nitrogen (NO3–N) showed similar variation patterns, while dissolved oxygen (DO) was contrary to that of DOC and NO3–N. Across the sampling reaches, concentrations of DOC and NO3−N averaged 2.74 ± 0.09 mg L−1 and 1.55 ± 0.03 mg L−1, ranging from 1.11 ± 0.09 to 3.74 ± 0.19 mg L−1 and from 0.84 ± 0.04 to 1.85 ± 0.05 mg L−1 in S1 to S4, respectively. Over a 10-month period, the mean DO content of 140 measurements was 7.45 ± 0.09 mg L−1 over the four sampling reaches, with the highest at location reach S1 and lowest at location reach S2, and with an average of 8.21 ± 0.12 mg L−1 and 7.03 ± 0.21 mg L−1, respectively. The water temperature fluctuated slightly within the experimental period and the sites, ranging from 18.90 ± 0.51 to 20.06 ± 0.67 °C, showing the highest in S3 and the lowest in S1. The lowest NH4+–N concentration occurred in S1 and the highest occurred in S2, with averages of 0.28 ± 0.05 mg L−1 and 0.90 ± 0.09 mg L−1, respectively.

3.3. Water Quality Parameters and Socioeconomic Data

Socioeconomic survey data in 2016 from the Tuojia River Catchment are shown in Table 3. In the catchment there was a total population of 28,234, with populations of 36, 3863, 2739, and 21,776 in S1, S2, S3, and S4, respectively. Pig and poultry quantities were highest at location S2, with values of 426 and 365, respectively. As for the paddy rice-cropping area, the average applied rate of nitrogen fertilizer was 142.5 kg ha−1 during the rice-growing season. Unfortunately, we did not succeed in obtaining information on pigs, poultry, synthetic and nitrogen fertilizers in S1, and pigs and poultry in S2.

3.4. CH4 Concentration and Flux

Spatiotemporal variations of dissolved CH4 concentrations and diffusive fluxes are shown in Figure 3 and Figure 4, respectively. The dissolved CH4 concentrations varied widely at the four order reaches monitored during the experimental period, with the maximum value of dissolved CH4 concentration with 3.01 µmol L−1 at location S2 on July 11, 2015 and the minimum with 0.004 µmol L−1 at location S2 and S1 on January 16, 2016. Simultaneously, we found that significant differences between dissolved CH4 concentrations were affected by the sampling time, with the highest in the late rice growing period (August to October 2015), followed by the early rice growing period (April to July 2015) and the fallow period (November 2015 to January 2016). Spatially, the sampling position also had a significant effect on the dissolved CH4 concentrations. In general, the spatial distribution of dissolved CH4 concentrations increased volatility with the sampling position from the estuary to the river’s source. As a comparison, from upstream to downstream, the average observed dissolved CH4 concentrations were 0.17 ± 0.01, 0.54 ± 0.04, 0.45 ± 0.03 µmol L−1, and 0.42 ± 0.03 µmol L−1 for S1, S2, S3, and S4, respectively. It can clearly be seen that the dissolved CH4 concentrations in S1 were significantly lower than the other reaches from all the experimental data above (Figure 3, p < 0.05).
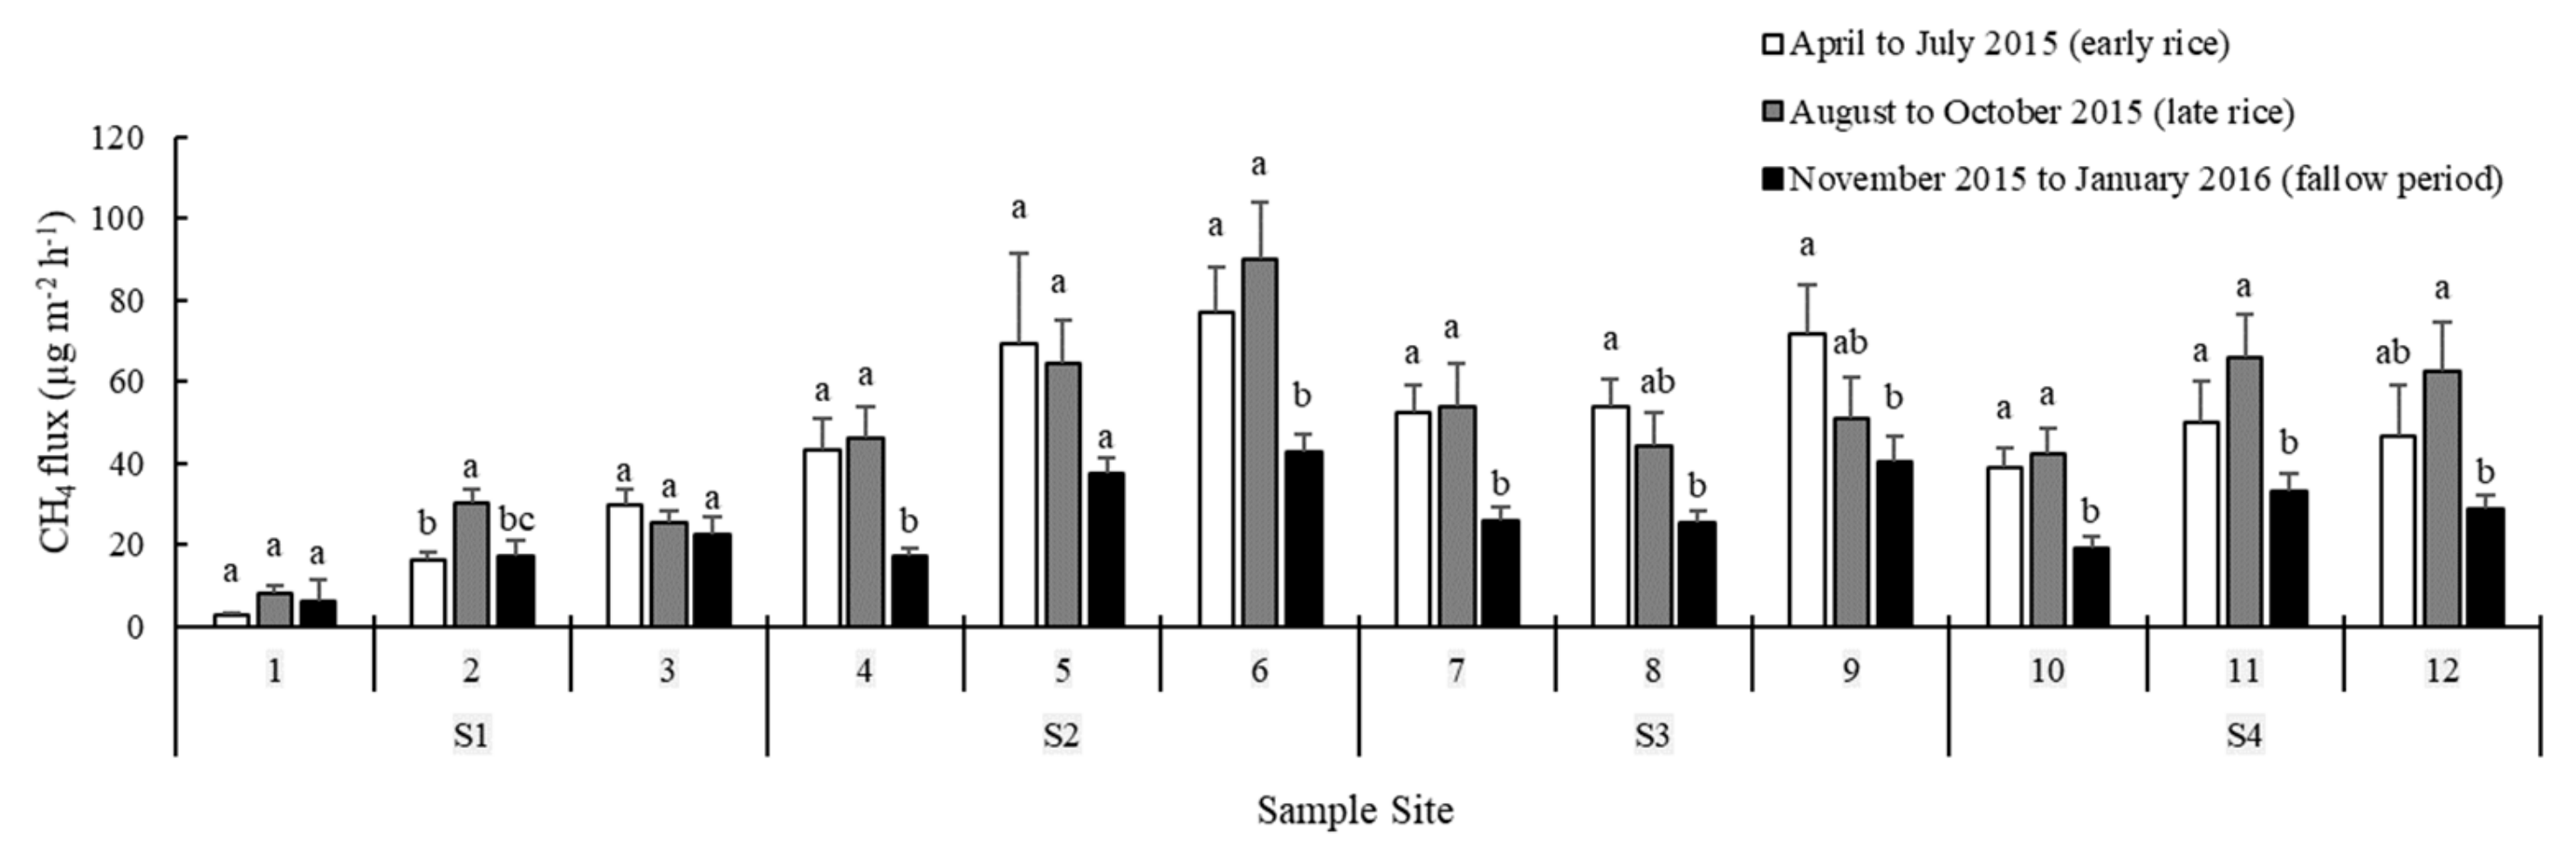
According to the dissolved CH4 concentrations from S1 to S4, the river to the atmospheric CH4 diffusive fluxes were estimated with the double-layer diffusion model method. The sampling period and position also had significant effects on CH4 diffusive fluxes. Similarly, in the present study, we also found that CH4 diffusive fluxes had the same variation patterns as dissolved concentration variation. Among the sampling sites at the four reaches, the diffusive flux of CH4 was also at its highest value in reach S2 on July 11, 2015, and the lowest value occurred in reach S1 on January 16, 2016, with an average of 167.26 ± 79.89 and 5.91 ± 2.99 µg m−2 h−1, respectively (Figure 4b). The average CH4 diffusive fluxes were 55.56 ± 4.32, 47.70 ± 3.01, and 43.92 ± 3.14 µg m−2 h−1, in reach S2, S3, and S4, which was significantly higher by 215.99%, 171.26%, and 149.77% than S1, respectively. In addition, except for reach S1, the CH4 diffusive fluxes were significantly higher during the early and late rice-growing seasons of S2, S3, and S4 compared with those during the fallow period. Nevertheless, there was no significant difference between the early rice and late rice seasons (Figure 4 and Figure 5, p < 0.05).

3.5. Dependence of CH4 Fluxes on Water Parameters

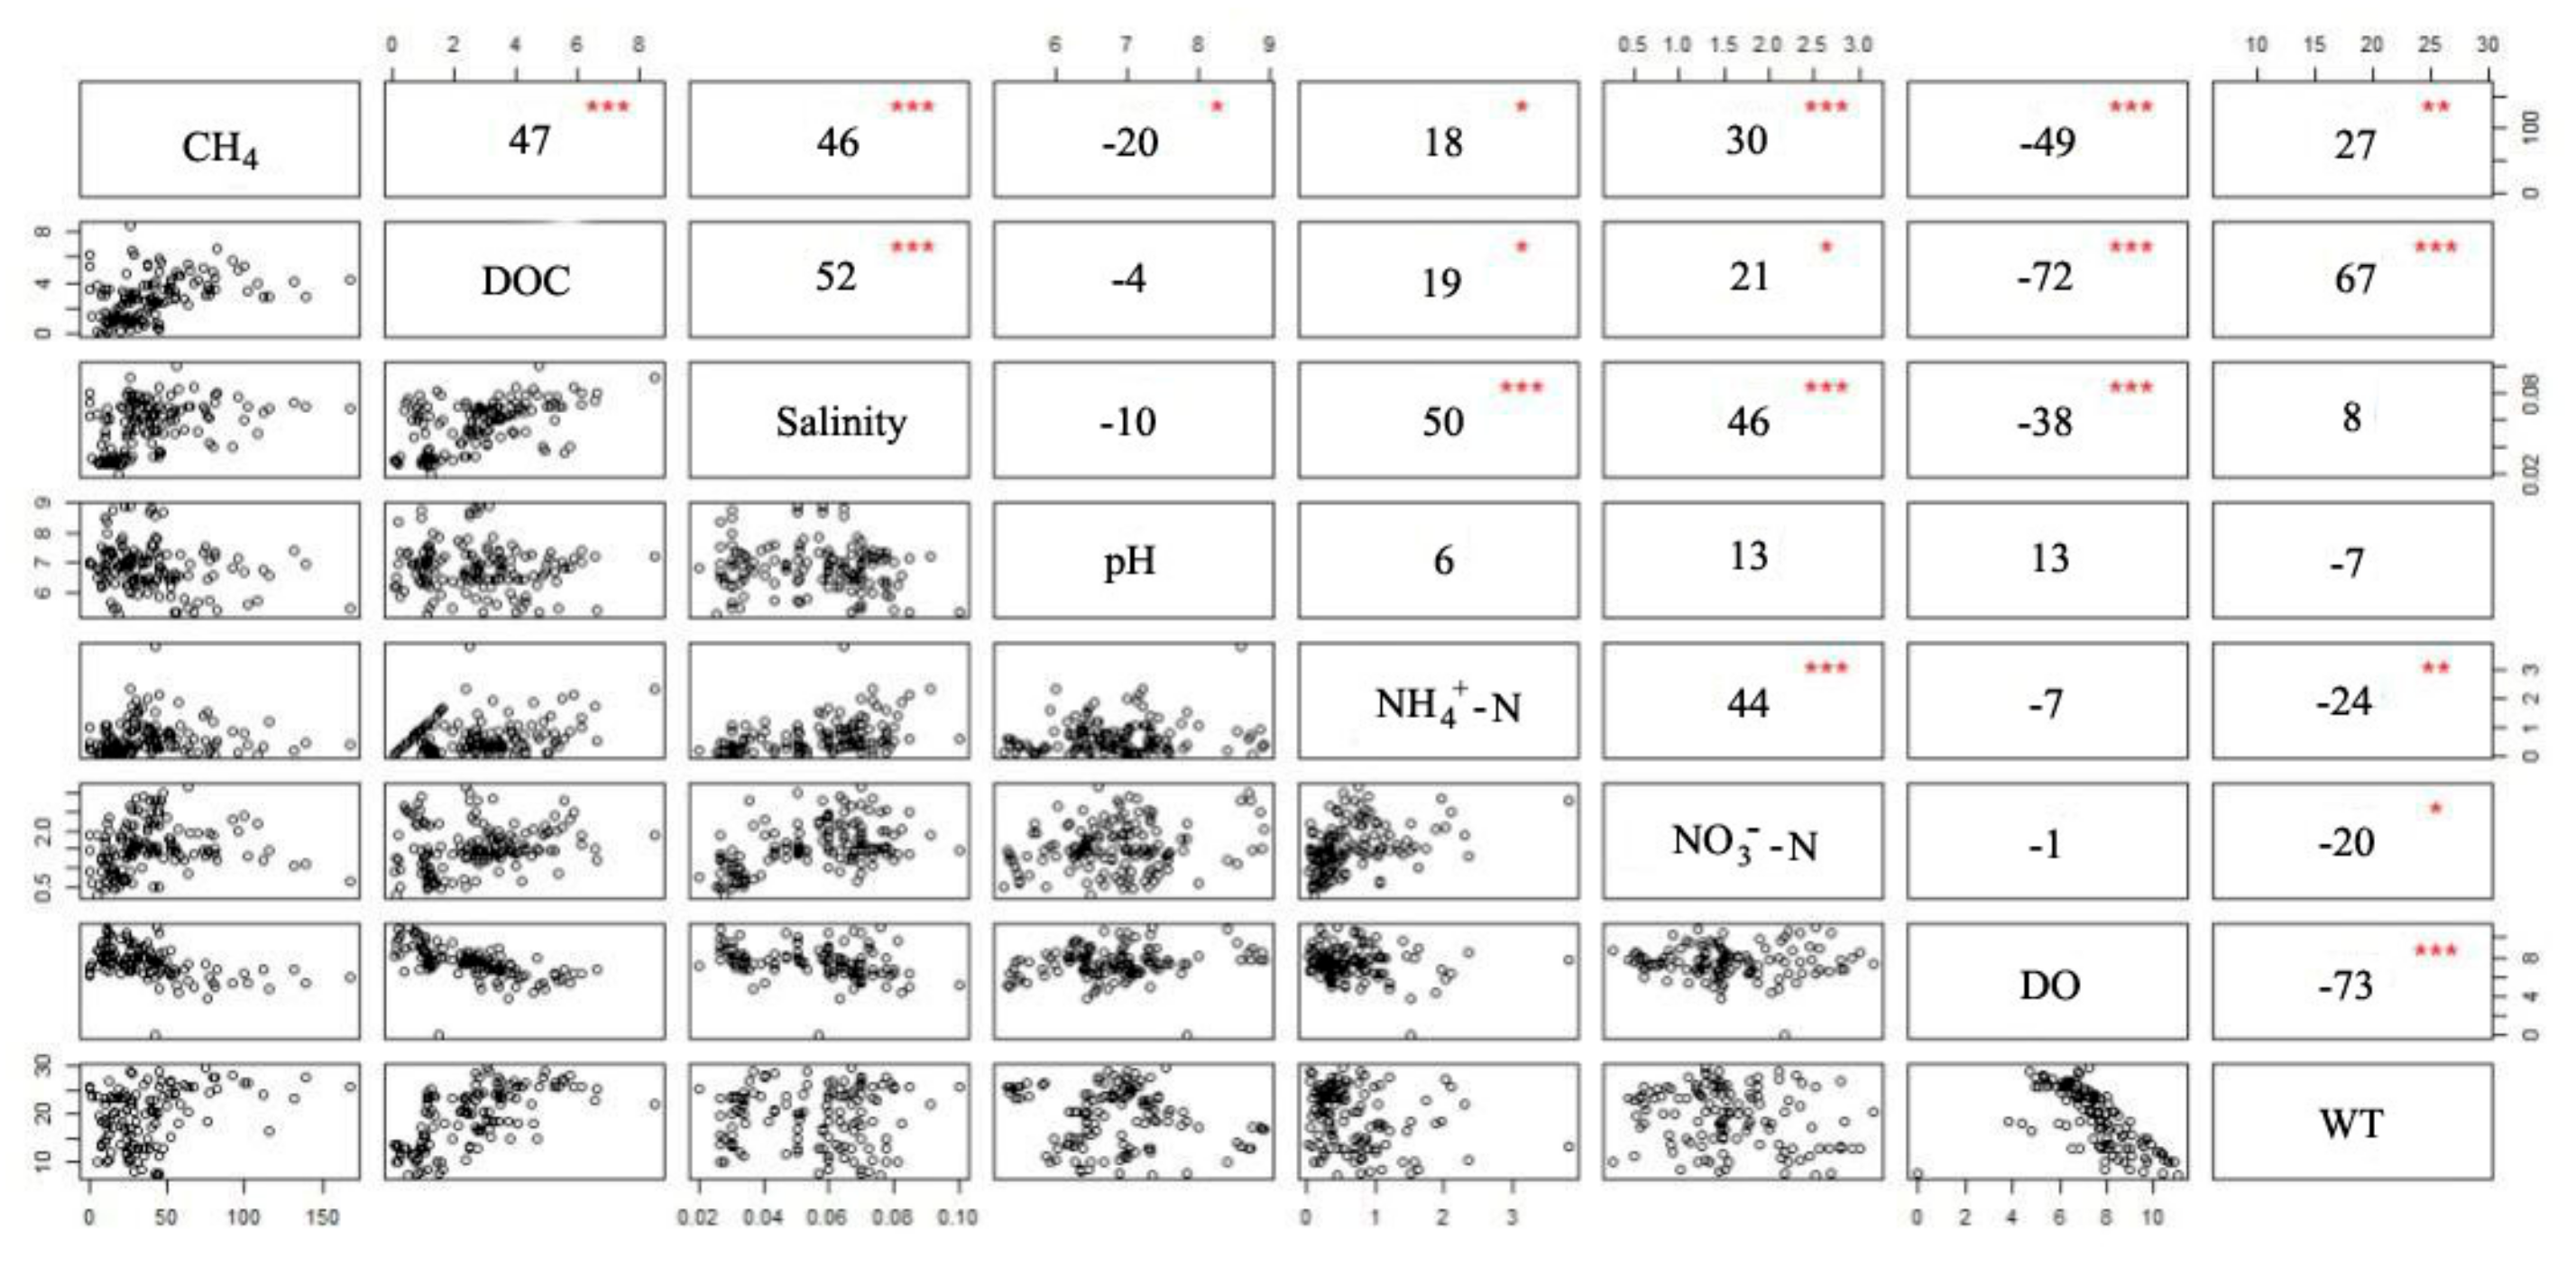
Numerous studies have demonstrated that the CH4 fluxes were inevitably affected by water quality (e.g., DOC, NH4+–N, NO3–N, DO, pH value, and water temperature), which affects the production, oxidation, and transport of CH4. By pooling measurements over the 10 months, the CH4 diffusive fluxes were positively related to DOC (r = 0.47, p < 0.001), salinity (r = 0.46, p < 0.001), and temperature (r = 0.27, p < 0.01), while they were negatively related to DO concentrations (r = −0.49, p < 0.001) and pH value (r = −0.20, p < 0.05) (Figure 6).

3.6. CH4 Production Pathway

Acetate fermentation and carbon dioxide reduction have been identified as the main processes responsible for the production of CH4 in rivers. In our case river, we found that acetate fermentation accounted for over 80% of CH4 production, while carbon dioxide reduction only accounted for 20% (Table 4) [38].

4. Discussion

4.1. Comparison with Other Studies

The dissolved concentrations and fluxes of CH4 from rivers draining into rice paddy watersheds, such as those studied here, have received less attention than concentrations and fluxes of CH4 in other freshwater ecosystems, particularly rivers impacted by urbanization and industrialization. Encouragingly, recent studies have begun to fill in this knowledge gap in a number of rivers impacted by agriculture [8,34], providing an opportunity for us to place our results in a larger context. In the present study, the positive values of CH4 diffusive fluxes implied that the Tuojia River draining into rice paddy watersheds could be an atmospheric source of CH4, which agreed with the findings of a large number of studies reported previously [34,43,44,45]. A considerable amount of research has been reported on CH4 emissions from river networks, and concentrations and fluxes ranged from 0.002 to 150 μmol L−1 and 17.70 to 4016.67 µg m−2 h−1 [10,13,40,45,46], respectively, and our findings were generally within the ranges that have previously been reported in rivers. Compared with previous studies by Koné et al. (2010) [44], Teodoru et al. (2014) [45], and Borges et al. (2018) [34], CH4 concentrations in this study were significantly greater than the above results, which may mainly be due to the high nutrient loading (DOC and NH4+–N), sedimentation, and algae blooms impacted by agricultural fertilizer applications being able to stimulate methanogenesis in rivers draining into rice paddy catchments [8,16,47]. In addition, exogenous CH4 inputs were another reason for the higher CH4 concentrations in this catchment than what had previously been reported in rivers not impacted by agriculture. High dissolved CH4 in wastewaters that were directly transported to the rivers by surface runoff, drainage flows, and sewage pipelines may contribute to high CH4 concentrations [8,38,48]. However, compared with the Lixiahe River, a river draining into a subtropical rice paddy catchment, the CH4 diffusive fluxes (mean of 41.19 µg m−2 h−1) were significantly lower by one to two orders of magnitude than what had previously been reported (3.50 mg m−2 h−1) [8]. One possible important reason for this was the great diversity in topography, discharge, river flow velocity, and irrigation frequency between the Tuojia River agriculture catchment and the Lixiahe River agriculture catchment [8,34,49].

4.2. Spatiotemporal Variation in CH4 Fluxes

The spatial position of the sampling sites had significant effects on CH4 diffusive fluxes (Figure 4). Similar to the results from Stanley et al. (2016) [7] and Zhang et al. (2016) [40] reported previously, our findings also showed that CH4 diffusive fluxes were at their lowest values in reach S1, their highest values in reach S2, and the values decreased in a downstream direction in reaches S3 and S4. The spatial pattern of CH4 diffusive fluxes was generally in agreement with those of DOC, NH4+–N, and NO3–N, but in contrast with DO (Table 2, Figure 4, and Figure 5). The highest CH4 diffusive fluxes at location S2 could be primarily ascribed to the nutrient and sediment loads though drainage water, soil erosion, and runoff directly flowing into the S2 reach. Over the 10-month period, the average NH4+−N concentration in S2 was 221.43%, 85.71%, and 82.14% higher than those of S1, S3, and S4, respectively. Theoretically, methanogenic archaea usually depend on NH4+ as a direct nitrogen source [50], and NH4+, whose chemical structure resembles that of the CH4 molecule, can interfere with the oxidation of CH4 because NH4+ competes with CH4 for CH4 mono-oxygenase, the key enzyme of CH4 oxidation [51]. CH4 production is strongly controlled by DOC content in river, which suggests that the amount of the CH4 was produced by organic carbon in anoxic river reaches [40]. The water DOC concentrations generally enhanced with an increase in Strahler stream order, where DOC in S2 was higher than that of S1 by 153.15%. Data from surface water show a significant and positive linear relationship between CH4 diffusive fluxes and DOC content, with an effect (r = 0.47, p < 0.001) similar to what Stanley et al. (2017) [7] and Borges et al. (2018) [34] had reported previously. Exogenous DOC inputs caused by rice cultivation and livestock and poultry breeding (Table 3) can decrease the effect of several river microbial processes on their electron donors, resulting in enriched methanogens activity and stimulating more CH4 production [52]. In addition, increased DOC can enable river aerobic microorganisms to consume more oxygen (O2), with the result of the oxidation process being limited to producing a positive effect on CH4 emissions. Theoretically, the production and consumption of CH4 occur simultaneously under the action of methanogenic archaea and methane-oxidizing bacteria, and the balance of the two processes determines the CH4 flux [53,54,55]. However, water DO plays an important role in the balance of the two processes. Surveys such as those conducted by Kuivila et al. (1989) [56] showed that the carbon cycle in oxic rivers assumes CH4 production in the sediments and oxidation when CH4 diffuses from the sediments into the water column. Most CH4, however, was oxidized by communities of epiphytic methanotrophs when passing through the oxic water-air interface [57]. Studies previously reported that most of emitted CH4 can be oxidized from a surface water column to the atmosphere [58,59] (Moreover, Reeburgh et al. (2007) [60] suggested that the value may reach a value as high as 90%. In our case river, we concluded that surface water CH4 diffusive fluxes in S2 were higher than in the other reaches and were well predicted by DO (r = −0.49, p < 0.001). Lower DO not only reduced CH4 oxidation from the water column into the atmosphere but also lowered the redox potential in the sediments, resulting in an increase in CH4 production potential and the conversion efficiency of a substrate into CH4, which in turn facilitated CH4 emissions [37,40,61]. In addition, our river contained higher amounts of dissolved CH4 in the wastewater from livestock and poultry farming. Particularly, pig manure wastewater was transported into the reach in S2, resulting in CH4 fluxes in this reach being higher than in other reaches [31,49]. Therefore, we concluded that higher concentrations of DOC and NH4+–N, lower DO, and exogenous inputs were the main causes of the CH4 diffusive fluxes in reach S2.
CH4 diffusive fluxes were also strongly affected by the sampling period (Figure 4). The seasonal dynamics of CH4 diffusive fluxes from the rivers were typically characterized by a pattern in which CH4 diffusive fluxes were the lowest in the winter and the highest in the summer (Figure 5). One possible explanation for this was the remarkable difference between ambient variants and nutrients in the rice-growing season and the fallow period [17,30]. Based on a two-year monitoring study of the Lixiahe River affected by agriculture in Jiangsu Province, China, Wu et al. (2019) [8] also showed that CH4 diffusive fluxes during the rice-growing season (June to October) were higher than those in the winter (December to January), and they further pointed out that the differences were attributed to the higher organic and nutrient loading in the rice-growing season.
During the rice-growing seasons, synthetic fertilizers and nitrogen fertilizer are applied at a rate of 580.35 kg ha−1 and 142.5 kg ha−1, respectively (Table 3). However, the utilization efficiency of nitrogen fertilizer in farmland soil is only 30%–40% [62]. Therefore, this low efficiency and high input plantation mode caused the amount of the unutilized nitrogen to be transported into the river channel through drainages, irrigation, and surface runoff, resulting in enriched organic and nutrient loading and depleted water O2 in the water and sediment [8,10,16,34]. High nutrient levels were corrected with elevated microbial activity and CH4 production [63,64]. Surveys such as those conducted by Li et al. (2018) [30] showed that CH4 fluxes were higher in the rice-growing seasons than in the fallow period; however, Wu et al., (2019) [8] also stated that drainage could greatly reduce CH4 emissions from rice paddies in this period, with values as high as 50% [29]. Noticeably, this reduction could be offset by increased CH4 emissions as a consequence of nutrient enrichment and sediment loading in rivers draining into rice paddy watersheds [8]. Therefore, the exogenous inputting of CH4 was also one of the reasons for the higher CH4 diffusive fluxes in the river during the rice-growing seasons.
The dissolved CH4 concentrations increased with water temperature (Figure 4), suggesting that methanogenic archaea were sensitive to temperature [65]. Previous studies indicated that as temperature increased by 10 °C, the methanogen reproduction rate doubled and the CH4 emission rate increased by 2.4 ± 1.0 mmol m−2 d−1 [65]. Specifically, when the temperature decreased from 30 °C to 15 °C, the CH4 production rate was sharply reduced [66]. Moreover, a higher temperature also increased the KW value, resulting in a faster transfer of CH4 from the surface water column to the atmosphere [67]. Therefore, as a consequence of higher CH4 diffusive fluxes in rice-growing seasons, mainly due to the intense nutrient and sediments loads, high water temperatures and low O2 availability in the river stimulate more CH4 production [8]. In addition, precipitation not only increased greenhouse gas concentrations by flushing inorganic and organic carbon from the landscape into stream [38,68] but also caused an “initial scouring” effect by precipitation facilitating a high diffusive rate of CH4 in rivers [69]. In Figure 2, Figure 3 and Figure 4, we found that the variation of CH4 diffusive fluxes was generally in agreement with precipitation.

4.3. CH4 Production Pathways

The fermentation of acetate (acetoclastic methanogenesis) and reduction of carbon dioxide (CO2, hydrogenotrophic methanogenesis) have been identified as the two main pathways for CH4 production in terrestrial freshwater [18,19]. Previous studies have reported that approximately 70% of the CH4 produced can be attributed to acetate fermentation, while carbon dioxide reduction accounted for only 30% [19,70,71]. The findings of the present study were in line with those of Conrad (1999) [70] and Whiticar (1999) [71], which produced CH4 observed mean values of 80.5% by acetate fermentation and 19.5% by carbon dioxide reduction. The pathways of CH4 production were affected by ambient variants and nutrient loads (e.g., temperature, pH, acid concentration, and ammonium [18,19,20,21,22]; therefore, the sampling sites had significant effects on the rate of acetate fermentation and carbon dioxide reduction for CH4 production. In our case river, we found that the proportion of acetoclastic pathways in S1 were higher by 9%, 11%, and 6% than S2, S3, and S4, respectively. In contrast, CO2 reduction was lower than other reaches (Table 3). One possible explanation was that most of the CH4 was produced through acetate fermentation [18,19] (not impacted by agriculture in S1 with poor nutrients); at the nutrient-impacted sites (S2, S3, and S4), the larger proportion of CH4 was produced via hydrogenotrophic methanogenesis (Holmes et al., 2013).

5. Conclusions

In summary, this study systematically presented CH4 diffusive fluxes of the Tuojia River impacted by human activities in subtropical agriculture catchments. Our findings supported the general conclusion that the river was a consistent source of atmospheric CH4. Over the 10-month experimental period, we found distinct spatiotemporal variations of CH4 diffusive fluxes along the Tuojia River catchment, which was generally consistent with the nutrient loading pattern of the river water across the drainage basin. A large amount of rice cultivation and livestock breeding could largely explain the observed CH4 diffusive flux patterns of the river flows. As a consequence of the described agricultural practice, concentrations of DOC and NH4+–N increased, DO content in river water decreased, and more CH4 production was stimulated. Therefore, the most valuable conclusion was that the CH4 diffusive fluxes were mainly concentrated in the rice growing season and the nutrient-impacted river reach. Our findings highlighted that an improved understanding of river water exogenous input draining into agricultural catchments will help clarify the influence of human activities on river water quality and help to better constrain the magnitude of CH4 and other GHG diffusive fluxes in agricultural catchments.

Author Contributions

This paper was written by H.W. in collaboration with all co-authors. The experiments were conducted by H.W. and Q.Z. The writing—original draft preparation was written by H.W. The writing—review and editing was written by H.W. and X.Q. The data was analyzed by H.W., D.T., H.G., B.W. and X.C. The conceptualization and methodology for the research experiment were provided by Q.G., Y.L., Y.W., Y.L., G.H., Y.L. and M.F. The project administration and funding acquisition were supervised by X.Q. All authors have read and agreed to the published version of the manuscript.

Funding

The financial support from National Natural Science Foundation of China (41775157, 41475129) and National Key Basic Research Program of China (2012CB417106) are gratefully acknowledged.

Acknowledgments

The authors thank the journal editor and reviewers for their hard work and constructive suggestions.

Conflicts of Interest

The authors declare no conflict of interest.

References

  1. IPCC. Climate Change 2013: The Physical Science Basis. (Contribution of Working Group I to the Fifth Assessment. Report of the Intergovernmental Panel on Climate Change); Cambridge University Press: Cambridge, UK, 2013. [Google Scholar]
  2. Kirschke, S.; Bousquet, P.; Ciais, P.; Saunois, M.; Ganadell, J.G.; Dlugokencky, E.J.; Bergamaschi, P.; Bergmann, D.; Blake, D.R.; Bruhwiler, L.; et al. Three decades of global methane sources and sinks. Nat. Geosci. 2013, 6, 813–823. [Google Scholar] [CrossRef]
  3. Anthony, S.E.; Prahl, F.G.; Peterson, T.D. Methane dynamics in the Willamette River, Oregon. Limnol. Oceanogr. 2012, 57, 1517–1530. [Google Scholar] [CrossRef]
  4. WMO. Greenhouse Gas Bulletin; WMO: Geneva, Switzerland, 2018. [Google Scholar]
  5. Khalil, M.A.K.; Rasmussen, R.A. Sources, sinks, and seasonal cycles of atmospheric methane. J. Geophys. Res. 1983, 88, 5131–5144. [Google Scholar] [CrossRef]
  6. Bastviken, D.; Tranvik, L.J.; Downing, J.A.; Crill, P.M.; Enrich-Prast, A. Freshwater methane emissions offset the continental carbon sink. Science 2011, 331, 50. [Google Scholar] [CrossRef] [Green Version]
  7. Stanley, E.H.; Casson, N.J.; Christel, S.T.; Crawford, J.T.; Loken, L.C.; Oliver, S.K. The ecology of methane in streams and rivers: Patterns, controls, and global significance. Ecol. Monogr. 2016, 86, 146–171. [Google Scholar] [CrossRef]
  8. Wu, S.; Li, S.Q.; Zou, Z.H.; Hu, T.; Hu, Z.Q.; Liu, S.W.; Zou, J.W. High methane emissions largely attributed to ebullitive fluxes from a subtropical river draining a rice paddy watershed in China. Environ. Sci. Technol. 2019, 53, 3499–3507. [Google Scholar] [CrossRef]
  9. Tan, Y.J. The Greenhouse Gases Emission and Production Mechanism from River Sediment in Shanghai; East China Normal University: Shanghai, China, 2017. [Google Scholar]
  10. Rajkumar, A.N.; Barnes, J.; Ramesh, R.; Purvaja, R.; Upstill-Goddard, R.C. Methane and nitrous oxide fluxes in the polluted Adyar River and estuary, SE India. Mar. Pollut. Bull. 2008, 56, 2043–2051. [Google Scholar] [CrossRef]
  11. Yang, L.B.; Li, X.Y.; Yan, W.J.; Ma, P.; Wang, J.N. CH4 concentrations and emissions from three rivers in the Chaohu Lake watershed in Southeast China. J. Integr. Agric. 2012, 11, 665–673. [Google Scholar] [CrossRef]
  12. Liu, K.H.; Hu, Z.B.; Wei, J.Q.; Jiang, Z.; Lu, H.; Wang, C. Analysis of methane flux produced by city black odor river in summer–An example of Chaoyang Creek in Nanjing city, China. Earth Environ. 2015, 43, 415–419. [Google Scholar]
  13. Qu, B.; Aho, K.S.; Li, C.L.; Kang, S.C.; Sillanpää, M.; Yan, F.P.; Aymond, P.A. Greenhouse gases emissions in rivers of the Tibetan Plateau. Sci. Rep. 2017, 7, 16573. [Google Scholar] [CrossRef] [Green Version]
  14. Xiong, Q.L.; Pan, K.W.; Zhang, L.; Wang, Y.J.; Li, W.; He, X.J.; Luo, H.Y. Warming and nitrogen deposition are interactive in shaping surface soil microbial communities near the alpine timberline zone on the eastern Qinghai-Tibet Plateau, southwestern China. Appl. Soil Ecol. 2016, 101, 72–83. [Google Scholar] [CrossRef]
  15. Gong, D.L.; Hong, X.; Zeng, G.J.; Wang, Y.; Zuo, S.M.; Liu, X.L.; Wu, J.S. Prediction of water quality in rivers in agricultural regions typical of subtropical in China using Multivariate Linear Regression Model. J. Ecol. Rural Environ. 2017, 33, 509–518. [Google Scholar]
  16. Wang, Y.; Li, Y.; Liu, F.; Li, Y.Y.; Song, L.F.; Li, H.; Meng, C.; Wu, J.S. Linking rice agriculture to nutrient chemical composition, concentration and mass flux in catchment streams in subtropical central China. Agric. Ecosyst. Environ. 2014, 184, 9–20. [Google Scholar] [CrossRef]
  17. Wu, H.B.; Lyu, C.W.; Li, Y.E.; Qin, X.B.; Liao, Y.L.; Li, Y. The spatial-temporal distribution of nitrogen and N2O emission from soil and sediment in agricultural watershed of Tuojia River. Acta Sci. Circumstantiae 2017, 37, 1539–1546. [Google Scholar]
  18. Holmes, M.E.; Chanton, J.P.; Bae, H.S.; Ogram, A. Effect of nutrient enrichment on δ13CH4 and the methane production pathway in the Florida Everglades. Biogeosciences 2013, 119, 1267–1280. [Google Scholar]
  19. Lü, F.; Hao, L.P.; Guan, D.X.; Qi, Y.J.; Shao, L.M.; He, P.J. Synergetic stress of acids and ammonium on the shift in the methanogenic pathways during thermophilic anaerobic digestion of organics. Water Res. 2013, 47, 2297–2306. [Google Scholar] [CrossRef]
  20. Avery, G.B.; Shannon, R.D.; White, J.R.; Martens, C.S.; Alperin, M.J. Controls on methane production in a tidal freshwater estuary and a peatland: Methane production via acetate fermentation and CO2 reduction. Biogeochemistry 2002, 62, 19–37. [Google Scholar] [CrossRef]
  21. Hines, M.E.; Duddleston, K.N.; Rooney-Varga, J.; Fields, D.; Chanton, J.P. Uncoupling of acetate degradation from methane formation in Alaskan wetlands: Connections to vegetation distribution. Glob. Biogeochem. Cycles 2008, 22. [Google Scholar] [CrossRef]
  22. Hao, L.P.; Lü, F.; He, P.J.; Li, L.; Shao, L.M. Predominant contribution of syntrophic acetate oxidation to thermophilic methane formation at high acetate concentrations. Environ. Sci. Technol. 2011, 45, 508–513. [Google Scholar] [CrossRef]
  23. Wu, K.; Lu, B.; Yuan, Z. The recent developments and the contribution of farmland irrigation to national grain safeness in China. J. Irrig. Drain. 2006, 25, 7–10. [Google Scholar]
  24. Zhang, W.; Yu, Y.Q.; Huang, Y.; Li, T.T.; Wang, P. Modeling methane emissions from irrigated rice cultivation in China from 1960 to 2050. Glob. Chang. Biol. 2011, 17, 3511–3523. [Google Scholar] [CrossRef]
  25. FAO. Statistical databases, Food and Agriculture Organization (FAO) of the United Nations. 2014. Available online: http://faostat.fao.org/ (accessed on 2 March 2020).
  26. Zhu, Z.Y.; Zhang, X.B.; Li, M.X. China’s pork market in 2018 and its prospects for 2019. Agric. Outlook 2019, 4, 6–9. [Google Scholar]
  27. Song, L.F. Characteristic and Influencing Factorings of Nitrogen and Phosphorus Export in Jinjing Town in Changsha County; Huazhong Agricultural University: Wuhan, China, 2014. [Google Scholar]
  28. Seitzinger, S.P.; Kroeze, C. Global distribution of nitrous oxide production and N inputs in freshwater and coastal marine ecosystems. Glob. Biogeochem. Cycles 1998, 12, 93–113. [Google Scholar] [CrossRef]
  29. Zou, J.W.; Huang, Y.; Jiang, J.Y.; Zheng, X.H.; Sass, R.L. A 3-year field measurement of methane and nitrous oxide emissions from rice paddies in China: Effects of water regime, crop residue, and fertilizer application. Glob. Biogeochem. Cycles 2005, 19, 1–9. [Google Scholar] [CrossRef]
  30. Li, J.L.; Li, Y.E.; Wan, Y.F.; Wang, B.; Waqas, M.A.; Cai, W.W.; Guo, C.; Zhou, S.H.; Su, R.S.; Qin, X.B.; et al. Combination of modified nitrogen fertilizers and water saving irrigation can reduce greenhouse gas emissions and increase rice yield. Geoderma 2018, 315, 1–10. [Google Scholar] [CrossRef]
  31. Yuan, M.D. Methanogenesis and Nitrogen Removal in the Biological Stabilization Ponds for Large Scale Swine Wastewater Treatment; Zhejiang University: Hangzhou, China, 2016. [Google Scholar]
  32. Xu, W.Q. Study and Estimation on the Biochemical Methane Potential of Livestock Manure in Anaerobic Digestion; Chinese Academy of Agricultural Sciences Dissertation: Beijing, China, 2017. [Google Scholar]
  33. Tian, D.; Jiang, L.; Ma, S.H.; Fang, W.J.; Schmid, B.; Xu, L.C.; Zhu, J.X.; Li, P.; Losapio, G.; Jing, X.; et al. Effects of nitrogen deposition on soil microbial communities in temperate and subtropical forests in China. Sci. Total Environ. 2017, 607–608, 1367–1375. [Google Scholar] [CrossRef] [Green Version]
  34. Borges, A.V.; Darchambeau, F.; Lambert, T.; Bouillon, S.; Morana, C.; Brouyère, S.; Hakoun, V.; Jurado, A.; Tseng, H.C.; Descy, J.P.; et al. Effects of agricultural land use on fluvial carbon dioxide methane and nitrogen oxide concentrations in a large European river, the Meuse (Belgium). Sci. Total Environ. 2018, 610–611, 342–355. [Google Scholar] [CrossRef] [Green Version]
  35. Wu, H.B. Greenhouse Gas Emission and Transport of Carbon and Nitrogen in Typical River Ecosystem; Anhui Normal University: Wuhu, China, 2017. [Google Scholar]
  36. Qin, X.B.; Li, Y.; Goldberg, S.; Wan, Y.F.; Fan, M.R.; Liao, Y.L.; Wang, B.; Gao, Q.Z.; Li, Y.E. Assessment of indirect N2O emission factors from agricultural river networks based on long-term study at high temporal resolution. Environ. Sci. Technol. 2019, 53, 10781–10791. [Google Scholar] [CrossRef]
  37. Qin, X.B.; Li, Y.E.; Wan, Y.F.; Fan, M.R.; Liao, Y.L.; Li, Y.; Wang, B.; Gao, Q.Z. Diffusive flux of CH4 and N2O from agricultural river networks: Regression tree and importance analysis. Sci. Total Environ. 2020, 717, 137244. [Google Scholar] [CrossRef]
  38. Zhao, Q.; Lyu, C.W.; Qin, X.B.; Wu, H.B.; Wan, Y.F.; Liao, Y.L.; Lu, Y.H.; Wang, B.; Li, Y. Key pathway of methane production and characteristics of stable carbon isotope of the Tuojia River waterbody. Chin. J. Appl. Ecol. 2018, 29, 1450–1460. [Google Scholar]
  39. Liss, P.S.; Merlivat, L. Air-sea gas exchange rates: Introduction and synthesis. Role Air Sea Exch. Geochem. Cycl. 1986, 185, 113–127. [Google Scholar]
  40. Zhang, Y.; Li, Y.; Qin, X.B.; Kong, F.L.; Chi, M.; Li, Y.E. Dissolved methane concentration and emission flux in agricultural watershed of subtropics. Sci. Agric. Sin. 2016, 49, 3968–3980. [Google Scholar]
  41. Raymond, P.A.; Cole, J.J. Gas exchange in rivers and estuaries: Choosing a gas transfer velocity. Estuary Coast 2001, 24, 312–317. [Google Scholar] [CrossRef]
  42. Wanninkhof, R. Relationship between wind speed and gas exchange over the ocean. J. Geophys. Res. Ocean. 1992, 97, 7373–7382. [Google Scholar] [CrossRef]
  43. Huttunen, J.T.; Väisänen, T.S.; Hellsten, S.K.; Martikainen, P.J. Methane fluxes at the sediment-water interface in some boreal lakes and reservoirs. Boreal Environ. Res. 2006, 11, 27–34. [Google Scholar]
  44. Koné, Y.J.M.; Abril, G.; Delille, B.; Borges, A.V. Seasonal variability of methane in the rivers and lagoons of Ivory Coast (West Africa). Biogeochemistry 2010, 100, 21–37. [Google Scholar] [CrossRef] [Green Version]
  45. Teodoru, C.R.; Nyoni, F.C.; Borges, A.V.; Darchambeau, F.; Nyambe, I.; Bouillon, S. Spatial variability and temporal dynamics of greenhouse gas (CO2, CH4, N2O) concentrations and fluxes along the Zambezi River mainstem and major tributaries. Biogeosci. Discuss. 2014, 11, 16391–16445. [Google Scholar] [CrossRef] [Green Version]
  46. Zhang, G.L.; Zhang, J.; Liu, S.M.; Ren, J.L.; Xu, J.; Zhang, F. Methane in the Changjiang (Yangtze River) Estuary and its adjacent marine area: Riverine input, sediment release and atmospheric fluxes. Biogeochemistry 2008, 91, 71–84. [Google Scholar] [CrossRef]
  47. Schade, J.D.; Bailio, J.; McDowell, H. Greenhouse gas flux from headwater streams in New Hampshire, USA: Pattern and drivers. Limnol. Oceanogr. 2016, 61, S165–S174. [Google Scholar] [CrossRef] [Green Version]
  48. Gao, X.X. Study on Methane Flux Emitted from Manure Pond on Medium Scale Pig Farm; Chinese Academy of Agricultural Science: Beijing, China, 2007. [Google Scholar]
  49. Sieczko, A.K.; Demeter, K.; Singer, G.A.; Tritthart, M.; Preiner, S.; Mayr, M.; Meisterl, K.; Peduzzi, P. Aquatic methane dynamics in a human-impacted river-floodplain of the Danube. Limnol. Oceanogr. 2016, 61, S175–S181. [Google Scholar] [CrossRef] [Green Version]
  50. Chen, H.; Zhou, S.; Wu, N.; Wang, Y.F.; Luo, P.; Shi, F.S. Advance in studies on production, oxidation and emission flux of methane from wetlands. Chin. J. Appl. Environ. Biol. 2006, 12, 726–733. [Google Scholar]
  51. Yang, S.S.; Chen, I.C.; Liu, C.P.; Liu, L.Y.; Chang, C.H. Carbon dioxide and methane emissions from Tanswei River in Northern. Atmos. Pollut. Res. 2015, 6, 52–61. [Google Scholar] [CrossRef] [Green Version]
  52. Schrier-Uijl, A.P.; Veraart, A.J.; Leffelaar, P.A.; Berendse, F.; Veenendaal, E.M. Release of CO2 and CH4 from lakes and drainage ditches in temperate wetlands. Biogeochemistry 2011, 102, 265–279. [Google Scholar] [CrossRef] [Green Version]
  53. Mer, J.L.; Roger, P. Production, oxidation, emission and consumption of methane by soils: A review. Eur. J. Soil Biol. 2001, 37, 25–50. [Google Scholar] [CrossRef]
  54. Bodelier, P.L.E.; Laanbroek, H.J. Nitrogen as a regulatory factor of methane oxidation in soils and sediments. FEMS Microbiol. Ecol. 2004, 47, 265–277. [Google Scholar] [CrossRef]
  55. Galbally, I.E.; Kirstine, W.V.; Meyer, C.P.; Wang, Y.P. Soil-atmosphere trace gas exchange in semiarid and arid zones. J. Environ. Qual. 2008, 37, 599–607. [Google Scholar] [CrossRef]
  56. Kuivila, K.M.; Murray, J.W.; Devol, A.H. Methane production, sulfate reduction and competition for substrates in the sediments of Lake Washington. Geochim. Cosmochim. Acta 1989, 53, 409–416. [Google Scholar] [CrossRef]
  57. Heilman, M.A.; Carlton, R.G. Ebullitive release of lacunar gases from floral spikes of Potamogeton angustifolius and Potamogeton amplifolius: Effects on plant aeration and sediment CH4 flux. Aquat. Bot. 2001, 71, 19–33. [Google Scholar] [CrossRef]
  58. Crowe, S.A.; Katsev, S.; Leslie, K.; Sturm, A.; Magen, C.; Nomosatryo, S.; Pack, M.A.; Kessler, J.D.; Reeburgh, W.S.; Roberts, J.A.; et al. The methane cycle in ferruginous Lake Matano. Geobiology 2011, 9, 61–78. [Google Scholar] [CrossRef]
  59. Oswald, K.; Milucka, J.; Brand, A.; Littmann, S.; Wehrli, B.; Kuypers, M.M.M.; Schubert, C.J. Light-dependent aerobic methane oxidation reduces methane emission from seasonally stratified lakes. PLoS ONE 2015, 10, e0132574. [Google Scholar] [CrossRef]
  60. Reeburgh, W.S. Oceanic methane biogeochemistry. Chem. Rev. 2007, 107, 486–513. [Google Scholar] [CrossRef] [PubMed] [Green Version]
  61. Ding, W.X.; Cai, Z.C.; Tsuruta, H. Plant species effects on methane emissions from freshwater marshes. Atmos. Environ. 2005, 39, 3199–3207. [Google Scholar] [CrossRef]
  62. Zhu, Z.L.; Xing, G.X. Nitrogen Cycling; Tsinghua University Press: Beijing, China, 2002. [Google Scholar]
  63. Bachoon, D.; Jones, R.D. Potential rates of methanogenesis in sawgrass marshes with peat and marl soils in the Everglades. Soil Biol. Biochem. 1992, 24, 21–27. [Google Scholar] [CrossRef]
  64. Wright, A.L.; Reddy, K.R. Phosphorus loading effects on extracellular enzyme activity in Everglades wetland soils. Soil Sci. Soc. Am. J. 2001, 65, 588–595. [Google Scholar] [CrossRef]
  65. Kelly, C.A.; Chynoweth, D.P. The Contributions of temperature and of the input of organic matter in controlling rates of sediment methanogenesis. Limnol. Oceanogr. 1981, 26, 891–897. [Google Scholar] [CrossRef] [Green Version]
  66. Chin, K.J.; Lukow, T.; Conrad, R. Effect of temperature on structure and function of the methanogenic archaeal community in an anoxic rice field soil. Appl. Environ. Microbiol. 1999, 65, 2341–2349. [Google Scholar] [CrossRef] [Green Version]
  67. Venkiteswaran, J.J.; Rosamond, M.S.; Schiff, S.L. Nonlinear response of riverine N2O fluxes to oxygen and temperature. Environ. Sci. Technol. 2014, 48, 1566–1573. [Google Scholar] [CrossRef]
  68. Zeng, F.W.; Masiello, C.A.; Hockaday, W.C. Controls on the origin and cycling of riverine dissolved inorganic carbon in the Brazos River, Texas. Biogeochemistry 2011, 104, 275–291. [Google Scholar] [CrossRef]
  69. Dyson, K.E.; Billett, M.F.; Dinsmore, K.J.; Harvey, F.; Thomson, A.M.; Piirainen, S.; Kortelainen, P. Release of aquatic carbon from two peatland catchments in E. Finland during the spring snowmelt period. Biogeochemistry 2011, 103, 125–142. [Google Scholar] [CrossRef]
  70. Conrad, R. Contribution of hydrogen to methane production and control of hydrogen concentrations in methanogenic soils and sediments. FEMS Microbiol. Ecol. 1999, 28, 193–202. [Google Scholar] [CrossRef]
  71. Whiticar, M.J. Carbon and hydrogen isotope systematics of bacterial formation and oxidation of methane. Chem. Geol. 1999, 161, 291–314. [Google Scholar] [CrossRef]
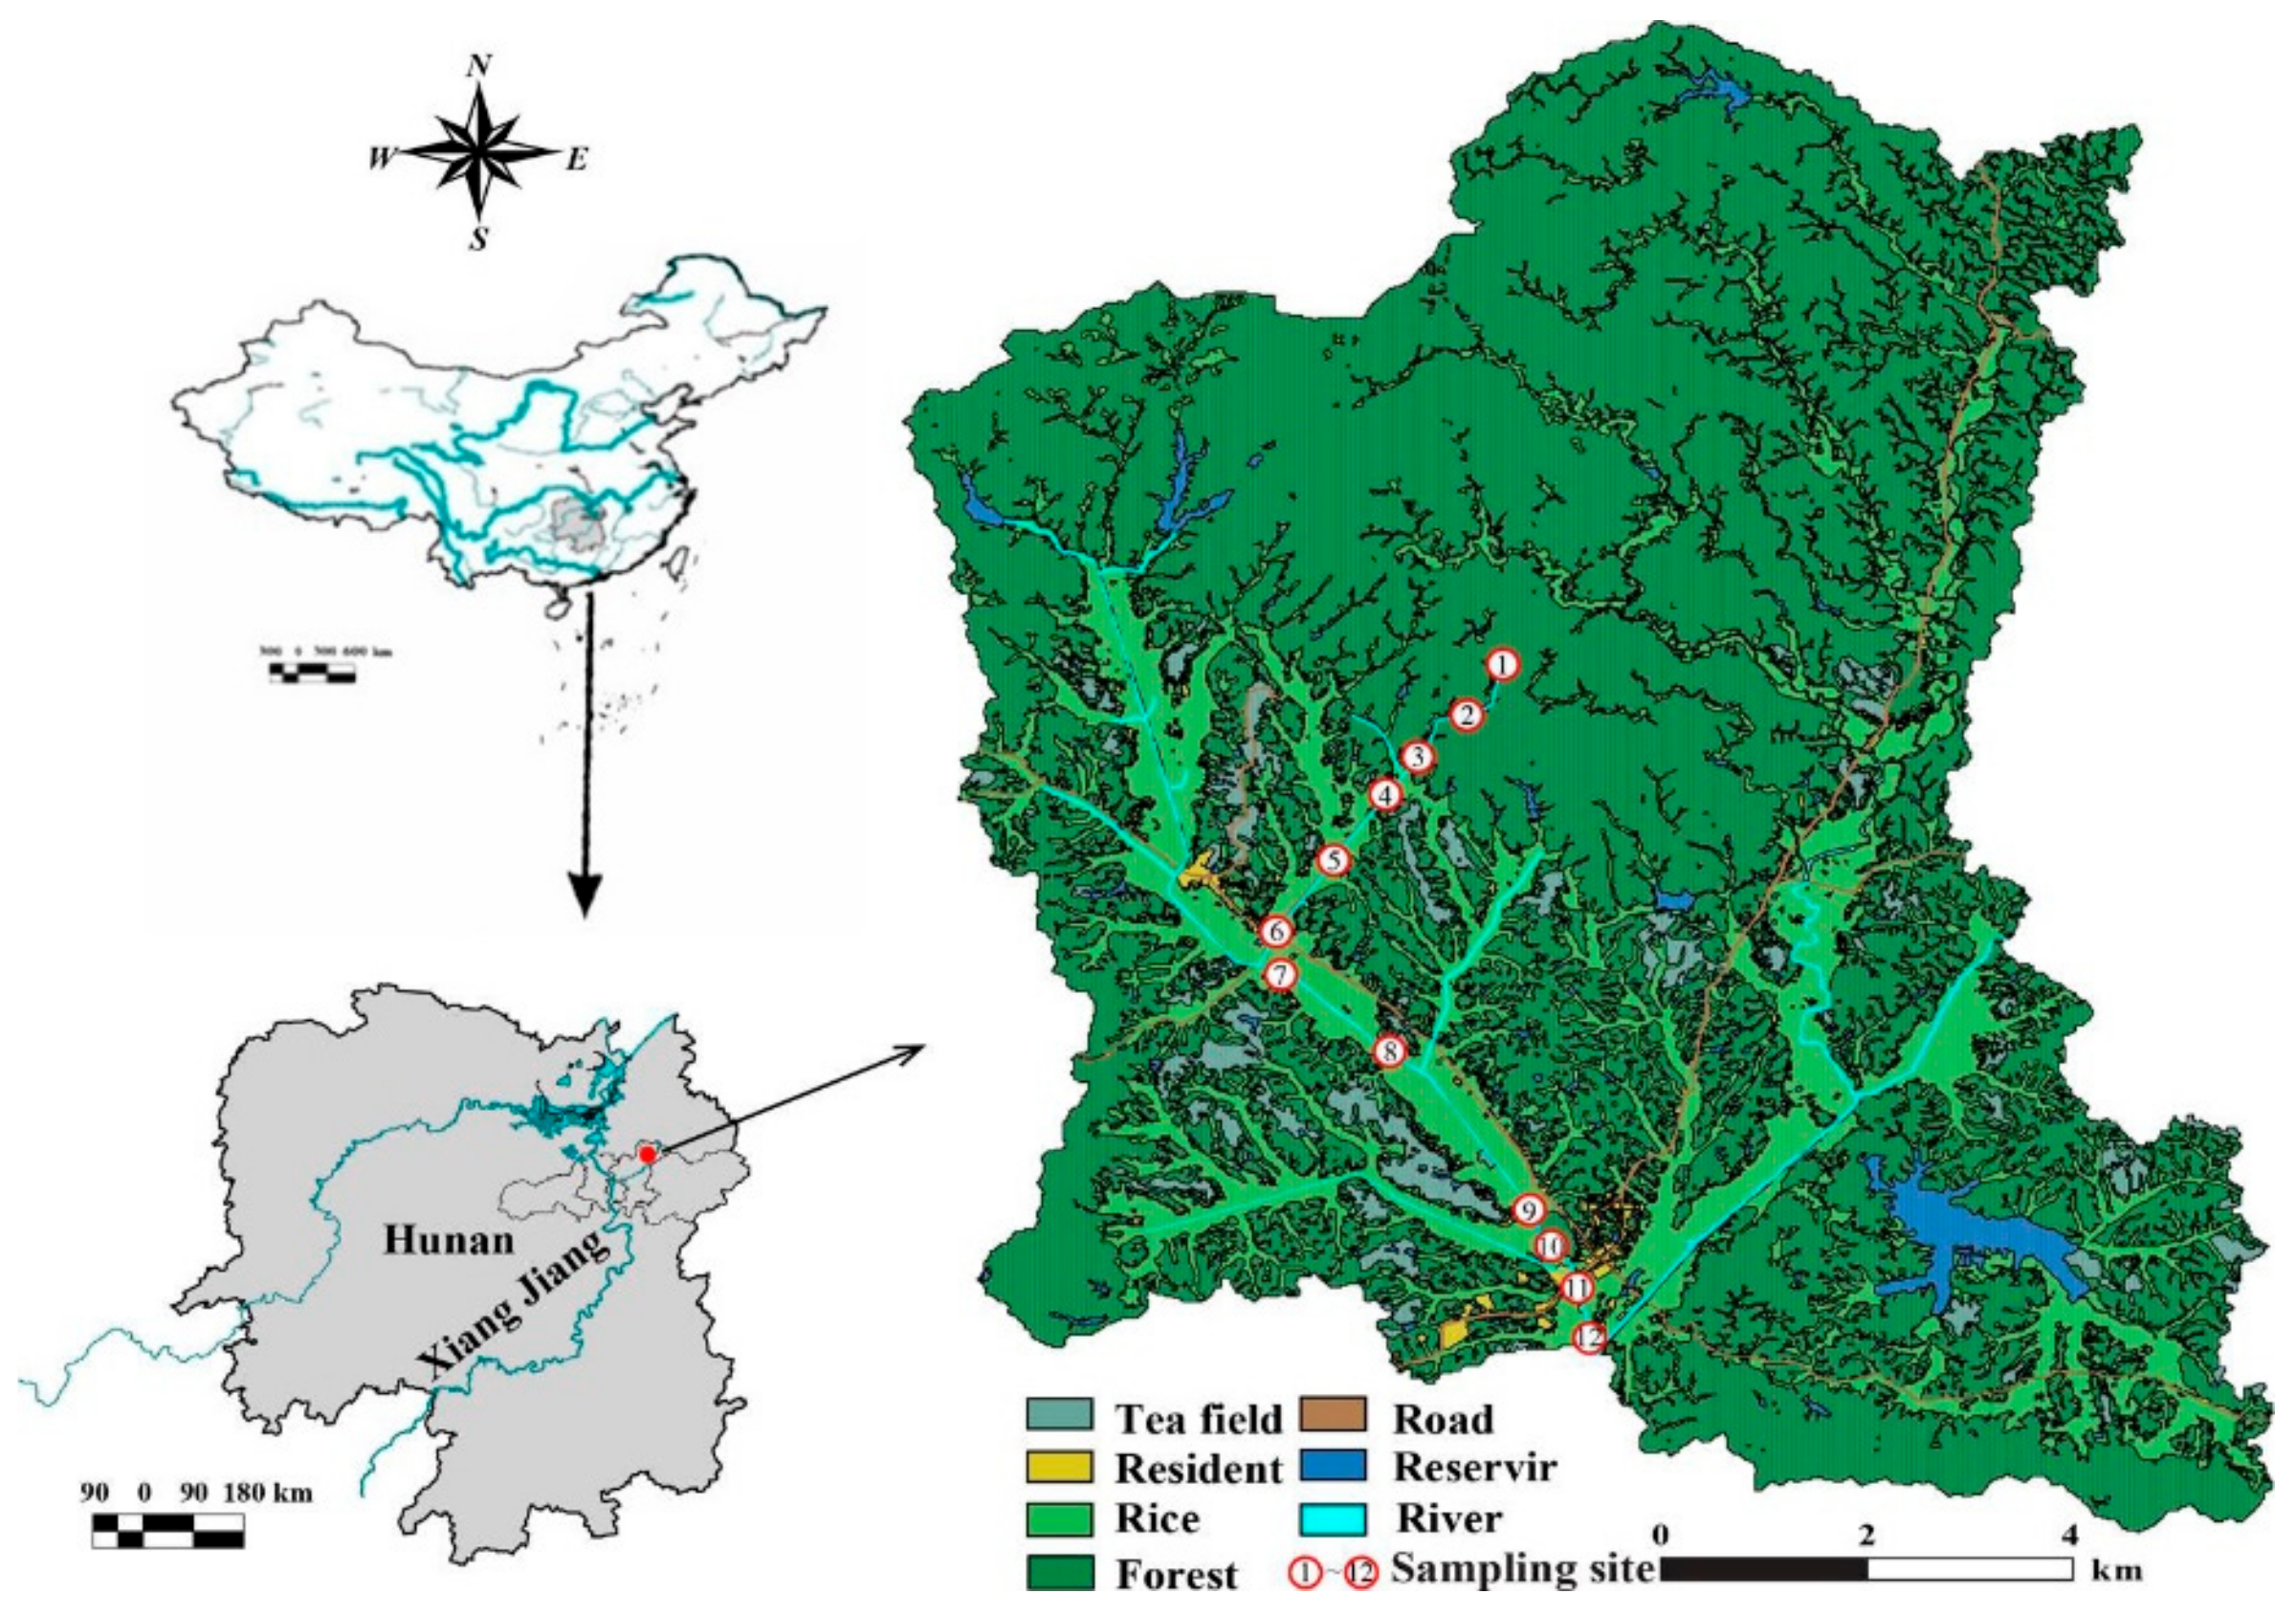
Figure 1. Geographical location and sampling points of research site [36].
Sustainability 12 02114 g001
Figure 2. Precipitation, air temperature, and wind speed from April 2015 to January 2016. Subfigure explanation: (a) represents precipitation and air temperature; (b) represents wind speed.
Sustainability 12 02114 g002
Figure 3. Spatiotemporal variations of dissolved CH4 concentrations in the Tuojia River.
Sustainability 12 02114 g003
Figure 4. Spatiotemporal variations of CH4 diffusive fluxes in the Tuojia River (lower case above column represents significant differences for the same river reach in different sampling periods; upper case letters above column represent significant differences for the same sampling period in different river reaches). Subfigure explanation: (a) represents S1 CH4 diffusive fluxes; (b) represents S2; (c) represents S3; (d) represents S4.
Sustainability 12 02114 g004
Figure 5. Spatiotemporal variations of CH4 diffusive fluxes in the Tuojia River.
Sustainability 12 02114 g005
Figure 6. Correlation matrices among CH4 diffusive fluxes and water parameters (lower-left panel represents scatter diagram, upper-right panel represents r (correlation coefficient) *100; the numbers represent the correlation coefficient between CH4 diffusive fluxes and environmental factors; the red asterisks represent significant level (p values). ***, **, and * represents p < 0.001, p < 0.01, and p < 0.05, respectively).
Sustainability 12 02114 g006
Table 1. The model Kw values of the CH4 fluxes in the Tuojia River.
KW ModelsFormulaWind U10 (m s−1)References
LM86 K W = 0.17 × U 10 S c / 600 2 / 3 0 < U10 ≤ 3.6
K W = 2.85 × U 10 9.65 S c / 600 1 / 2 3.6 < U10 ≤ 13[39]
K W = 5.9 × U 10 49.3 S c / 600 1 / 2 U10 > 13
W92a K W = 0.39 × U 10 2 S c / 660 1 / 2 Long term U10[42]
W92b K W = 0.31 × U 10 2 S c / 660 1 / 2 Short term U10
RC01 K W = 1.91 exp 0.35 U 10 S c / 600 1 / 2 Arbitrarily U10[41]
Table 2. Water quality parameters in the Tuojia River basin.
ReachpHDO (mg L−1)SalinityWT (°C)DOC (mg L−1)NH4+–N (mg L−1)NO3–N (mg L−1)
S16.88 ± 0.088.21 ± 0.120.03 ± 0.00118.90 ± 0.511.11 ± 0.090.28 ± 0.050.84 ± 0.04
S26.82 ± 0.077.03 ± 0.210.06 ± 0.00119.73 ± 0.622.81 ± 0.130.90 ± 0.091.72 ± 0.08
S36.77 ± 0.077.18 ± 0.190.06 ± 0.00120.06 ± 0.673.30 ± 0.160.66 ± 0.051.78 ± 0.05
S46.85 ± 0.077.35 ± 0.170.07 ± 0.00119.60 ± 0.653.74 ± 0.190.67 ± 0.061.85 ± 0.05
Mean6.83 ± 0.017.45 ± 0.090.06 ± 0.00119.57 ± 0.312.74 ± 0.090.63 ± 0.031.55 ± 0.03
Table 3. Socioeconomic survey data in the Tuojia River (the results of pig, poultry, and nitrogen fertilizer were from 60 farmers and urban residents; the result of population was from the whole catchment).
Reach Population PigPoultry Nitrogen fertilizer (kg ha−1)
S136N/A16N/A
S23863426365150
S3273982131135
S421,776N/AN/A142.5
Table 4. CH4 production pathways [38].
S1S2S3S4
fermentation of acetate87%78%76%81%
reduction of carbon dioxide13%22%24%19%