Assessment of the Industrial Structure and its Influence on Sustainable Economic Development and Quality of Life of the Population of Different World Countries

 ,
,  ,
,  ,
,  and
and
Abstract
:1. Introduction
1.1. The Role of Industry in the Sustainable Economic Growth of Countries of the World
1.2. The Connection Between Structural Changes in the Economy (Industry) of Countries and Their Sustainable Economic Growth
which structure of the national industry under current economic conditions can be considered progressive, i.e., can lead to progress and sustainable socio-economic growth;whether there is a correlation between the progressive structure of a country’s industry and its economic development and the quality of life of its population (which is a complex indicator of the national socio-economic development);how the approach of the country’s industrial structure to its progressive state influences the country’s economic development and the quality of life of its population.
2. Materials and Methods
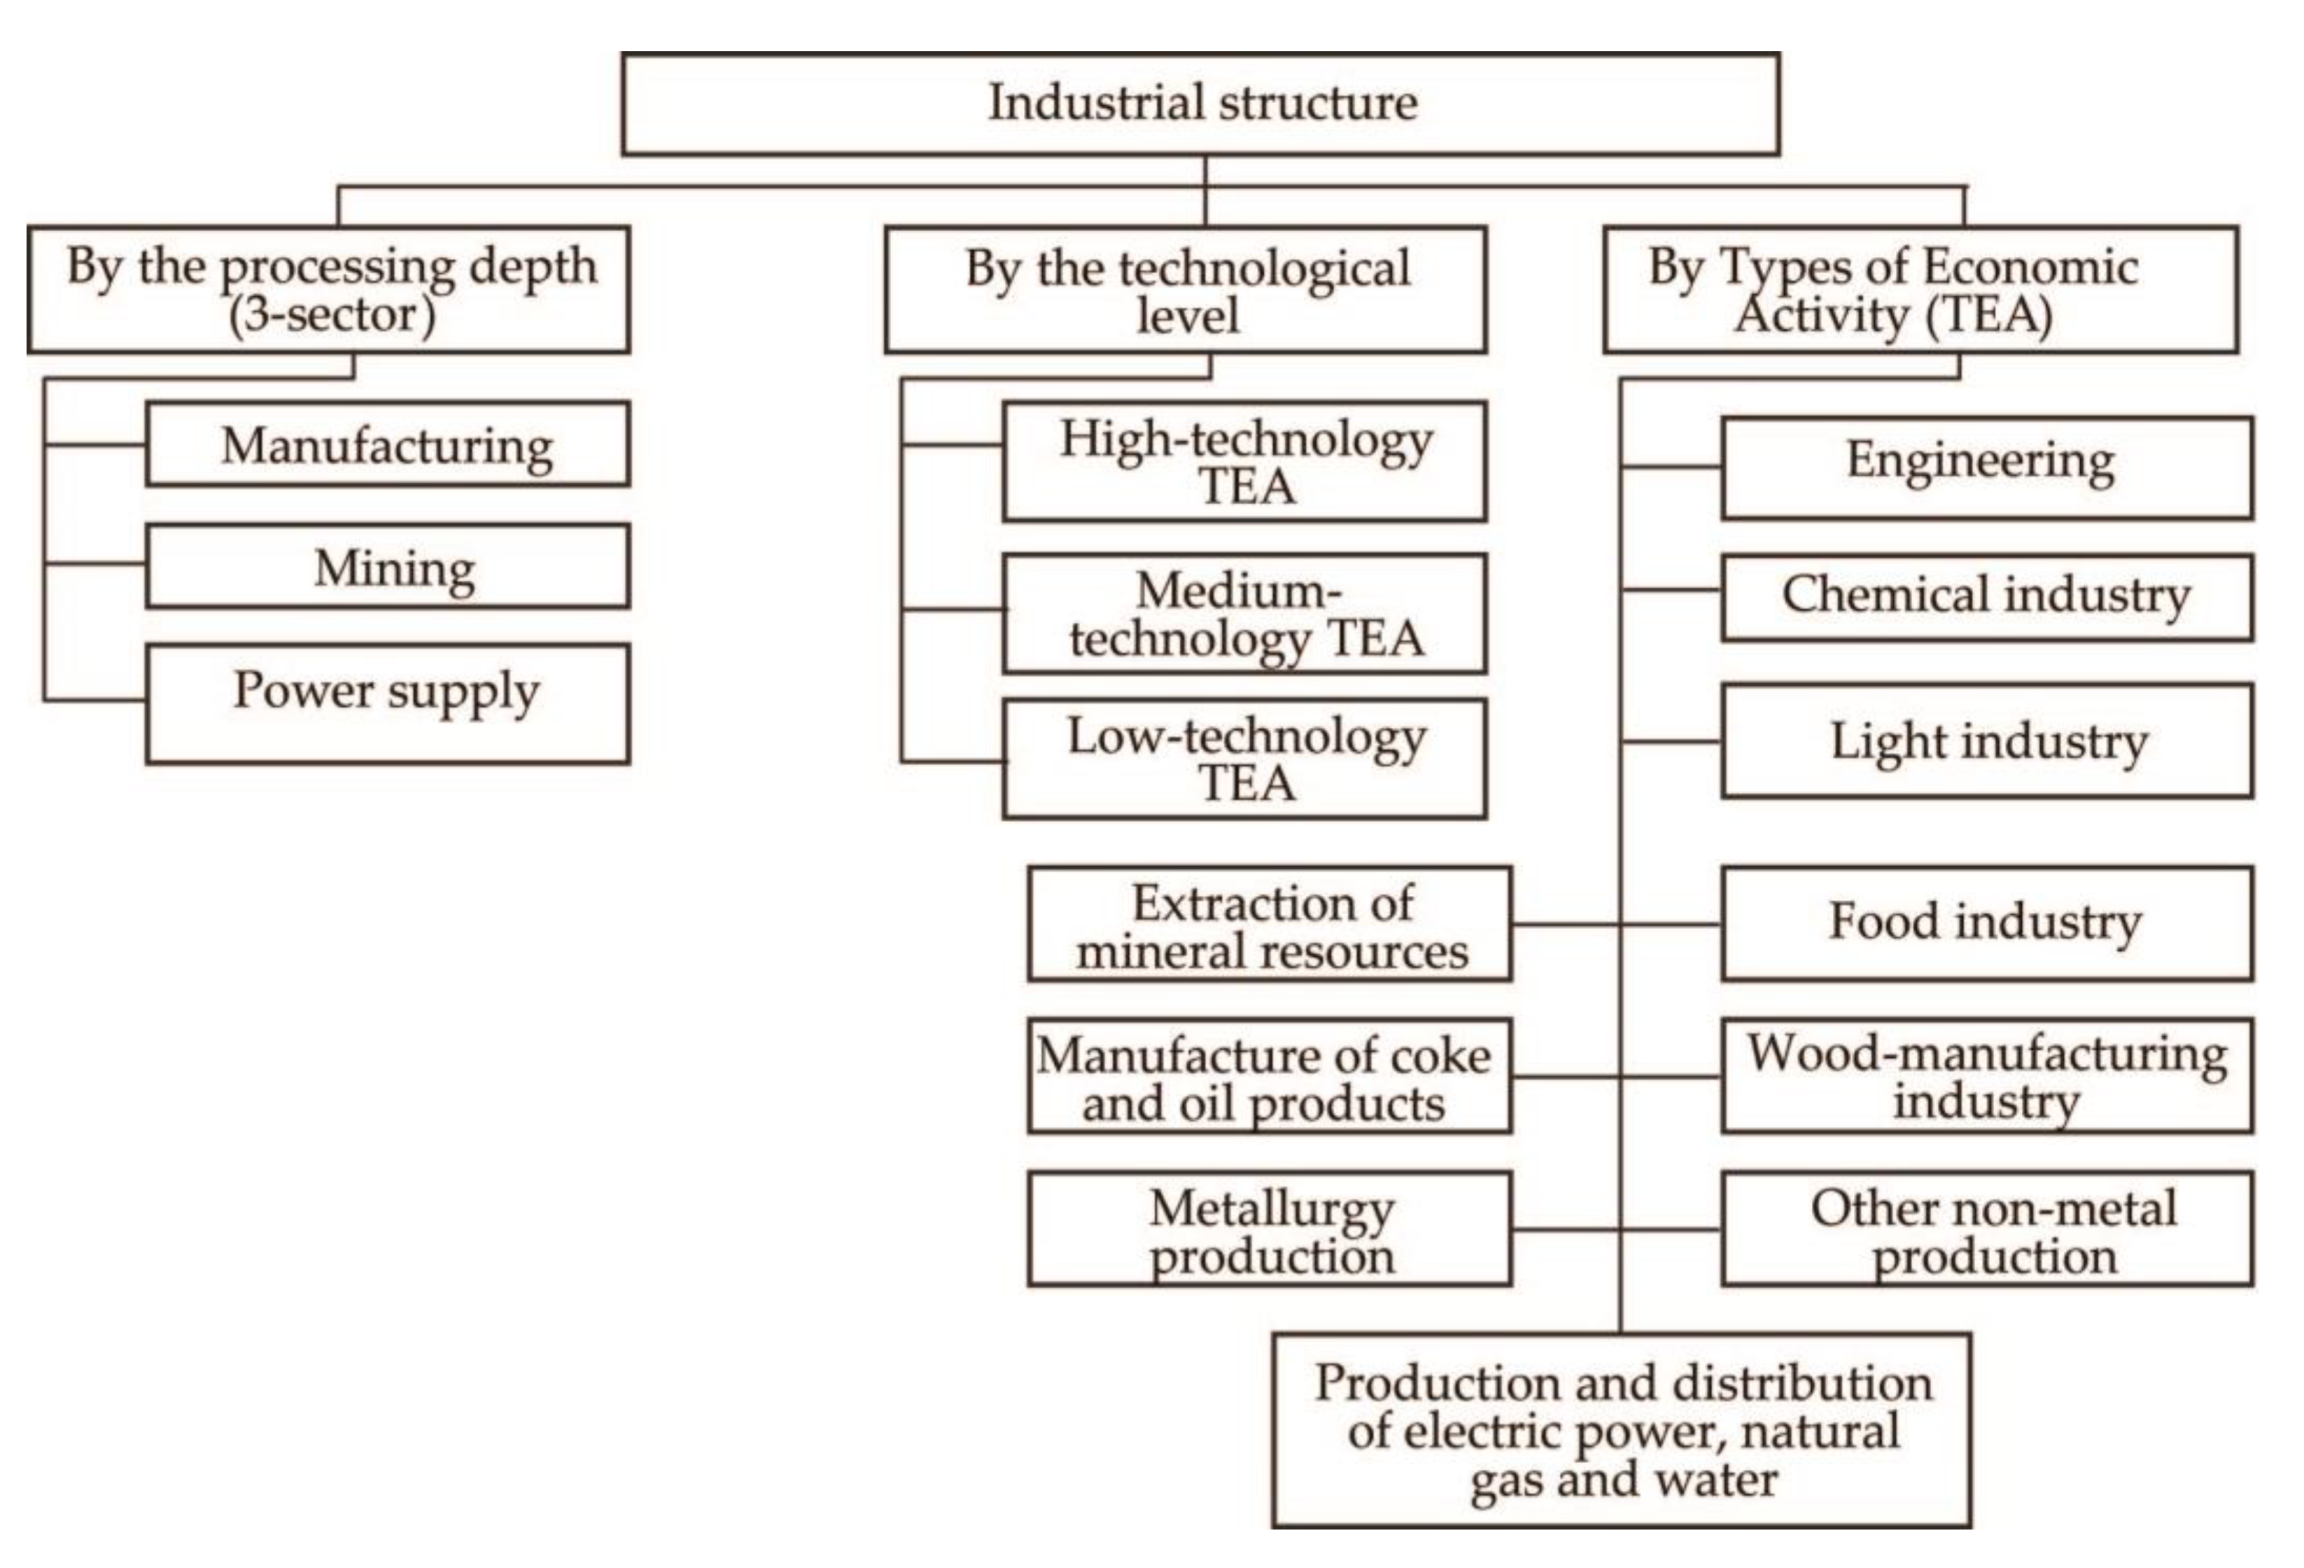
- Establishing the theoretical bases for analysis and evaluation of industrial structure.
For establishing the theoretical bases for analysis and evaluation of the industrial structure, in particular: defining the essence of the basic concepts that have to do the industry structure; identifying the existing approaches to the analysis of the economic (industrial) structure; forming a classification of the country’s industrial sectors which would be used for studying the industrial structure of the world’s countries; justifying the criteria of progressiveness of the industrial structure—general scientific methods: analysis and synthesis, generalization, content analysis of literary sources.For calculating the averaged values of the criteria of progressivity on the basis of analysis of the industrial structures of the leading countries of the world—methods of grouping and classification, averaging.For assessing the correspondence of the industrial structure of the world countries with its progressive state—method for calculating the integral indicator.For evaluating the influence of approach of the industrial structure of the country to its progressive state on the economic development and quality of life of its population—cluster analysis.
3. Results
- 1.
- For the branch structure of the national economy: 20% have to fall on the processing branches of industry; 25%—financial sphere; 22%—sphere of services; and 33%—other branches.
- 2.
- For the technological structure of the national economy: 20% have to fall on the high-technology productions; 30%—medium-high-technology productions; 20%—medium-low-technology productions and 30%—low-technology productions.
- 3.
- For the technological structure of the branches of the manufacturing industry (within 20% of the national economy structure): 50% have to fall on the total part of the high-technology and medium-high-technology productions (out of which 20%—high-technology productions and 30%—medium-high-technology productions) and 50%—medium-low-technology and low-technology productions [54].
4. Conclusions and Discussion
Author Contributions
Funding
Conflicts of Interest
Appendix A

| No. | Country | GVA Volume of the Economy | GVA Volume of the Industry | Specific Weight of the GVA of the Industry in the GVA of the Economy | |||
|---|---|---|---|---|---|---|---|
| USD Million | Rank | USD Million | Rank | % | Rank | ||
| 1 | Australia | 1,357,150.5 | 12 | 230,938.4 | 14 | 17.0 | 26 |
| 2 | Austria | 389,663.9 | 21 | 79,345.5 | 20 | 20.4 | 18 |
| 3 | Belgium | 476,145.6 | 20 | 76,122.1 | 21 | 16.0 | 31 |
| 4 | Bulgaria | 49,340.7 | 32 | 10,740.5 | 33 | 21.8 | 14 |
| 5 | Brazil | 2,071,925.5 | 7 | 340,508.1 | 9 | 16.4 | 27 |
| 6 | United Kingdom | 2,666,095.6 | 5 | 384,888.4 | 7 | 14.4 | 34 |
| 7 | Greece | 208,343.7 | 25 | 25,612.4 | 30 | 12.3 | 36 |
| 8 | Denmark | 299,877.7 | 22 | 53,451.3 | 24 | 17.8 | 23 |
| 9 | Estonia | 23,393.7 | 36 | 4,723.8 | 35 | 20.2 | 19–20 |
| 10 | India | 1,994,314.2 | 8 | 321,966.1 | 13 | 16.1 | 30 |
| 11 | Ireland | 227,662.4 | 24 | 56,684.8 | 23 | 24.9 | 9 |
| 12 | Spain | 1,259,828.5 | 14 | 204,140.9 | 15 | 16.2 | 28–29 |
| 13 | Italy | 1,925,309.5 | 9 | 334,547.7 | 10 | 17.4 | 24 |
| 14 | Canada | 1,675,520.8 | 10 | 359,619.6 | 8 | 21.5 | 15 |
| 15 | China | 10,283,983.0 | 2 | 3,771,566.3 | 1 | 36.7 | 1 |
| 16 | Korea | 1,287,093.4 | 13 | 433,464.6 | 6 | 33.7 | 2 |
| 17 | Latvia | 27,753.6 | 35 | 4,310.7 | 36 | 15.5 | 33 |
| 18 | Lithuania | 43,718.6 | 33 | 8,832.4 | 34 | 20.2 | 19–20 |
| 19 | Mexico | 1,227,744.3 | 15 | 323,269.6 | 12 | 26.3 | 5 |
| 20 | Netherlands | 792,656.2 | 16 | 123,947.7 | 17 | 15.6 | 32 |
| 21 | Germany | 3,484,775.1 | 4 | 865,107.9 | 4 | 24.8 | 10 |
| 22 | Poland | 484,755.6 | 19 | 119,042.9 | 18 | 24.6 | 11 |
| 23 | Portugal | 201,499.9 | 26 | 32,693.5 | 27 | 16.2 | 28–29 |
| 24 | Russia | 1,623,896.2 | 11 | 441,091.9 | 5 | 27.2 | 4 |
| 25 | Romania | 180,202.4 | 28 | 46,922.9 | 26 | 26.0 | 6–7 |
| 26 | Slovakia | 91,105.6 | 31 | 22,023.9 | 31 | 24.2 | 12 |
| 27 | Slovenia | 42,816.1 | 34 | 11,064.2 | 32 | 25.8 | 8 |
| 28 | USA | 17,348,070.0 | 1 | 2,980,338.0 | 2 | 17.2 | 25 |
| 29 | Turkey | 710,919.2 | 17 | 152,438.2 | 16 | 21.4 | 16 |
| 30 | Hungary | 116,649.4 | 29 | 30,363.5 | 28 | 26.0 | 6,7 |
| 31 | Finland | 234,731.3 | 23 | 47,047.5 | 25 | 20.0 | 21–22 |
| 32 | France | 2,537,743.2 | 6 | 325,636.6 | 11 | 12.8 | 35 |
| 33 | Czech Republic | 186,073.4 | 27 | 57,399.5 | 22 | 30.8 | 3 |
| 34 | Sweden | 507,219.3 | 18 | 101,438.3 | 19 | 20.0 | 21–22 |
| 35 | Japan | 4,437,887.1 | 3 | 922,796.7 | 3 | 20.8 | 17 |
| 36 | Ukraine | 116,324.9 | 30 | 26,284.6 | 29 | 22.6 | 13 |
| Total | 60,592,193.0 | 13,330,371.0 | 22.0 | ||||
Appendix B
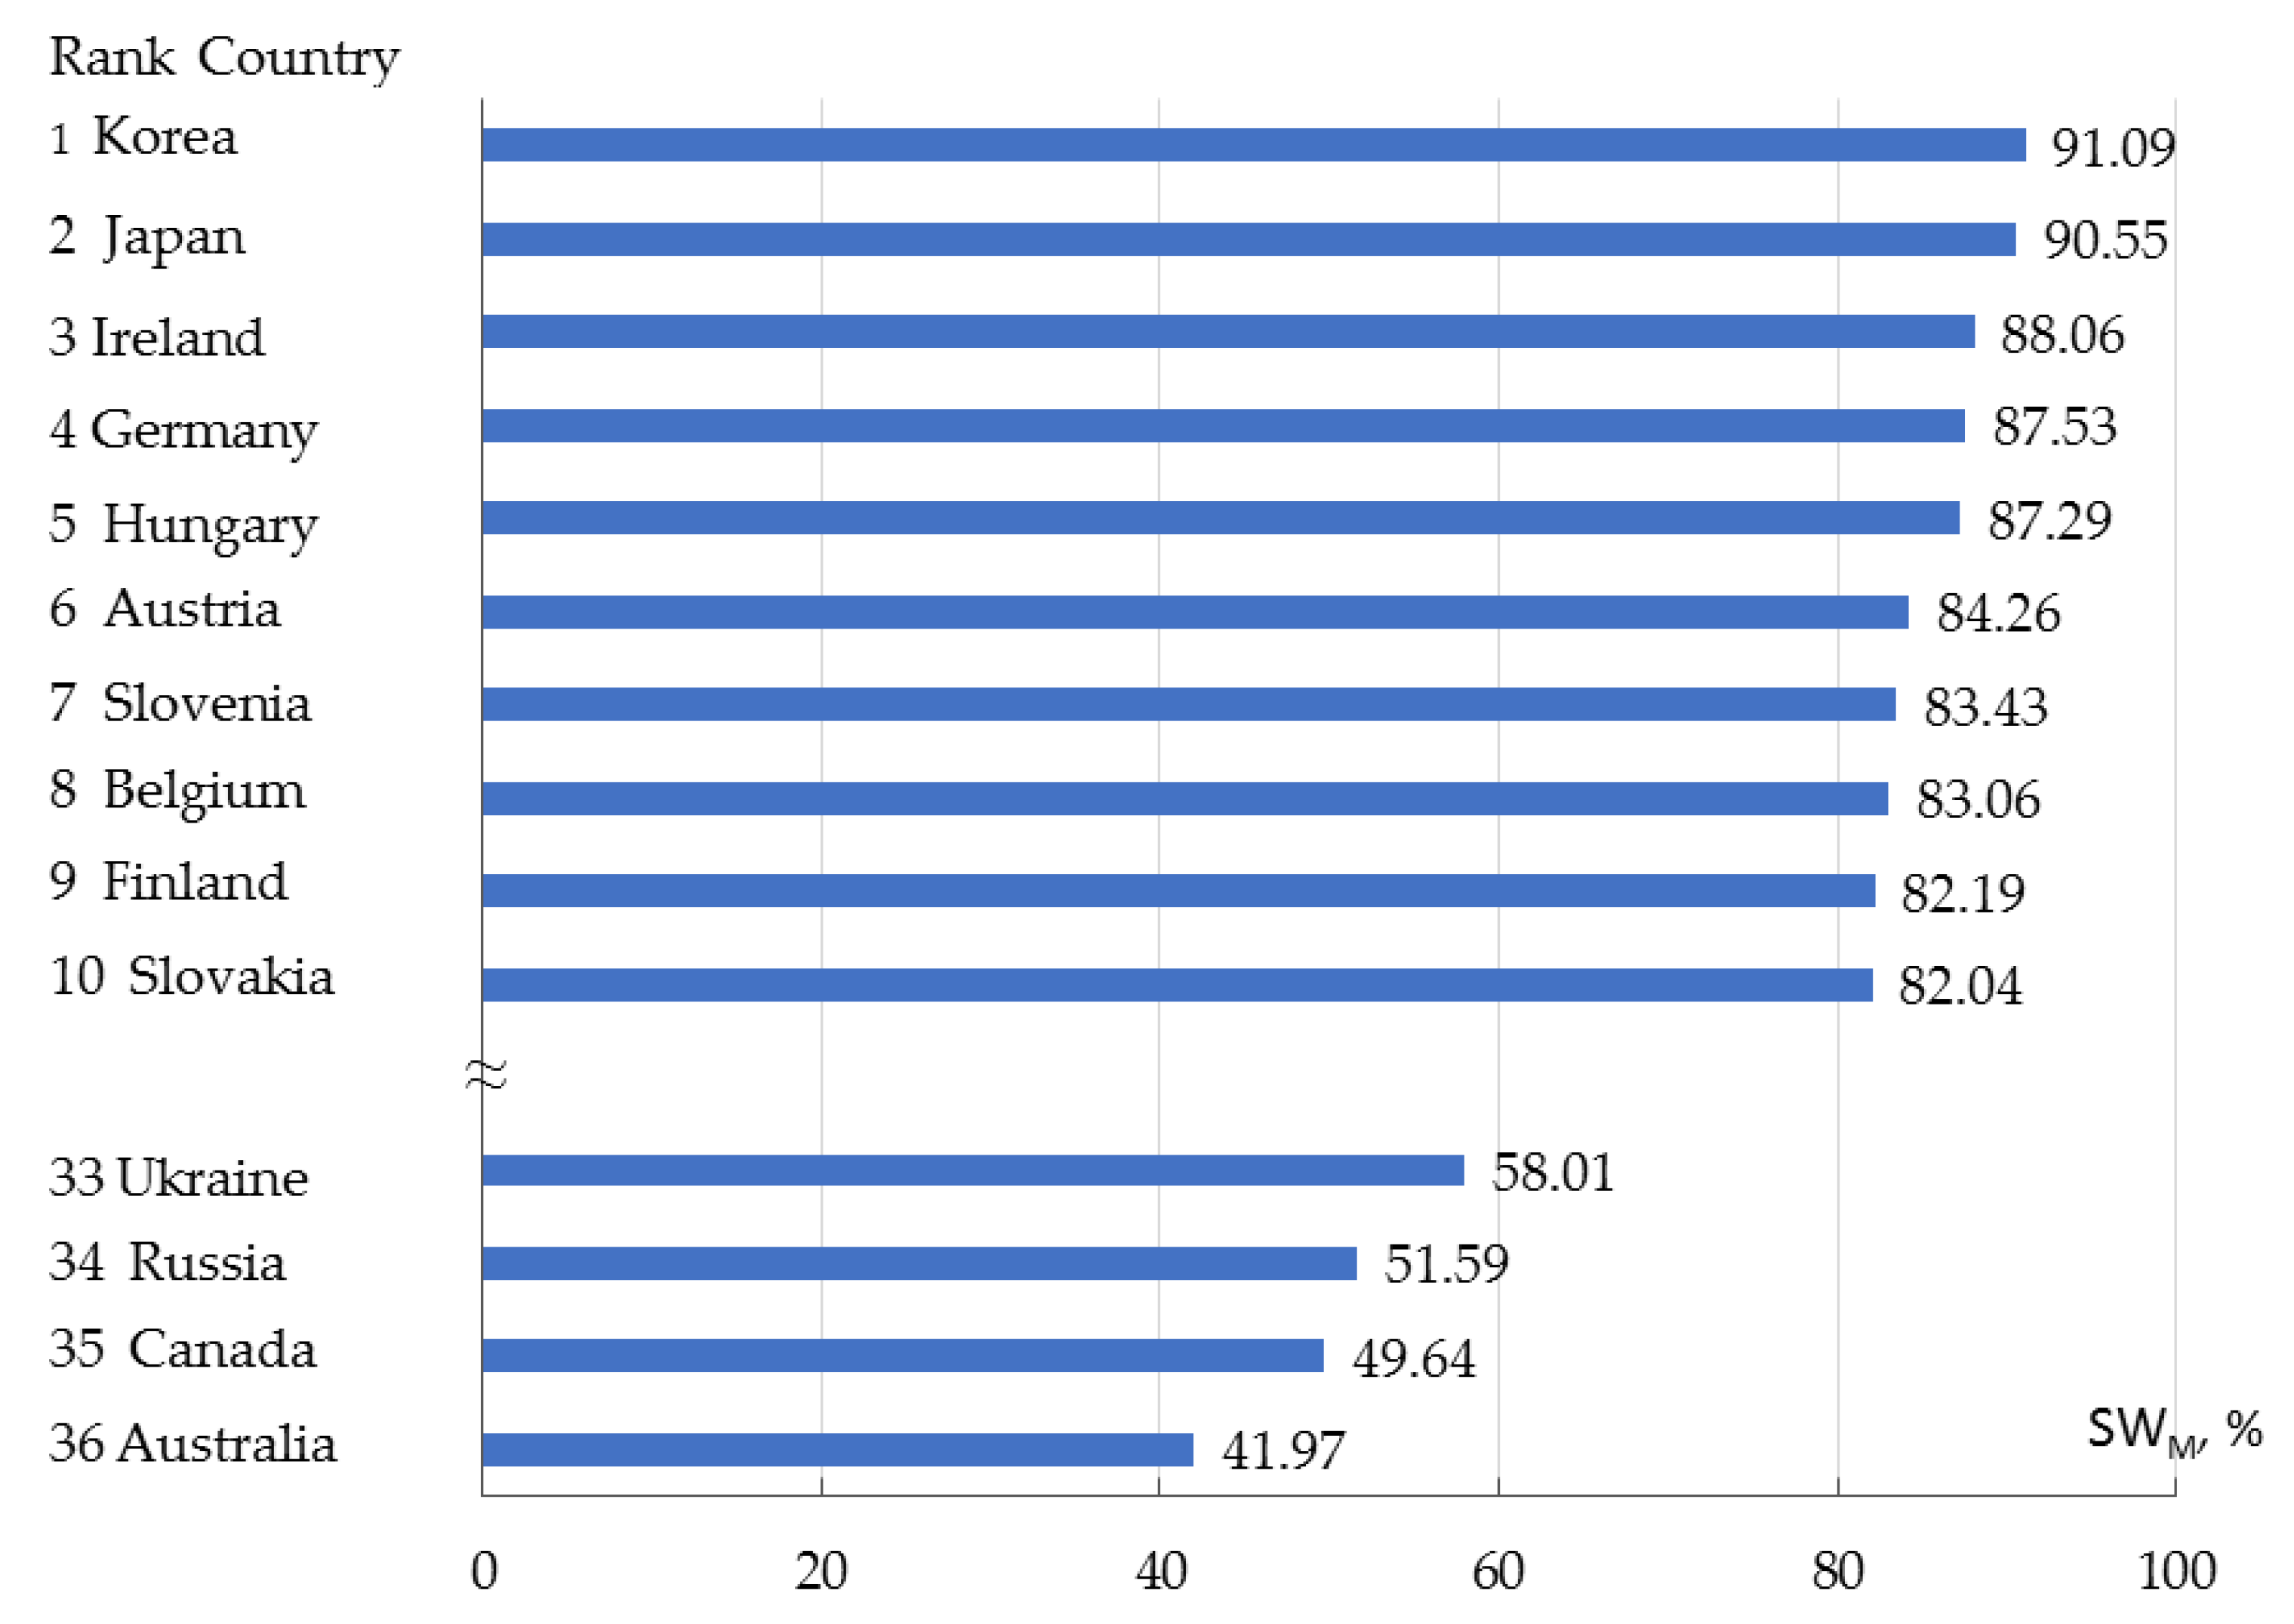
| No. | Country | Specific Weight of the Manufacturing Industry GVA (SWM) in the General Volume of the Industrial GVA | |||||
|---|---|---|---|---|---|---|---|
| 2009 p. | 2011 p. | 2014 p. | |||||
| % | Rank | % | Rank | % | Rank | ||
| 1 | Australia | 42.52 | 36 | 36.32 | 36 | 41.97 | 36 |
| 2 | Austria | 84.27 | 10 | 84.38 | 10 | 84.26 | 6 |
| 3 | Belgium | 84.96 | 6 | 84.89 | 9 | 83.06 | 8 |
| 4 | Bulgaria | 72.00 | 27 | 72.00 | 24 | 65.47 | 31 |
| 5 | Brazil | 75.61 | 21 | 71.68 | 25 | 65.56 | 30 |
| 6 | United Kingdom | 69.65 | 29 | 69.60 | 29 | 71.43 | 27 |
| 7 | Greece | 75.84 | 20 | 75.84 | 22 | 71.67 | 26 |
| 8 | Denmark | 73.91 | 25 | 63.65 | 32 | 73.37 | 24 |
| 9 | Estonia | 71.45 | 28 | 71.45 | 26 | 71.06 | 28 |
| 10 | India | 77.28 | 18 | 76.68 | 20 | 78.20 | 18 |
| 11 | Ireland | 91.88 | 2 | 92.40 | 2 | 88.06 | 3 |
| 12 | Spain | 81.23 | 14 | 81.05 | 14 | 76.84 | 20 |
| 13 | Italy | 84.68 | 8 | 85.77 | 6 | 82.00 | 11 |
| 14 | Canada | 53.37 | 35 | 63.93 | 31 | 49.64 | 35 |
| 15 | China | 81.24 | 13 | 81.24 | 13 | 78.82 | 17 |
| 16 | Korea | 92.39 | 1 | 93.01 | 1 | 91.09 | 1 |
| 17 | Latvia | 68.92 | 30 | 68.92 | 30 | 71.86 | 25 |
| 18 | Lithuania | 76.94 | 19 | 76.94 | 19 | 81.39 | 13 |
| 19 | Mexico | 64.36 | 33 | 59.49 | 33 | 65.05 | 32 |
| 20 | Netherlands | 67.82 | 31 | 70.35 | 28 | 70.50 | 29 |
| 21 | Germany | 85.23 | 5 | 87.83 | 3 | 87.53 | 4 |
| 22 | Poland | 73.74 | 26 | 71.26 | 27 | 73.82 | 23 |
| 23 | Portugal | 78.84 | 16 | 78.84 | 16 | 76.67 | 21 |
| 24 | Russia | 53.97 | 34 | 52.63 | 35 | 51.59 | 34 |
| 25 | Romania | 85.75 | 4 | 85.75 | 7 | 77.72 | 19 |
| 26 | Slovakia | 74.24 | 23 | 74.24 | 23 | 82.04 | 10 |
| 27 | Slovenia | 82.66 | 12 | 82.66 | 12 | 83.43 | 7 |
| 28 | USA | 74.70 | 22 | 76.16 | 21 | 73.91 | 22 |
| 29 | Turkey | 78.48 | 17 | 80.40 | 15 | 80.43 | 15 |
| 30 | Hungary | 83.61 | 11 | 86.84 | 5 | 87.29 | 5 |
| 31 | Ukraine | 65.45 | 32 | 54.91 | 34 | 58.01 | 33 |
| 32 | Finland | 84.91 | 7 | 85.26 | 8 | 82.19 | 9 |
| 33 | France | 84.35 | 9 | 84.06 | 11 | 79.95 | 16 |
| 34 | Czech Republic | 74.24 | 24 | 78.53 | 17 | 81.21 | 14 |
| 35 | Sweden | 78.87 | 15 | 77.97 | 18 | 81.98 | 12 |
| 36 | Japan | 87.24 | 3 | 87.40 | 4 | 90.55 | 2 |
| Average value | 76.32 | 76.27 | 75.76 | ||||
| 76.12 | |||||||
Appendix C
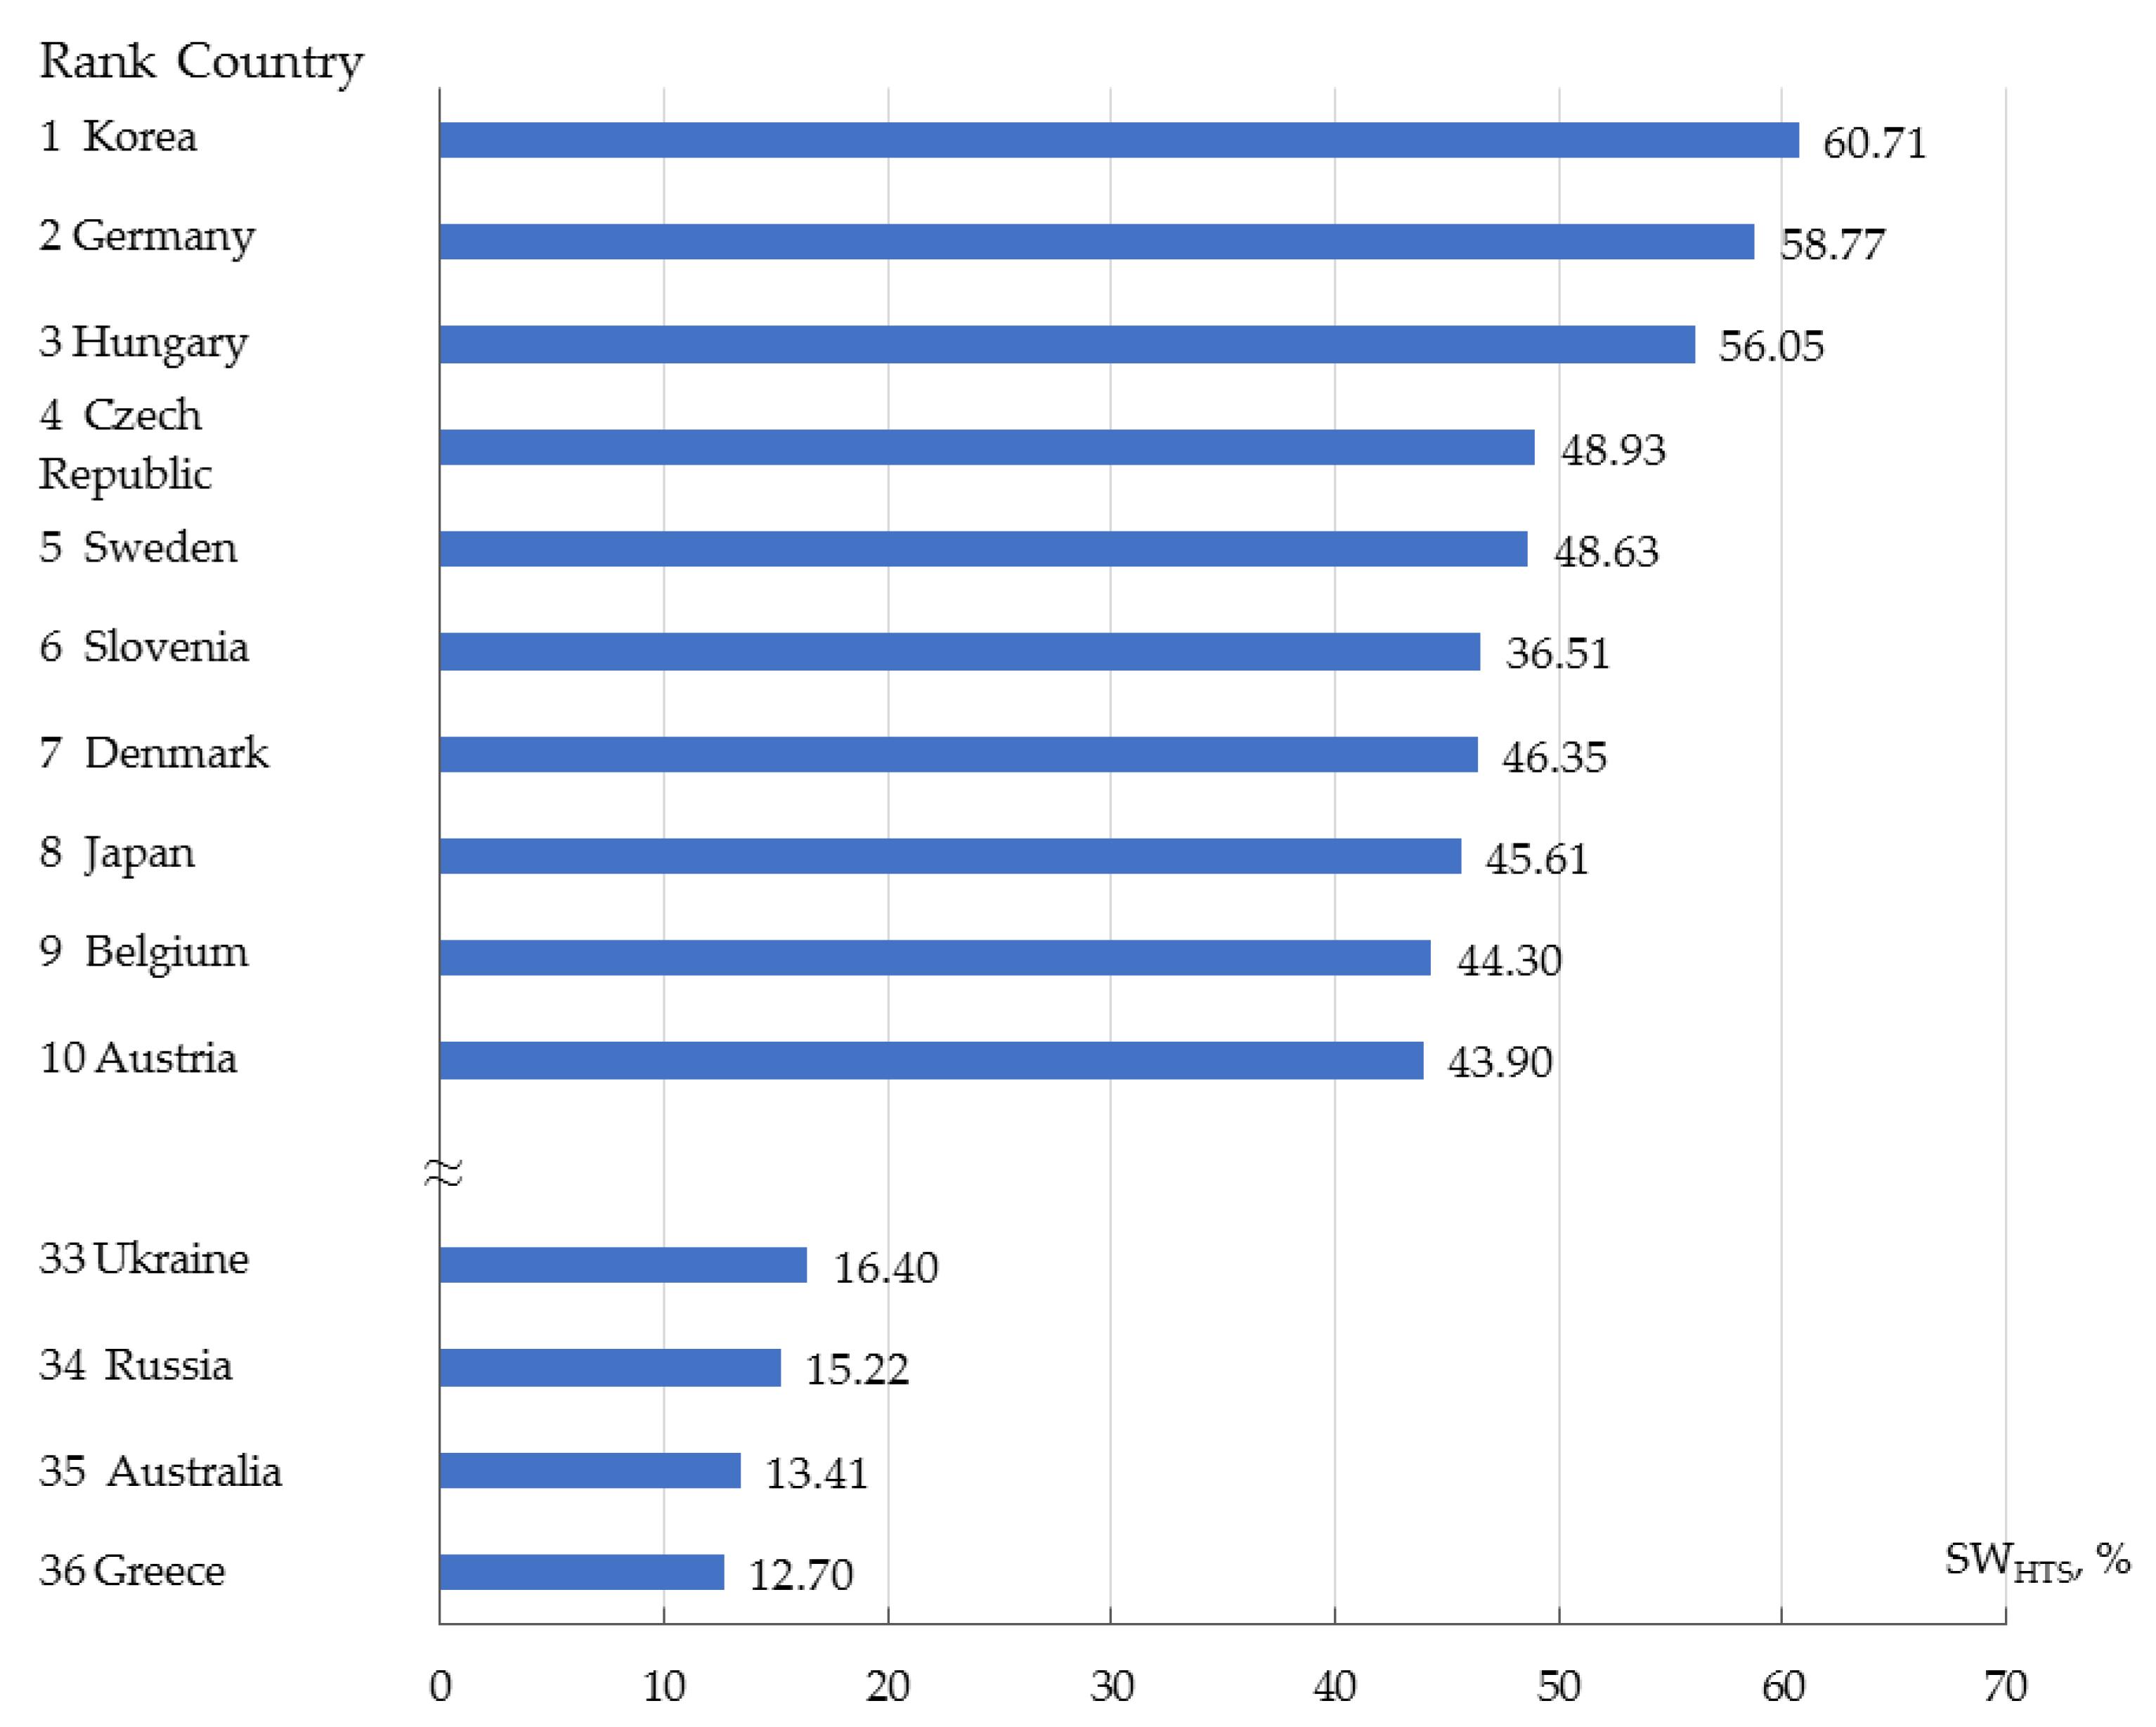
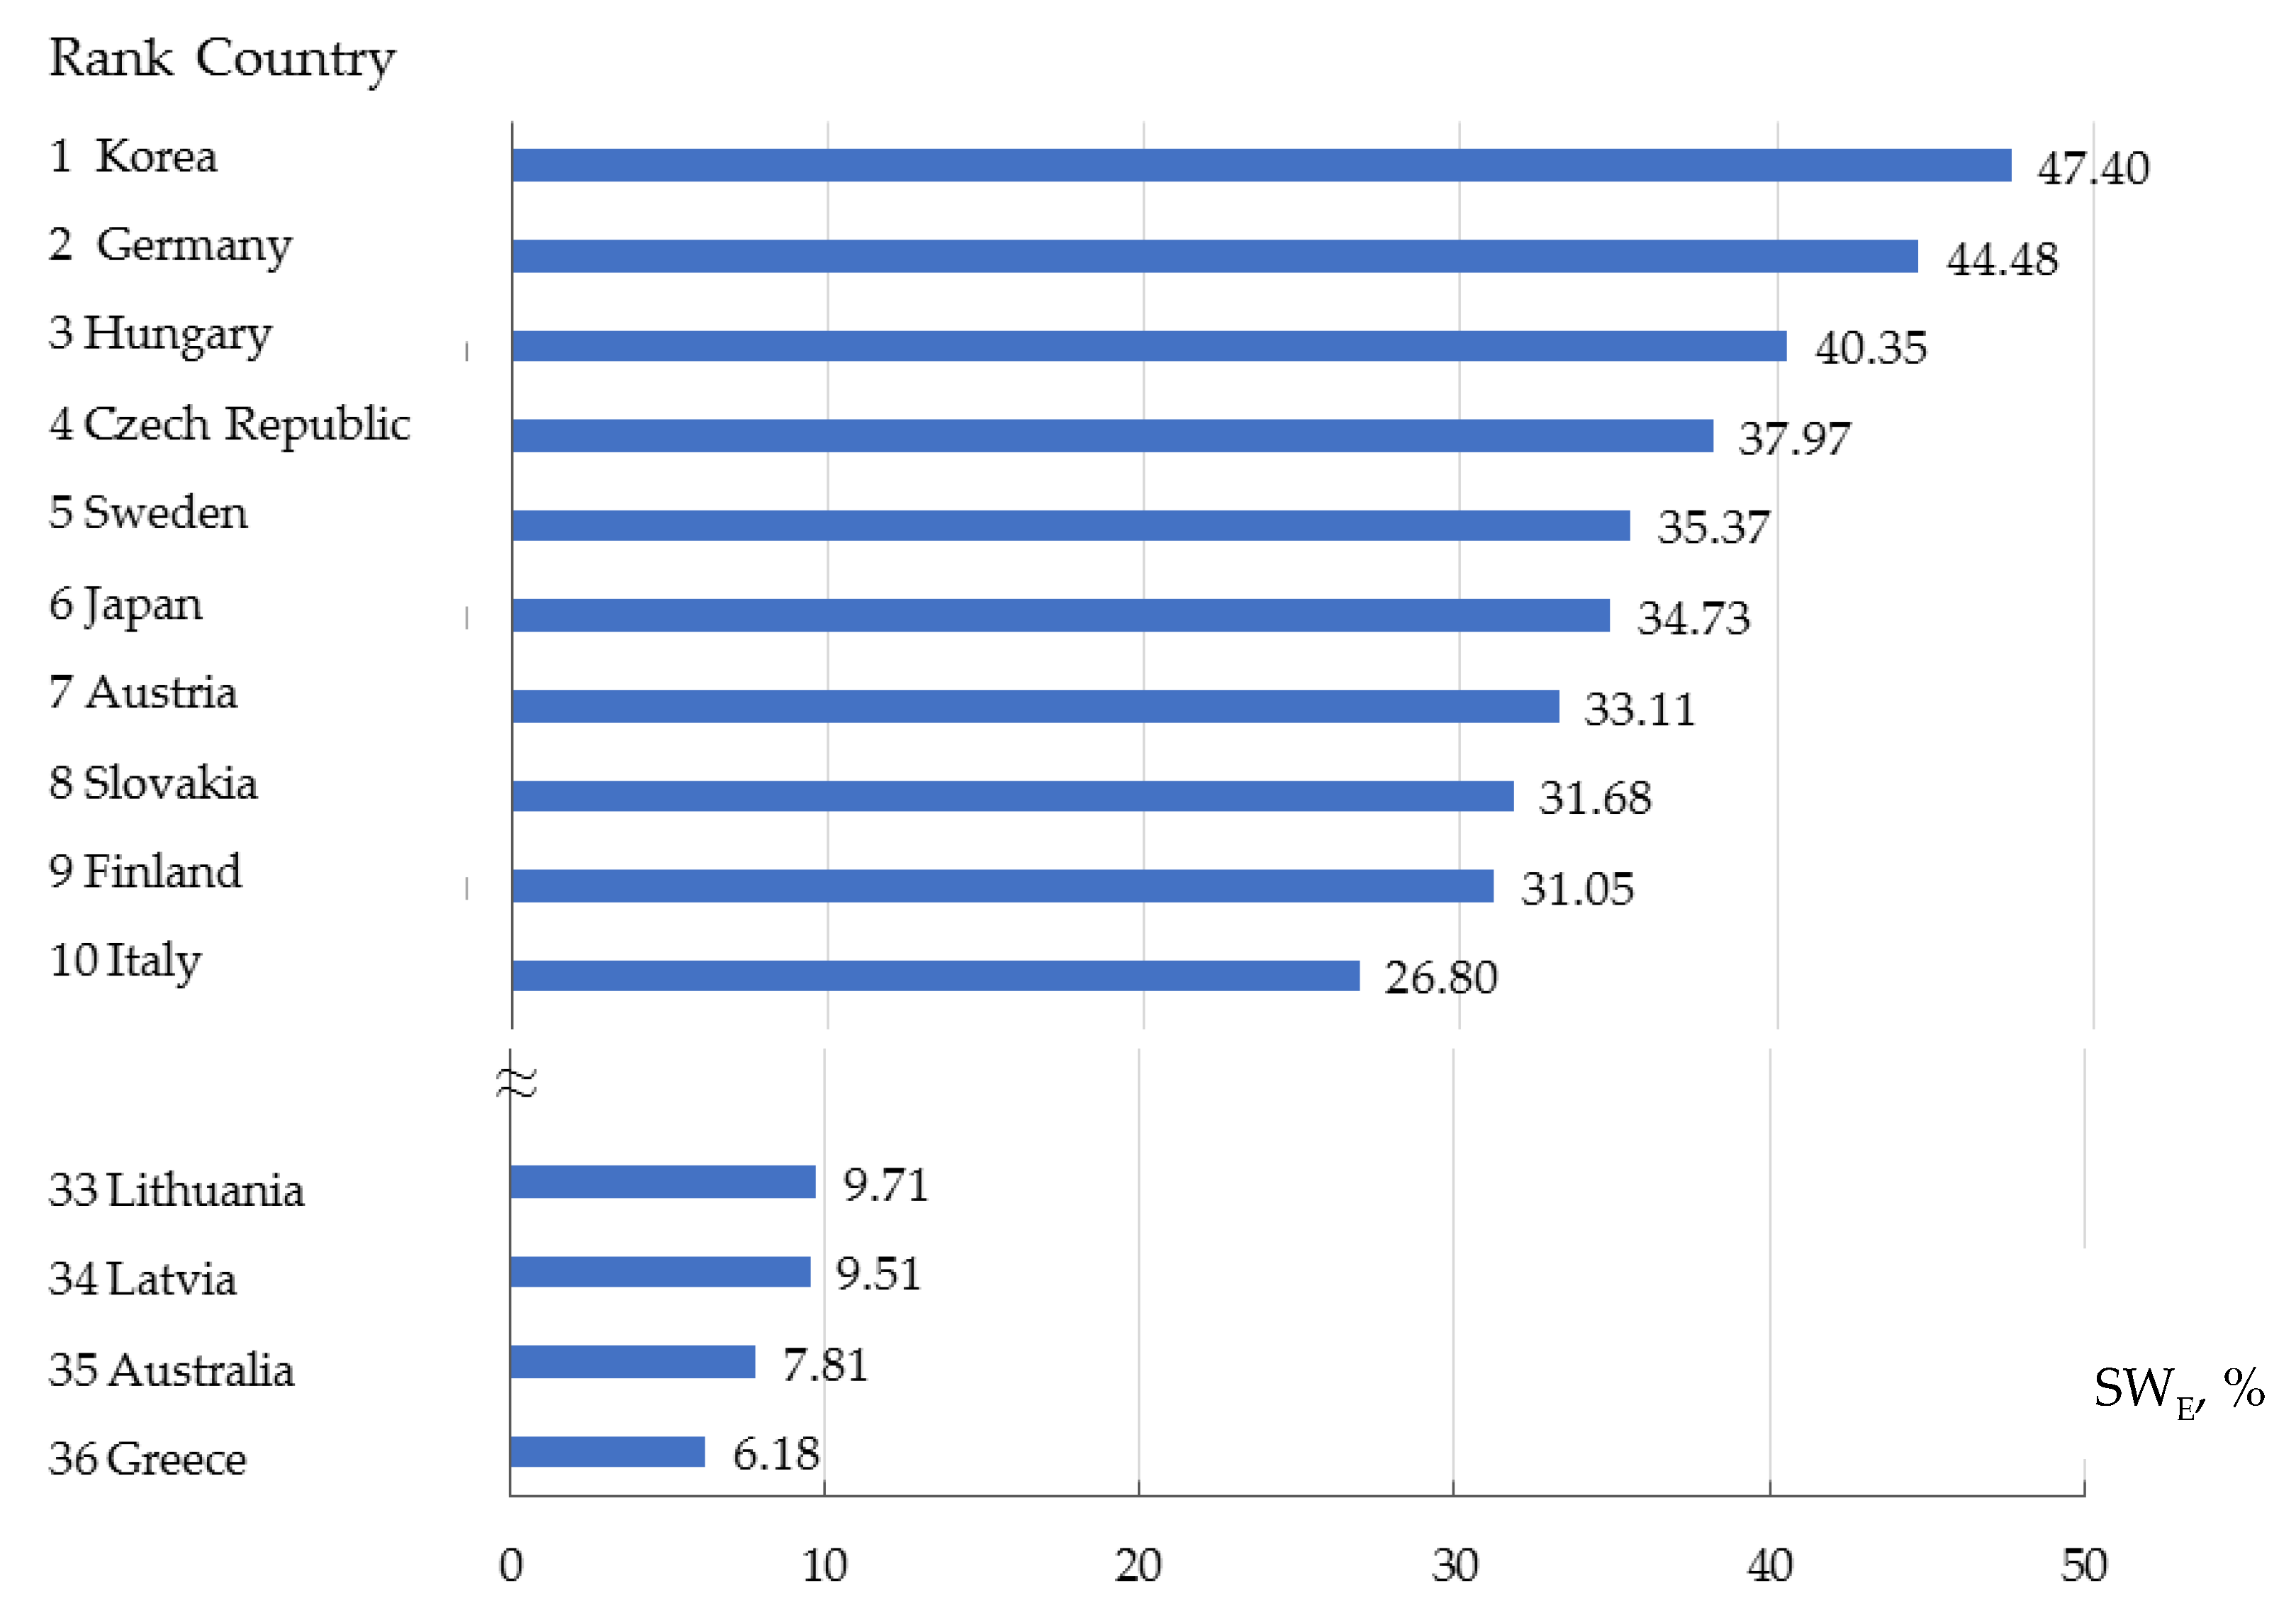
| No. | Country | Specific Weight of the Engineering TEA GVA (SWE) in the General Volume of the Industrial GVA | |||||
|---|---|---|---|---|---|---|---|
| 2009 p. | 2011 p. | 2014 p. | |||||
| % | Rank | % | Rank | % | Rank | ||
| 1 | Australia | 7.93 | 36 | 6.77 | 36 | 7.81 | 35 |
| 2 | Austria | 31.67 | 6 | 32.93 | 6 | 33.11 | 7 |
| 3 | Belgium | 18.53 | 22 | 18.24 | 21 | 16.86 | 24 |
| 4 | Bulgaria | 12.85 | 30 | 12.85 | 31 | 13.09 | 28 |
| 5 | Brazil | 18.07 | 23 | 17.13 | 25 | 18.81 | 21 |
| 6 | United Kingdom | 22.42 | 17 | 24.23 | 15 | 21.63 | 15 |
| 7 | Greece | 7.99 | 35 | 7.99 | 35 | 6.18 | 36 |
| 8 | Denmark | 27.93 | 10 | 23.38 | 16 | 21.80 | 14 |
| 9 | Estonia | 17.39 | 25 | 17.39 | 24 | 16.75 | 25 |
| 10 | India | 19.73 | 20 | 20.68 | 19 | 17.30 | 23 |
| 11 | Ireland | 19.66 | 21 | 17.98 | 22 | 10.05 | 31 |
| 12 | Spain | 20.06 | 19 | 19.28 | 20 | 19.74 | 17 |
| 13 | Italy | 27.82 | 11 | 28.54 | 11 | 26.80 | 10 |
| 14 | Canada | 14.94 | 27 | 21.43 | 18 | 13.82 | 27 |
| 15 | China | 26.55 | 15 | 26.55 | 14 | 26.45 | 11 |
| 16 | Korea | 48.45 | 1 | 49.59 | 1 | 47.40 | 1 |
| 17 | Latvia | 9.87 | 34 | 9.87 | 34 | 9.51 | 34 |
| 18 | Lithuania | 12.16 | 32 | 12.16 | 32 | 9.71 | 33 |
| 19 | Mexico | 15.26 | 26 | 16.42 | 28 | 19.56 | 19 |
| 20 | Netherlands | 14.87 | 28 | 16.85 | 26 | 19.32 | 20 |
| 21 | Germany | 43.76 | 2 | 46.31 | 3 | 44.48 | 2 |
| 22 | Poland | 20.36 | 18 | 15.95 | 29 | 17.63 | 22 |
| 23 | Portugal | 17.71 | 24 | 17.71 | 23 | 12.54 | 29 |
| 24 | Russia | 10.59 | 33 | 10.23 | 33 | 9.81 | 32 |
| 25 | Romania | 22.45 | 16 | 22.45 | 17 | 19.58 | 18 |
| 26 | Slovakia | 27.11 | 13 | 27.11 | 12 | 31.68 | 8 |
| 27 | Slovenia | 26.99 | 14 | 26.99 | 13 | 24.46 | 13 |
| 28 | USA | 27.72 | 12 | 28.58 | 10 | 24.79 | 12 |
| 29 | Turkey | 14.42 | 29 | 14.77 | 30 | 14.21 | 26 |
| 30 | Hungary | 40.63 | 3 | 46.93 | 2 | 40.35 | 3 |
| 31 | Ukraine | 12.76 | 31 | 16.64 | 27 | 11.54 | 30 |
| 32 | Finland | 33.07 | 4 | 30.34 | 8 | 31.05 | 9 |
| 33 | France | 29.04 | 9 | 28.88 | 9 | 21.35 | 16 |
| 34 | Czech Republic | 32.11 | 5 | 35.81 | 4 | 37.97 | 4 |
| 35 | Sweden | 30.51 | 8 | 34.00 | 5 | 35.37 | 5 |
| 36 | Japan | 31.09 | 7 | 31.14 | 7 | 34.73 | 6 |
| Average value | 22.91 | 23.36 | 22.16 | ||||
| 22.81 | |||||||
Appendix D
| No. | Country | Specific Weight of the Manufacturing Industry GVA (SWM) in the General Volume of the Industrial GVA | Specific Weight of the High-Technology Sector GVA (SWHTS) in the General Volume of the Industrial GVA | Specific Weight of the ENGINEERING TEA GVA (SWE) in the General Volume of the Industrial GVA | |||
|---|---|---|---|---|---|---|---|
| % | Rank | % | Rank | % | Rank | ||
| 1 | Australia | 41.97 | 36 | 13.41 | 35 | 7.81 | 35 |
| 2 | Austria | 84.26 | 6 | 43.90 | 10 | 33.11 | 7 |
| 3 | Belgium | 83.06 | 8 | 44.30 | 9 | 16.86 | 24 |
| 4 | Bulgaria | 65.47 | 31 | 22.51 | 28 | 13.09 | 28 |
| 5 | Brazil | 65.56 | 30 | 30.42 | 21 | 18.81 | 21 |
| 6 | United Kingdom | 71.43 | 27 | 35.41 | 18 | 21.63 | 15 |
| 7 | Greece | 71.67 | 26 | 12.70 | 36 | 6.18 | 36 |
| 8 | Denmark | 73.37 | 24 | 46.35 | 7 | 21.80 | 14 |
| 9 | Estonia | 71.06 | 28 | 22.38 | 29 | 16.75 | 25 |
| 10 | India | 78.20 | 18 | 30.09 | 22 | 17.30 | 23 |
| 11 | Ireland | 88.06 | 3 | 42.27 | 12 | 10.05 | 31 |
| 12 | Spain | 76.84 | 20 | 33.30 | 20 | 19.74 | 17 |
| 13 | Italy | 82.00 | 11 | 38.43 | 15 | 26.80 | 10 |
| 14 | Canada | 49.64 | 35 | 20.20 | 31 | 13.82 | 27 |
| 15 | China | 78.82 | 17 | 37.08 | 17 | 26.45 | 11 |
| 16 | Korea | 91.09 | 1 | 60.71 | 1 | 47.40 | 1 |
| 17 | Latvia | 71.86 | 25 | 16.84 | 32 | 9.51 | 34 |
| 18 | Lithuania | 81.39 | 13 | 24.82 | 26 | 9.71 | 33 |
| 19 | Mexico | 65.05 | 32 | 28.10 | 24 | 19.56 | 19 |
| 20 | Netherlands | 70.50 | 29 | 34.89 | 19 | 19.32 | 20 |
| 21 | Germany | 87.53 | 4 | 58.77 | 2 | 44.48 | 2 |
| 22 | Poland | 73.82 | 23 | 29.01 | 23 | 17.63 | 22 |
| 23 | Portugal | 76.67 | 21 | 21.93 | 30 | 12.54 | 29 |
| 24 | Russia | 51.59 | 34 | 15.22 | 34 | 9.81 | 32 |
| 25 | Romania | 77.72 | 19 | 25.91 | 25 | 19.58 | 18 |
| 26 | Slovakia | 82.04 | 10 | 41.87 | 13 | 31.68 | 8 |
| 27 | Slovenia | 83.43 | 7 | 46.51 | 6 | 24.46 | 13 |
| 28 | USA | 73.91 | 22 | 39.39 | 14 | 24.79 | 12 |
| 29 | Turkey | 80.43 | 15 | 23.75 | 27 | 14.21 | 26 |
| 30 | Hungary | 87.29 | 5 | 56.05 | 3 | 40.35 | 3 |
| 31 | Ukraine | 58.01 | 33 | 16.40 | 33 | 11.54 | 30 |
| 32 | Finland | 82.19 | 9 | 42.60 | 11 | 31.05 | 9 |
| 33 | France | 79.95 | 16 | 37.53 | 16 | 21.35 | 16 |
| 34 | Czech Republic | 81.21 | 14 | 48.93 | 4 | 37.97 | 4 |
| 35 | Sweden | 81.98 | 12 | 48.63 | 5 | 35.37 | 5 |
| 36 | Japan | 90.55 | 2 | 45.61 | 8 | 24.73 | 6 |
| Average value | 75.76 | 34.85 | 22.16 | ||||
Appendix E
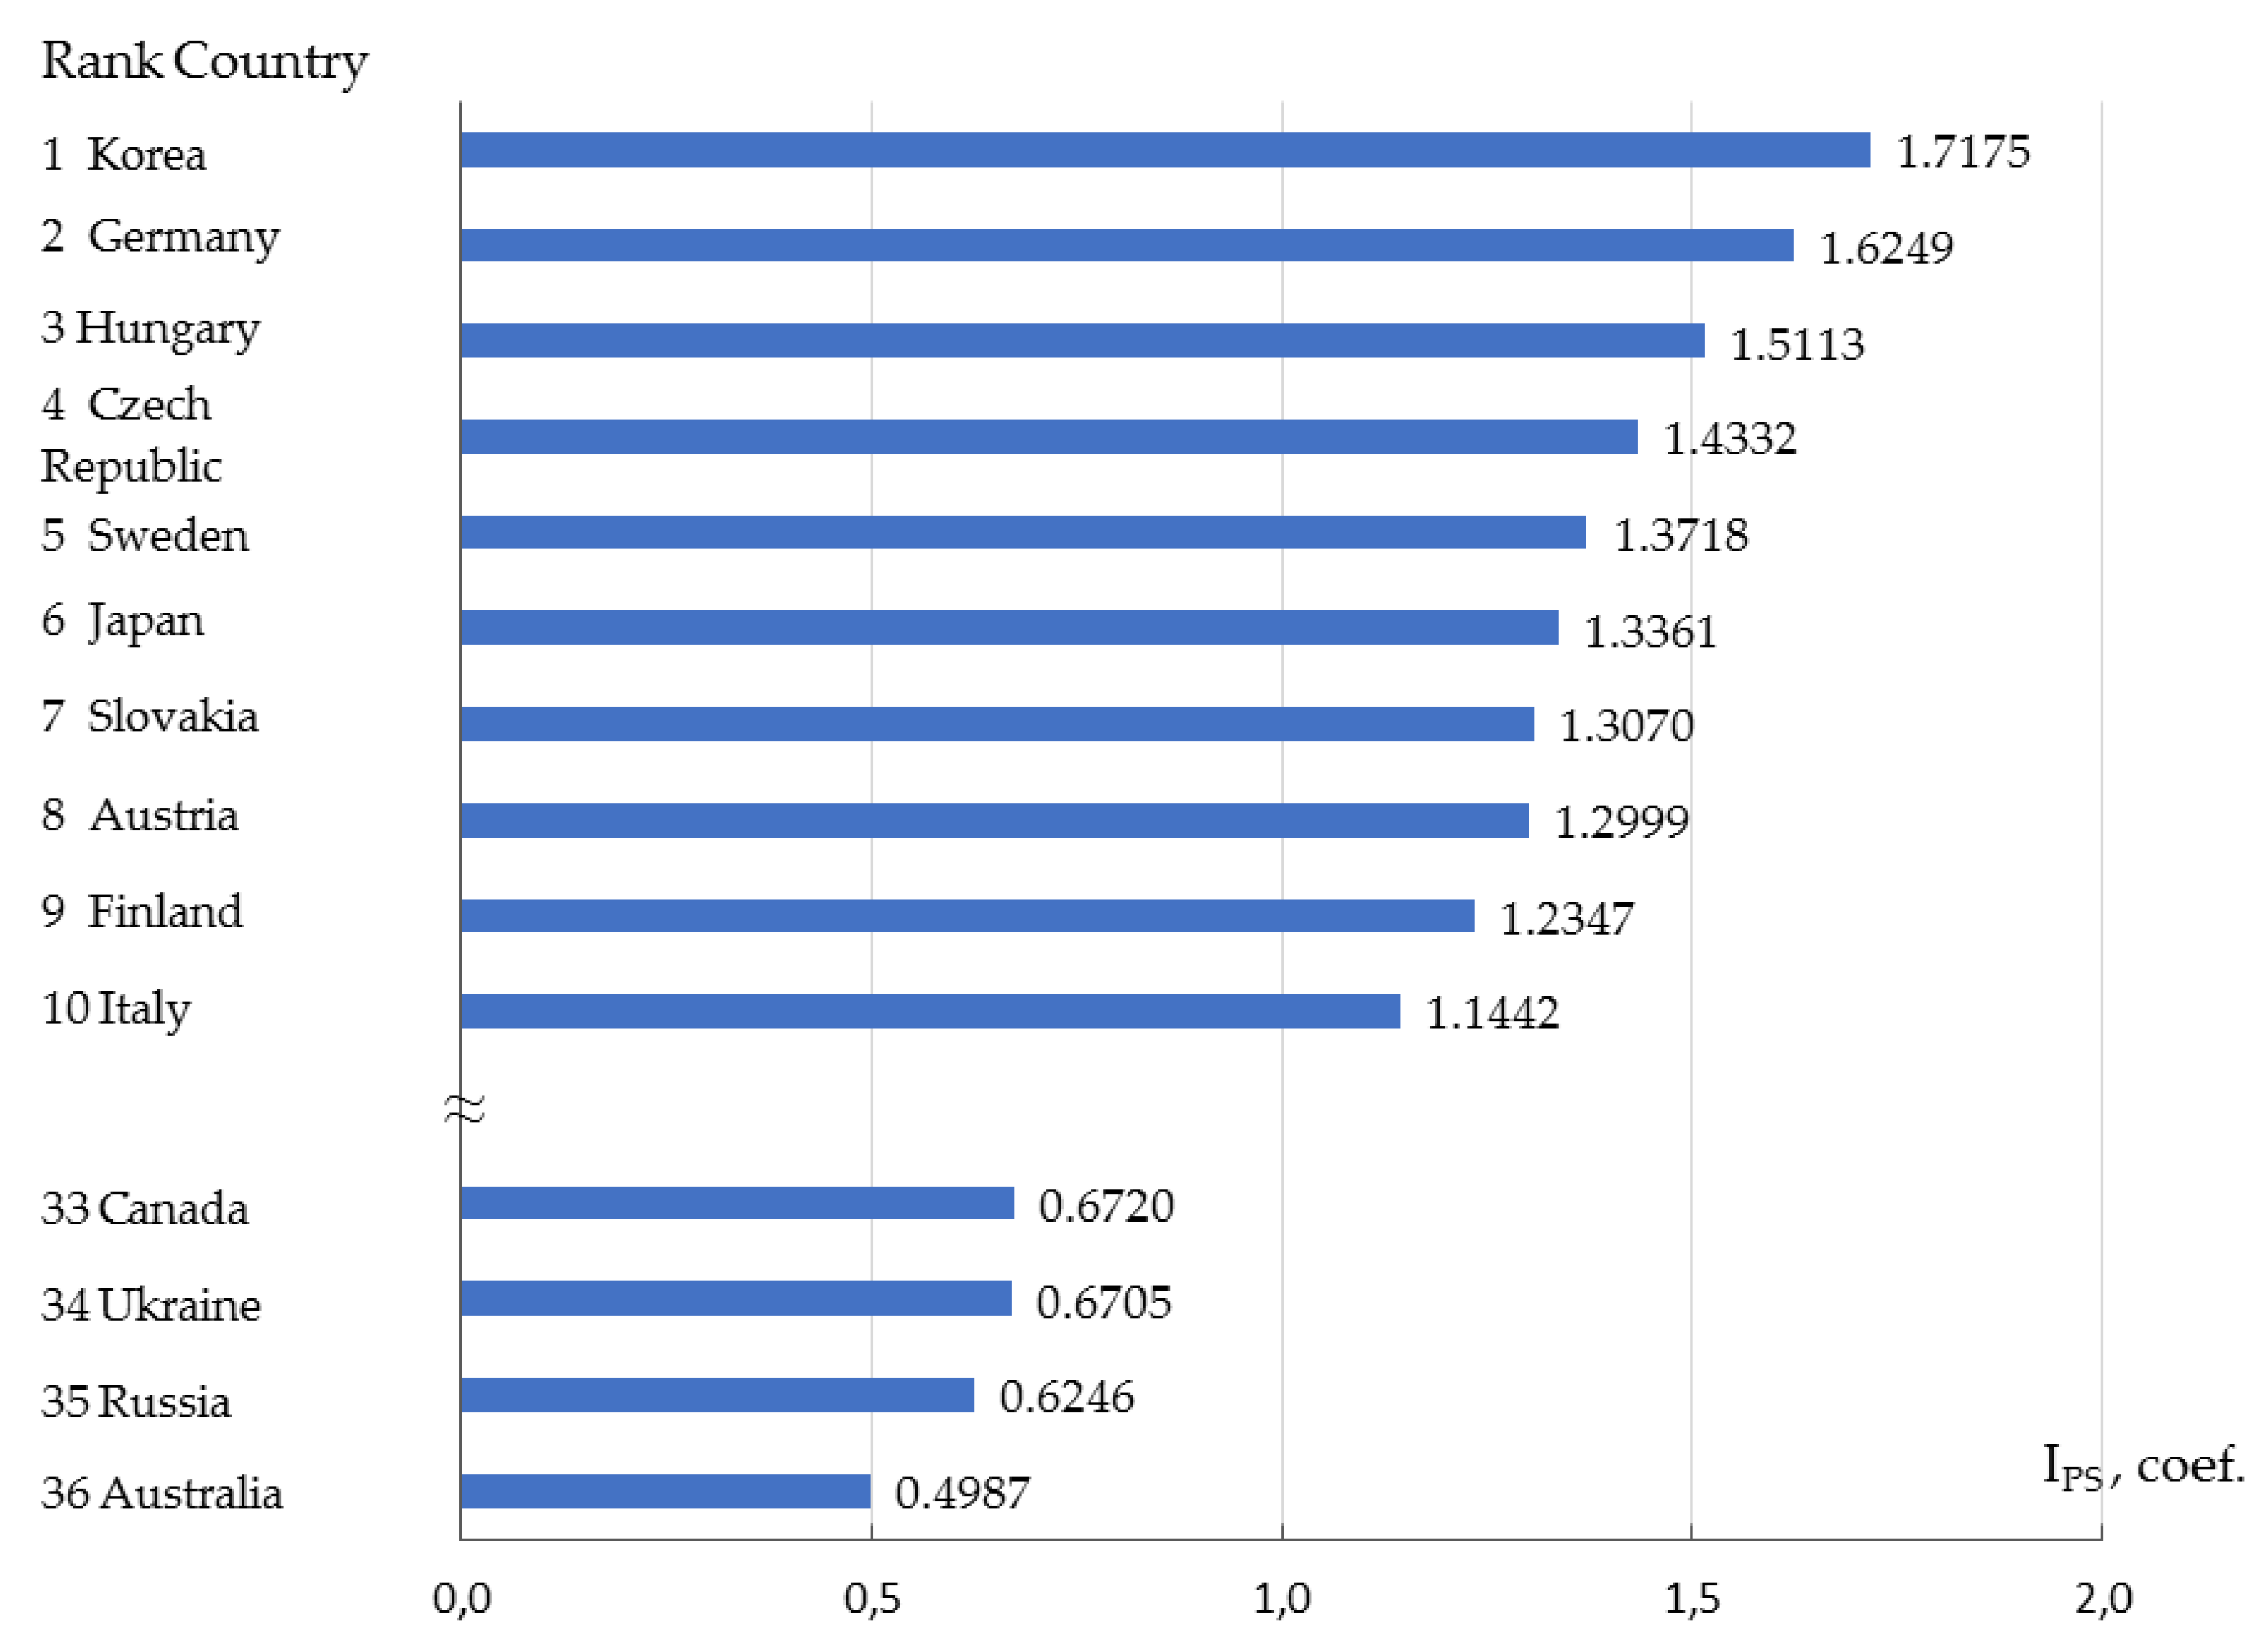
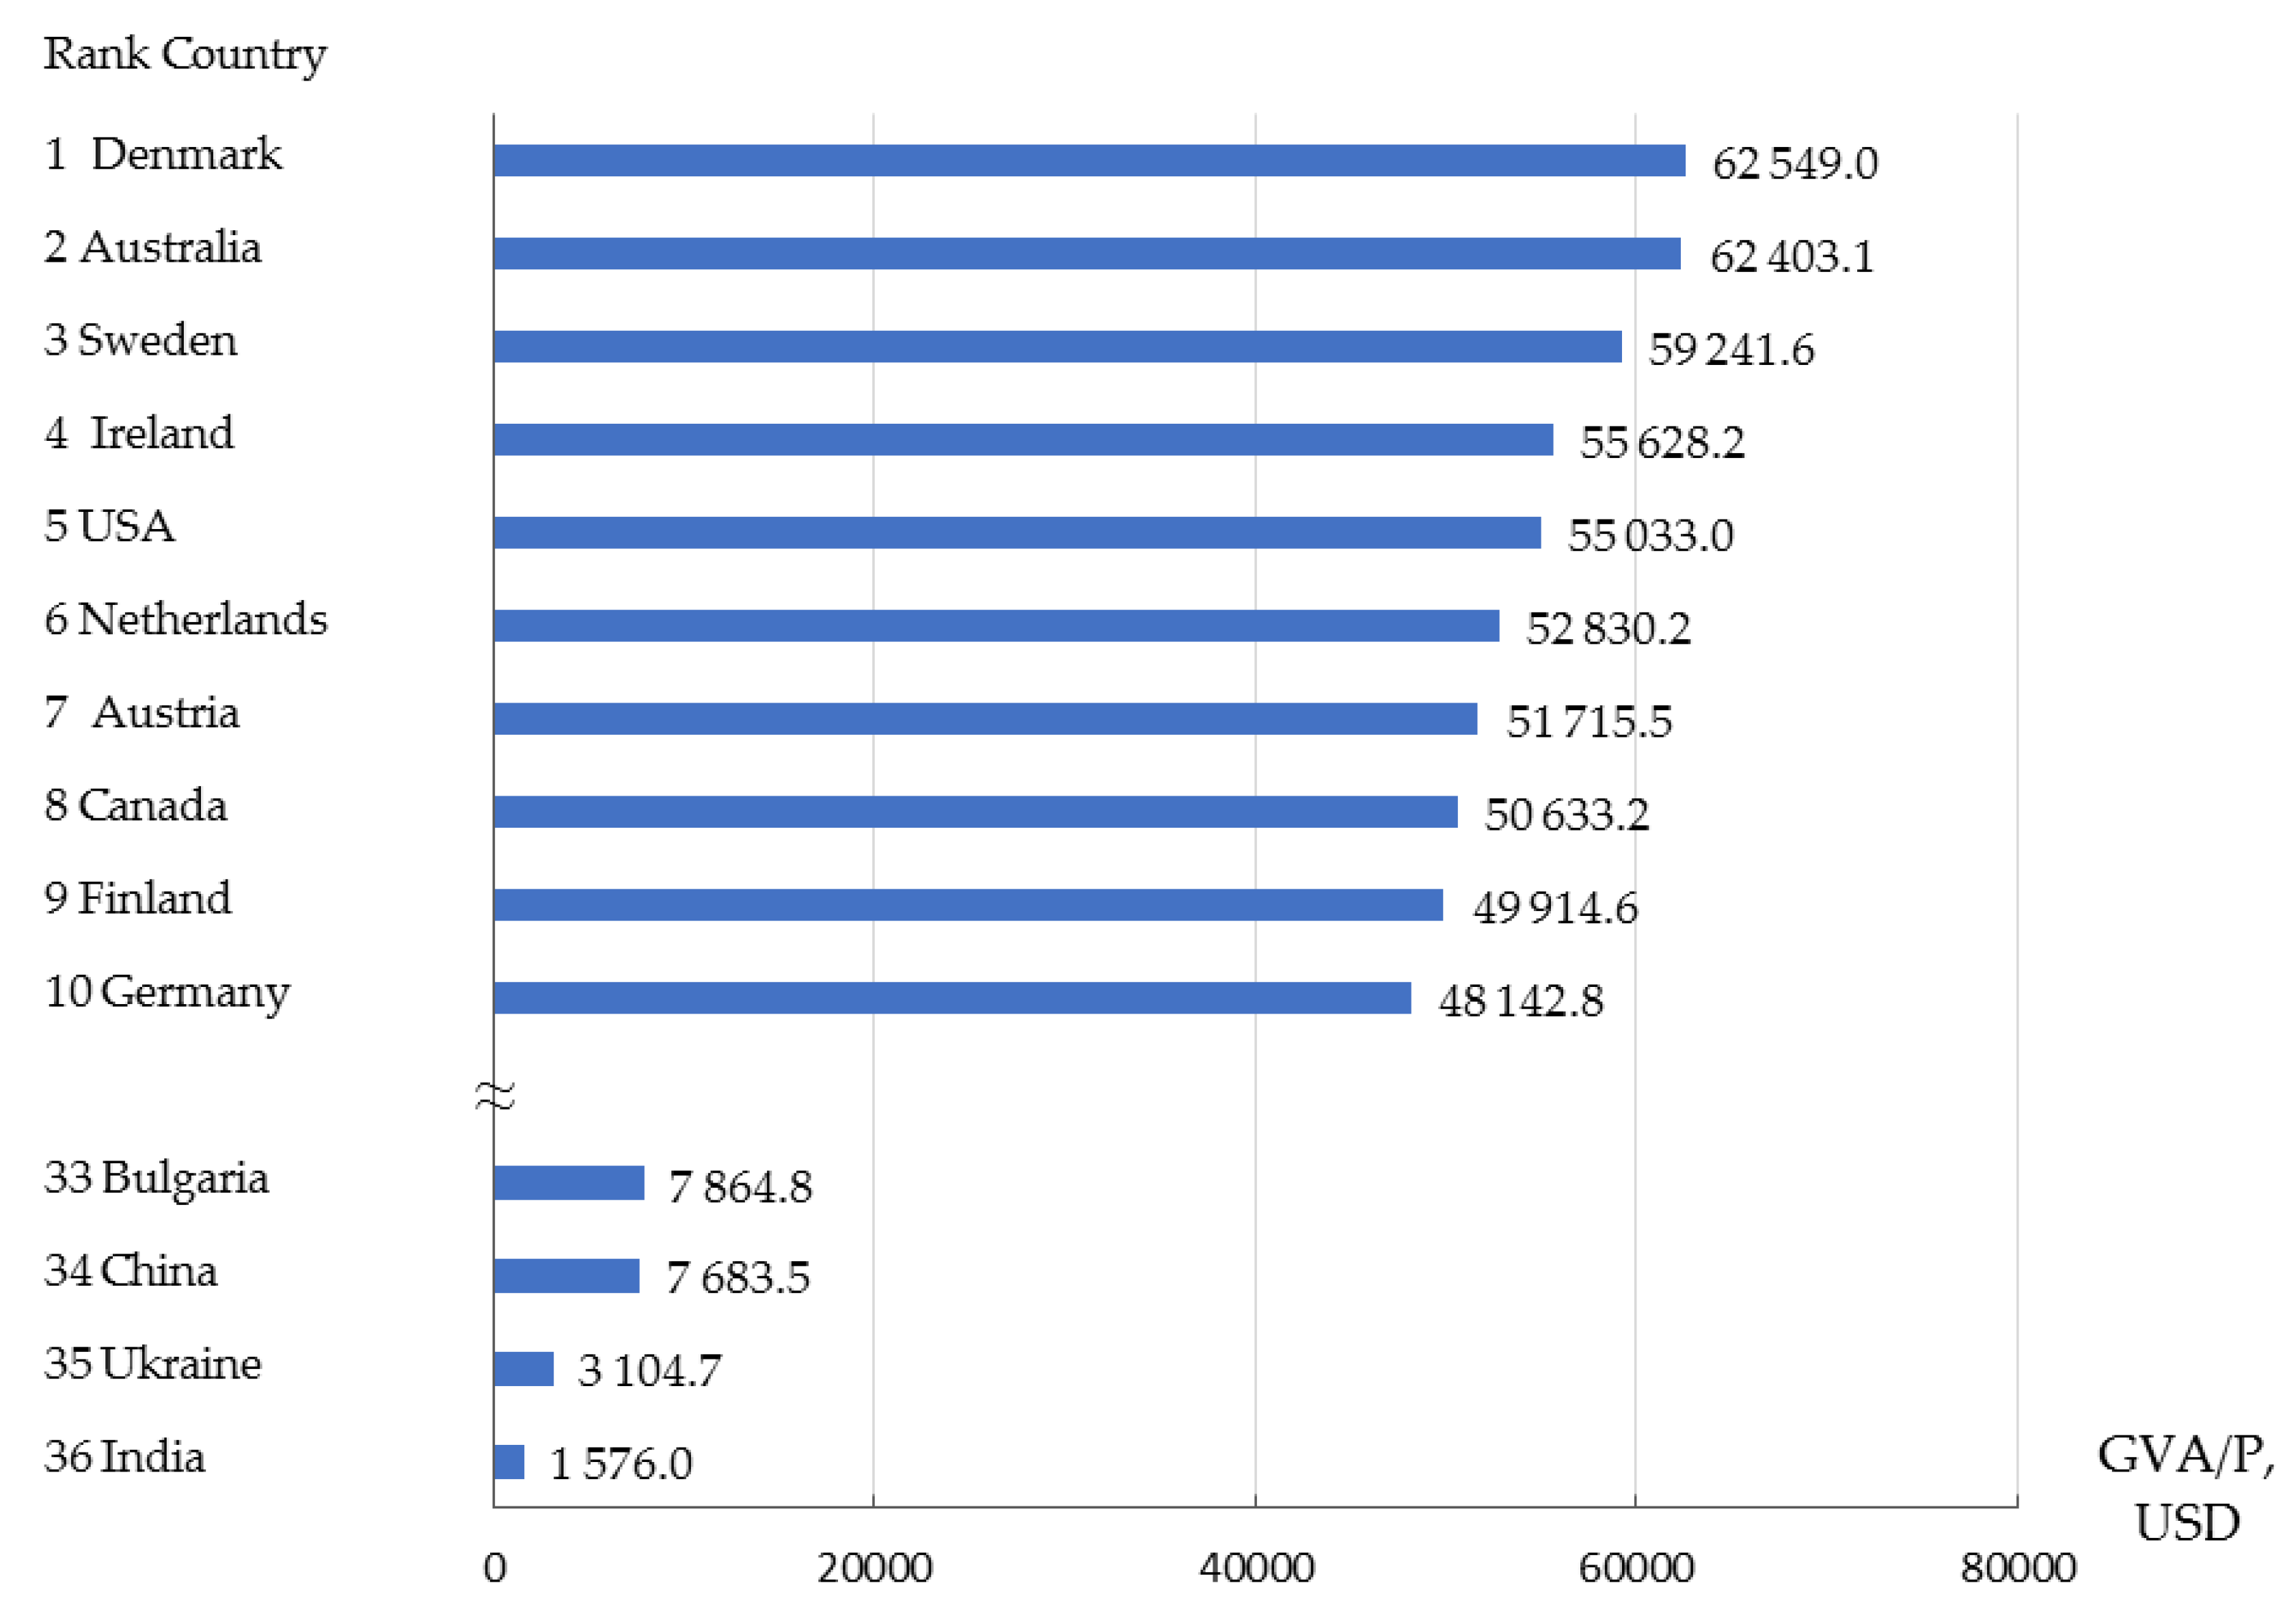
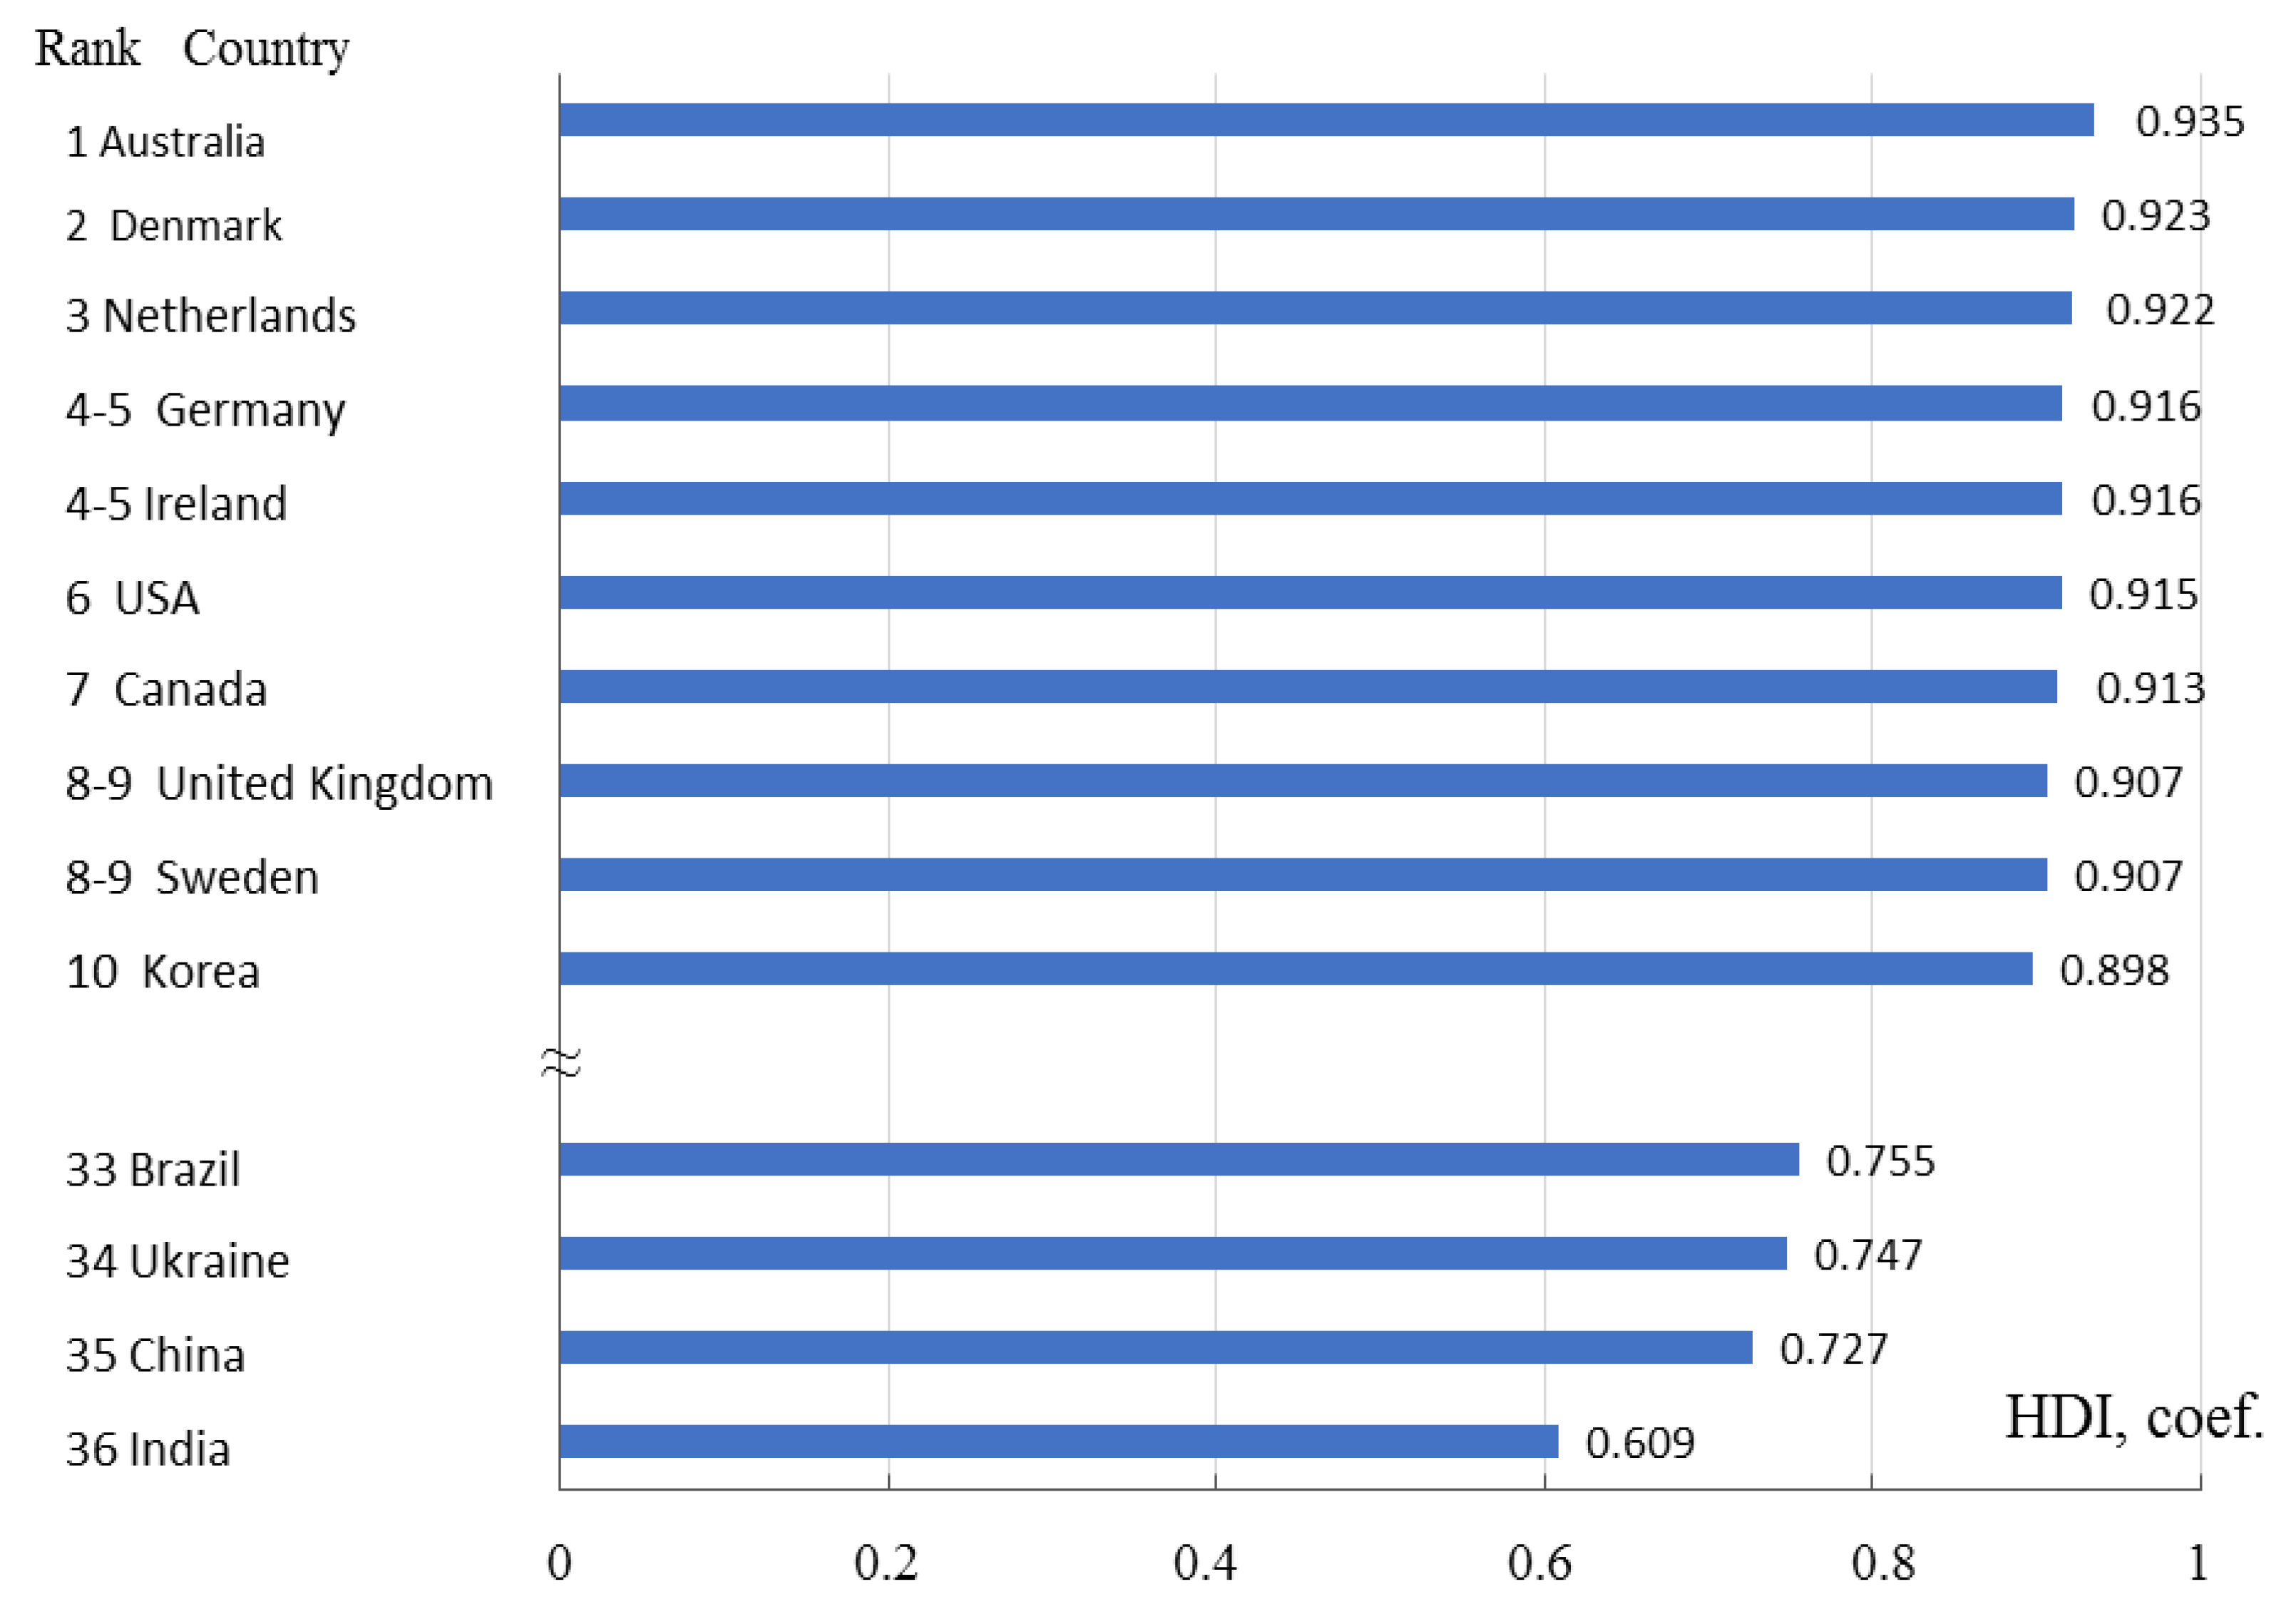
| No. | Country | GVA per Capita, USD (at Current Prices) | Human Development Index (HDI) | IPS | |||
|---|---|---|---|---|---|---|---|
| Value | Rank | Value | Rank | Value | Rank | ||
| 1 | Australia | 62,403.1 | 2 | 0.935 | 1 | 0.4987 | 36 |
| 2 | Austria | 51,717.5 | 7 | 0.885 | 14 | 1.2999 | 8 |
| 3 | Belgium | 47,355.3 | 11 | 0.890 | 12 | 1.0526 | 12 |
| 4 | Bulgaria | 7,864.8 | 33 | 0.782 | 30 | 0.7541 | 28 |
| 5 | Brazil | 12,026.6 | 30 | 0.755 | 33 | 0.8095 | 24 |
| 6 | United Kingdom | 46,967.7 | 12 | 0.907 | 8-9 | 0.9934 | 18 |
| 7 | Greece | 21,761.0 | 20 | 0.865 | 20 | 0.6916 | 31 |
| 8 | Denmark | 62,549.0 | 1 | 0.923 | 2 | 1.0309 | 16 |
| 9 | Estonia | 20,247.2 | 21 | 0.861 | 21 | 0.8482 | 23 |
| 10 | India | 576.0 | 36 | 0.609 | 36 | 0.8869 | 22 |
| 11 | Ireland | 55,628.2 | 4 | 0.916 | 4-5 | 0.7978 | 26 |
| 12 | Spain | 29,623.2 | 16 | 0.876 | 17 | 0.9984 | 17 |
| 13 | Italy | 35,396.7 | 15 | 0.873 | 18 | 1.1442 | 11 |
| 14 | Canada | 50,633.2 | 8 | 0.913 | 7 | 0.6720 | 33 |
| 15 | China | 7,683.5 | 34 | 0.674 | 5 | 0.727 | 35 |
| 16 | Korea | 27,811.4 | 17 | 0.898 | 10 | 1.7115 | 1 |
| 17 | Latvia | 15,716.4 | 25 | 0.819 | 27 | 0.6796 | 32 |
| 18 | Lithuania | 16,545.1 | 24 | 0.839 | 24 | 0.7250 | 30 |
| 19 | Mexico | 10,582.4 | 31 | 0.756 | 32 | 0.7980 | 25 |
| 20 | Netherlands | 52,830 | 6 | 0.922 | 3 | 0.9082 | 21 |
| 21 | Germany | 48,142.8 | 10 | 0.916 | 4-5 | 1.6249 | 2 |
| 22 | Poland | 14,345.2 | 26 | 0.843 | 23 | 0.9193 | 19 |
| 23 | Portugal | 22,077.5 | 19 | 0.830 | 25 | 0.7675 | 27 |
| 24 | Russia | 14,125.9 | 28 | 0.798 | 28 | 0.6246 | 35 |
| 25 | Romania | 10,027.0 | 32 | 0.793 | 29 | 0.5181 | 20 |
| 26 | Slovakia | 18,629.8 | 23 | 0.844 | 22 | 1.3070 | 7 |
| 27 | Slovenia | 24,202.4 | 18 | 0.880 | 16 | 1.2255 | 10 |
| 28 | USA | 55,033.0 | 5 | 0.915 | 5 | 1.0526 | 13 |
| 29 | Turkey | 12,127.5 | 29 | 0.761 | 31 | 0.7441 | 29 |
| 30 | Hungary | 14,197.8 | 27 | 0.828 | 26 | 1.5153 | 3 |
| 31 | Ukraine | 3,104.7 | 35 | 0.747 | 34 | 0.6705 | 34 |
| 32 | Finland | 49,914.6 | 9 | 0.883 | 15 | 1.2347 | 9 |
| 33 | France | 43,008.7 | 13 | 0.888 | 13 | 1.0436 | 14 |
| 34 | Czech Republic | 19,744.6 | 22 | 0.870 | 19 | 1.4332 | 4 |
| 35 | Sweden | 59,241.6 | 3 | 0.907 | 8-9 | 1.3718 | 5 |
| 36 | Japan | 38,109.4 | 14 | 0.891 | 11 | 1.3361 | 6 |
| Average value | 30,541.6 | 0.848 | 0.9838 | ||||
References
- Jorgenson, D.W.; Timmer, M. Structural Change in Advanced Nations: A New Set of Stylised Facts. Scand. J. Econ. 2011, 113, 1–29. [Google Scholar] [CrossRef]
- Rodrik, D. Unconditional Convergence in Manufacturing. Q. J. Econ. 2013, 128, 165–204. [Google Scholar] [CrossRef]
- Rocha, I.L. Manufacturing as driver of economic growth. PSL Q. Rev. 2018, 71, 103–138. [Google Scholar] [CrossRef]
- Khaustova, V.Y. Industrial Policy in Ukraine: Formation and Forecasting; INZHEK PH: Kharkiv, Ukraine, 2015; ISBN 978-966-392-143-3. Available online: https://www.researchgate.net/publication/335919701_Promislova_politika_v_Ukraini_formuvanna_ta_prognozuvanna_INDUSTRIAL_POLICY_IN_UKRAINE_FORMATION_AND_FORECASTING (accessed on 9 January 2020).
- Kyzym, M.O.; Khaustova, V.Y.; Kramarev, H.V. Substantiation of perspective directions of development of Ukrainian manufacturing industry. Probl. Econ. 2019, 1, 28–45. [Google Scholar] [CrossRef]
- Agenda Item 3–Adaptation of Industrial policy to the digital world for economic diversification and structural transformation. In Proceedings of the Multi-year Expert Meeting on Better Economic Conditions at All Levels in Support of Inclusive and Sustainable Development and Promotion of Economic Integration and Cooperation, Geneva, Switzerland, 19–20 March 2018; Trade and Development Commission. Available online: https://unctad.org/en/pages/MeetingDetails.aspx?meetingid=1693 (accessed on 1 February 2020).
- World Input-Output Database. Available online: http://www.wiod.org/home (accessed on 27 November 2019).
- Fritsch, M. Theory of economic development. An Inquiry into Profits, Capital, Credit, Interest, and the Business Cycle. Reg. Studies 2017, 51, 654–655. [Google Scholar] [CrossRef]
- Fisher, A. The Clash of Progress and Security; Macmillan: London, UK, 1935. [Google Scholar]
- Clark, C. The Conditions of Economic Progress; Macmillan: London, UK, 1940. [Google Scholar]
- Fourastie, J. Predicting Economic Changes in Our Time. Diogenes 1954, 2, 14–38. [Google Scholar] [CrossRef]
- Rosenstein-Rodan, P.N. Problems of industrialization of Eastern and South-Eastern Europe. Econ. J. 1943, 53, 202–211. [Google Scholar] [CrossRef]
- Nurkse, R. Problems of Capital Formation in Underdeveloped Countries; Basil Blackwell: Oxford, UK, 1953. [Google Scholar]
- Lewis, A. Economic Development with Unlimited Supplies of Labour. Manchester Sch. 1954, 22, 139–191. [Google Scholar] [CrossRef]
- Ranis, G.; Fei, J.C.H. A Theory of Economic Development. Am. Econ. Rev. 1961, 51, 533–565. [Google Scholar]
- Chenery, H.; Watanabe, T. International Comparisons of the Structure of Production. JSTOR Econom. 1958, 26, 487–521. Available online: http://www.jstor.org/stable/1907514 (accessed on 20 November 2019). [CrossRef]
- Hirschman, A. Interregional and International Transmission of Economic Growth. The Strategy of Economic Development; Norton: Nueva York, NY, USA, 1958. [Google Scholar]
- Hoffman, W.G. The Growth of Industrial Economics; Manchester University Press: Manchester, UK, 1958. [Google Scholar]
- Kuznets, S. Modern Economic Growth: Rate, Structure and Spread; Yale University Press: New Haven, CT, USA, 1966. [Google Scholar]
- Todaro, M.P. A model of labor migration and urban unemployment in less developed countries. Am. Econ. Rev. 1969, 59, 138–149. [Google Scholar]
- Todaro, M.P.; Smith, S.C. Economic Development; Addison-Wesley: Boston, MA, USA, 2009. [Google Scholar]
- Chenery, H.; Syrquin, M. Patterns of Development, 1950–1970; Oxford University Press: Londres, UK, 1975. [Google Scholar]
- Chenery, H.; Syrquin, M. A Comparative Analysis of Industrial Growth. In Economic Growth and Resources; Matthews, R.C.O., Ed.; International Economic Association Series; Palgrave Macmillan: London, UK, 1980. [Google Scholar] [CrossRef]
- Ishikawa, S. Structural Change. In The New Palgrave: A Dictionary of Economics; Eatwell, J., Milgate, M., Newman, P., Eds.; Springer: London, UK, 1987; pp. 523–525. [Google Scholar] [CrossRef]
- Raiser, M.; Schaffer, M.; Schuchhardt, J. Benchmarking Structural Change in Transition; Working paper, 79; European Bank for Reconstruction and Development: London, UK, 2003. [Google Scholar]
- Thießen, U.; Gregory, P.R. Modelling the Structural Change of Transition Countries; Institute for Economic Research: DIW Berlin, Germany, 2005. [Google Scholar]
- Kyzym, M.O.; Milyutin, H.V. The Structural Changes in the Economy of Ukraine and its Energy Intensity. Bus. Inform. 2017, 12, 132–143. Available online: https://www.business-inform.net/search/?qu=KYZYM&x=0&y=0 (accessed on 20 November 2019).
- Gryshova, I.; Shabatura, T.; Girdzijauskas, S.; Streimikiene, D.; Ciegis, R.; Griesiene, I. The Paradox of Value and Economic Bubbles: New Insights for Sustainable Economic Development. Sustainability 2019, 11, 6888. [Google Scholar] [CrossRef] [Green Version]
- Beg, M.; Basarac Sertic, M.; Druzic, I. Determinants of Deindustrialization in Developed European and Post-Communist Countries. Monten. J. Econo. 2017, 13, 93–106. [Google Scholar] [CrossRef]
- Dudzevičiūtė, G.; Mačiulis, A.; Tvaronavičienė, M. Structural Changes of Economies: Lithuania in the Global Context. Technol. Econo. Dev. Econ. 2014, 20, 353–370. [Google Scholar] [CrossRef]
- Teigeiro, L.R.; Solis, J.S. Coefficient stability and structural change in the Spanish economy. Econ. Chang. Restruct. 2007, 40, 387–409. [Google Scholar] [CrossRef]
- Alba, L.-L. Structural changes and convergence in EU and in Adriatic-Balkans region. ERSA Conference Papers; European Regional Science Association, 2011. Available online: http://revecon.ro/articles/2011-1/2011-1-5.pdf (accessed on 15 November 2019).
- Jiang, Y. Structural change and growth in China under economic reforms: Patterns, causes and implications. Rev. Urban Regional Dev. Studies 2011, 23, 48–65. [Google Scholar] [CrossRef]
- Mao, R.; Yao, Y. Structural change in small open economy: An application to South Korea. Pac. Econ. Rev. 2012, 17, 29–56. [Google Scholar]
- Zdrazil, P.; Kraftova, I.; Mateja, Z. Reflection of Industrial Structure in Innovative Capability. Inz. Ekon. Eng. Econ. 2016, 27, 304–315. [Google Scholar] [CrossRef] [Green Version]
- Tanuwidjaja, E.; Thangavelu, S. Structural change and productivity growth in the Japanese manufacturing industry. Global Econ. Rev. 2007, 36, 385–405. [Google Scholar]
- Matsuyama, K. Structural change in an interdependent world: A global view of manufacturing decline. J. Eur. Econ. Association 2009, 7, 478–486. [Google Scholar] [CrossRef]
- Kokocinska, M.; Puziak, M. Structural Changes in the Economy in the Light of the Neoclassical Approach. A Case Study: Spain and Poland. Rev. Econ. Mund. 2009, 21, 169–193. Available online: http://www.redalyc.org/articulo.oa?id=86611886007 (accessed on 20 January 2020).
- Cho, B.-S.; Cho, S.S.; Lee, J. An Alternative Approach of Input-Output Tables to Dynamic Structure Changes in Korean IT Industries. Technol. Econ. Dev. Econ. 2013, 19, 257–271. [Google Scholar] [CrossRef]
- Gryshova, I.; Petrova, M.; Tepavicharova, M.; Diachenko, A.P.; Gutsul, T. A model for selection of a management team to ensure the sustainability and development of the business organizations. Entrepreneurship Sustain. 2019, 7, 690–703. [Google Scholar] [CrossRef]
- Noguera-Méndez, P.; Semitiel-García, M.; Lypez-Martínez, M. Estructura interindustrialy desarrollo económico. Un análisis desde las perspectivas de redese input-output (Interindustrial Structure and Economic Development. An Analysis from Network and Input-Output Perspectives). Trimest. Econ. 2016, 331, 581–609. [Google Scholar] [CrossRef] [Green Version]
- Kamaruddin, R.; Masron, T.A. Sources of Growth in the Manufacturing Sector in Malaysia: Evidence from ARDL AND Structural Decomposition Analyses. Asian Acad. Manag. J. 2010, 15, 99–116. [Google Scholar]
- Olczyk, M.; Kordalska, A. Growth and Structural Changes in Transition Countries: The Chicken or the Egg? J. Bus. Econ. Manag. 2018, 19, 544–565. [Google Scholar] [CrossRef] [Green Version]
- Human Development Index (HDI). Human Development Reports. Available online: http://hdr.undp.org/en/content/human-development-index-hdi (accessed on 20 November 2019).
- Kyzym, M.O.; Kushnaryov, E.P. The Level and Quality of Life of the Population; INZHEK PH: Kharkiv, Ukraine, 2004; 272p, ISBN 966-8515-55-2. Available online: https://www.researchgate.net/publication/337943482_Riven_i_akist_zitta_naselenna_The_level_and_quality_of_life_of_the_population (accessed on 7 February 2020).
- Iacobuta, A.O.; Mursa, G.C.; Mihai, C.; Cautisanu, C.; Cismas, L.M. Institutions and sustainable development: A cross-country analyses. Transform. Bus. Econ. 2019, 18, 628–646. [Google Scholar]
- Jednak, S.; Kragulj, D.; Bulajic, M. A comparative analyses of development in Southeast European countries. Technol. Econ. Dev. Econ. 2018, 24, 253–270. [Google Scholar] [CrossRef] [Green Version]
- New Philosophy Encyclopedia; Mysl: Moscow, Russia, 2010.
- Modern Economic Dictionary; INFRA-M: Moscow, Russia, 1999.
- Gasanov, M.A. Influence of technological changes on structural transformations of the world and Russian economies. Ekonomika 2009, 3, 239–243. [Google Scholar]
- Trifonov, Y.V.; Veselova, N.V. Methodological approaches to the analysis of the structure of economy at the regional level. Issues Stat. 2015, 2, 37–49. [Google Scholar]
- Khaustova, V.Y.; Kramarev, H.V.; Yaroshenko, I.V. Theoretical grounds of the structural changes in the economy. Bus. Inform. 2017, 12, 24–37. Available online: https://www.business-inform.net/search/?qu=Khaustova&x=0&y=0 (accessed on 20 November 2019).
- Ozhegov, S.I.; Shvedova, N.Y. The Russian Language Definition Dictionary; Azbukovnik: Moscow, Russia, 1998; 944p. [Google Scholar]
- Pirog, O.V. Adaptation of the structure of the national economy of Ukraine to the requirements of the post-industrial society. J. Lviv Polytech. Natl. Univ. Probl. Econ. Manag. 2011, 698, 98–103. [Google Scholar]
- Akayeva, A.A.; Sokolov, V.N. About industrial and technological structural changes necessary for modernization of the Russian economy. MIR (Modernization. Innovation. Research) 2016, 7, 38–48. Available online: https://www.mir-nayka.com/jour/article/view/385 (accessed on 3 February 2020). [CrossRef] [Green Version]
- UNIDO. Industrial Development Report 2016. Available online: https://www.unido.org/sites/default/files/2015-12/EBOOK_IDR2016_FULLREPORT_0.pdf (accessed on 1 February 2020).
- Davydov, A.A. Modular Analysis and Construction of Society; Russian Academy of Sciences: Moscow, Russia, 1994. [Google Scholar]


| Stage | Basic Procedures | Materials and Methods |
|---|---|---|
| 1. Generalization of the theoretical bases for analysis and evaluation of industrial structure | 1.1. Clarifying the interpretation of the concept “industrial structure of the country” | Methods: content analysis of literary sources; general scientific methods—analysis and synthesis, generalization Analytical basis: scientific publications on the issues under study |
| 1.2. Classifying sectors of the country’s industry by the main features (by processing depth—3-sector, by technological level, by types of economic activity) which characterize its structure and are the basis for its further analysis | ||
| 1.3. Justifying the interpretation of the concept “progressive industrial structure” as the one most clearly reflecting the goals of industrial development | ||
| 1.4. Analyzing the criteria of progressiveness of the industrial structure and approaches to calculating their values | ||
| 2. Calculation of the progressive values of the industrial structure for different variants of its division into sectors and assessment of the progressive industrial structure of the world countries | 2.1. Analyzing the industrial structure of the world countries in accordance with the 3-sector division and calculating the progressive value in the case of 3-sector industrial division | Methods: grouping and classification, averaging. Statistical basis: the data of inter-branch balances for 36 countries of the world (WIOD base) |
| 2.2. Analyzing the industrial structure of the world countries in terms of technological level and calculating the progressive value when dividing the industry into sectors by technological level | ||
| 2.3. Analyzing the industrial structure of the world countries in terms of types of economic activity and calculating the progressive value when dividing the industry into sectors by TEA | ||
| 2.4. Analyzing the progressiveness of the industrial structure of the world countries by various sectoral divisions based on the progressive values obtained | Methods: grouping and analysis Statistical basis: the results of preliminary calculations (2.1–2.3) | |
| 3. Integral assessment of correspondence of the industrial structure of the world countries with its progressive state | 3.1. Developing the integral indicator of correspondence of the industrial structure with its progressive state | Methods: method for calculating the integral indicator Statistical basis: the data of inter-branch balances for 36 countries of the world (WIOD base), the results of preliminary calculations (2.1–2.3) |
| 3.2. Calculating the integral indicator of correspondence of the industrial structure with its progressive state for the studied sample of countries | ||
| 4. Justification or refutation of the hypothesis about influence of the progressiveness of the industrial structure on sustainable economic development and quality of life of the population of the world countries | 4.1. Dividing the studied world countries by the GVA per capita (as the summarizing indicator of economic development) | Methods: analysis and synthesis, grouping and classification Statistical basis: the data of inter-branch balances for 36 countries of the world (WIOD base) |
| 4.2. Dividing the studied world countries by the Human Development Index (HDI) (as the summarizing indicator of quality of life of the population) | Methods: analysis and synthesis, grouping and classification Statistical basis: the data of Human Development Reports on Human Development Index | |
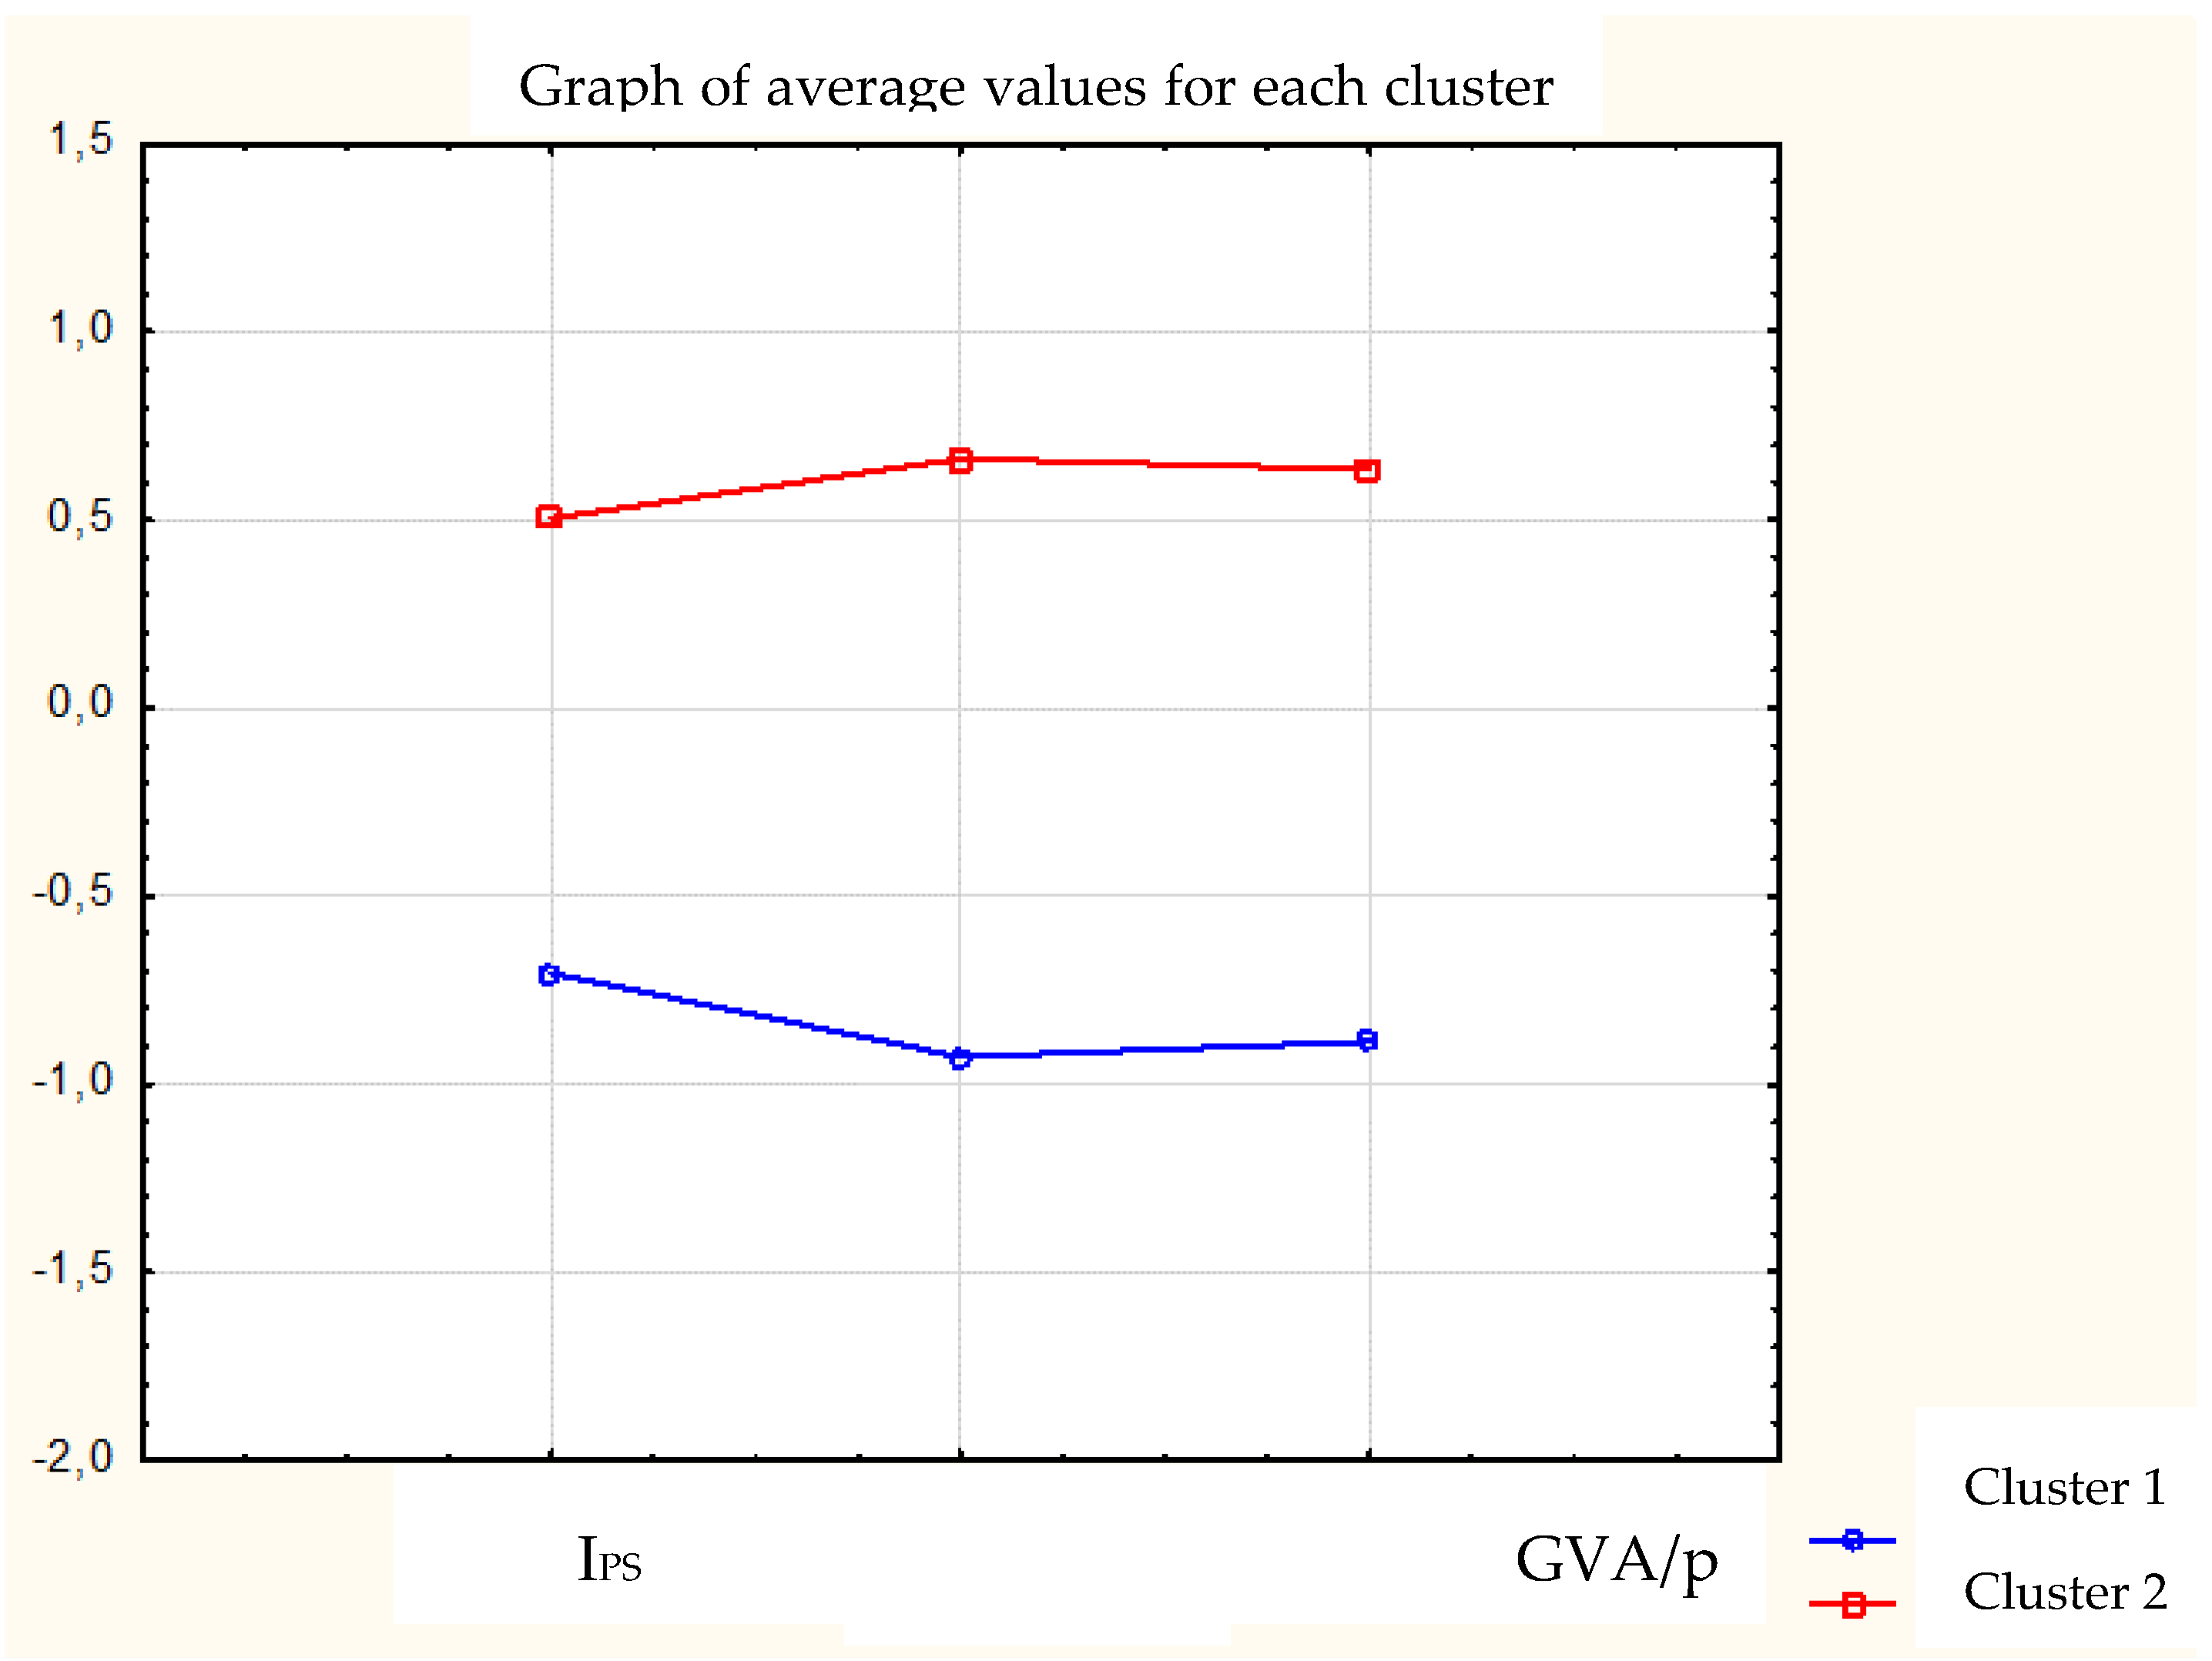
| 4.3. Analyzing the influence of correspondence of the industrial structure with its progressive state on the sustainable economic development and quality of life of the population in the world countries | Methods: cluster analysis Statistical basis: the results of preliminary calculations (3.2, 4.1 and 4.2) |
| Concept | Essence |
|---|---|
| Progressive | Advanced and gradually growing |
| Rational | Reasonably justified and expedient |
| Effective | Efficient |
| Optimal | The most favourable |
| No. | Country | High-Technology Sector (HTS) | Medium-Technology Sector (MTS) | Low-Technology Sector (LTS) | |||||||||||||||
|---|---|---|---|---|---|---|---|---|---|---|---|---|---|---|---|---|---|---|---|
| 2009 | 2011 | 2014 | 2009 | 2011 | 2014 | 2009 | 2011 | 2014 | |||||||||||
| 1* | 2** | 1 | 2 | 1 | 2 | 1 | 2 | 1 | 2 | 1 | 2 | 1 | 2 | 1 | 2 | 1 | 2 | ||
| 1 | Australia | 11.43 | 36 | 9.76 | 36 | 13.41 | 35 | 21.95 | 32 | 19.41 | 33 | 23.53 | 28 | 66.62 | 1 | 70.83 | 1 | 63.06 | 1 |
| 2 | Austria | 39.09 | 10 | 40.16 | 7 | 43.90 | 10 | 30.43 | 14 | 31.43 | 14 | 29.09 | 16 | 30.48 | 28 | 28.41 | 28 | 27.01 | 28 |
| 3 | Belgium | 36.60 | 13 | 37.52 | 13 | 44.30 | 9 | 31.88 | 12 | 35.12 | 3 | 29.09 | 17 | 31.52 | 26 | 27.35 | 31 | 26.62 | 29 |
| 4 | Bulgaria | 17.82 | 31 | 17.82 | 32 | 22.51 | 28 | 34.55 | 4 | 34.55 | 7 | 30.37 | 12 | 47.63 | 11 | 47.63 | 11 | 47.13 | 10 |
| 5 | Brazil | 27.87 | 21 | 26.42 | 23 | 30.42 | 21 | 32.83 | 9 | 3112 | 15 | 16.66 | 34 | 39.30 | 20 | 42.46 | 18 | 52.93 | 5 |
| 6 | United Kingdom | 31.26 | 17 | 31.63 | 17 | 35.41 | 18 | 24.76 | 26 | 25.72 | 26 | 27.42 | 20 | 43.98 | 15 | 42.65 | 17 | 37.17 | 20 |
| 7 | Greece | 12.74 | 35 | 12.74 | 35 | 12.70 | 36 | 36.54 | 2 | 36.54 | 2 | 45.90 | 1 | 50.71 | 7 | 50.71 | 7 | 41.40 | 18 |
| 8 | Denmark | 38.13 | 11 | 33.53 | 16 | 46.35 | 7 | 18.40 | 34 | 18.42 | 34 | 18.38 | 33 | 43.47 | 17 | 48.05 | 10 | 35.27 | 22 |
| 9 | Estonia | 21.46 | 28 | 21.46 | 30 | 22.38 | 29 | 32.53 | 11 | 32.53 | 12 | 34.02 | 3 | 46.01 | 13 | 46.01 | 14 | 43.60 | 13 |
| 10 | India | 29.85 | 20 | 29.84 | 21 | 30.09 | 22 | 29.00 | 20 | 29.28 | 19 | 27.05 | 21 | 41.15 | 18 | 40.88 | 20 | 42.86 | 16 |
| 11 | Ireland | 57.47 | 1 | 56.69 | 2 | 42.27 | 12 | 9.68 | 36 | 8.77 | 36 | 13.11 | 36 | 32.84 | 24 | 34.54 | 22 | 44.62 | 12 |
| 12 | Spain | 30.01 | 19 | 29.99 | 20 | 33.30 | 20 | 33.58 | 7 | 34.57 | 6 | 32.58 | 6 | 36.42 | 21 | 35.44 | 21 | 34.12 | 23 |
| 13 | Italy | 34.90 | 16 | 35.34 | 15 | 38.43 | 15 | 29.18 | 19 | 31.03 | 16 | 29.71 | 13 | 35.92 | 22 | 33.63 | 25 | 31.85 | 25 |
| 14 | Canada | 19.56 | 30 | 27.02 | 22 | 20.20 | 31 | 20.52 | 33 | 21.75 | 30 | 24.70 | 24 | 59.91 | 3 | 51.23 | 6 | 55.10 | 3 |
| 15 | China | 35.37 | 15 | 35.37 | 14 | 37.08 | 17 | 23.52 | 29 | 23.52 | 28 | 19.76 | 32 | 41.11 | 19 | 41.11 | 19 | 43.16 | 14 |
| 16 | Korea | 57.14 | 2 | 58.18 | 1 | 60.71 | 1 | 24.43 | 28 | 25.81 | 25 | 24.27 | 25 | 18.43 | 36 | 16.01 | 36 | 15.02 | 36 |
| 17 | Latvia | 14.71 | 33 | 14.71 | 33 | 16.84 | 32 | 34.92 | 3 | 34.92 | 4 | 32.76 | 5 | 50.37 | 9 | 50.37 | 9 | 50.40 | 8 |
| 18 | Lithuania | 21.63 | 26 | 21.63 | 28 | 24.82 | 26 | 32.66 | 10 | 32.66 | 11 | 26.50 | 23 | 45.71 | 14 | 45.71 | 15 | 48.68 | 9 |
| 19 | Mexico | 21.60 | 27 | 21.67 | 27 | 28.10 | 24 | 15.28 | 35 | 14.85 | 35 | 16.38 | 35 | 63.12 | 2 | 63.47 | 2 | 55.52 | 2 |
| 20 | Nether-lands | 25.60 | 24 | 31.05 | 18 | 34.89 | 19 | 24.67 | 27 | 21.75 | 31 | 22.11 | 30 | 49.73 | 10 | 47.20 | 13 | 43.00 | 15 |
| 21 | Germany | 53.47 | 3 | 55.83 | 3 | 58.77 | 2 | 27.66 | 22 | 27.33 | 21 | 24.05 | 26 | 18.88 | 35 | 16.84 | 35 | 17.18 | 35 |
| 22 | Poland | 26.33 | 22 | 21.84 | 26 | 29.01 | 23 | 29.75 | 17 | 34.58 | 5 | 32.77 | 4 | 43.92 | 16 | 43.58 | 16 | 38.22 | 19 |
| 23 | Portugal | 22.83 | 25 | 22.83 | 25 | 21.93 | 30 | 29.78 | 16 | 29.78 | 18 | 31.03 | 11 | 47.40 | 12 | 47.40 | 12 | 47.04 | 11 |
| 24 | Russia | 14.70 | 34 | 14.68 | 34 | 15.22 | 34 | 33.46 | 8 | 32.79 | 10 | 32.03 | 7 | 51.83 | 6 | 52.53 | 5 | 52.75 | 6 |
| 25 | Romania | 26.27 | 23 | 26.27 | 24 | 25.91 | 25 | 23.14 | 30 | 23.14 | 29 | 31.59 | 8 | 50.59 | 8 | 50.59 | 8 | 42.50 | 17 |
| 26 | Slovakia | 30.27 | 18 | 30.27 | 19 | 41.87 | 13 | 41.06 | 1 | 41.06 | 1 | 34.46 | 2 | 28.67 | 30 | 28.67 | 27 | 23.67 | 31 |
| 27 | Slovenia | 41.24 | 6 | 41.24 | 6 | 46.51 | 6 | 30.85 | 13 | 30.85 | 17 | 31.50 | 10 | 27.92 | 31 | 27.92 | 30 | 21.98 | 32 |
| 28 | USA | 37.82 | 12 | 38.66 | 11 | 39.39 | 14 | 27.18 | 24 | 26.89 | 23 | 23.48 | 29 | 34.99 | 23 | 34.46 | 23 | 37.12 | 21 |
| 29 | Turkey | 20.95 | 29 | 21.46 | 29 | 23.75 | 27 | 22.72 | 31 | 21.46 | 32 | 21.26 | 31 | 56.33 | 4 | 57.08 | 3 | 54.99 | 4 |
| 30 | Hungary | 48.54 | 4 | 54.90 | 4 | 56.05 | 3 | 28.49 | 21 | 26.94 | 22 | 23.94 | 27 | 22.97 | 34 | 18.16 | 34 | 20.01 | 34 |
| 31 | Ukraine | 17.14 | 32 | 21.07 | 31 | 16.40 | 33 | 27.53 | 23 | 24.28 | 27 | 31.56 | 9 | 55.34 | 5 | 54.64 | 4 | 52.05 | 7 |
| 32 | Finland | 40.73 | 7 | 39.50 | 10 | 42.60 | 11 | 26.75 | 25 | 26.60 | 24 | 27.59 | 19 | 32.52 | 25 | 33.90 | 24 | 29.80 | 26 |
| 33 | France | 39.28 | 9 | 37.72 | 12 | 37.53 | 16 | 29.69 | 18 | 33.51 | 8 | 29.32 | 14 | 31.03 | 27 | 28.78 | 26 | 33.15 | 24 |
| 34 | Czech Republic | 35.75 | 14 | 40.13 | 8 | 48.93 | 4 | 33.93 | 5 | 31.78 | 13 | 29.21 | 15 | 30.32 | 29 | 28.09 | 29 | 21.86 | 33 |
| 35 | Sweden | 42.50 | 5 | 44.06 | 5 | 48.63 | 5 | 30.23 | 15 | 29.10 | 20 | 27.62 | 18 | 27.27 | 32 | 26.84 | 33 | 23.75 | 30 |
| 36 | Japan | 39.48 | 8 | 39.55 | 9 | 45.61 | 8 | 33.61 | 6 | 33.50 | 9 | 27.05 | 22 | 26.91 | 33 | 26.95 | 32 | 27.34 | 27 |
| Average value | 31.55 | 32.04 | 34.85 | 28.28 | 28.37 | 27.15 | 40.17 | 39.58 | 38.00 | ||||||||||
| 32.82 | 27.93 | 39.25 | |||||||||||||||||
| 1st Cluster | 2nd Cluster |
|---|---|
| Bulgaria; Brazil; Estonia; India; China; Latvia; Lithuania; Mexico; Poland; Portugal; Russia; Romania; Turkey; Ukraine; Greece | Australia; Austria; Belgium; United Kingdom; Denmark; Ireland; Spain; Italy; Canada; Korea; Netherlands; Germany; Slovakia; Slovenia; USA; Hungary; Finland; France; Czech Republic; Sweden; Japan |
| No. | Country | HDI | GVA/p | IPS | SWM | SWHTS | SWE | ||||||
|---|---|---|---|---|---|---|---|---|---|---|---|---|---|
| 1* | 2** | 1 | 2 | 1 | 2 | 1 | 2 | 1 | 2 | 1 | 2 | ||
| 1 | Bulgaria | 0.782 | 30 | 7,864.8 | 33 | 0.7541 | 28 | 65.47 | 31 | 22.51 | 28 | 13.09 | 28 |
| 2 | Brazil | 0.755 | 33 | 12,026.6 | 30 | 0.8095 | 24 | 65.56 | 30 | 30.42 | 21 | 18.81 | 21 |
| 3 | Estonia | 0.861 | 21 | 20,247.2 | 21 | 0.8482 | 23 | 71.06 | 28 | 22.38 | 29 | 16.75 | 25 |
| 4 | India | 0.609 | 36 | 1,576.0 | 36 | 0.8869 | 22 | 78.20 | 18 | 30.09 | 22 | 17.30 | 23 |
| 5 | China | 0.727 | 35 | 7,683.5 | 34 | 1.0358 | 15 | 78.82 | 17 | 37.08 | 17 | 26.45 | 11 |
| 6 | Latvia | 0.819 | 27 | 15,716.4 | 25 | 0.6706 | 32 | 71.86 | 25 | 16.84 | 32 | 9.51 | 34 |
| 7 | Lithuania | 0.839 | 24 | 16,545.1 | 24 | 0.7250 | 30 | 81.39 | 13 | 24.82 | 26 | 9.71 | 33 |
| 8 | Mexico | 0.756 | 32 | 10,582.4 | 31 | 0.7980 | 25 | 65.05 | 32 | 28.10 | 24 | 19.56 | 19 |
| 9 | Poland | 0.843 | 23 | 14,345.2 | 26 | 0.9193 | 19 | 73.82 | 23 | 29.01 | 23 | 17.63 | 22 |
| 10 | Portugal | 0.830 | 25 | 22,077.5 | 19 | 0.7675 | 27 | 76.67 | 21 | 21.93 | 30 | 12.54 | 29 |
| 11 | Russia | 0.798 | 28 | 14,125.9 | 28 | 0.6246 | 35 | 51.59 | 34 | 15.22 | 34 | 9.81 | 32 |
| 12 | Romania | 0.793 | 29 | 10,027.0 | 32 | 0.9181 | 20 | 77.72 | 19 | 25.91 | 25 | 19.58 | 18 |
| 13 | Turkey | 0.761 | 31 | 12,127.5 | 29 | 0.7441 | 29 | 80.43 | 15 | 23.75 | 27 | 14.21 | 26 |
| 14 | Ukraine | 0.747 | 34 | 3,104.7 | 35 | 0.6705 | 34 | 58.01 | 33 | 16.40 | 33 | 11.54 | 30 |
| 15 | Greece | 0.865 | 20 | 21,761.0 | 20 | 0.6916 | 31 | 71.67 | 26 | 12.70 | 36 | 6.18 | 36 |
| Total | 0,848 | 30,541.6 | 1.0 | 75.76 | 34.85 | 22.16 | |||||||
| No. | Country | HDI | GVA/p | IPS | SWM | SWHTS | SWE | ||||||
|---|---|---|---|---|---|---|---|---|---|---|---|---|---|
| 1* | 2** | 1 | 2 | 1 | 2 | 1 | 2 | 1 | 2 | 1 | 2 | ||
| 1 | Australia | 0.935 | 1 | 62,403.1 | 2 | 0.4987 | 36 | 41.97 | 36 | 13.41 | 35 | 7.81 | 35 |
| 2 | Austria | 0.885 | 14 | 51,717.5 | 7 | 1.2999 | 8 | 84.26 | 6 | 43.90 | 10 | 33.11 | 7 |
| 3 | Belgium | 0.890 | 12 | 47,355.3 | 11 | 1.0526 | 12 | 83.06 | 8 | 44.30 | 9 | 16.86 | 24 |
| 4 | United Kingdom | 0.907 | 8-9 | 46,967.6 | 12 | 0.9934 | 18 | 71.43 | 27 | 35.41 | 18 | 21.63 | 15 |
| 5 | Denmark | 0.923 | 2 | 62,549.0 | 1 | 1.0309 | 16 | 73.37 | 24 | 46.35 | 7 | 21.80 | 14 |
| 6 | Ireland | 0.916 | 4–5 | 55,628.2 | 4 | 0.7978 | 26 | 88.06 | 3 | 42.27 | 12 | 10.05 | 31 |
| 7 | Spain | 0.876 | 17 | 29,623.2 | 16 | 0.9984 | 17 | 76.84 | 20 | 33.30 | 20 | 19.74 | 17 |
| 8 | Italy | 0.873 | 18 | 35,396.7 | 15 | 1.1442 | 11 | 82.00 | 11 | 38.43 | 15 | 26.80 | 10 |
| 9 | Canada | 0.913 | 7 | 50,633.2 | 8 | 0.6760 | 33 | 49.64 | 35 | 20.20 | 31 | 13.82 | 27 |
| 10 | Korea | 0.898 | 10 | 27,811.4 | 17 | 1.7115 | 1 | 91.09 | 1 | 60.71 | 1 | 47.40 | 1 |
| 11 | Netherlands | 0.922 | 3 | 52,830.2 | 6 | 0.9082 | 21 | 70.50 | 29 | 34.89 | 19 | 19.32 | 20 |
| 12 | Germany | 0.916 | 4-5 | 48,142.8 | 10 | 1.6249 | 2 | 87.53 | 4 | 58.77 | 2 | 44.48 | 2 |
| 13 | Slovakia | 0.844 | 22 | 18,629.8 | 23 | 1.3070 | 7 | 82.04 | 10 | 41.87 | 13 | 31.68 | 8 |
| 14 | Slovenia | 0.880 | 16 | 24,202.4 | 18 | 1.2255 | 10 | 83.43 | 7 | 46.51 | 6 | 24.46 | 13 |
| 15 | USA | 0.915 | 6 | 55,033.0 | 5 | 1.0526 | 13 | 73.91 | 22 | 39.39 | 14 | 24.79 | 12 |
| 16 | Hungary | 0.818 | 26 | 14,197.8 | 27 | 1.5153 | 3 | 87.29 | 5 | 56.05 | 3 | 40.35 | 3 |
| 17 | Finland | 0.883 | 15 | 49,914.6 | 9 | 1.2347 | 9 | 82.19 | 9 | 42.60 | 11 | 31.05 | 9 |
| 18 | France | 0.888 | 13 | 43,008.7 | 13 | 1.0436 | 14 | 79.95 | 16 | 37.53 | 16 | 21.35 | 16 |
| 19 | Czech Republic | 0.870 | 19 | 19,744.6 | 22 | 1.4332 | 4 | 81.21 | 14 | 48.93 | 4 | 37.97 | 4 |
| 20 | Japan | 0.891 | 11 | 38,109.4 | 14 | 1.3361 | 6 | 90.55 | 2 | 45.61 | 8 | 24.73 | 6 |
| Total | 0.893 | 42,530.5 | 1.1551 | 78.20 | 41.86 | 26.41 | |||||||
© 2020 by the authors. Licensee MDPI, Basel, Switzerland. This article is an open access article distributed under the terms and conditions of the Creative Commons Attribution (CC BY) license (http://creativecommons.org/licenses/by/4.0/).
Share and Cite
Gryshova, I.; Kyzym, M.; Khaustova, V.; Korneev, V.; Kramarev, H. Assessment of the Industrial Structure and its Influence on Sustainable Economic Development and Quality of Life of the Population of Different World Countries. Sustainability 2020, 12, 2072. https://doi.org/10.3390/su12052072
Gryshova I, Kyzym M, Khaustova V, Korneev V, Kramarev H. Assessment of the Industrial Structure and its Influence on Sustainable Economic Development and Quality of Life of the Population of Different World Countries. Sustainability. 2020; 12(5):2072. https://doi.org/10.3390/su12052072
Chicago/Turabian StyleGryshova, Inna, Mykola Kyzym, Viktoriia Khaustova, Volodymyr Korneev, and Hennadii Kramarev. 2020. "Assessment of the Industrial Structure and its Influence on Sustainable Economic Development and Quality of Life of the Population of Different World Countries" Sustainability 12, no. 5: 2072. https://doi.org/10.3390/su12052072