Article

Effects of Droughts on Vegetation Condition and Ecosystem Service Delivery in Data-Poor Areas: A Case of Bobirwa Sub-District, Limpopo Basin and Botswana

1
Biological Science Department, Faculty of Science, University of Botswana, Private Bag UB0022, Gaborone, Botswana
2
History Department, Faculty of Humanities, University of Botswana, Private Bag UB0022, Gaborone, Botswana
*
Author to whom correspondence should be addressed.
Sustainability 2020, 12(19), 8185; https://doi.org/10.3390/su12198185
Submission received: 30 July 2020 / Revised: 26 September 2020 / Accepted: 29 September 2020 / Published: 4 October 2020

Abstract

:
Understanding the effects of droughts on vegetation and ecosystem services (ES) is important for climate change adaptation. However, drought occurrence varies across space and time. We examined drought dynamics and impacts on vegetation and ES in the semi-arid Limpopo Basin of Botswana. Weather station precipitation, remotely sensed normalized difference vegetation index (NDVI) and participatory mapping exercises provided data for the analyses. Results show that between 1980 and 2015, rainfall anomaly indices of potential drought years ranged between −4.38 and −0.12. The longest spell of below-average rainfall occurred between 1992 and 1996. On average, drought events lasted for 1.9 years and recurred every 2.3 years. Although the overall drought frequency was 3.7 times in every 5 years, drought prevalence increased to 50%, 60% and 70% between 1981–1990, 1991–2000, and 2001–2010, respectively. The wet season average vegetation condition index between 2000 and 2015 revealed the occurrence of severe-to-extreme droughts in 2002–2003, 2005, 2008–2009 and 2012–2013 and light-to-moderate droughts in 2004, 2006–2007 and 2011, giving a drought prevalence of 73.3%. The increased frequency and severity of droughts is diminishing natural vegetation, crop productivity and several provisioning ES through moisture stress and drought-induced agricultural expansions. There exists an urgent need for smallholder irrigation development in Bobirwa sub-district to improve crop productivity and reduce the drought-induced conversion of woodlands to agriculture.

1. Introduction

Drought is an environmental challenge that often causes significant losses of livelihoods the world over. For instance, rain-fed agriculture, livestock production, biodiversity, and several ecosystem services (ES) that are fundamental to human well-being are increasingly threatened [1,2]. In the past 50 years, droughts alone have affected about 1.4 billion people globally [3]. In recent years, drought impacts have been particularly potent in semi-arid regions where many people uniquely depend on the natural environment [4].
Droughts occur naturally when total annual precipitation is significantly below 650 mm, causing adverse consequences on natural vegetation and crop productivity [5]. Four types of droughts are identified in the literature as meteorological, agricultural, hydrological, and socio-economic. Meteorological droughts occur when precipitation at any given location falls below the long-term average, spanning a period from a few months to several years. Agricultural droughts occur when soil moisture falls below crop requirements at any given time during or after a meteorological drought. Hydrological droughts are experienced when groundwater and surface water resources become insufficient as indicated by streamflow, surface, and groundwater levels. Socio-economic drought is experienced when a combination of the other three droughts interferes with the social, economic, and ecological systems causing undesirable consequences on human health, well-being and quality of life of indigenous communities. These definitions are well-articulated and illustrated by the National Drought Mitigation Centre at the University of Nebraska (https://drought.unl.edu/Education/DroughtIn-depth/TypesofDrought.aspx).
Although droughts are more prevalent over the semi-arid landscapes due to their adverse climate conditions, they can naturally occur in any climate. Therefore, droughts differ in terms of their severity, duration and frequency [3]. Over Botswana, the longest drought occurred between 1981 and 1987 lasting for seven years although widespread and devastating impacts were mostly experienced by the poor [6,7]. As the severity and recurrence of droughts are increasing globally, semi-arid areas are among the worst affected [3]. Nonetheless, the severity and duration of droughts over any area vary from one drought event to the other. For instance, some droughts occur for short periods but with severe impacts while others are mild but develop over an extended period.
Droughts drive changes in vegetation cover and consequently the delivery of those ES which depend on healthy vegetation. However, the extent to which droughts drive these changes depends on their severity, duration and recurrence. Previous studies by [8,9,10,11,12,13] revealed various aspects of vegetation changes ranging from the condition and stature, to composition, in semi-arid landscapes. Considering the precipitation regimes in semi-arid and arid landscapes, droughts are among the chief drivers of vegetation degradation in these areas [10]. The consequences of vegetation change in semi-arid landscapes are varied [14,15,16]. Ref. [8] found that recurrent droughts were among the leading causes of loss of grasslands and grazing pastures by up to 86%. In Kenya, droughts were identified as being behind the decline in cultivated crop yields and conversion of woodlands to bush dominated landscapes [3,17]. With a huge dependence on the natural environment, especially among poor people in developing countries, the effects of droughts could be huge. According to [18], between 1994 and 2013, droughts accounted for 20% of the natural disasters affecting at least one billion people globally. Most of these people resided in developing countries.
A study by [19] suggests that the severity and recurrence of droughts in Botswana have been rising in the past two decades. Although lengthy drought periods have been recorded nationally in the early 1980s and 1990s, these were punctuated by non-drought years [20]. Since 2007, drought occurrence has been declared annually in different parts of the country showing increased frequency of droughts in recent years since the turn of the millennium [20]. Considering the huge costs associated with droughts [7], several methods for assessing droughts based on weather station precipitation data have emerged over the years. For instance, the Palmer drought severity index (PDSI), the standardized precipitation index and the moisture anomaly index (Z-index) all use weather station data. However, these techniques lack the spatial coverage and hence are only effective in assessing drought conditions in the vicinity of weather stations given the high variability of precipitation over short distances, particularly in semi-arid areas [21].
Although traditional methods to assess and monitor droughts rely on weather station precipitation, such data are often incomplete, unavailable or available for very short periods in many developing countries. Besides, the dynamism of precipitation over semi-arid regions, coupled with poorly distributed weather stations across Botswana and many other developing countries, limit more localized drought assessments and monitoring as noted by [22]. Without automated weather stations, such data are often not readily available and open to human error. Nonetheless, consistent remotely-sensed vegetation products offer an opportunity to monitor various aspects of droughts such as the onset, duration, severity, frequency and spatial distribution [23]. Moreover, in areas where weather stations are absent or sparsely distributed, remotely sensed data may be the only viable alternative data source. The vegetation condition index (VCI) based on the remotely-sensed products such as the normalized difference vegetation index (NDVI) and enhanced vegetation index (EVI) have been used extensively to monitor drought onset, severity, duration, extent and impact the world over [22,24,25].
We nonetheless use weather station data and VCI data derived from remotely sensed NDVI data to assess the consequences of meteorological droughts on natural vegetation and ES delivery in the Bobirwa sub-district in the Limpopo Basin part of Botswana. As a remotely-sensed product, VCI does not require meteorological data, hence it can be computed easily and in near-real-time [24]. The objectives of this study in the Bobirwa sub-district in the Limpopo Basin part of Botswana were to (i) establish the occurrence, duration, recurrence, prevalence and severity of drought events; (ii) examine the spatial and seasonal variability of drought events using the vegetation condition index; (iii) establish the implications of recent drought dynamics on ES delivery including the associated consequences on the local people.

2. Materials and Methods
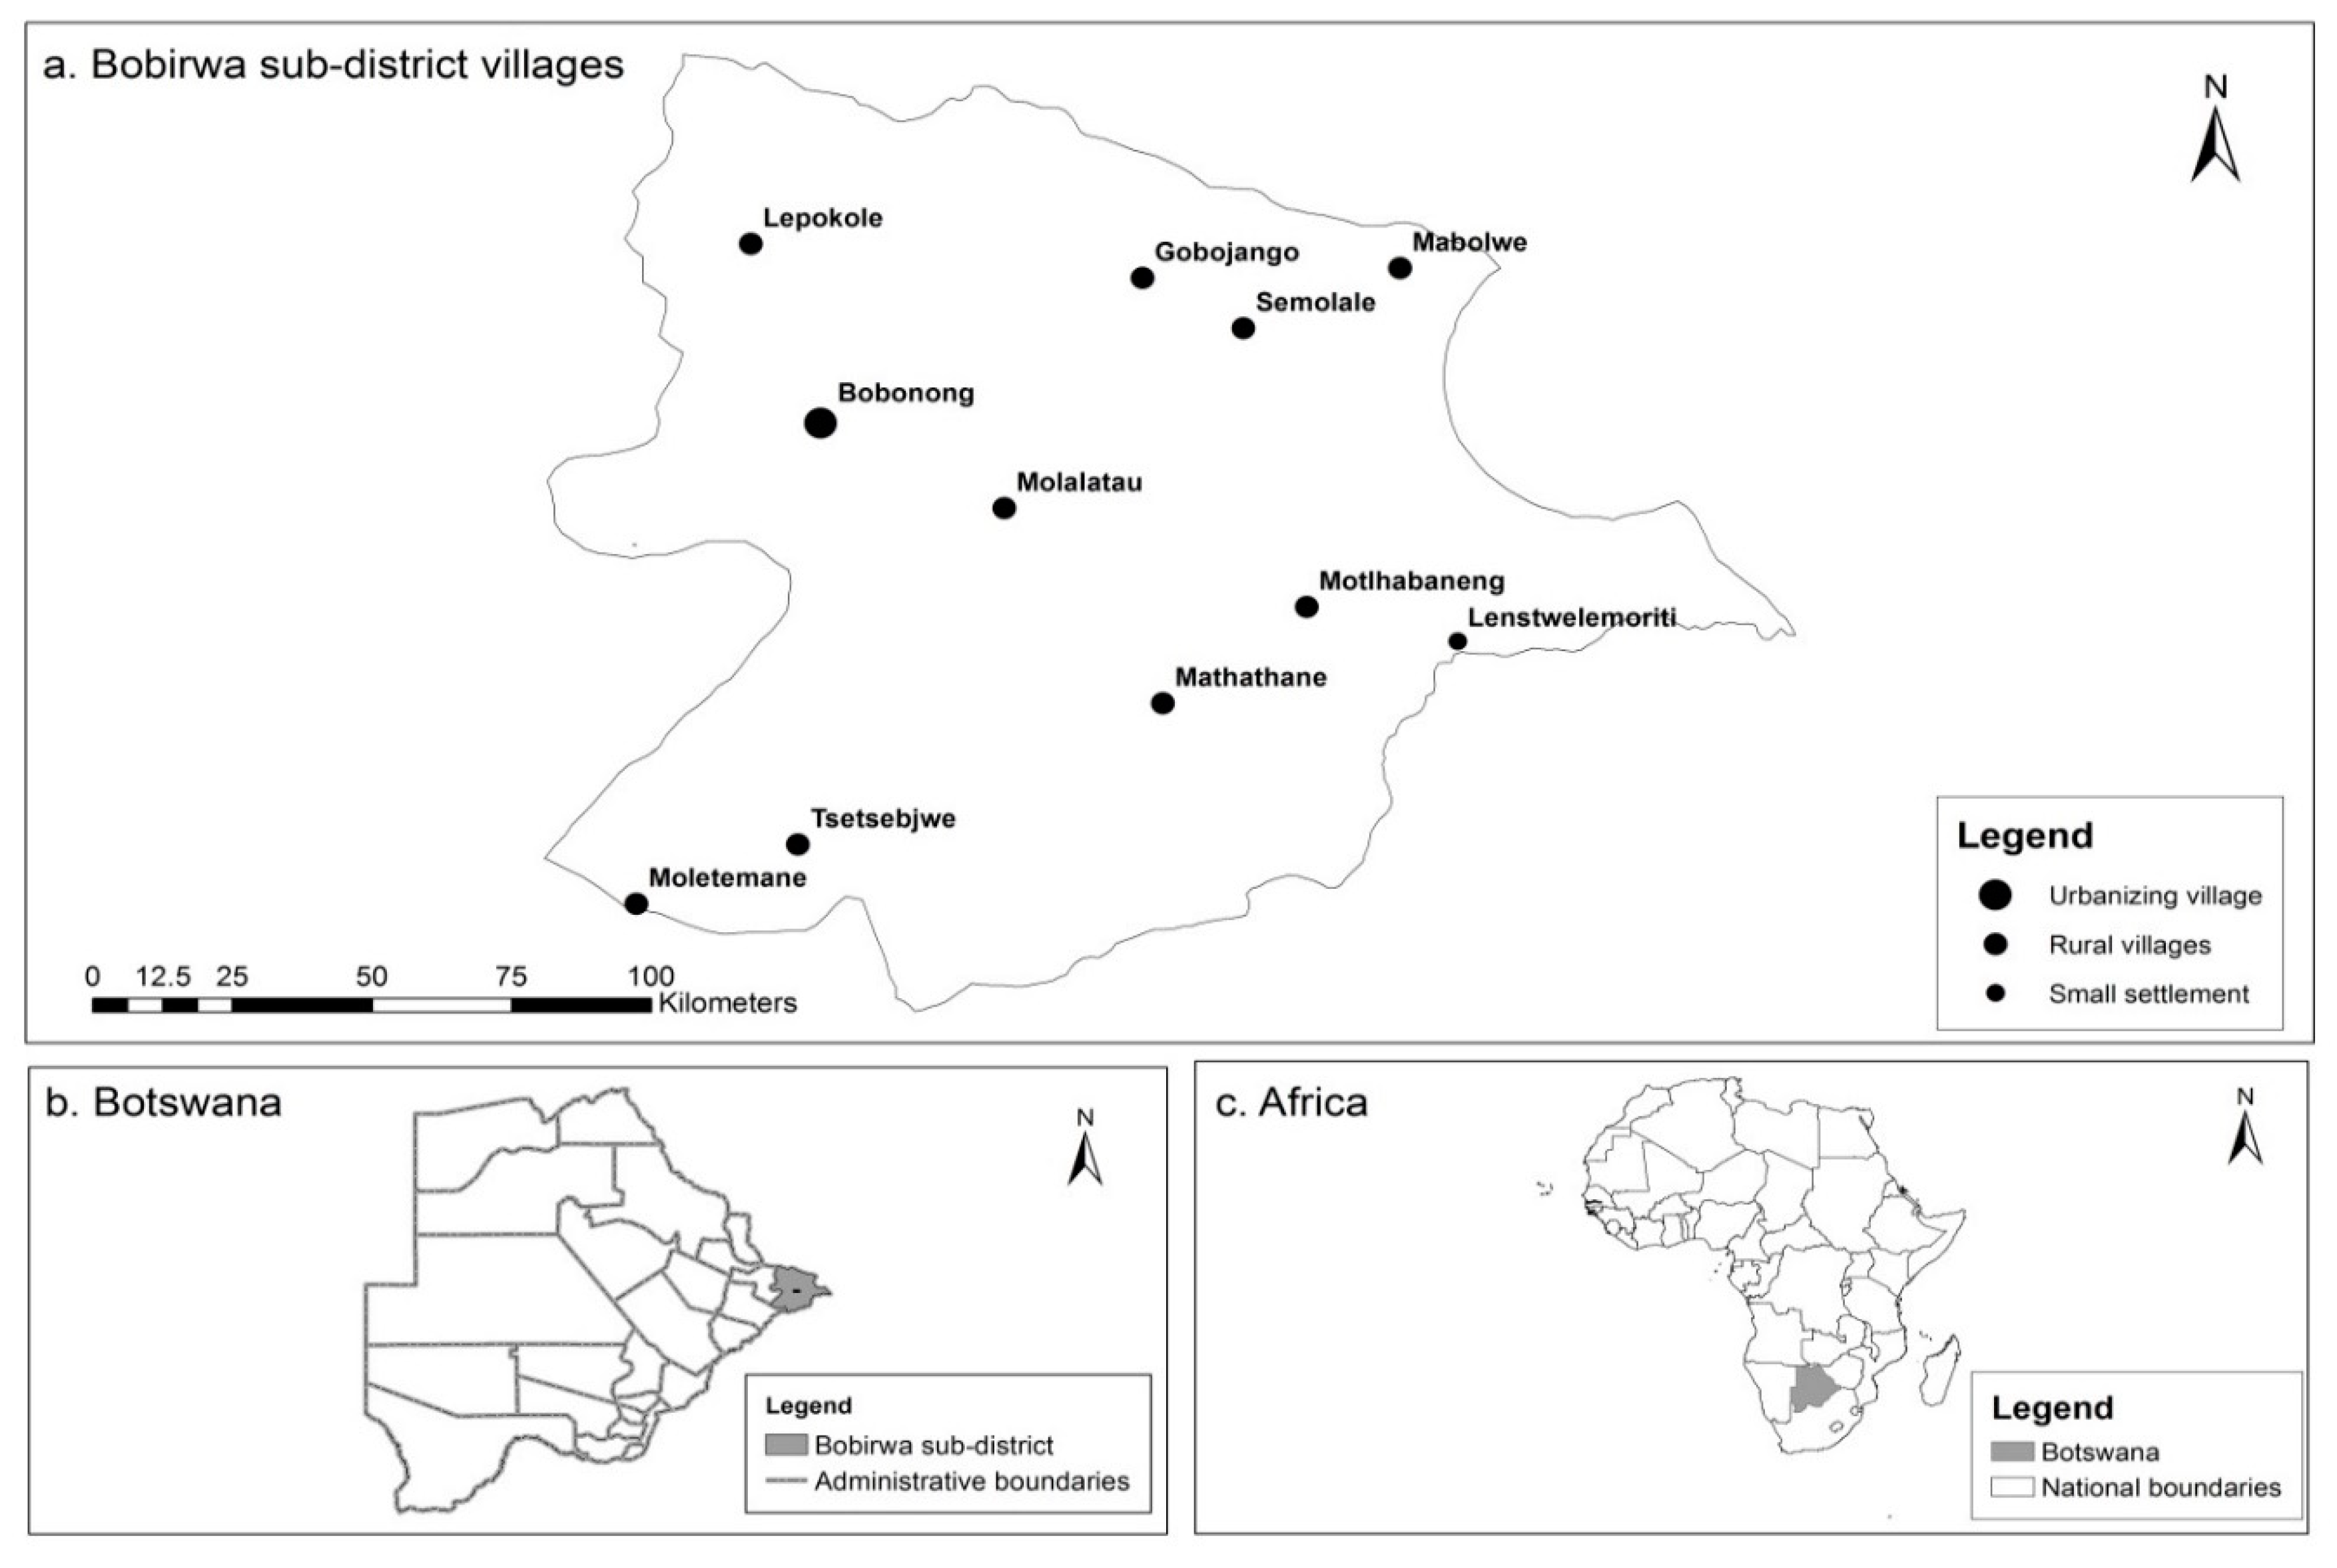
2.1. Study Area

The Limpopo River Basin part of Botswana is ecologically and economically significant to indigenous people and surrounding communities. Our case study, Bobirwa sub-district, is situated between 28°09′10″ E to 29°21′42″ E and 22°35′17″ S to 21°35′56″ S and lies entirely within the Limpopo River Basin part of Botswana. The sub-district has an altitude ranging between 590 and 886 m making it the lowest part of Botswana; consequently, it has a network of channels that drain into the Limpopo River [26]. The sub-district boundary forms the national boundary with Zimbabwe to the north-east and South Africa to the south-east where the Limpopo River marks the boundary. Figure 1 below shows the location map of Bobirwa sub-district in Botswana, the villages and settlements in the Bobirwa sub-district as well as the location of Botswana in Africa. Although local ecosystems in the Limpopo Basin are essential to livelihoods and human well-being, they are greatly threatened by adverse climatic conditions as well as anthropogenic pressure. According to the 2011 National Population and Housing Census report, the population of Bobirwa sub-district was 71,936 comprising 34,247 males and 37,689 females from 19,213 households with an average household size of 3.74 and a population density of 5.05 people/km2 [27].
The study area is highly susceptible to droughts, erratic rainfall fluctuating well below 400 mm/year in most years and very warm average summer temperatures above 25 °C [28]. High variability in both rainfall amount and intensity and recurrence of extended droughts and dry spells is characteristic of the study area. A drought is defined as a fluctuation below the average or normal conditions, sufficiently extended (1–2 years) to interfere with the hydrological balance and adversely affecting ecosystem functioning and the local communities [29]. Nonetheless, Bobirwa sub-district experiences a less severe climate than other parts of the country which allows crop and livestock production as well as supporting considerable biodiversity which support local livelihoods through the delivery of several timber and non-timber forest products [26,30].

2.2. Data Analyses

Precipitation data for the study area were obtained from the Meteorological Services Department of Botswana. The precipitation data were based on daily readings for the period 1980–2015 at the main Police Station weather station in Bobonong village (Figure 1) with coordinates 21°58′12″ S and 28°25′12″ E and altitude of 675 m. Bi-monthly normalized difference vegetation index (NDVI) data for the period 2000–2015 were obtained from MODIS DAAC using sub-setting tool 6 (MOD13Q1 data product). MODIS provides near-real-time data with MOD13Q1 product having a spatial resolution of 250 m. Precipitation data were used to identify drought years, compute drought recurrence, duration and severity while the remotely-sensed NDVI data were used to compute the vegetation condition index (VCI) following similar procedures by [5] as well as to establish the correlation between VCI and precipitation. Besides monitoring vegetation dynamics (cover, change, condition, etc.), VCI also indicates spatial drought occurrence. All the analyses were conducted in R.
According to [5], VCI was computed as follows:
V C I xyz = 100 [ NDV I xyz NDV I xy min NDV I xy max NDV I xy min ]
where V C I xyz is the vegetation condition index for pixel x during time-period y for year z, NDV I xyz is the periodic NDVI for pixel x in time-period y for year z, while NDV I xy min . and NDV I xy max . are the respective monitoring period minimum and maximum NDVI for pixel x during time-period y. In this study, the monitoring period for VCI was 2000–2015 considering that MODIS data products are only available from 2000. The months were categorized into four seasons i.e., December to January (DJF), March to May (MAM), June to August (JJA) and September to November (SON) to account for changes in vegetation phenology. Equation (1) implies that the resulting VCI value for any particular pixel of any given season (i.e., DJF, MAM, JJA and SON), can only lie between the minimum and the maximum NDVI values of the entire monitoring period, signifying bad and good vegetation growth, respectively.
For the weather station precipitation data, the annual raiall anomaly index (RAI) was computed based on the Rooy Van Equation (1965) to analyze the frequency and intensity of the dry (wet) years. RAI was initially developed by Rooy in 1965 and adapted by Freitas in 2005 [31], and is computed by the following equations:
R A I i = 3 [ N i N ¯ M ¯ N ¯ ]   for   positive   anomalies ,
R A I i = 3 [ N i N ¯ X ¯ N ¯ ]   for   negative   anomalies ,
where R A I i . the rainfall anomaly index in year (month or season) i, N i is the annual (monthly or seasonal) rainfall in year (month or season) i, N ¯ is the annual (monthly or seasonal) rainfall of the historical time series being assessed (mm), M ¯ and X ¯ are the respective averages of the 10 highest and lowest annual (monthly or seasonal) precipitations for the historical time series (mm). Negative (positive) anomalies have their values below (above) average.

3. Results

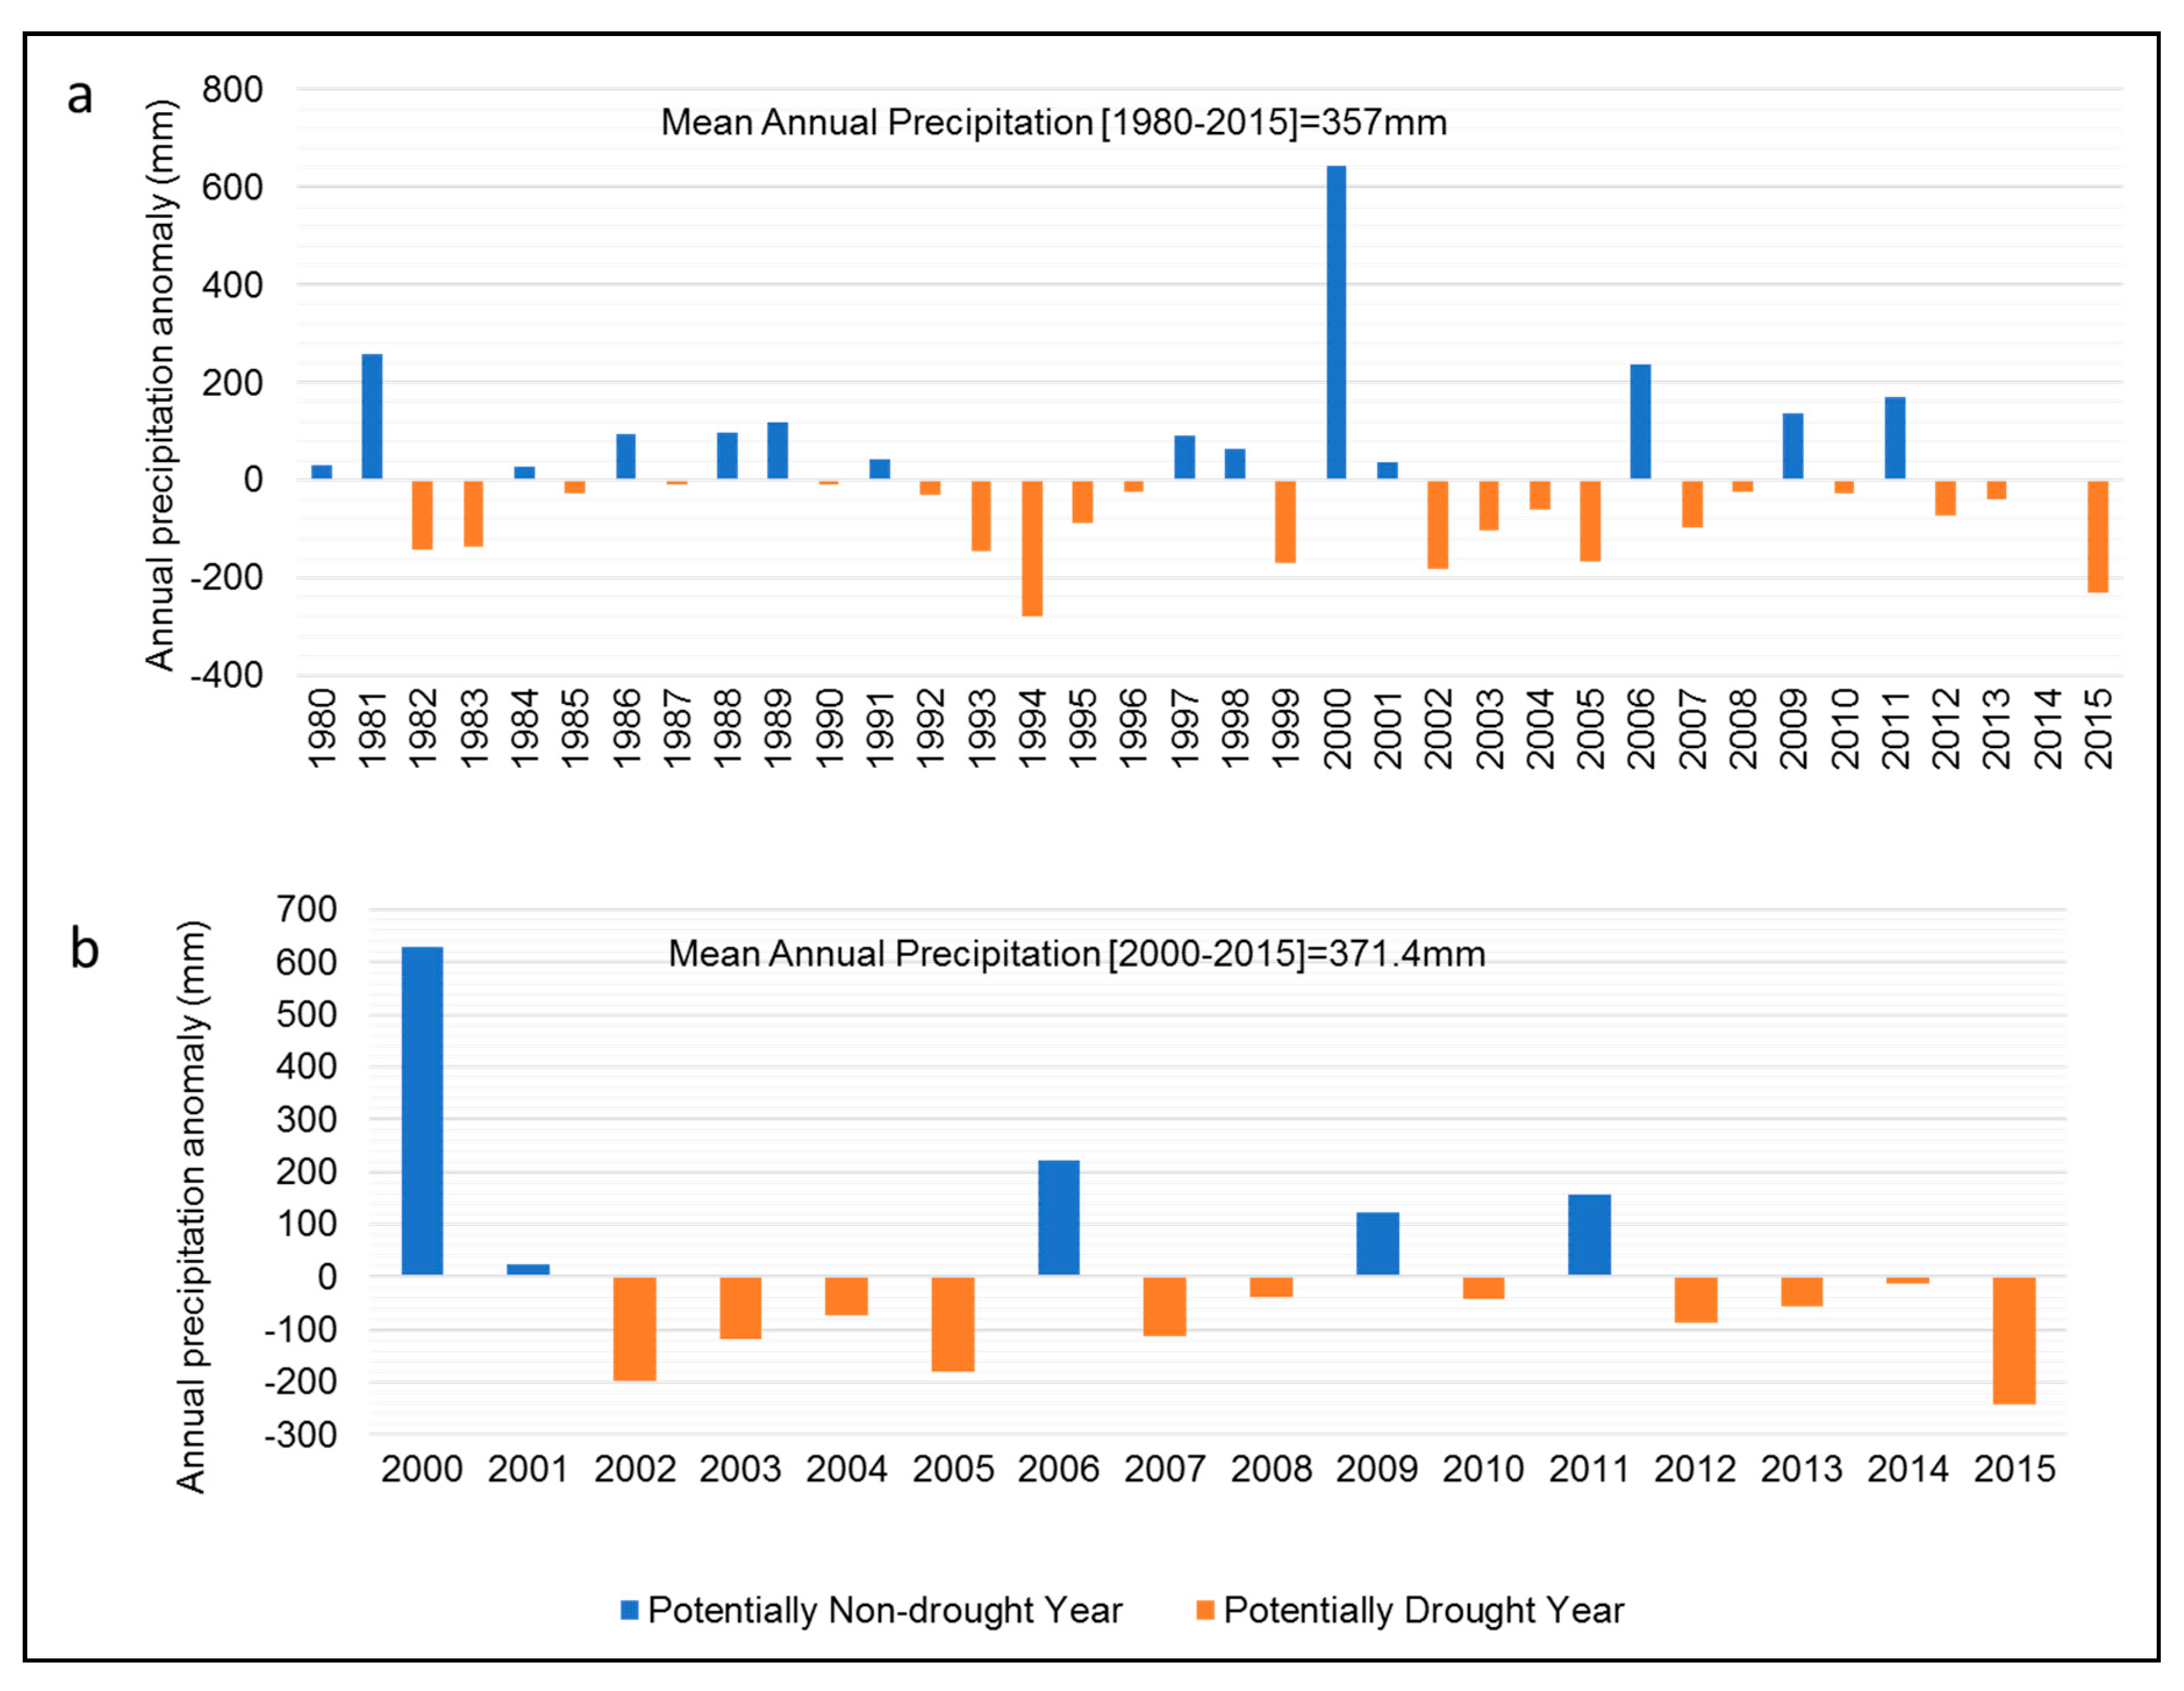
3.1. Characteristics of Local Droughts

Spatial and temporal drought occurrence and dynamics were examined through analysis of drought recurrence (frequency), duration, and severity as well as the seasonal vegetation condition index.

3.1.1. Drought Occurrence and Frequency

For the 36 years between 1980 and 2015, Figure 2 below shows the potential drought years over the study area based on the weather station annual precipitation data. Years with deviations in precipitation below the long-term average of 357 mm for the 1980–2015 period or 371.4 mm for the 2000–2015 period were identified as potential drought years as they experienced below-average rainfall.
Based on Figure 2a, Bobirwa sub-district experienced 21 potential drought years between 1980 and 2015 i.e., 1982–1983, 1985, 1987, 1990, 1992–1996, 1999, 2002–2005, 2007–2008, 2010, 2012–2013 and 2015. Figure 2b also shows that for the 16-year period between 2000 and 2015, a total of 11 potential drought years were experienced i.e., 2002–2005, 2007–2008, 2010 and 2012–2015. Notably, 2014 was a potential drought year for the period between 2000 and 2015 while between 1980 and 2015 it was not.

3.1.2. Drought Duration and Recurrence

Further analyses of the negative deviations in annual precipitation results are presented in Table 1; the duration of dry spells (potential drought years) ranged between 1 and 5 years during the 36-year period. The longest dry spell was recorded between 1992 and 1996 with the average duration of each potential drought event lasting for almost 2 years (Table 1). Table 1 also shows that the recurrence of these dry spells (years since last experienced) fluctuated between 2 and 3 years with an average of 2.3 years between drought events during the 36-year period.

3.1.3. Drought Frequency and Prevalence

Further analyses of the negative deviations from long-term average rainfall revealed that for every 5-year period, drought frequency fluctuated between 2 and 4 times with the highest frequency recorded during the 1991–1995 period which translates into a prevalence of 80% (Table 2). The average frequency of drought events for a 5-year period was 3 translating into a prevalence of 60%. However, considering the 10-year periods of 1981–1990, 1991–2000 and 2001–2010, the frequency of potential drought events was 5, 6 and 7 times, respectively. This reveals an increase in the prevalence of droughts from 50% between 1981 and 1990 to 60% between 1991 and 2000 and then 70% between 2001 and 2010. Although the frequency and prevalence of droughts years between 2011 and 2015 were 3 and 60%, respectively, the trend for the decade between 2011 and 2020 may have similar trends to those of the decade between 2001 and 2010.
For the period between 2000 and 2015, the average drought frequency for a 5-year period was 3.7 (Table 3) which was more than that during the entire period between 1980 and 2015. Similarly, the observed average drought prevalence of 73.3% during the period 2000–2015 was also considerably higher than the 60% during the 1980–2015 period, further suggesting that droughts were becoming more pervasive in recent years.

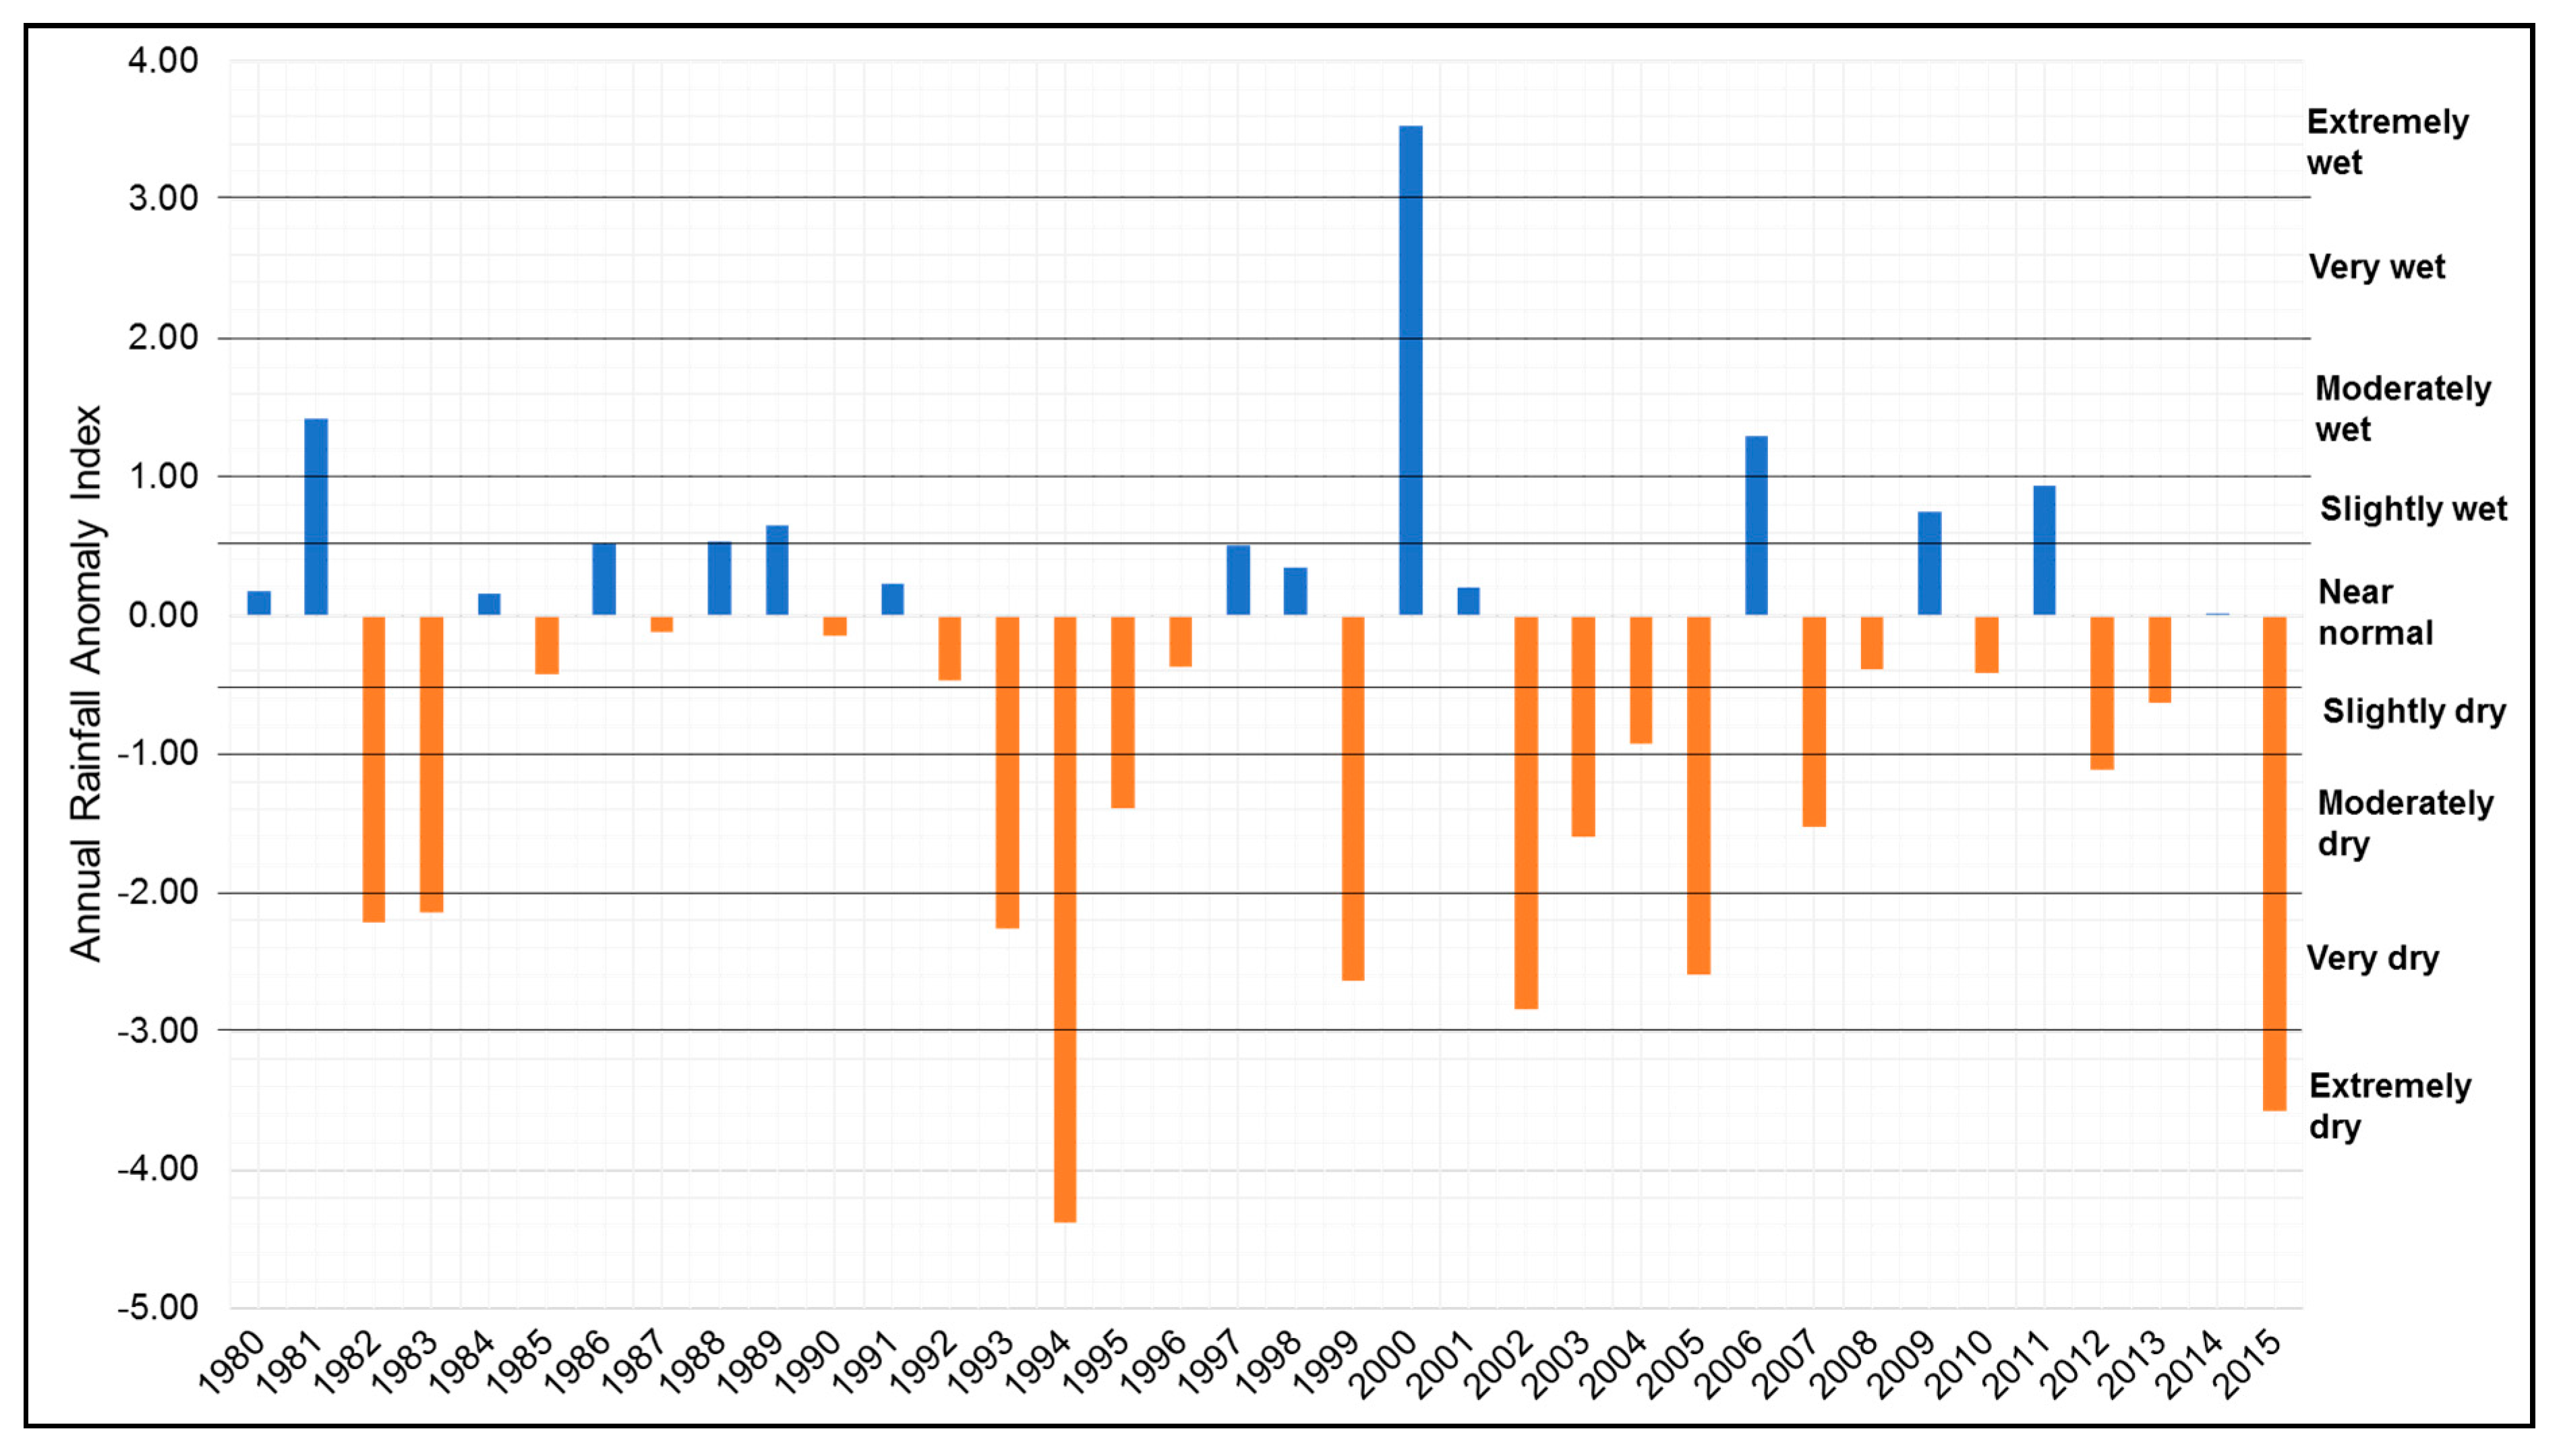
3.1.4. Drought Severity and Classification

Results of the severity of drought events computed using the rainfall anomaly index (RAI) for the period 1980–2015 are shown in Figure 3 below. The negative RAIs are associated with years identified as potential drought years while positive values are associated with non-drought years during the assessment period.
For the potential drought years, the RAI ranged between −4.38 and −0.12 while for the non-drought years, it ranged between 0.15 and 3.53 (Figure 3) over Bobirwa sub-district. The classification of RAI based on studies by Rooy (1965) in Table 4 shows that drought years had an RAI less than −0.50 while the near normal and other wet years had an RAI greater than −0.49.
Based on Rooy’s classification in Table 4 above, the years 1994 and 2015 were classified as extremely dry years while 1982–1983, 1993, 1999, 2002 and 2005 (≤−3) were classified as very dry (−2.99 to −2.00). The years 1995, 2003, 2007 and 2012 (−1.99 to −1.00) were classified as moderately dry while 2004 and 2013 were classified as slightly dry. The severity of drought events is proportional to the extent of the deviations below the long-term average rainfall i.e., the bigger the negative deviation, the greater the drought severity as depicted by the increasing severity as RAI becomes more negative. The 1994 and 2015 droughts over Bobirwa sub-district were the most severe.
The near-normal years (−0.49 to 0.49) were 1980, 1984–1985, 1987, 1990–1992, 1996, 1998, 2001, 2008, 2010 and 2014. Despite the years 1985, 1987, 1990, 1992, 1996, 2008, and 2010 being potential drought years, they were classified as near normal years. The years 1986, 1988–1989, 1997, 2009 and 2011 were classified as slightly wet i.e., just above near normal (0.50 to 0.99) while 1981 and 2006 were classified as moderately wet (1.00 to 1.99). The year 2000 was classified as extremely wet (≥3.00) while there was no year classified as very wet (2.00 to 2.99). Like droughts, the classification of wet years shows that the severity also varied considerably during the study period. For instance, the year 2000 was shown to be an extremely wet year in the entire time-series. Extremely wet conditions affected parts of the Southern Africa region due to the cyclone Eline [32]. Many locations in and around South Africa, Mozambique, and Zimbabwe including the drylands recorded annual precipitation significantly above the long-term average [32].

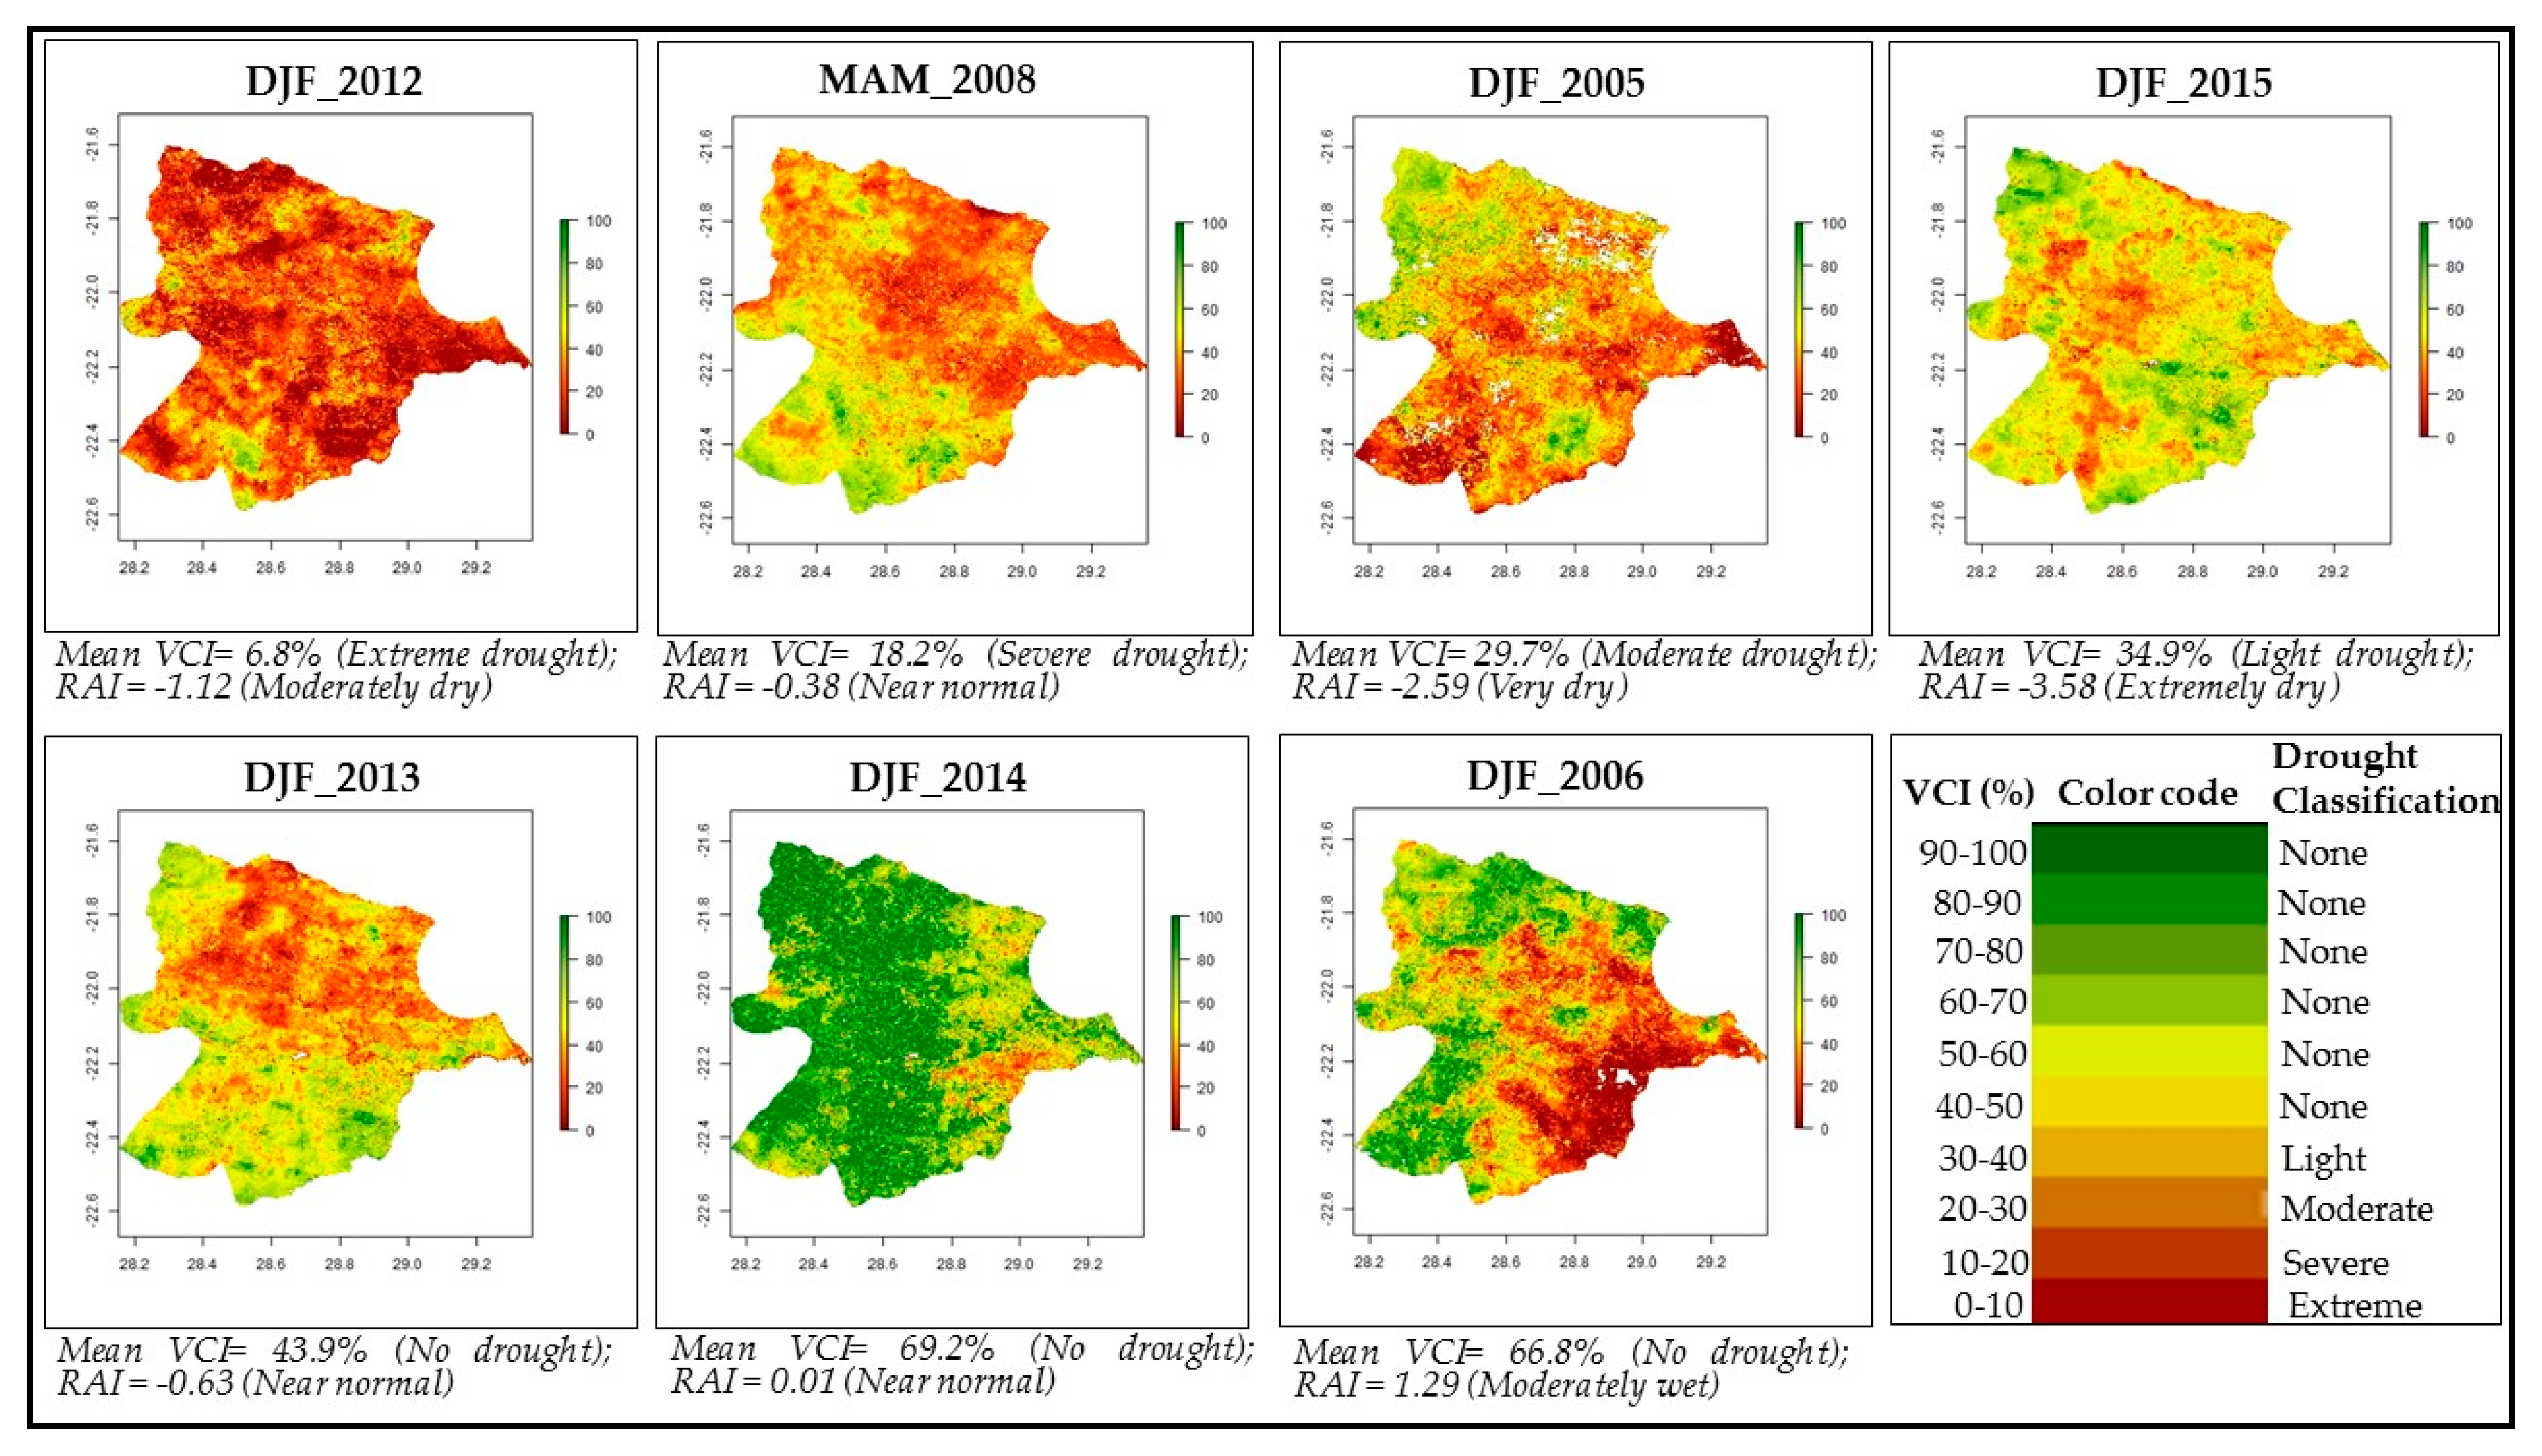
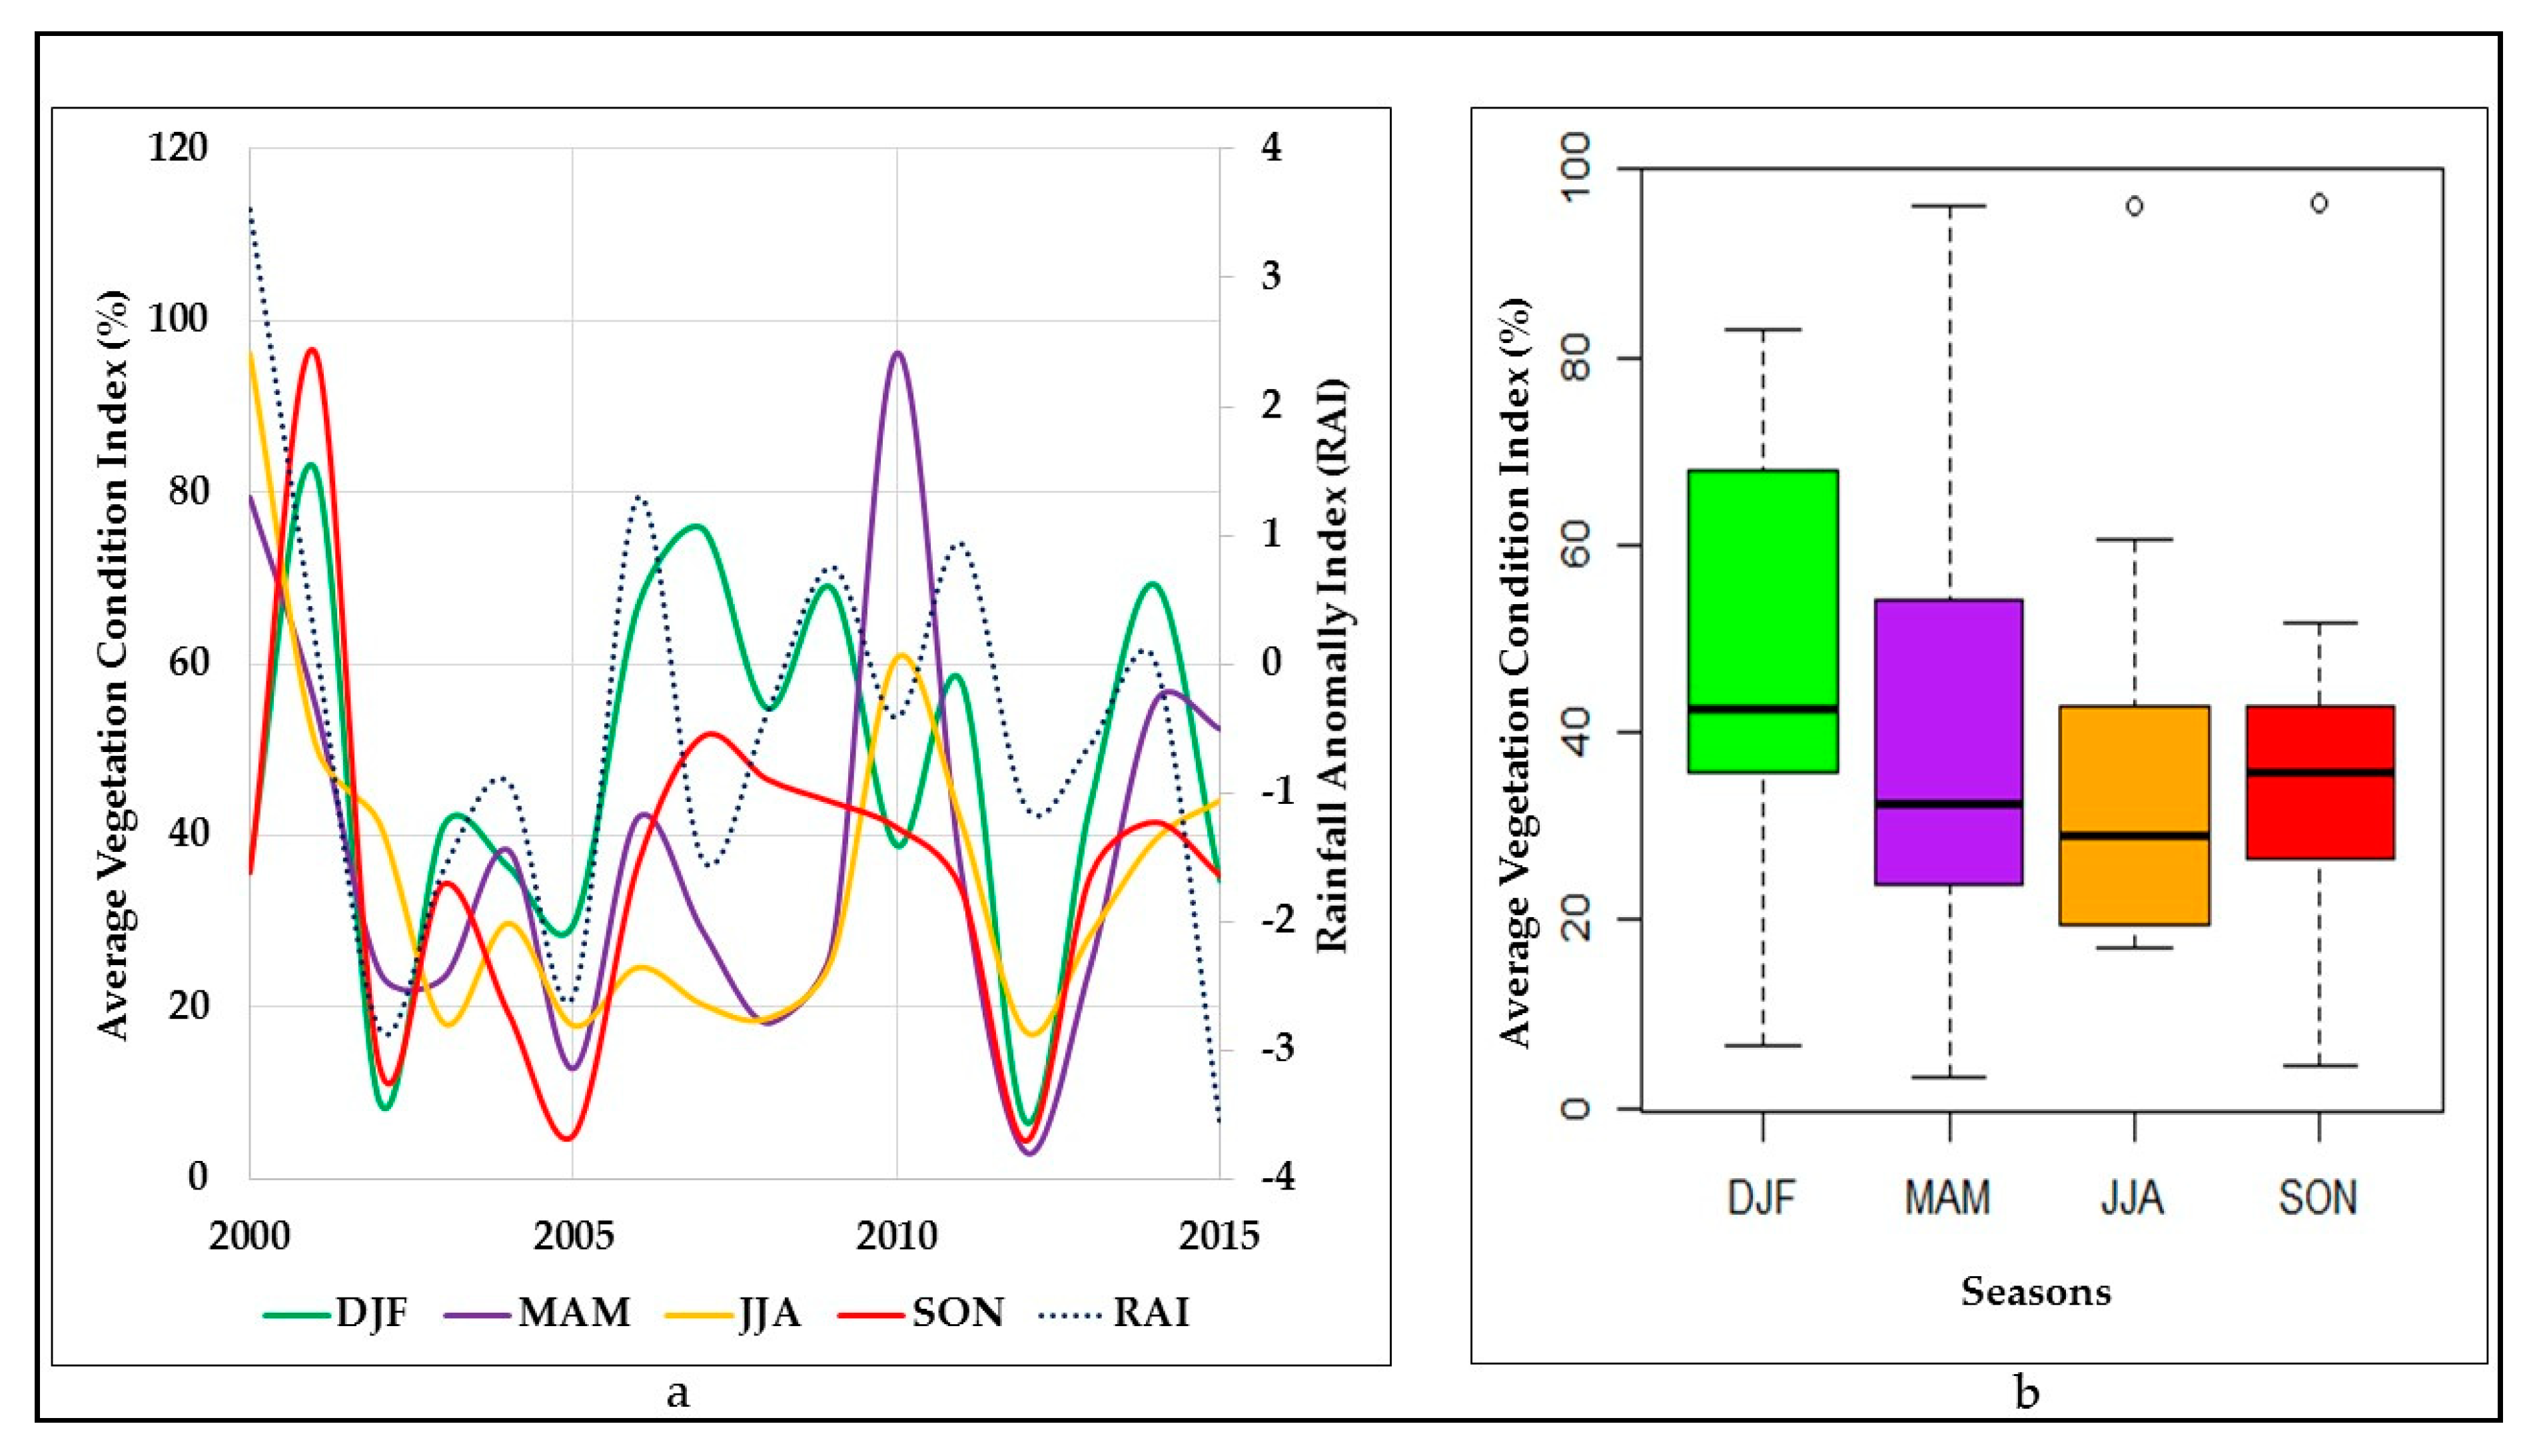
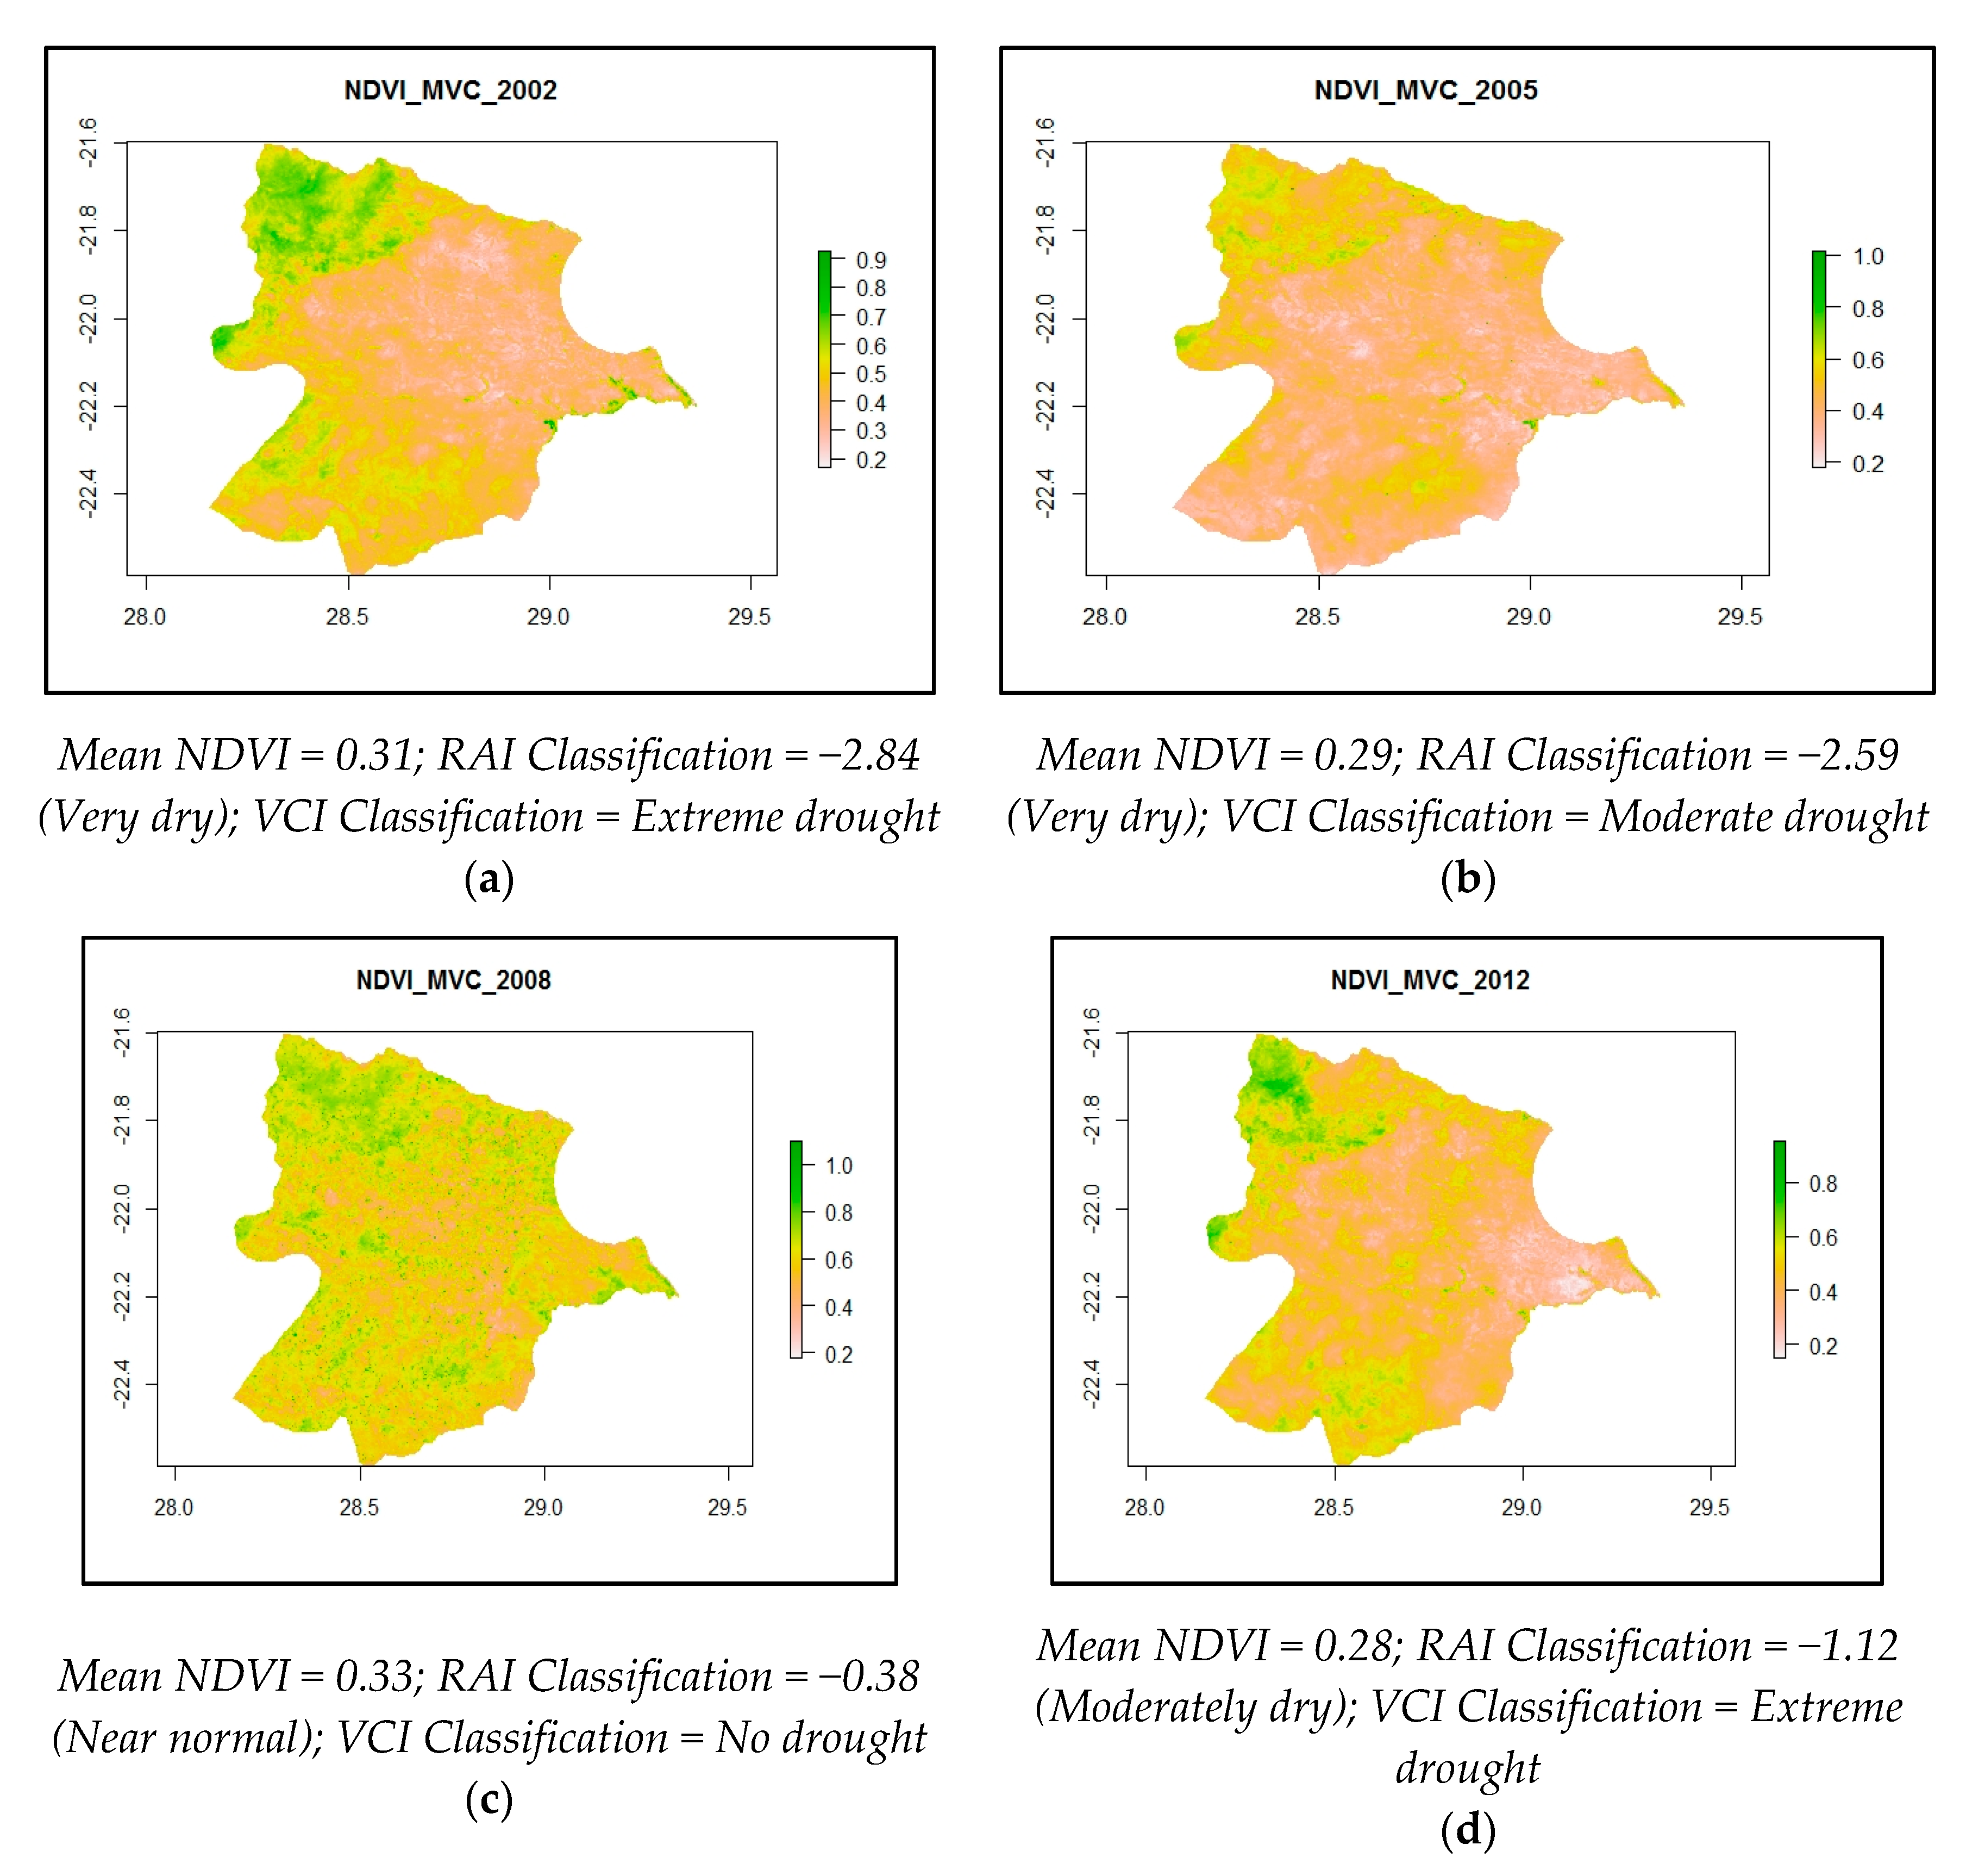
3.1.5. Vegetation Condition Index (VCI)

The VCI in Figure 4 shows the effect of meteorological drought on natural vegetation such as rain-fed agriculture, natural pastures and woodlands. Besides showing the seasonal and interannual effects of droughts, the VCI in Figure 4 shows the spatial dynamics of droughts in Bobirwa sub-district for selected years and seasons. It relates the magnitude and color codes of the VCI to the severity or intensity of drought on natural vegetation. Similar to the RAI, VCI values reveal that droughts experienced across the Bobirwa sub-district varied in intensity or severity across space and time.
The VCI values in Figure 4 range between 0 and 100% with lower values depicting very severe droughts while increasing values show the declining intensity of droughts similar to the RAI. The classification of the VCI magnitude and color code shows that the DJF season in 2012 experienced extreme droughts (VCI < 10%) while in the MAM season in 2012 there was severe drought (VCI = 10–20%). The DJF season in 2005 experienced moderate drought (VCI = 20–30%) while the same season in 2015 experienced light drought (VCI = 30–40%). VCI values from 40% upwards indicate the absence of droughts though it does not classify the different extents. Thus, during the DJF seasons in 2006, 2013 and 2014, there were no droughts based on the VCI.
Considering that the rainfall season in the study area is historically between December and March, peak vegetation growth, therefore, occurs towards the end of the DJF and early MAM as evident in Figure 5b. As such, even during non-drought years, the winter months JJA and early SON often show characteristics similar to droughts as the period forms the dry season. Based on average VCI during the DJF season (Figure 5a), severe-to-extreme droughts (0–20%) were experienced in 2002 and 2012 while severe-to-extreme droughts occurred in 2000, 2004–2005, 2010 and 2015. Before the rainy season, i.e., SON, there were light-to-moderate droughts in 2000–2003, 2006, 2011, 2013 and 2015 while severe-to-moderate droughts occurred in 2002, 2004–2005 and 2012. During the period after the rainy season, i.e., MAM, severe-to-extreme droughts occurred in 2005, 2008 and 2012 while light-to-moderate droughts (20–40) occurred in 2002–2004, 2007, 2009, 2011 and 2013. The extremely wet conditions of 2000 are evident in Figure 5a with a VCI between 80 and 100% during the post-rainy season i.e., MAM and JJA seasons. These results show that the VCI revealed very dynamic meteorological droughts prior, during and post rainy seasons between 2000 and 2015.
The results of drought occurrence using average VCI and RAI (Figure 5a) are comparable for the years 2002–2005, 2007 and 2012–2013. The VCI classification of 2008 (near normal), 2011 (slightly wet), 2006 (moderately wet) and 2009 (extremely wet) indicate possible spatial variability of precipitation and droughts over the study area, i.e., above normal rainfall was received around the weather station while other areas received below normal rainfall. Figure 5b indicates that the peak vegetation growth occurs during the DJF season while the SON season experiences the second-highest peak vegetation growth. The least vegetation growth occurs during the winter season i.e., JJA.
Figure 6 shows the maximum vegetation condition in each pixel in a given year based on NDVI for the selected years with no drought and with different severities of droughts based on RAI and VCI. The green color depicts green healthy vegetation while the brown color depicts very poor vegetation and the whitish color depicts bare patches with no vegetation. Figure 6 shows that the effects of droughts are dynamic or vary across vegetation types while mean NDVI, RAI and VCI further reveal the effects of different drought severities on local vegetation. Since the most negative RAI was in 2002 and the lowest mean NDVI was in 2012 for the four selected years, it highlights the challenges of relying on weather station data to generalize for the entire study area. Nonetheless, these findings showing low NDVI are consistent with observations by local communities who reported spatially variable impacts of droughts on local vegetation.
Figure 7 shows that average yields of rain-fed sorghum, maize, millet and cowpeas per area planted were well below 200 kg/ha. Figure 8 also shows that there was a disparity between the area planted and the area harvested in most years between 2009 and 2017. This could suggest that crop failure in the sub-district during this period was mainly caused by droughts.
The similarity between area planted and area harvested in 2013/2014 is consistent with the lack of VCI-derived droughts (meteorological) during the growing season (DJF) in 2013 and 2014. The greatest disparity between area planted and area harvested in the 2012/2013 season in Figure 8 is consistent with the extreme droughts (VCI) which occurred during the growing season in 2012.

4. Discussion

4.1. Drought Dynamics in Bobirwa Sub-District

This study examined the spatial and temporal dynamics of meteorological droughts in the semi-arid Bobirwa sub-district in eastern Botswana using the rainfall anomaly index (RAI) and vegetation condition index. The techniques are applied in a context where there is a lack of spatially distributed weather station data. Thus, we compared RAI from weather station data with remotely sensed VCI in order to provide spatially explicit information on meteorological drought occurrence. This was aimed at providing important insights of the effects of agricultural droughts based on the observed meteorological droughts, i.e., influence of moisture stress on vegetation-based provisioning ecosystem services (ES) and agricultural productivity in order to gain insights on the potential and the sustainability of ecosystem-based adaptations in the study area. Ref. [1,2,3] found that the most essential provisioning ES in the Bobirwa sub-district such as natural pastures, natural medicines, palm plant products and Mopane caterpillars (Imbrasia belina) depend on the extent and richness of vegetation and that agriculture was an important livelihood strategy. Thus, droughts threaten these livelihood activities by limiting vegetation condition and agricultural productivity. The study considered the period 1980–2015 (RAI) and 2000–2015 (VCI).
For the 16-years between 2000 and 2015, the RAI-derived meteorological droughts indicated a higher prevalence of droughts (68.8%) compared to the agricultural drought occurrence based on average VCI for the entire study area and the pre-rainy season (SON = 62.5%), rainy season (DJF = 43.8%) and post-rainy season (MAM = 62.5%). We make two important observations from these findings. Firstly, precipitation data at Bobonong Police Station cannot be used to generalize the drought occurrence in the study area. Secondly, the averaging of the spatially explicit VCI in different seasons potentially masks drought occurrence in parts of the sub-district. Thus, spatial variability of drought occurrence provides more useful information for understanding the consequences on vegetation-dependent provisioning services i.e., the influence of agricultural droughts. The drought prevalence derived from RAI for the period 1980–2015 based on the precipitation data in Bobonong village shows that meteorological drought occurrence between 2000 and 2015 increased from 58.3 to 68.8%. Similar findings of increasing frequency of droughts in recent years were also shown through studies by [19]. Several studies have also pointed towards an increased frequency and/or duration of drought events especially in semi-arid landscapes across the globe.
The spatial heterogeneity of VCI across the sub-district with various extents of drought severity suggests that rainfall in the study area is variable over short distances. Thus, drought events in Bobirwa sub-district may vary from one place (village) to another and from one drought event to the other as noted elsewhere by [3]. Although the RAI provides an important reference point to compare droughts prevalence in the vicinity of the weather station with drought occurrence elsewhere in the sub-district, the VCI provides more useful information to understand the effect of meteorological and agricultural droughts on natural vegetation such as rain-fed agriculture, natural pastures and woodlands. Besides showing the seasonal and interannual effects of droughts, the VCI analyses in this study shows the spatial dynamics of droughts in Bobirwa sub-district. This could explain the low agricultural productivity and declining provisioning ES reported by previous studies despite the overall trend in annual precipitation not changing significantly. The possible influence of observed droughts on natural vegetation in the study area is evident from the analyses of NDVI during the selected drought years.
Considering that the rainfall season in the study area is historically between December and March, peak vegetation growth, therefore, occurs towards the end of the DJF as shown by the seasonal variability of VCI (Figure 5b). Even during non-drought years, the winter months JJA and the hot and dry season before the rainy season, i.e., SON, also show characteristics similar to droughts as both periods form the dry season. Although the results of drought occurrence using VCI and RAI are comparable for the years 2002–2005, 2007 and 2012–2013, the VCI classification of 2008 (near normal), 2011 (slightly wet), 2006 (moderately wet) and 2009 (extremely wet) as drought years suggest spatial variability of precipitation and droughts in the study area i.e., above normal rainfall received around the weather station while other areas received below normal rainfall. Similar results of spatial variability of rainfall and droughts within a locality were shown elsewhere by [33]. This shows how relying on data from a single weather station in making decisions by farmers across the sub-district could result in sub-optimal decisions. Similarly, the seasonal weather forecasts by the Meteorological Services Department, whose reporting unit is the district, become less important to Bobirwa sub-district, and particularly to the farming households in the villages.

4.2. Consequences of Drought Dynamics on Vegetation

4.2.1. Grasslands and Natural Pastures

Although woodlands, croplands, grasslands, and natural pastures are affected by droughts to varying degrees, different drought severities also affect vegetation to varying extents. Indigenous people, particularly smallholder crop and livestock farmers, Mopane caterpillar harvesters and those involved in the exploitation of various forest products, reported declining vegetation conditions. For instance, the decline in natural pastures for livestock at the communal grazing areas was mainly attributed to the increased frequency of droughts in the last decade. This revealed the susceptibility of natural pastures to extended dry spells and periods of moisture stress. A previous study by [3] in Marigat Sub-County, Kenya, reported diminishing condition of natural pastures and grasslands compared to other vegetation types such as woodlands and shrubs.
Further to declining vegetation condition, several bare patches of land were observed at the communal grazing areas with reports that they were on the increase within the last decade. This was also reported to be caused by extended drought events and dry spells such as the 5-year and 4-year below-normal rainfall experienced between 1992 and 1996, and 2002 and 2005, respectively. Drought events were also reported to be more severe and regular in recent years compared to the first decade of the assessment period. The prevalence of Foot-and-Mouth Disease (FMD) during the assessment period which restricted the movement of livestock and livestock products from the study area was linked with overgrazing as livestock farmers had no incentive to destock during droughts. Since livestock could only be sold within the sub-district due to FMD-induced restrictions, the subdued prices discouraged destocking or selling, leading to overstocking and degradation of natural pastures.
The drought-induced changes in local vegetation reported by local communities are evident in Figure 4 showing vegetation condition indices below 20%, particularly towards the end of the hot and wet season (March/April) when vegetation condition is expected to be highest. In addition, the NDVI images in Figure 6 showing the maximum vegetation condition in each pixel in a given year are consistent with observations by local communities of spatially variable impacts of droughts on local vegetation. From the NDVI images, the brown color depicts very poor vegetation and the whitish color depicts bare patches with no vegetation which may indicate the influence of droughts.
Since the most negative RAI was in 2002 and the lowest mean NDVI was in 2012 for the four selected years, it highlights the challenges of relying on weather station data to generalize for the entire study area. These findings also suggest that precipitation in the study area is highly variable over short distances. Ref. [33,34] also found considerable variability of precipitation across space and time over semi-arid areas. The lower mean NDVI value for 2005 compared to 2008 suggests that drought in Bobirwa sub-district was more severe in 2005 than in 2008. Very severe droughts diminish vegetation condition and, in some cases, leaving bare patches with no vegetation. We find similarities between our findings and those by [3] who noted that severe droughts were associated with low NDVI while less severe droughts had relatively higher NDVI values. The authors in [9] also had similar findings where prolonged droughts in the semi-arid Sahel region caused degradation of vegetation which has failed to fully recover.

4.2.2. Woodlands

Although woodlands are more resilient to droughts than grasslands and natural pastures [3], the drought-induced decline in woodlands in Bobirwa sub-district was indirect. For instance, households reported clearing more woodlands to increase the area under cultivated crops to guarantee harvests since smallholder crop production was largely rain-fed. Many households also reported relying on firewood for cooking and heating while others reported an increase in harvesting of firewood for commercial purposes as an income source. The increasing dependence on firewood by households was attributed to a growing human population as well as a lack of cheaper alternatives as electricity and liquid petroleum gas were expensive as noted by the National Housing and Population Census of 2011 [35]. The impact of droughts on rain-fed agriculture further limited household incomes causing many to resort to harvesting firewood for commercial purposes. Mopane trees were mostly harvested as they were abundant in the study area. Ref. [36] also found that after the Fast Track Land Reform Programme, communities in semi-arid areas of Zimbabwe resorted to selling firewood as an income source as rain-fed agriculture was highly constrained. During droughts, elephants often migrate between Zimbabwe and the study area resulting in high elephant populations that destroy trees. As droughts have been more frequent and severe in recent years, regeneration of trees and woodlands is increasingly constrained, further limiting tree cover and often leaving patches of bare land with little or no vegetation.

4.2.3. Riparian Vegetation

Vegetation along the catchment, particularly margins and banks, of three major rivers passing through the study area (Shashe, Motloutse and Thune rivers) was reported to be declining since the turn of the millennium due to damming upstream of the study area. Dikgatlhong Dam along the Shashe river, and the largest dam by volume in Botswana completed in 2011, and Letsibogo Dam along the Motloutse river completed in 2000 are both located upstream of the study area while Thune dam along the Thune river completed in 2013 is located within the study area. Damming of these rivers drastically reduced streamflow, and potentially groundwater, resulting in declining vegetation along the major rivers due to limited soil moisture regimes. The declining vegetation condition downstream of the study area is evident in most MODIS vegetation products. The declining vegetation along rivers was also causing considerable erosion and gullies along riverbanks which also caused the siltation of rivers.

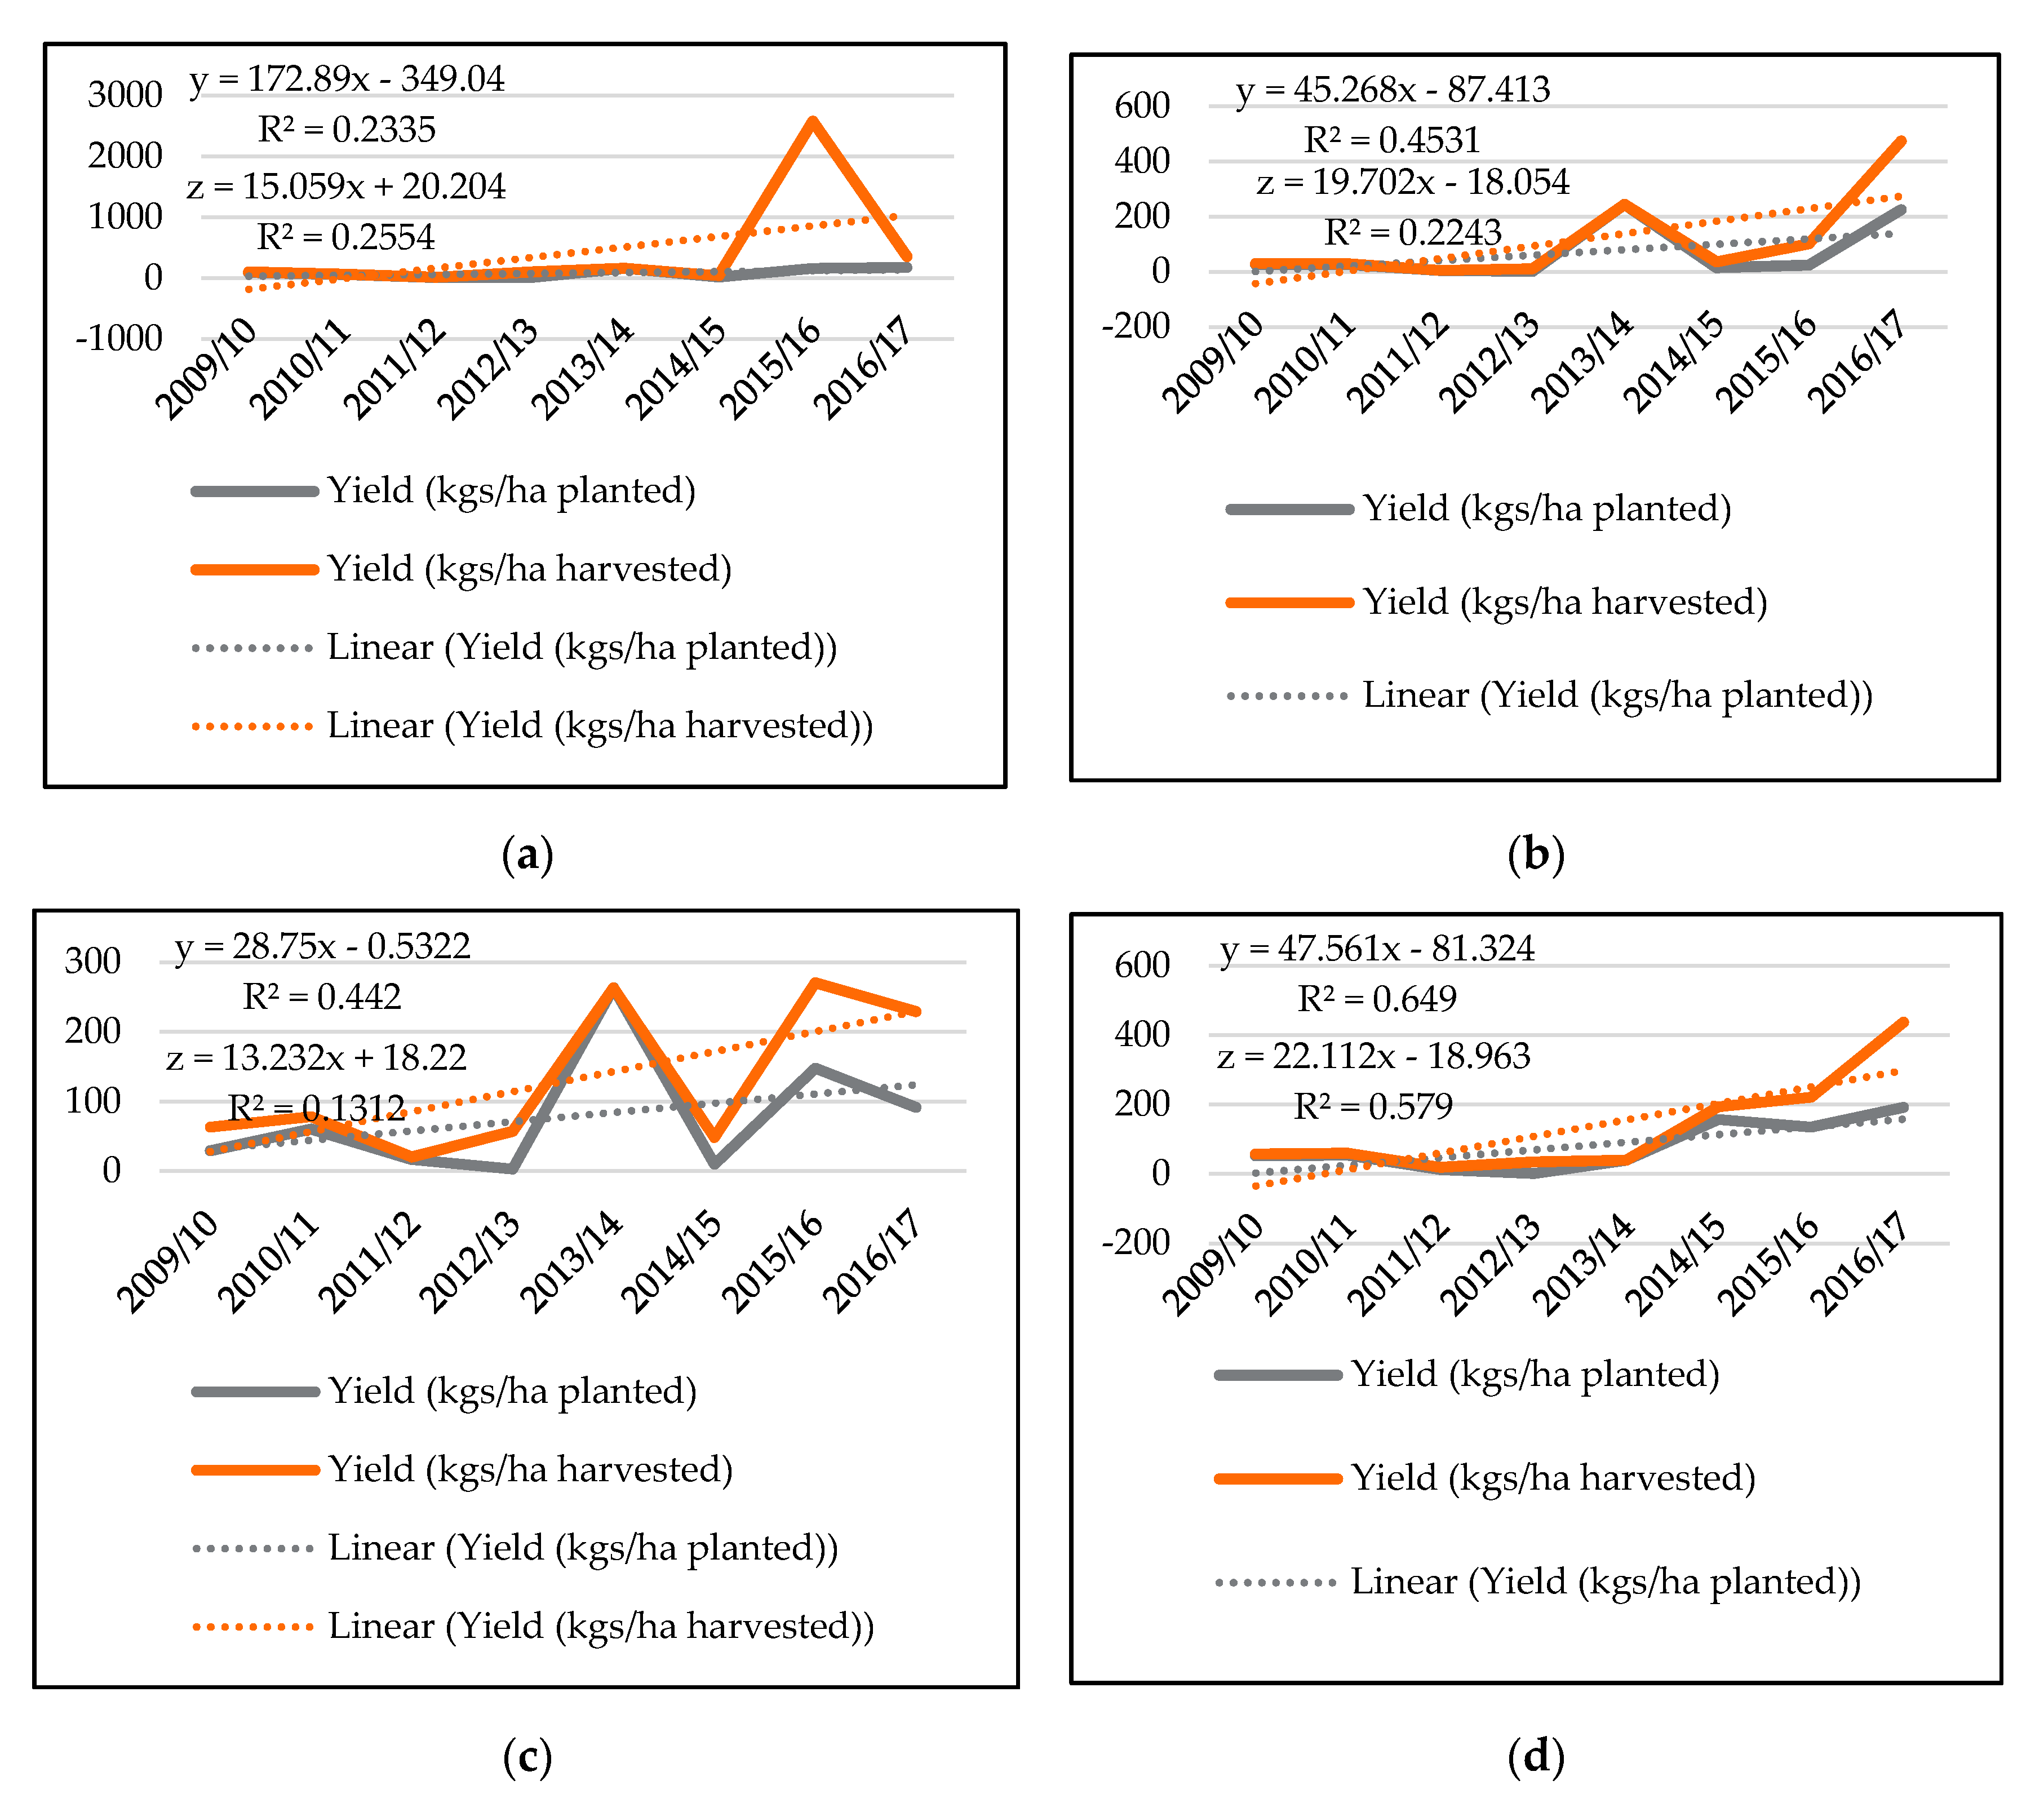
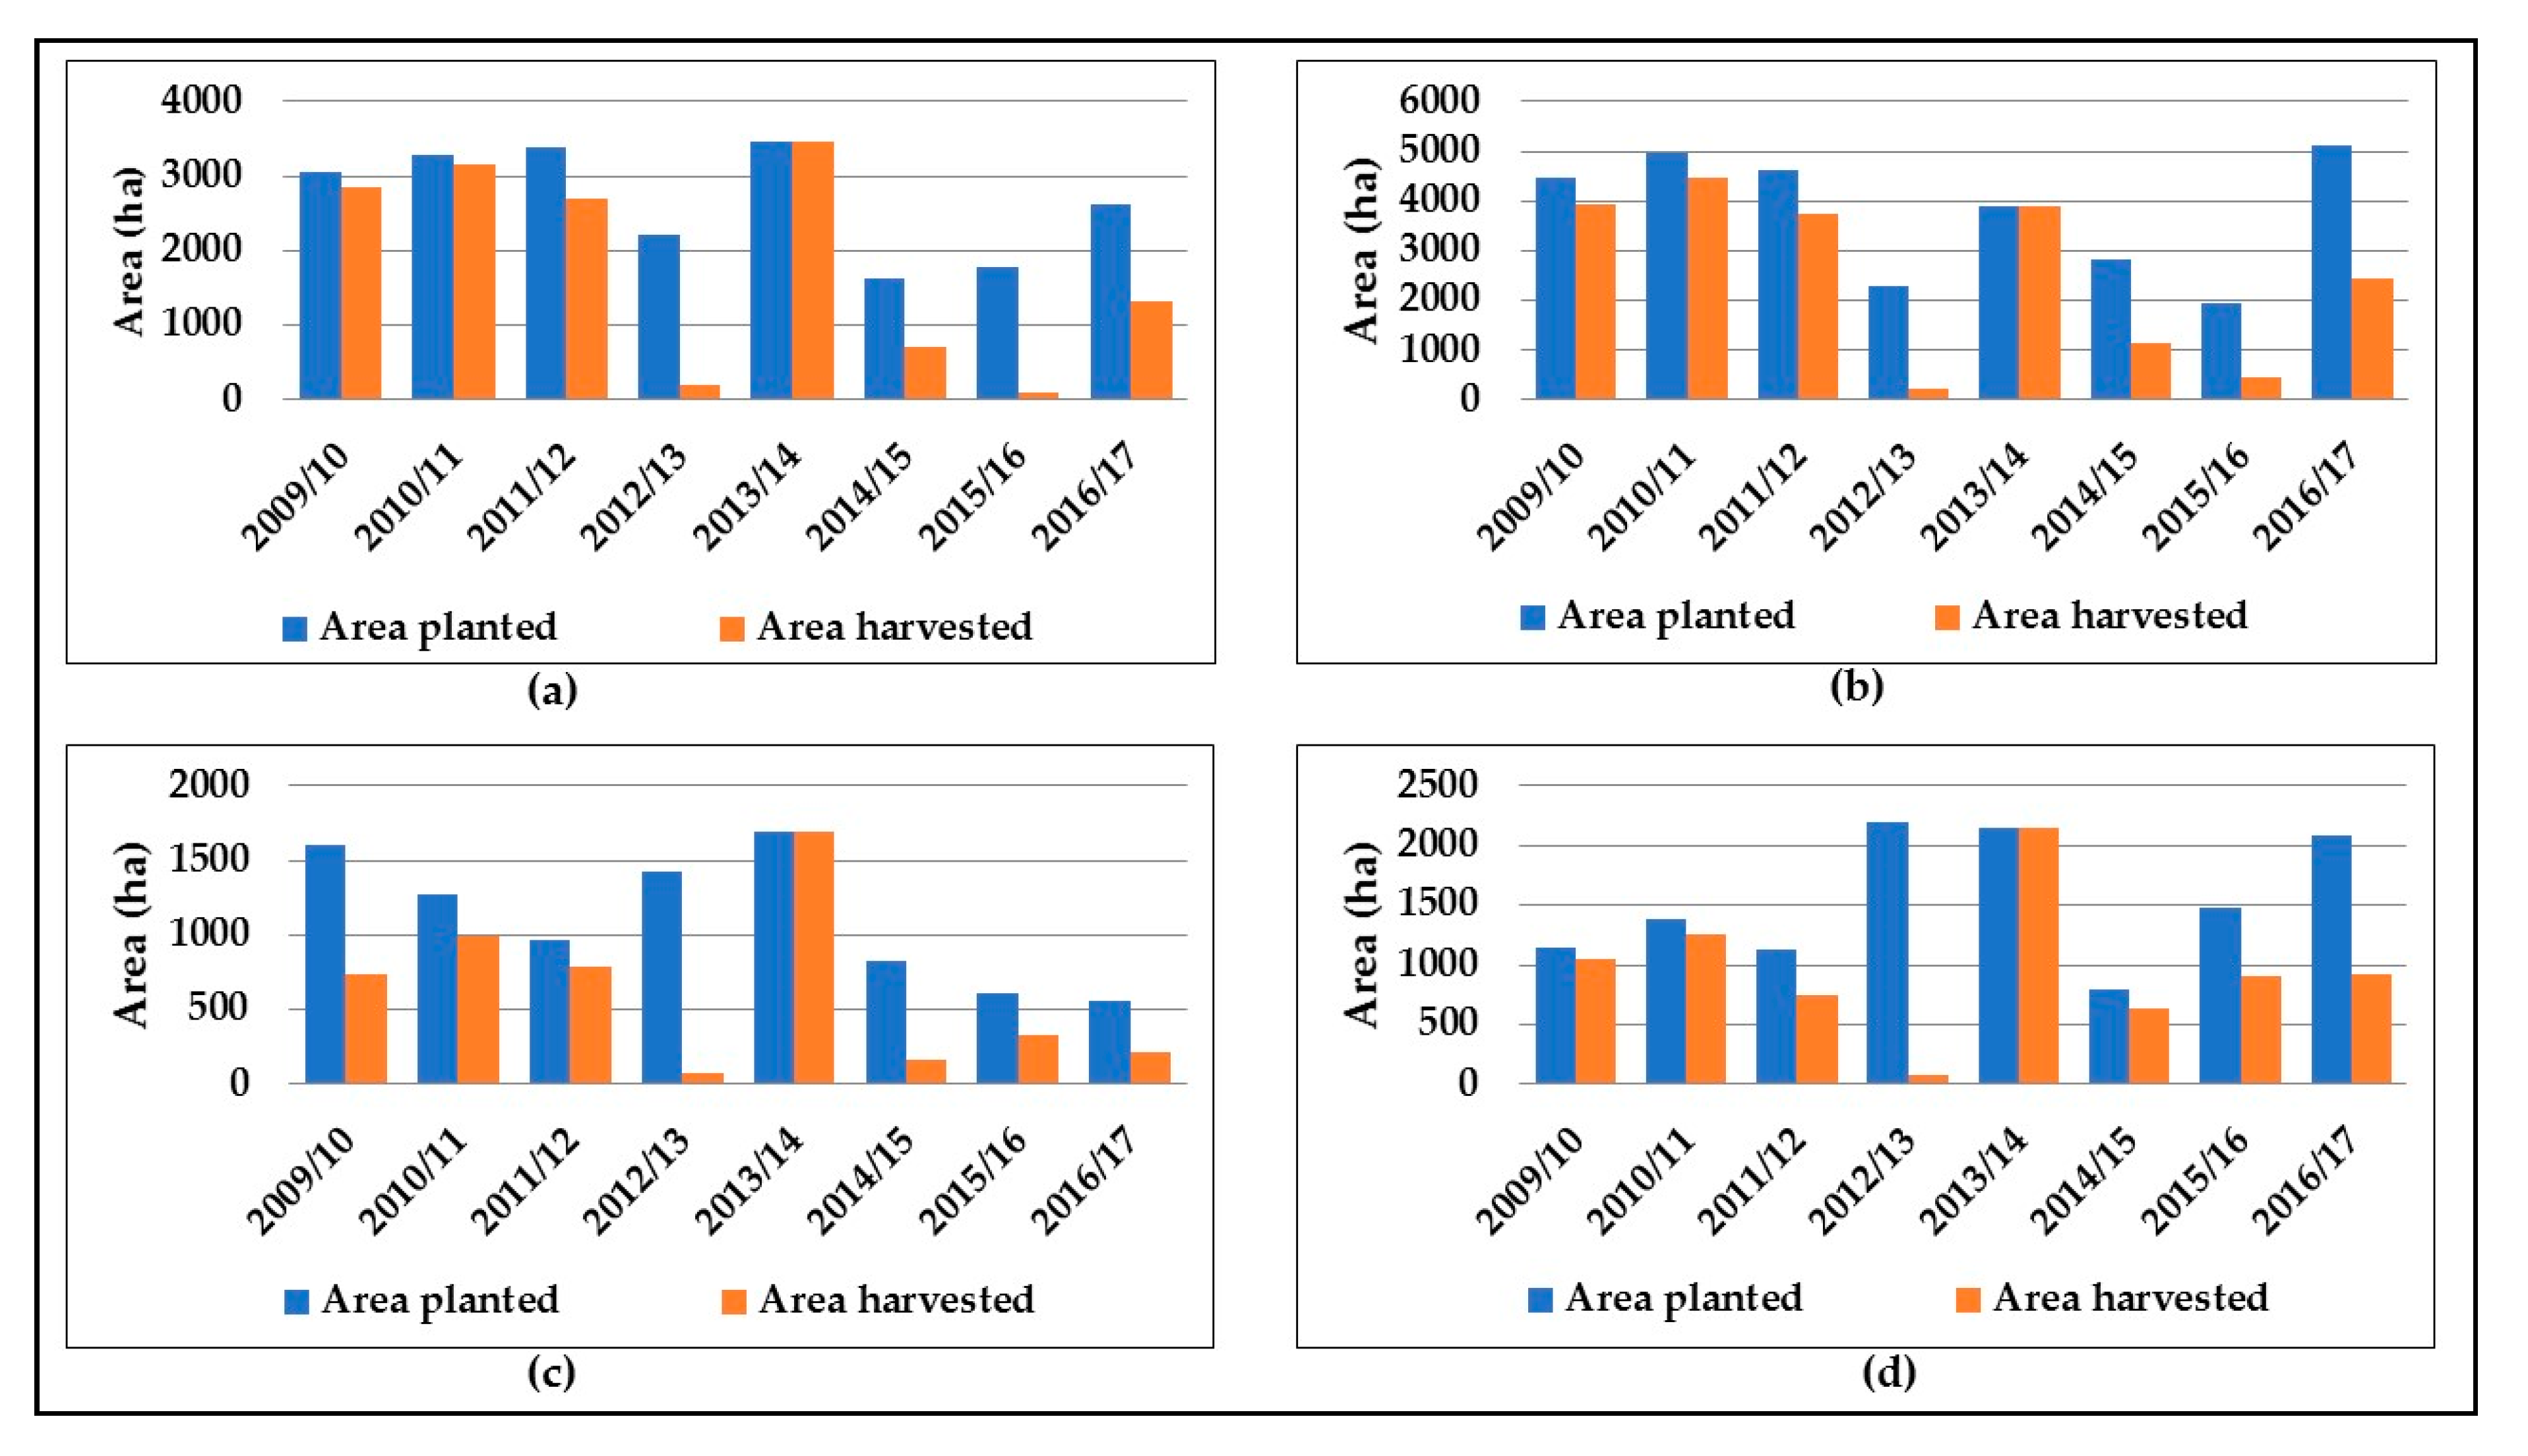
4.2.4. Rain-Fed Crops

The observed trends in rain-fed crop productivity and cultivated area highlight limits imposed by droughts on rain-fed agriculture in Bobirwa sub-district. Figure 7 shows that average yields of rain-fed sorghum, maize, millet and cowpeas per area planted were well below 200 kg/ha. The disparity between area planted and area harvested (Figure 8) further suggests that crop failure in the sub-district is mainly caused by droughts. This is because smallholder farmers were given free seeds, fertilizers, pesticides and tillage since 2008 under the Integrated Support Programme for Arable Agriculture Development (ISPAAD) by the Ministry of Agriculture yet yields remained low. A study by [37] showed that with ISPAAD, maximum grain yield among smallholder farmers was expected to increase from an average of 320 kg/ha to at least 1000 kg/ha for all grain crops. The findings in Figure 7 suggest that the grain yields in the sub-district have remained low even with input subsidies from ISPAAD. However, the small increase in grain yield from area harvested suggests that, with enough moisture or in normal years, productivity could increase. Supplementary moisture can be supplied through smallholder irrigation development using groundwater on small plots.
As an important primary livelihood source, the increased severity, duration and recurrence of droughts may cause more households to clear more land for cultivating crops in order to act as insurance against drought-induced crop failure, i.e., staggered planting may allow salvaging yields in case of droughts. Besides, with a gradually growing human population, increasing demand for agricultural land may also be causing accelerated deforestation. Similar results where frequent droughts and human population growth were not only exerting pressure on land resources, but driving changes in land-use and/land-cover in semi-arid areas, were also shown elsewhere by [3]. While expanding the area under rain-fed crops may seem a viable option to deal with the drought risk and population growth, this could have several undesirable consequences. For instance, massive deforestation coupled with crop failure may increase the vulnerability of local communities considering the trade-offs between forest products and cultivated agriculture i.e., benefits from an increased area under crops through the conversion of woodlands appear to be far less than the goods and services which communities derive from the woodlands before the change. However, expanding area under crops to counter the effects of droughts requires other complementing investments such as climate-smart agriculture technology, improved seeds, fertilizers and irrigation development for it to be an effective adaptation strategy for semi-arid landscapes.

5. Conclusions

Our study shows that drought events in the Bobirwa sub-district of Botswana, and possibly the entire country, have become more frequent, severe and longer in the past two decades. The study findings showed that precipitation and drought events in the study area were very dynamic and makes relying on poorly distributed weather station precipitation data alone for assessing droughts inadequate. Vegetation condition index derived from remotely sensed NDVI provides a better alternative to assess spatial dynamics of droughts in data-poor regions such as Bobirwa sub-district. The variable response of vegetation to recent droughts shown in this study suggests increasing occurrence of more severe droughts and/or variable susceptibility of different vegetation types. Droughts could also be triggering land-use changes that create adverse trade-offs with the delivery of several ecosystem services in the sub-district. The extended and more frequent droughts experienced in Bobirwa sub-district further expose the livelihoods of local communities which are heavily dependent on exploiting ecosystem products for well-being and adaptation to climate. The unchecked and drought-induced conversion of vegetation to rain-fed agriculture in Bobirwa sub-district could further expose the livelihoods of local communities. There exists an urgent need to increase agricultural productivity through smallholder irrigation development using groundwater in order to enhance crop yields. Higher crop yields may help curb agricultural expansions into natural vegetation, a measure used to salvage crop yields during drought periods. Therefore, smallholder irrigation development can effectively improve yields, reduce demand for agricultural land, increase food availability and local incomes while also providing a sustainable pathway to adaptation in semi-arid landscapes. The Meteorological Services Department needs to increase weather stations in the sub-district and to also provide more localized seasonal forecasts in order to enhance decision-making.

Author Contributions

Conceptualization, methodology, validation, formal analysis, investigation, writing—original draft preparation, E.M.; writing—review and editing, supervision, project administration, H.M. and M.B. All authors have read and agreed to the published version of the manuscript.

Funding

This research was carried out under the Adaptation at Scale in Semi-Arid Regions project (ASSAR). ASSAR is one of four research programs funded under the Collaborative Adaptation Research Initiative in Africa and Asia (CARIAA), with financial support from the UK Government’s Department for International Development (DfID) and the International Development Research Centre (IDRC), Canada. The views expressed in this work are those of the authors and do not necessarily represent those of DfID and IDRC or its Board of Governors.

Acknowledgments

We acknowledge the assistance rendered by Metseotata Mafoko, Lerato Sebola, Village Development Committees and the traditional leadership in the planning and organization of participatory mapping exercises including the mobilization of participants. We are grateful to the study participants in particular, and the entire community in Bobirwa sub-district, for providing important insights into the remotely sensed analyses.

Conflicts of Interest

The authors declare no conflict of interest. The funders had no role in the design of the study; in the collection, analyses, or interpretation of data; in the writing of the manuscript, or in the decision to publish the results.

References

  1. IPCC. Climate Change 2013: The Physical Science Basis. Contribution of Working Group I to the Fifth Assessment Report of the Intergovernmental Panel on Climate Change; Cambridge University Press: Cambridge, UK, 2014. [Google Scholar]
  2. Liu, W.; Sun, F.; Lim, W.H.; Zhang, J.; Wang, H.; Shiogama, H.; Zhang, Y. Global drought and severe drought-affected populations in 1.5 and 2 °C warmer worlds. Earth Syst. Dyn. 2018, 9, 267–283. [Google Scholar] [CrossRef] [Green Version]
  3. Kosonei, R.C.; Abuom, P.O.; Bosire, E.; Huho, J.M. Effects of Drought Dynamics on Vegetation Cover in Marigat Sub-County, Baringo County, Kenya. Int. J. Sci. Publ. 2017, 7, 89–98. [Google Scholar]
  4. Bagley, J.E.; Desai, A.R.; Harding, K.J.; Snyder, P.K.; Foley, J.A. Drought and Deforestation: Has Land Cover Change Influenced Recent Precipitation Extremes in the Amazon? J. Clim. 2014, 27, 345–361. [Google Scholar] [CrossRef]
  5. Kogan, F.N. Global Drought Watch from Space. Bull. Am. Meteorol. Soc. 1997, 78, 621–636. [Google Scholar] [CrossRef]
  6. Bhalotra, Y.P.R. The Drought of 1981–87 in Botswana; Department of Meteorological Services: Gaborone, Botswana, 1987. [Google Scholar]
  7. Fako, T.T.; Molamu, L. The Seven-Year Drought, Household Food Security and Vulnerable Groups in Botswana. Pula Botsw. J. Afr. Stud. 1995, 9, 48–70. [Google Scholar]
  8. Abate, T.; Angassa, A. Conversion of savanna rangelands to bush dominated landscape in Borana, Southern Ethiopia. Ecol. Process. 2016, 5, 1–18. [Google Scholar] [CrossRef] [Green Version]
  9. Brandt, M.; Mbow, C.; Diouf, A.A.; Verger, A.; Samimi, C.; Fensholt, R. Ground- and satellite-based evidence of the biophysical mechanisms behind the greening Sahel. Glob. Chang. Biol. 2015, 21, 1610–1620. [Google Scholar] [CrossRef] [Green Version]
  10. Brandt, M.; Verger, A.; Diouf, A.; Baret, F.; Samimi, C. Local Vegetation Trends in the Sahel of Mali and Senegal Using Long Time Series FAPAR Satellite Products and Field Measurement (1982–2010). Remote Sens. 2014, 6, 2408–2434. [Google Scholar] [CrossRef] [Green Version]
  11. Leroux, L.; Begue, A.; Lo Seen, D.; Jolivot, A.; Kayitakire, F. Driving forces of recent vegetation changes in the Sahel: Lessons learned from regional and local level analyses. Remote Sens. Env. 2017, 191, 38–54. [Google Scholar] [CrossRef] [Green Version]
  12. Mosugelo, K.; Moe, S.; Ringrose, S.; Nellemann, C. Vegetation changes during a 36-year period in northen Chobe National Park, Botswana. Afr. J. Ecol. 2002, 40, 232–240. [Google Scholar] [CrossRef]
  13. Ringrose, S.; Matheson, W.; Wolski, P.; Huntsman-Mapila, P. Vegetation cover trends along the Botswana Kalahari transect. J. Arid Environ. 2003, 54, 297–317. [Google Scholar] [CrossRef] [Green Version]
  14. Winowiecki, L.; Vågen, T.-G.; Huising, J. Effects of land cover on ecosystem services in Tanzania: A spatial assessment of soil organic carbon. Geoderma 2016, 263, 274–283. [Google Scholar] [CrossRef] [Green Version]
  15. Dias, L.C.P.; Macedo, M.N.; Costa, M.H.; Coe, M.T.; Neill, C. Effects of land cover change on evapotranspiration and streamflow of small catchments in the Upper Xingu River Basin, Central Brazil. J. Hydrol. Reg. Stud. 2015, 4, 108–122. [Google Scholar] [CrossRef] [Green Version]
  16. Coe, M.T.; Costa, M.H.; Soares-Filho, B.S. The influence of historical and potential future deforestation on the stream flow of the Amazon River—Land surface processes and atmospheric feedbacks. J. Hydrol. 2009, 369, 165–174. [Google Scholar] [CrossRef]
  17. Huho, J.M.; Kosonei, R.C. Understanding Extreme Climatic Events for Economic Development in Kenya. IOSR J. Env. Sci. Toxicol. Food Technol. 2014, 8, 14–24. [Google Scholar] [CrossRef]
  18. Miyan, M.A. Droughts in Asian Least Developed Countries: Vulnerability and sustainability. Weather Clim. Extrem. 2015, 7, 8–23. [Google Scholar] [CrossRef] [Green Version]
  19. Mogotsi, K.; Nyangito, M.M.; Nyariki, D.M. The role of drought among agro-pastoral communities in a semi-arid environment: The case of Botswana. J. Arid Env. 2013, 91, 38–44. [Google Scholar] [CrossRef]
  20. Statistics Botswana. Botswana Environment Statistics: Natural Disaster Digest 2017; Ministry of Finance and Development Planning: Gaborone, Botswana, 2018.
  21. Kogan, F.N. Remote sensing of weather impacts on vegetation in non-homogeneous areas. Int. J. Remote Sens. 1990, 11, 1405–1419. [Google Scholar] [CrossRef]
  22. Quiring, S.M.; Ganesh, S. Evaluating the utility of the Vegetation Condition Index (VCI) for monitoring meteorological drought in Texas. Agric. Meteorol. 2010, 150, 330–339. [Google Scholar] [CrossRef]
  23. Singh, R.P.; Roy, S.; Kogan, F. Vegetation and temperature condition indices from NOAA AVHRR data for drought monitoring over India. Int. J. Remote Sens. 2003, 24, 4393–4402. [Google Scholar] [CrossRef]
  24. Dutta, D.; Kundu, A.; Patel, N.R.; Saha, S.K.; Siddiqui, A.R. Assessment of agricultural drought in Rajasthan (India) using remote sensing derived Vegetation Condition Index (VCI) and Standardized Precipitation Index (SPI). Egypt. J. Remote Sens. Sp. Sci. 2015, 18, 53–63. [Google Scholar] [CrossRef] [Green Version]
  25. Liu, W.T.; Kogan, F.N. Monitoring regional drought using the Vegetation Condition Index. Int. J. Remote Sens. 1996, 17, 2761–2782. [Google Scholar] [CrossRef]
  26. Dube, O.P.; Sekhwela, M.B.M. Community Coping Strategies in Semiarid Limpopo Basin Part of Botswana: Enhancing Adaptation Capacity to Climate Change; AIACC: Washington, DC, USA, 2007; Volume 47. [Google Scholar]
  27. Statistics Botswana. Central Bobonong Sub-District Population and Housing Census 2011 Selected Indicators; Ministry of Finance and Development Planning: Gaborone, Botswana, 2015.
  28. Nkemelang, T.; New, M.; Zaroug, M. Temperature and precipitation extremes under current, 1.5 °C and 2.0 °C global warming above pre-industrial levels over Botswana, and implications for climate change vulnerability. Env. Res. Lett. 2018, 13, 065016. [Google Scholar] [CrossRef] [Green Version]
  29. Koohafkan, P.; Stewart, B.A. Drylands, people and land use. In Water and Cereals in Drylands; Food and Agriculture Organization of the United Nations (FAO) and Earthscan: Rome, Italy, 2008; ISBN 184407708X. [Google Scholar]
  30. Dube, O.P.; Sekhwela, M.B.M. Indigenous knowledge, institutions and practices for coping with variable climate in the Limpopo basin of Botswana. In Climate Change and Adaptation; Leary, N., Adejuwon, J., Barros, V., Burton, I., Kulkarni, J., Lasco, R., Eds.; Earthscan: Gaborone, Botswana, 2012; pp. 71–89. ISBN 9781849770750. [Google Scholar]
  31. Costa, J.A.; Rodrigues, G.P. Space-Time Distribution of Rainfall Anomaly Index (RAI) for the Salgado Basin, Ceará State—Brazil. Ciência E Nat. 2017, 39, 627–634. [Google Scholar] [CrossRef] [Green Version]
  32. Reason, C.J.C.; Keibel, A. Tropical Cyclone Eline and Its Unusual Penetration and Impacts over the Southern African Mainland. Weather Forecast. 2004, 19, 789–805. [Google Scholar] [CrossRef]
  33. Mberego, S. Temporal patterns of precipitation and vegetation variability over Botswana during extreme dry and wet rainfall seasons. Int. J. Clim. 2017, 37, 2947–2960. [Google Scholar] [CrossRef]
  34. Nash, D. Changes in Precipitation Over Southern Africa During Recent Centuries. Oxf. Res. Encycl. Clim. Sci. 2017, 1, 1–33. [Google Scholar]
  35. Statistics Botswana Demography Of Botswana, 2015—Botswana Data Portal. Available online: http://botswana.opendataforafrica.org/DEOB2015/demography-of-botswana-2015?tsId=1005100 (accessed on 2 July 2018).
  36. Chaumba, J.; Scoones, I.; Wolmer, W. From jambanja to planning: The reassertion of technocracy in land reform in south-eastern Zimbabwe? J. Mod. Afr. Stud. 2003, 41, 533–554. [Google Scholar] [CrossRef] [Green Version]
  37. UNDP-UNEP PEI. Support to Smallholder Arable Farmers in Botswana: Agricultural Development or Social Protection? Results and Policy Implications from a Poverty and Social Impact Analysis; UNDP-UNEP PEI: Gaborone, Botswana, 2013. [Google Scholar]
Figure 1. Map of Bobirwa sub-district showing study villages.
Sustainability 12 08185 g001
Figure 2. Annual precipitation anomalies from long-term mean annual precipitation during the period: (a) 1980–2015 and (b) 2000–2015.
Sustainability 12 08185 g002
Figure 3. Annual rainfall anomaly index (RAI) for the period 1980–2015.
Sustainability 12 08185 g003
Figure 4. Illustration of the spatial variability and severity of vegetation condition index (VCI)-derived droughts during December to January (DJF) and March to May (MAM) seasons of selected years.
Sustainability 12 08185 g004
Figure 5. (a) Interannual variability in seasonal average VCI and RAI (2000–2015) and (b) seasonal variability in average VCI (2000–2015).
Sustainability 12 08185 g005
Figure 6. Spatial variability in normalized difference vegetation index (NDVI) maximum value composite (MVC) for each pixel in Bobirwa during selected drought years: (a) maximum NDVI in 2002; (b) maximum NDVI in 2005; (c) maximum NDVI in 2008; (d) maximum NDVI in 2012. Data source: Oak Ridge National Laboratory Distributed Active Archive Center.
Sustainability 12 08185 g006
Figure 7. Trends in cultivated rain-fed grain crop yields for Bobirwa sub-district (2009–2016) (a) sorghum; (b) maize; (c) millet; (d) cowpeas. † Equation Y: Linear yield per hectare harvested. † Equation Z: Linear yield per hectare planted. Source: Department of Crop Production, Bobirwa Sub-district (2017).
Sustainability 12 08185 g007
Figure 8. Trends in rain-fed (a) sorghum (b) maize (c) millet (d) cowpeas area planted and area harvested in Bobirwa sub-district (2009–2016). Source: Department of Crop Production, Bobirwa Sub-district (2017).
Sustainability 12 08185 g008
Table 1. Drought spell duration and recurrence between 1980 and 2015.
Drought SpellDuration (Years)Years Since Last Dry Spell
1982–198322
198512
198712
199013
1992–199652
199913
2002–200543
2007–200822
201012
2012–201322
201512
Average1.92.3
Data source: Meteorological Services Department of Botswana.
Table 2. Drought frequency and prevalence based on rainfall anomalies between 1980 and 2015.
5-Year PeriodDrought YearsFrequency5-Year Prevalence (%)10-Year Prevalence (%)
1981–19851982–1983; 198536050
1986–19901987; 1990240
1991–19951992–199548060
1996–20001996; 1999240
2001–20052002–200548070
2006–20102007–2008; 2010360
2011–20152012–2013; 2015360--
Average3360--
Data source: Meteorological Services Department of Botswana.
Table 3. Drought frequency and prevalence based on rainfall anomalies between 2000 and 2015.
PeriodFrequencyPrevalence (%)10-Year PeriodFrequencyPrevalence (%)
2001–20054802001–2010770
2006–2010360
2011–20154802011–2020--
Average3.773.3Average--
Data source: Meteorological Services Department of Botswana.
Table 4. Classification of drought and non-drought years based on the rainfall anomaly index.
RAIOccurrenceDescription
≥3.002000Extremely wet
2.00 to 2.99NoneVery wet
1.00 to 1.991981; 2006Moderately wet
0.50 to 0.991986; 1988; 1989; 1997; 2009; 2011Slightly wet
−0.49 to 0.491980; 1984; 1985; 1987; 1990; 1991; 1992; 1996; 1998; 2001; 2008; 2010; 2014Near normal
−0.99 to −0.502004; 2013Slightly dry
−1.99 to −1.001995; 2003; 2007; 2012Moderately dry
−2.99 to −2.001982; 1983; 1993; 1999; 2002; 2005Very dry
≤−31994; 2015Extremely dry

