Simulated Soil Organic Carbon Density Changes from 1980 to 2016 in Shandong Province Dry Farmlands Using the CENTURY Model

1
School of Geomatics, Anhui University of Science and Technology, 168 Taifeng Road, Huainan 232001, China
2
School of Geography and Engineering of Land Resources, Yuxi Normal University, 134 Fenghuang Road, Yuxi 653100, China
3
School of Information Engineering, Jiangsu Vocational College of Agriculture and Forestry, 19 E. Wenchang Road, Jurong 212400, China
*
Author to whom correspondence should be addressed.
Sustainability 2020, 12(13), 5384; https://doi.org/10.3390/su12135384
Submission received: 26 April 2020
/
Revised: 14 June 2020
/
Accepted: 28 June 2020
/
Published: 3 July 2020
(This article belongs to the Section Environmental Sustainability and Applications)
Abstract
:The changes in cultivated soil organic carbon (SOC) have significant effects on soil fertility and atmospheric carbon dioxide (CO2) concentration. Shandong Province is an important agricultural and grain production area in China. Dry farmland accounts for 74.15% of the province’s area, so studies on dynamic SOC changes would be helpful to understand its contribution to the Chinese national carbon (C) inventory. Using the spatial overlay analysis of the soil layer (1:10,000,000) and the land use layer (1:10,000,000), 2329 dry farmland soil polygons were obtained to drive the CENTURY model to simulate SOC dynamics in Shandong Province from the period 1980 to 2016. The results showed that the CENTURY model can be used to simulate the dry farmland SOC in Shandong Province. From the period 1980 to 2016, the soil organic carbon storage (SOCS) and soil organic carbon density (SOCD) showed an initial increase and then decreased, especially after reaching a maximum in 2009. In 2016, the SOCS was 290.58 × 10⁶ t, an increase of 26.99 × 10⁶ t compared with 1980. SOCD in the dry farmland increased from 23.69 t C ha−1 in 1980 to 25.94 t C ha−1 in 2016. The dry farmland of Shandong Province was a C sink from 1980 to 2016. Among the four soil orders, inceptisols SOCD dominated, and accounted for 47.81% of the dry farmland, followed by >entisols > vertisols > alfisols. Entisols SOCD growth rate was the highest (0.23 t C ha−1year−1). Compared to 1980, SOCD in 2016 showed an increasing trend in the northeast, northwest and southeast regions, while it followed a downward trend in the southwest.
1. Introduction
According to the fifth report of the Intergovernmental Panel on Climate Change (IPCC), climate warming is evident [1]. The causes of global warming are diverse, such as the burning of large amounts of fossil fuels and industrial production. With increased global warming, a series of related problems have arisen, such as the accelerated melting of polar glaciers, rising sea levels, reduced global freshwater resources, and reduced crop production [2,3]. Therefore, how to mitigate global warming has become an important issue in related fields. The rational use and management of agricultural soil is an effective way to alleviate climate warming [4,5]. It is believed that a large amount of C is stored in the soil, and its activity may affect atmospheric CO2 concentration. However, although soil is an important C source for atmospheric CO2, historical studies show that land use reduces SOC by 4.1 × 10¹⁰ t–5.5 × 10¹⁰ t [6], and global soil erosion has resulted in an SOC loss of 1.3 × 10⁹ t C year−1 [7]. Sornpoon et al. [8] studied the effect of burning management on SOC stock in Thailand agricultural lands. They found that farmland SOC increased at the rate of 1.37 t C ha−1 year−1 for five consecutive years without burning treatment, while the SOCS of 0–30 cm in sugarcane fields with burning treatment decreased by about 15%. Agricultural management measures also affect soil CO2 emissions and absorption rates through soil water dynamics and soil C cycling. The use of higher organic amendments will increase soil CO2 emissions [9]. Conversely, soil can be an important C pool for atmospheric CO2. The second IPCC report predicts that, in the next 50–100 years, the global C sequestration potential of farmland is about 2.0 × 10¹⁰ t–3.0 × 10¹⁰ t [10]. Mathew et al. [11] showed that global crops can absorb 4.5 t C ha−1 year−1 from the atmosphere, of which 7% of C is transferred to the soil. Ardo et al. [12] estimated that the C sequestration potential of cropland in the semi-arid area of Sudan from 2000 to 2100 was 0.94 t C ha−1 based on the CENTURY model. Under reasonable land use and management, the soil can fix a large amount of C, which is conducive to the accumulation of SOC and to slowing climate warming [13,14,15,16,17,18,19].
Soil organic carbon storage (SOCS) studies have been conducted at widely different scales. On a global scale, SOCS ranges from 1195 × 109 to 2946 × 109 t C [20,21,22]. At the national level, the SOCS in China’s terrestrial soil is about 100.118 × 10⁹ t C [23], in contrast to 249 × 109 t C [24] in Canada over roughly the same area. In other areas, the SOCS in forests or pastures in Brazil’s semi-arid regions is about 30 t C ha−1 [25], about 167.2 × 10¹⁰ t C [26] in the arctic permafrost regions, and is about 4.1 × 10⁸ t C [27] in Guangdong Province. Terrestrial ecosystem SOCS in the arid regions of western China is 122.66 × 10⁸ t C [28], in the Sanjiang Plain about 116.128 × 10⁷ t C [29], and in Northeast China farmland it is 1.27 × 10⁹ t C [30].
Using SOC model simulations for dry farmland is an important tool for SOC, so our research focusses on determining the contribution of Shandong dry farmland SOC to the Chinese national C inventory by simulating SOC changes from 1980 to 2016. The CENTURY 4.5 model was initially used to simulate grassland C dynamics, then parameters were modified and increased management measures included, and it was ultimately used in farmland and forest SOC simulation, with extensive research validation over large and small areas. Foreign countries have applied the CENTURY model extensively, for example, the SOCD of forests or pastures in semi-arid regions of Brazil was estimated to be 30 t C ha−1 [25]. The application of the CENTURY model in China is a relatively recent development. It was first used to simulate typical grassland primary productivity and soil organic matter (SOM) evolution in the Xilin River Basin of Inner Mongolia, where model simulations were in good agreement with field measurements [31]. Using the CENTURY model, we simulated temporal and spatial variation in SOC in the Qinghai-Tibet Plateau from the period 1960 to 2002. The dynamics of above-ground carbon and soil surface (0–20 cm) organic carbon were successfully estimated, as the simulated and measured results were in good agreement [32]. Furthermore, the accumulation process of black soil in typical black soil slopes was simulated using the CENTURY model, and simulation results were consistent with measured values [33]. Shen Weijun et al. [34] used the CENTURY model to simulate C and N accumulation in three plantation ecosystems from 1985 to 2100, and the results showed that there was no significant difference between the measured data and the simulation results.
2. Materials and Methods
2.1. Study Area
Our study area was Shandong Province (34°22.9′–38°24.01′ N, 114°47.5′–122°42.3′ E), in the lower reaches of the Yellow River, on the Chinese east coast. It borders Hebei, Henan, Anhui and Jiangsu provinces from north to south (Figure 1). The mountainous area in central Shandong is prominent, the southwest and northwestern areas are flat and low-lying, and undulating hills are in the east. The mountainous hills form a skeleton, into which the plains and basins are intertwined. There are nine types of landform in Shandong Province, including mountains, hills, basins, and inter-montane plains. The plains have the largest area, accounting for about 55% of the province total, and are mainly distributed in southwestern and northwestern Shandong. Shandong Province total land area is 1.58 × 10⁵ km2, running about 420 km from north to south and, at its widest, is about 700 km. In 2017, the total population of the province was 10.06 million. Shandong Province has a warm temperate monsoon climate with an annual average temperature of 11–14 °C. The annual frost-free period increases from the northeast coast to the southwest, sunshine hours are adequate, with an average of 2290–2890 h per year, temperature conditions meet the needs for two crops a year, and average annual precipitation is generally between 550 and 950 mm.
2.2. Study Method
The CENTURY 4.5 model was used to simulate SOCD and SOCS changes in dry farmland from 1980 to 2016. This model was originally developed by Parton et al. (1987) [35], and was used to simulate the dynamic processes of C, nitrogen (N), phosphorus (P), sulfur (S) and other elements in grassland ecosystems. Later, after a series of parameter modifications, it was gradually applied to forest, crop, and savanna ecosystems. The primary uses of the model are as a tool for ecosystem analysis, as a test for data consistency, and as an evaluation tool to study the effects of changes in management and climate on ecosystems.
In the study area, we selected dry farmland soil for our research. Cultivated in Shandong Province, it covers 7.07 × 10⁶ ha, of which 97% is dry farmland [36]. Initially, we extracted 2329 dry farmland soil polygons using spatial overlay analysis of soil and land use layers (1:10,000,000). Additionally, we used data from 186 soil profiles obtained from the second national soil survey data of Shandong Province. The soil profile data included important soil physical and chemical properties, such as soil clay content, SOM, bulk density (BD), and pH. Furthermore, we obtained data from the Chinese National Meteorological Center for 31 climate stations in Shandong Province, including site monthly precipitation, and highest/lowest average temperature. Finally, we acquired data from the Resources and Environmental Scientific Data Center, Chinese Academy of Sciences (RESDC-CAS) on fertilizer and organic fertilizer use, and crop growth status data of 70 sites in Shandong Province, including crop type and site planting area.
Based on the CENTURY 4.5 model, SOC evolution, and soil profile points were simulated. In ArcGIS, soil profile points were correlated with dry farmland soil polygons, and the evolution of SOCD and SOCS in Shandong Province from 1980 to 2016 were obtained.
2.3. Soil Data
Shandong Province dry farmland soils include mainly inceptisols, entisols, alfisols, and vertisols, which account for 47.16, 10.32, 35.02, and 6.95% of the dry farmland soil polygons, respectively. Figure 2 shows the distribution of each soil order. Table 1 includes the physical and chemical properties of the four main soil orders in Shandong Province dry farmland soils [37,38].
2.4. Model Initialization and Parameterization
Model simulation includes four main processes: model parameterization, model initialization, model simulation and result output. The CENTURY model obtains input values through 12 “100” files, each of which contains a certain subset of variables. These 12 “100” files include crop.100, cult.100, fert.100, fire.100, fix.100, graz.100, harv.100, irri.100, omad.100, tree.100, trem.100, <site>.100. Corresponding to regional crop options, farming options, fertilizer usage options, files with fixed parameters mainly related to organic matter, grazing options, fire options, irrigation conditions, organic matter addition options, tree type options, tree removal options and site-specific parameters. Users can create new options or modify the values in the options through the FILE100 program to meet the parameter settings of different research areas [39]. For example, in the fertilizer addition project, the first input is the type of fertilizer (nitrogen fertilizer, phosphate fertilizer, sulfur fertilizer), and the amount of fertilizer (g/m2) input into the soil.
The initialization process of the model is to simulate the state of the soil from the original state to the time when the simulation starts, and prepare for the simulation of the research period. The EVENT 100 program was used to set the event, and it was assumed that the SOC accumulation was only affected by environmental factors, which made the model run for thousands of years. In this study, it was set to 5000 years. The temperate C3 grassland vegetation type and short-term appropriate grazing and combustion management system The C pool reaches equilibrium [40]. From 1000 BC to 1954, the land began to use a small amount of organic fertilizer. From 1955 to 1985, a small amount of chemical fertilizers and organic fertilizers were used in agricultural production, and by adjusting the parameters so that the simulated and measured values until 1980 were similar, it was regarded as completing the initialization process of the CENTURY model. The model simulation flow chart is depicted in Figure 3.
2.5. SOCD Calculation
SOCD was selected as representative of the spatial and temporal distribution characteristics of SOC [41,42]. The SOCD is the SOCS per unit area
where SOCi (g/kg) is the organic carbon content of the ith soil polygons, SOMi (g/kg) is the organic matter content of the ith soil polygons, 0.58 is the coefficient of organic matter content converted to organic carbon content, SOCDi (t C ha−1) is the organic carbon density of the ith soil polygons, BDi (g/cm3) is soil bulk density of the ith soil polygons, and H (cm) is soil depth. The units of the area of the polygons are hectare. We focused on the top 20 cm of the dry farmland soil.
Calculation of SOCS (t = 106 g) is
where Si is the area of the ith soil polygons.
We then calculated the change in soil organic carbon density (ΔSOCD) (t C ha−1)
where SOCD1980 is the soil organic carbon density in Shandong Province in 1980, and SOCD2016 is the soil organic carbon density in Shandong Province in 2016.
2.6. Model Validation
The SOC was simulated at the site with the data of the long-term monitoring point on dry farmland, and the simulated SOC value was obtained from 1986 to 2007. Using the dry farmland simulated SOC value and measured SOC value in the corresponding year to calculated the simulation efficiency (ME) and determination coefficient (R2), to determine the simulation results of the long-term monitoring points in the dry farmland. According to the correlation between the simulated SOC value of the point and the measured SOC value of the point, we determined whether the model was suitable for the study area.
The validation point for dry farmland in Shandong Province was located in Jinan, and Table 2 contains validation point data for Jinan.
The fitting between the SOC measured and simulated values uses the parameters R2 and ME as parameters for evaluating simulation accuracy.
For the ME of the validation point measured value, the parameter is as follows
For the R2 of the validation point measured value, the parameter is as follows
where Pi is the SOC simulation value of the ith dry farmland validation point, Oi is the measured SOC value in the ith dry farmland validation point, and is the average value of the measured SOC value of the dry farmland validation point from the period 1986 to 2007, is the average value of the simulated SOC value of the dry farmland validation point from 1986–2007. ME varies between 0 and 1, and the closer it is to 1, the better the simulation efficiency [43]. The closer the R2 is to 1, the better the fitting effect, and the more realistic the fitting function.
To further verify the applicability of the CENTURY model to SOC simulation in Shandong Province, the study area multi-point measured data in 2000 was used to fit with the model simulation data in 2000, to determine the applicability of the CENTURY model in the region.
In the regional multi-point verification, 39 sample data collected in Lingxian County of Shandong Province in 2000 were used to fit the model simulation data. Table 3 includes the basic point information.
3. Results
3.1. Result of Model Validation
3.1.1. Result of Point Validation
Taking the long-term dry farmland monitoring point in Jinan as a simulation point, relevant input parameters to simulate SOC dynamic changes at that point from 1986 to 2007 were fitted, and the simulated and measured values compared. The correlation analysis between simulated and measured SOCD is depicted in Figure 4.
In Jinan, there is a strong correlation between measured and simulated SOCD (p < 0.01, R2 = 0.722, ME = 0.37, Figure 4), indicating that the CENTURY model simulation value and the verification point data fit well, and the CENRUTY model can be used to simulate SOC evolution in Shandong Province.
3.1.2. Result of Multi-Point Validation
Comparing the measured SOCD data in Ling County in 2000 with the simulated values at corresponding points in 2000, we obtained Figure 5, which shows SOCD simulated and measured values at multiple points.
It was verified that the simulation efficiency of the measured data and the simulated data was 0.688, and the numerical value was between 0 and 1, indicating that the simulation results are reliable. The R2 of multi-point linear fitting is 0.765 in the region, and it shows that the simulated SOC value and the measured SOC value fit well.
3.2. SOC Temporal Changes
From 1980 to 2016 on dry farmland in Shandong Province, SOCD varied greatly among the 2392 soil polygons. Table 4 summarizes the SOCD and related statistics of dry farmland soil polygons in 1980, 1985, 1990, 1995, 2000, 2005, 2010 and 2016.
From 1980 to 2016, the SOCD minimum value initially increased and then declined slightly. Maximum SOCD showed a decreasing trend, from 150.06 t C ha−1 in 1980, to 98.12 t C ha−1 in 2016. Beginning in 1980, average SOCD initially decreased and then increased, before slightly dropping back again in 2016. The differences between maximum and minimum SOCD gradually decline from 145.1 to 92.03 t C ha−1. The annual standard deviation values of SOCD also gradually decreased from 15.11 to 11.89 t C ha−1, indicating that the dispersion of SOCD data in Shandong Province also decreased.
Figure 6 shows SOCD and SOCS changes in Shandong Province from 1980 to 2016. SOCD in dry farmland decreased slightly, plateaued, and after 1990, apart from a slight dip in 2001, increased steadily to a peak until around 2008 of 26.51 t C ha−1. From 2009, SOCD gradually decreased, dropping to 25.94 t C ha−1 in 2016. From 1980 to 2016, SOCS in dry farmland rose from 263.59 to 290.58 × 10⁶ t an increase of 26.99 × 10⁶ t (0.06 t C ha−1 annual rate of increase). Therefore, SOC in the Shandong Province dry farmland was in a dynamic process from 1980 to 2016, generally increasing, and the dry farmland in the Shandong Province was a C sink during 1980 to 2016.
3.3. Temporal Evolution of SOC in Different Soil Orders
SOCD in dry farmland soils across the province was higher in 2016 compared to 1980, where minimum SOCD increased by 0.55 t C ha−1. Maximum SOCD decreased by 52.52 t C ha−1, and variation was relatively small, as indicated by lower standard deviation and variance of SOCD in 2016 than in 1980. Figure 7 shows the ΔSOCD values of four main dry farmland soil orders in Shandong Province in <−10, −10–−5, −5–0, 0–5, 5–10, and >10 t C ha−1 classes.
From Figure 7: In the ΔSOCD range < −10 t C ha−1, inceptisols accounted for the largest number of dry farmland soil polygons (106). For ΔSOCD values from −10 to −5, there are 134 polygons of alfisols and 20 polygons of entisols. In the ΔSOCD range −5–0 t C ha−1, the alfisols accounted for the largest number of dry farmland soil polygons (297), while the inceptisols and entisols followed with 99 and 29, respectively. In the ΔSOCD range from 0 to 5 t C ha−1, the number of alfisols polygons was the highest, with 416. For ΔSOCD of 5–10 t C ha−1, the alfisols and inceptisols accounted for the most, with 180 and 115, respectively. In the ΔSOCD range of >10 t C ha−1, entisols polygons dominated, with 195. Soil polygons of the four main soil orders are mainly distributed in the −5–0, 0–5, 5–10, and >10 t C ha−1 ranges, accounting for 18.55, 30.27, 17.99, and 18.94%, of the total number of dry farmland soil polygons, respectively.
From Figure 8: of the four studied soil orders, inceptisols SOCD was significantly higher than in the other three soil orders. From 1980 to 2016, inceptisols SOCD generally increased, by about 3.10 t C ha−1. From 1980 to 2016, entisols SOCD was the second highest, and displayed an increasing trend, rising by 8.15 t C ha−1, one of the largest increases in SOCD of the four main dry farmland soil orders. Changes in vertisols SOCD were similar to that of entisols, increasing by 6.84 t C ha−1. From 1980 to 2016, alfisols was the only soil order where SOCD decreased, from 23.99 in 1980 to 23.67 t C ha−1 in 2016. It can be known that the SOCD of alfisols decreases at a rate of 0.01 t C ha−1year−1, which is an important factor for the C leakage of dry farmland in Shandong Province. It accounts for 35.02% of the dry farmland area. In the future, dry farmland management in Shandong Province should strengthen the rational use and optimized management of alfisols to promote the transformation of alfisols into C sinks. Using SPSS 22, the SOCD of the four major soil orders was tested by K independent samples non-parametric empirical method, and the p value of the Kruskal–Wallis Test was less than 0.05, so the SOCD of each soil orders exists significant differences. In 2016, the SOCD of the four soil orders in 2016 can be ranked as follows: Inceptisols > entisols > vertisols > alfisols.
3.4. SOC Spatial Variation
Figure 9a shows the spatial distribution of SOCD in dry farmland in Shandong Province in 1980. In 1980, high SOCD occurred in the southwest and a few areas in the northwest, and is due to the concentrated distribution of inceptisols with the highest SOCD. SOCD from 20 to 30 t C ha−1 accounted for 20.06% of the total dry farmland area, and occurred mainly in the northwest and parts of the northeastern coastal areas. SOCD from 10 to 20 t C ha−1 accounted for about half of the dry farmland area, and was mostly concentrated in most parts of the southeast and parts of the northeast. In 1980, there were relatively few dry farmland soils with SOCD < 10 t C ha−1, accounting for only 5.25% of the total dry farmland soil. They were sporadically distributed in the central and southwest regions.
Figure 9b shows the spatial distribution of SOCD in dry farmland in Shandong Province in 2016. Compared to SOCD spatial distribution in 1980, SOCD had increased significantly by 2016. In 2016, SOCD > 30 t C ha−1 were distributed mainly in the southwest, with significant increases in the northwest and a small part of the northeast (4.12% increase compared to 1980). The SOCDs from 20 to 30 t C ha−1, were scattered mainly along the boundary of the province, and their area had increased significantly compared to 1980 (from 20.06% in 1980 to 36.25% in 2016, a relative increase of 16.19%). SOCDs from 10 to 20 t C ha−1 decreased from 53.25% in 1980 to 35.23% in 2016, and were mainly in most of the northwest, in the northeast and southeast, and also in the southwest. Dry farmland SOCDs < 10 t C ha−1 were scattered in a small part of the central and southwest regions, and their area declined compared with 1980.
Figure 9c shows the spatial distribution of the changes in soil organic carbon (ΔSOCD) in dry farmland of Shandong Province from 1980 to 2016. ΔSOCD was divided into <−5, −5–0, 0–5, or >5 t C ha−1. Firstly, the dry soils with ΔSOCD < −5 t C ha−1 were mainly distributed in the southwest and northwest regions, accounting for 8.04% of the total farmland soil. Those from −5–0 t C ha−1 were mainly distributed in the southwest, and coastal and other parts of the northeast, and accounted for 26.44% of the total. A large proportion of dry farmland was covered by soils from 0 to 5 t C ha−1 (31.95%), primarily distributed in the northeast, in parts of the northwest and southeast, and also a small distribution in the southwest of Shandong Province. The area of ΔSOCD with >5 t C ha−1 was 33.57%, mainly distributed in the northwest and southeast regions, with small distributions in the southwest and northeast.
4. Discussion
Applying the CENTURY model, we simulated SOCD and SOCS evolution in dry farmland from 1980 to 2016 in Shandong Province. Research initiatives, however, often have certain limitations and uncertainties, and our study is no different.
Firstly, the study is limited to dry farmlands and is based on soil polygons superimposed onto the land use and soil layers. It did not fully consider land use change caused by other factors, such as the acceleration of urbanization in recent years. This is mainly because the article calculates the SOCD and SOCS of dry farmland, using dry farmland soil polygons as the basic simulation unit. If the land use and soil layers in different years are superimposed to obtain the corresponding simulated basic unit, multiple simulations are required. This will bring a lot of work, and the corresponding verification data are also lacking. It is difficult to estimate the spatial changes in SOCD and SOCS based on years of land use.
Secondly, the CENTURY model itself has certain deficiencies. For example, it uses monthly and annual steps, so simulated crop growth is relatively long, whereas actual growth and changes in biomass occur at much finer time scales [40]. To overcome deficiencies in the model, it could be improved accordingly, for example, by reducing the simulation step size, increasing the amount of simulation calculation, and obtaining more accurate simulation results. Bista et al. [44] used the DayCENT model to simulate the changes in soil organic carbon under various management conditions, and showed that between 1931 and 2080, the conventional dry wheat winter–summer fallow system lost 8.66 × 10⁴ –21.92 × 10⁴ t C ha−1 of SOCD. Furthermore, the model also has certain operational problems. For example, in 2011, Maren Oelbermann et al. [45] evaluated the SOCS of 19-year-old tropical and 13-year-old temperate alley and single crops using the CENTURY model, but SOC simulated values were lower than measured values because the model failed to account for change in soil BD. Silver et al. [46] used field data and the CENTURY model to estimate reserves of underground C in highly weathered soils in Amazonian forests. They found that simulated SOCD of sandstone was half that of clay, but the measured values indicated that it was 89% of the clay SOCD. Therefore, incorporating initial SOCD and soil clay content into the model input parameters is important for reducing simulation uncertainty [47].
Next, under the current dry farmland management measures in Shandong Province, the soil appears as a C sink. However, the study did not fully consider the greenhouse gas emissions caused by management measures. Studies show that greenhouse gas leakages can offset −241–660% of the benefits of soil C sequestration [48]. For example, returning straw to the field has been vigorously promoted in Shandong Province. In this study, returning straw to the field in Shandong Province increased SOCS, but some studies have suggested that returning straw to the field may not necessarily increase SOC. Even if C content increased, methane produced by returning straw to the field might be discharged into the atmosphere, greatly offsetting the benefits of soil C sequestration [49,50,51]. Therefore, when considering the impact of management measures on soil C sequestration, the impact of greenhouse gas emissions from management measures should be fully considered.
Then, adequate model simulation requires the input of appropriate and accurate data for parameters such as climate, soil texture, soil management measures, and so on. These data are often difficult to obtain, and may not even exist, especially for long time periods. Furthermore, the data itself may have inaccuracies in the measurement method, which also increases the uncertainty of the model simulation.
Finally, the calculation of SOC will also bring uncertainty to the research. Liang et al. [52] show that the calculation of China’s terrestrial SOCS is also affected by different estimation methods. The difference stems from different SOCD values, different soil depths, calculation formulas, basic data, and different mapping scales. The resulting estimation uncertainty is approximately 25.5–30.4%.
Based on the above research uncertainties, the following prospects can be made for future research. Using the Daycent model, the regional SOC was simulated, using GIS digital soil maps, a 1 m soil depth, and no gravel larger than 2 mm. For the SOCD content calculation formula, you can try to measure SOC density by remote sensing spectrum for model verification [53,54,55,56].
It is instructive to compare our results with other studies, to highlight reasons for the differences between the studies. We showed that SOCS in dry farmland (0–20 cm) in Shandong Province is about 290.58 × 10⁶ t, or about 0.29% of the national SOCS [23], and 2.88% of the SOCS of dry farmland in China [57], which is less than the estimated surface SOCS in Shandong Province (350.65 × 10⁶ t) by Dai [58]. These differences maybe, in part, due to differences in the scope of the two studies. The SOCD of dry farmland (0–20 cm) in Shandong Province is 25.94 t C ha−1, which is less than the average value (29.00 t C ha−1) estimated by Liu et al. [47]. The two study research methods were the same, but the research objectives differed, focused on dry farmland soil in our study, and all soils in Shandong Province in Liu’s research. Other differences may be caused by other soils or different research methods. For example, our average SOCD was greater than the 22.20 t C ha−1 estimated by Dai et al. [59] for surface SOCD in Shandong Province.
Compared with other regional studies, SOCD in the surface soil of dry farmland in Shandong Province is lower than the national average value of 105.3 t C ha−1 [60], 48.6 t C ha−1 in the arid region in western China [28], 33.3 t C ha−1 in Guangxi Province [61] and 74.6 t C ha−1 in Henan Province [62], but similar to the average of 29.29 t C ha−1 in western Chongqing [63]. Therefore, the relatively low SOCD in dry farmland soils in Shandong Province also means that the study area has huge soil C sequestration potential.
SOCD comparisons of dry farmland with the SOCD of other land uses. The main land use type in Shandong Province is dry farmland, and there are relatively few studies on SOC for other land uses. Therefore, we compared the dry farmland SOC in Shandong Province with the land use types in other regions.
Xie et al. [57] found that China’s paddy field SOCD was 97.6 t C ha−1 in 1980, which is much higher than that of dry farmland soil in Shandong Province. Wen et al. [64] found paddy field SOCD of 46.21 t C ha−1 in northern Guangdong. Ma et al. [65] estimated that the paddy field SOCD in Taoyuan County is 43.5 t C ha−1. However, Xu et al. [66] found that the SOCD of paddy soil in Anhui Province was (19 ± 4.91) t C ha−1, which is lower than that of dry farmland soil in this study. The SOCD of woodlands and forests is usually higher than that of dry farmland soil. The SOCD of eucalyptus, Taxodiaceae and Masson pine plantations in South China was 32.9, 36.0, and 38.6 t C ha−1, respectively [67]. The average SOCD of the forests in the northeast region is 217.8 t C ha−1 [68]. Yang et al. [69] estimated that the SOCD of the soil in Ziwuling forest area of Loess Plateau is 105.2 t C ha−1. Grassland SOCD in different areas varies greatly, and the contemporary grassland SOCD in Inner Mongolia is 19.9 t C ha−1 [70]. There are also 299.7 t C ha−1 of SOCD in the source region of the Yellow River [71].
We found that SOCD and SOCS in Shandong Province showed an initial increasing trend, and then slowly decreased from 1980 to 2016. The SOCD decrease from 26.47 t C ha−1 in 2009 to 25.94 t C ha−1 in 2016 is noteworthy and may be explained in the following way: firstly, the input of external SOM had continued to increase in the previous period, but the external SOM input after 2009 did not increase, resulting in greater SOM decomposition than the accumulation of SOC; and secondly, with time, mechanized farming in Shandong Province continues to rise. The main dry farming crops have a mechanical harvesting yield of more than 90% [72], but the quality of mechanized farming is poor, leading to greater soil destruction and accelerated SOC decomposition.
5. Conclusions
Although we show that, from 1980 to 2016, the dry farmland in Shandong Province was generally a C sink (26.99 × 10⁶ t C), the changing SOCD and SOCS trends suggest that, under existing management measures, climatic conditions, etc., remain unchanged, it will be converted into a C source. Therefore, corresponding changes should be made to increase the input of external organic matter, including the amount of organic fertilizer that was applied, increasing the amount of straw returned to the field, and adopting conservation tillage.
The four main soil orders in Shandong Province, ranked by the size of the area covered, can be ranked as: Inceptisols > alfisols > entisols > vertisols. However, based on SOCD they are ranked as: inceptisols > entisols > vertisols > alfisols. Inceptisols contribute the most to the SOC in dry farmland of Shandong Province, and there are significant differences in SOCD among various soil orders.
SOCD gradually increases from the northeastern coast to the inland southwest. In 1980, dry farmland SOCD of Shandong Province was >30 t C ha−1, and mainly concentrated in the southwest and small parts of the northwest, except for some small coastal areas. Compared with 1980, the SOCD in Shandong Province increased significantly in 2016, especially in the west and in coastal areas. Dry farmland SOCD > 30 t C ha−1 were mainly concentrated in the southwest and northwest, while those in the range of 20–30 t C ha−1 were mainly distributed in the northwest. Declines in SOCD were concentrated mainly in the southwest, although here SOCD was initially higher. The SOCD area increased significantly.
The area with reduced SOCD accounted for 34.48% of the dry farmland area in Shandong Province, and the range of reduced SOCD was mainly concentrated from −5 to 0 t C ha−1 (26.44%). The soils with ΔSOCD in the range of 0–5 and >5 t C ha−1 accounted for 31.95% and 33.57% of the dry farmland area, respectively.
Author Contributions
M.T., S.W., M.Z., F.Q. and X.L. contributed equally to the research and drafting of this paper. All authors have read and agreed to the published version of the manuscript.
Funding
This research was funded by Natural Science Foundation of China, grant numbers 31700369, 31800358 and 41807081, respectively.
Conflicts of Interest
The authors declare no conflict of interest.
References
- Han, R.Q.; Zhen, D.; Dai, E.F.; Wu, S.H.; Zhao, M.H. Response of production potential to climate fluctuation in major grain regions of China. Resour. Sci. 2014, 36, 2611–2623. [Google Scholar]
- Zhang, A.H. The impact of global warming on world agriculture. Guangdong Canye 2016, 50, 10–11. [Google Scholar]
- Jin, D.X. Climate warming and its impact on agriculture. Environ. Prot. 1992, 8, 32–34. [Google Scholar]
- Yang, X.M. Using agricultural soils to fix organic carbon—Alleviating global warming and improving soil productivity. Soil Environ. Sci. 2000, 9, 311–315. [Google Scholar]
- Yang, X.M.; Zhang, X.P.; Fang, H.J. The significance of carbon sequestration in agricultural soils to alleviate global warming. Sci. Geogr. Sin. 2003, 23, 101–106. [Google Scholar]
- Intergovernmental Panel on Climate Change. Climate Change 1995: Impact, Adaptation and Mitigation: Scientific Technical Analyses; Working Group 1; Cambridge University Press: Cambridge, UK, 1996. [Google Scholar]
- Lal, R. Soil erosion and gaseous emissions. Appl. Sci. 2020, 10, 2784. [Google Scholar] [CrossRef] [Green Version]
- Sornpoon, M.; Bonnet, S.; Garivait, S. Effect of open burning on soil carbon stock in sugarcane plantation in Thailand. World Acad. Sci. Eng. Technol. 2014, 8, 822–827. [Google Scholar]
- Ray, R.L.; Griffin, R.W.; Fares, A.; Elhassan, A.; Awal, R.; Woldesenbet, S.; Risch, E. Soil CO2 emission in response to organic amendments, temperature, and rainfall. Sci. Rep. 2020, 10, 5849. [Google Scholar] [CrossRef] [Green Version]
- Cole, C.V.; Wastion, R.T.; Zinyowera, M.C.; Moss, R.H. Agriculture Options for Mitigation of Greenhouse Gas Emission. Climate Change 1995: Impacts, Adaptations and Mitigation of Climate Change: Intergovernmental Panel on Climate Change; Cambrige University Press: Cambrige, UK, 1996; pp. 1–27. [Google Scholar]
- Mathew, I.; Shimelis, H.; Mutema, M.; Minasny, B.; Chaplot, V. Crops for increasing soil organic carbon stocks—A global meta analysis. Geoderma 2020, 367, 114230. [Google Scholar] [CrossRef]
- Ardö, J.; Olsson, L. Assessment of soil organic carbon in semi-arid Sudan using GIS and the CENTURY model. J. Arid Environ. 2003, 54, 633–651. [Google Scholar] [CrossRef]
- Zhang, D.J.; Zong, J.J.; Ma, J.H.; Yang, X.Q.; Hu, X.; Xu, S. The influence of wheat maize annual cultivation mode and increasing application of organic fertilizer on soil organic carbon pool and greenhouse gas emission of summer maize. Ecol. Environ. Sci. 2019, 28, 1927–1935. [Google Scholar]
- Zhang, D.J.; Wang, Y.J.; Chen, Q.Q.; Yang, X.Q.; Zong, J.Q.; Li, C.X. Effects of different cultivation methods and increased application of organic fertilizer on soil organic carbon pool and wheat yield in wheat field. Jiangsu Agric. Sci. 2019, 47, 128–133. [Google Scholar]
- Liu, S.J.; Zhang, H.P.; Li, T.; Shen, L.Y.; Xu, C.Y.; Han, J. Effects of Farming Methods on Soil Characteristics and Winter Wheat Yield in Northwest Dryland Farmland. A Cta A Gricult. Boreali-Occident. Sin. 2019, 28, 1411–1418. [Google Scholar]
- Mohamed, L.S. Effects of Tillage and Straw Returning on Yield and Greenhouse Gas Emissions of Double Cropping Rice; Chinese Academy of Agricultural Sciences: Beijing, China, 2018. [Google Scholar]
- Meki, M.N.; Kemanian, A.R.; Potter, S.R.; Bumenthal, J.M.; Williams, J.R.; Gerik, T.J. Cropping system effects on sorghum grain yield, soil organic carbon, and global warming potential in central and south Texas. Agric. Syst. 2013, 117, 19–29. [Google Scholar] [CrossRef]
- Adviento-Borbe, M.A.A.; Haddix, M.L.; Binder, D.L.; Walters, D.T.; Dobermann, A. Soil greenhouse gas fluxes and global warming potential in four high-yielding maize systems. Glob. Chang. Biol. 2007, 13, 1972–1988. [Google Scholar] [CrossRef]
- Wang, H.; Ren, T.; Yang, H.; Feng, Y.Q.; Liu, G.S.; Yin, Q.Y.; Shi, H.Z. Research and application of biochar in soil CO2 emission, fertility, and microorganisms: A sustainable solution to solve China’s agricultural straw burning problem. Sustainability 2020, 12, 1922. [Google Scholar] [CrossRef] [Green Version]
- Wang, K.F. Coupling Development of Triple-Microbe Model and Its Simulation of Global Soil Organic Carbon and Microbial Carbon; Northwest A&Forestry University: Shaanxi, China, 2017. [Google Scholar]
- Bohn, H.L. Estimate of organic carbon in world soils. Soil Sci. Soc. Am. J. 1982, 46, 1118–1119. [Google Scholar] [CrossRef]
- Jobbágy, E.G.; Jackson, R.B. The vertical distribution of soil organic carbon and its relation to climate and vegetation. Ecol. Appl. 2000, 10, 423–436. [Google Scholar] [CrossRef]
- Wang, S.Q.; Zhou, C.H. Estimating soil organic carbon reservior of terrestrial ecosystem in China. Geogr. Res. 1999, 18, 349–356. [Google Scholar]
- Ye, M.X.; Zhao, S.D.; Liu, D. Research state of soil carbon cycling in terrestrial ecosystem. Chin. J. Ecol. 1999, 18, 29–351. [Google Scholar]
- Althoff, T.D.; Menezes, R.S.C.; Pinto, A.D.S.; Pareyn, F.G.C.; Carvalho, A.L.D.; Martins, J.C.R.; Carvalho, E.X.D.; Silva, A.S.A.D.; Dutra, E.D.; Sampaio, E.V.D.S.B. Adaptation of the CENTURY model to simulate C and N dynamics of Caatinga dry forest before and after deforestation. Agric. Ecosyst. Environ. 2018, 254, 26–34. [Google Scholar] [CrossRef]
- Tarnocai, C.; Canadell, J.G.; Schuur, E.A.G.; Kuhry, P.; Mazhitova, G.; Zimov, S. Soil organic carbon pools in the Northern Circumpolar permafrost region. Glob. Biogeochem. Cycles 2009, 23, 1–11. [Google Scholar] [CrossRef]
- Luo, W.; Zhang, H.H.; Chen, J.J.; Liu, Y.; Li, D.Q. Storage and spatial distribution of soil organic carbon in Guangdong Province. Ecol. Environ. Sci. 2018, 27, 1593–1601. [Google Scholar]
- Zhang, J.; Lin, M.; Ao, Z.Q. Estimation of soil organic carbon storage in arid areas of Western China. J. Arid Area Resour. Environ. 2018, 32, 132–137. [Google Scholar]
- Yang, A.G.; Miao, Z.H.; Qiu, F.F.; Yang, Q.C.; Wang, Z.M.; Mao, D.H. Estimation and spatial distribution of organic carbon storage in topsoil of Sanjiang Plain based on GIS. Bull. Soil Water Conserv. 2015, 35, 155–158. [Google Scholar]
- Han, B.; Wang, X.K.; Ou, Y.Z.Y. Distribution and change of agro-ecosystem carbon pool in Northeast of China. Chin. J. Soil Sci. 2004, 35, 1140–1147. [Google Scholar]
- Xiao, X.M.; Wang, Y.F.; Chen, Z.Z. Dynamics of primary productivity and soil organic matter of typical steppe in the Xilin River Basin of Inner Mongolia and their responses to climate change. J. Integr. Plant Biol. 1996, 38, 45–52. [Google Scholar]
- Zhang, Y.Q.; Tang, Y.H.; Jiang, J. Dynamic characteristics of soil organic carbon in grassland ecosystems of the Qinghai-Tibet Plateau. Sci. Sin. 2006, 36, 1140–1147. [Google Scholar]
- Fang, H.J.; Yang, X.M.; Zhang, X.P.; Shen, Y. Simulation on dynamic of soil organic carbon under the effect of tillage and water erosion. Acta Pedol. Sin. 2006, 43, 730–735. [Google Scholar]
- Shen, W.J.; Peng, S.L.; Wu, J.G.; Lin, Y.B. Simulation studies on carbon and nitrogen accumulation and its allocation pattern in forest ecosystems of Heshan in low subtropical China. J. Trop. Subtrop. Bot. 2003, 27, 690–699. [Google Scholar]
- Parton, W.J.; Schimel, D.S.; Cole, C.V.; Ojima, D.S. Analysis of factors controlling soil organic matter levels in Great Plains Grasslands. Soil Sci. Soc. Am. J. 1987, 51, 1173–1179. [Google Scholar] [CrossRef]
- Yang, R.G.; Bi, J.J.; Zhang, Y.H.; Xing, J.Z.; Hao, L.C. Agricultural drought trend in Shandong Province and development of agricultural technology in dry farmland. Anhui Agric. Sci. Bull. 2007, 13, 44–45. [Google Scholar]
- Shi, X.Z.; Yu, D.S.; Sun, W.X.; Wang, H.J.; Zhao, Q.G.; Gong, Z.T. Reference benchmark study of soil classification system between China and the United States: Reference between soil types and soil classification of the American system classification. Chin. Sci. Bull. 2004, 49, 1299–1303. [Google Scholar]
- Zhang, S.H.; Peng, G.B.; Huang, M. The Feature extraction and data fusion for regional soil texture based on GIS techniques. Clim. Environ. Res. 2004, 9, 65–79. [Google Scholar]
- Metherell, A.K.; Harding, L.A.; Cole, C.V.; Parton, W.J. CENTURY Soil Organic Matter Model Environment; Version 4.0; United States Department of Agriculture, Agricultrual Research Service: Fort Collins, CO, USA, 1993; pp. 69–77. Available online: https://www2.nrel.colostate.edu/projects/century/MANUAL/html_manual/man96.html (accessed on 3 July 2020).
- Yu, S.S.; Dou, S.; Yang, J.M. Application of central model in soil organic carbon research. Soils Crop. 2014, 3, 10–14. [Google Scholar]
- Soil Survey Staff, Soil Survey Laboratory Information Manual; Version 2.0. USDA-NRCS; Soil Survey Investigations Report NO.45; U.S. Government Publishing Office: Washington, DC, USA, 2011; pp. 235–253.
- Fang, J.Y.; Liu, G.H.; Xu, S.L. Carbon pools of terrestrial ecosystems in China. In Greenhouse Gas Concentration and Emission Monitoring and Related Processes; Wang, G.C., Wen, Y.P., Eds.; China Environmental Science Press: Beijing, China, 1996; pp. 102–128. [Google Scholar]
- Foereid, B.; Barthram, G.T.; Marriott, C.A. The CENTURY model failed to simulate soil organic matter development in an acidic grassland. Nutr. Cycl. Agroecosyst. 2007, 78, 143–153. [Google Scholar] [CrossRef]
- Bista, P.; Machado, S.; Ghimire, R.; Grosso, S.J.D.; Reyes-Fox, M. Simulating soil organic carbon in a Wheat–Fallow System using the Daycent model. Agron. J. 2016, 108, 2554–2565. [Google Scholar] [CrossRef]
- Maren Oelbermann, R.P. An evaluation of the CENTURY model to predict soil organic carbon: Examples from Costa Rica and Canada. Agrofor. Syst. 2011, 82, 37–50. [Google Scholar] [CrossRef]
- Silver, W.L.; Neff, J.; McGroddy, M.; Veldkamp, E.; Keller, M.; Cosme, R. Effects of soil texture on belowground carbon and nutrient storage in a lowland Amazonian forest ecosystem. Ecosystems 2000, 3, 193–209. [Google Scholar] [CrossRef]
- Liu, X.Y.; Zhao, Y.C.; Shi, X.Z.; Wang, S.H.; Yu, D.S. Uncertainty in CENTURY-modelled changes in soil organic carbon stock in the uplands of Northeast China, 1980–2050. Nutr. Cycl. Agroecosyst. 2019, 113, 77–93. [Google Scholar] [CrossRef]
- Wu, F.; Wang, X.K.; Han, B.; Ouyang, Z.Y.; Zheng, H. Greenhouse gas leakage and net emission reduction potential of carbon sequestration measures in farmland soils. Acta Ecol. Sin. 2009, 29, 4993–5006. [Google Scholar]
- Lu, F.; Wang, X.K.; Han, B.; Ouyang, Y.Z.; Zheng, H. Researches on the greenhouse gas leakage and net mitigation potentials of soil carbon sequestration measures in croplands. Acta Ecoiogica Sin. 2009, 29, 4993–5003. [Google Scholar]
- Wu, F.; Wang, X.K.; Han, B.; Ouyang, Z.Y.; Zheng, H. Returning straw from paddy field to soil: Carbon sequestration in soil and increased methane emission. Chin. J. Appl. Ecol. 2010, 21, 99–108. [Google Scholar]
- Li, C.; Frolking, S.; Butterbach-Bahl, K. Carbon sequestration in arable soils is likely to increase nitrous oxide emissions, offsetting reductions in climate radiative forcing. Clim. Chang. 2005, 72, 321–338. [Google Scholar] [CrossRef]
- Dai, R.J.; Pang, X.G.; Dong, J.; Wang, Z.H.; Yu, C. Soil organic carbon pool and temporal variation characteristics in Shandong Province. Geoscience 2017, 31, 386–393. [Google Scholar]
- Liang, E.; Cai, D.X.; Zhang, D.C.; Dai, K.; Feng, Z.H.; Liu, S.; Wang, Y.; Wang, X.B. Terrestrial soil organic carbon storage in China: Estimated and uncertainty. Soil Fertil. Sci. China 2010, 6, 75–79. [Google Scholar]
- Safanelli, J.L.; Chabrillat, S.; Ben-Dor, E.; Demattê, J.A.M. Multispectral Models from Bare Soil Composites for Mapping Topsoil Properties over Europe. Remote Sens. 2020, 12, 1369. [Google Scholar] [CrossRef]
- Gholizadeh, A.; Saberioon, M.; Rossel, R.A.V.; Boruvka, L.; Klement, A. Spectroscopic measurements and imaging of soil colour for field scale estimation of soil organic carbon. Geoderma 2020, 357, 113972. [Google Scholar] [CrossRef]
- Wang, S.; Zhuang, Q.; Jin, X.; Yang, Z.; Liu, H. Predicting soil organic carbon and soil nitrogen stocks in topsoil of forest ecosystems in Northeastern China using remote sensing data. Remote Sens. 2020, 12, 1115. [Google Scholar] [CrossRef] [Green Version]
- Taghizadeh-Mehrjardi, R.; Schmidt, K.; Amirian-Chakan, A.; Rentschler, T.; Zeraatpisheh, M.; Sarmadian, F.; Valavi, R.; Davatgaar, N.; Behrens, T.; Scholten, T. Improving the spatial prediction of soil organic carbon content in Ttwo contrasting climatic regions by stacking machine learning models and rescanning covariate space. Remote Sens. 2020, 12, 1095. [Google Scholar] [CrossRef] [Green Version]
- Xie, Z.B.; Zhu, J.G.; Liu, G.; Cadisch, G.; Hasegawa, T.; Chen, C.M.; Sun, H.F.; Tang, H.Y.; Zeng, Q. Soil organic carbon stocks in China and changes from 1980s to 2000s. Glob. Chang. Biol. 2007, 13, 1989–2007. [Google Scholar] [CrossRef]
- Dai, R.J.; Pang, X.G.; Zeng, X.D.; Wang, H.J. Soil carbon density and distribution and influencing factors in Shandong Province. Res. Environ. Sci. 2015, 28, 1449–1458. [Google Scholar]
- Wang, S.Q.; Zhou, C.H.; Li, K.R.; Zhu, S.L.; Huang, F.H. Analysis on spatial distribution characteristics of soil organic carbon reservoir in China. Acta Geogr. Sin. 2000, 55, 533–544. [Google Scholar]
- Chen, X. Estimation of soil organic carbon reserves in Guangxi and comparison study with some provinces in China. Sci. Geogr. Sin. 2014, 34, 1247–1253. [Google Scholar]
- Yu, J.J.; Yang, F.; Wu, K.N.; Li, L.; Lu, Q.L. Soil organic carbon storage and its spatial distribution in Henan Province. Chin. J. Appl. Ecol. 2008, 19, 1058–1063. [Google Scholar]
- Bao, L.R.; Yan, M.S.; Jia, Z.M.; Gong, Y.Y. The distribution of surface soil organic carbon storage and density in western Chongqing. Geophys. Geochem. Explor. 2015, 39, 180–185. [Google Scholar]
- Wen, Y.; Deng, N.R.; Liu, X.N.; Cheng, J.; Wei, J.B. Variations of soil organic carbon of cropland topsoil in mountain area of northern Guangdong over 25 year. Ecol. Environ. Sci. 2011, 20, 1247–1252. [Google Scholar]
- Ma, B.; Zhou, P.; Tong, C.L.; Xiao, H.A.; Yang, Y.C.; Wu, J.S. Change in soil organic carbon with different land uses in subtropical hilly red soil region. Res. Agric. Mod. 2017, 38, 176–181. [Google Scholar]
- Xu, X.W.; Pan, G.X.; Sun, X.L.; Xue, F. Changing characteristics and sequestration of farmland topsoil organic carbon in Guichi County Anhui Province. J. Agro-Environ. Sci. 2009, 28, 2551–2558. [Google Scholar]
- Fang, J.Y.; Chu, S.S.; Wang, J.; Wu, D.M.; Mo, Q.F.; Gao, J.; Lin, J.H.; Zeng, S.C. Soil organic carbon density and its relationship with soil physical properties of typical plantations in South China. J. South China Agric. Univ. 2018, 39, 83–90. [Google Scholar]
- Zhao, J.F.; Yan, X.D.; Jia, G.S. Simulation of carbon stocks of forest ecosystems in Northeast China 1981–2002. Chin. J. Appl. Ecol. 2009, 20, 241–249. [Google Scholar]
- Yang, X.M.; Cheng, J.M.; Meng, L.; Han, J.J. Features of soil organic carbon storage and vertical distribution in different forests. Chin. Agric. Sci. Bull. 2010, 26, 132–135. [Google Scholar]
- Guo, L.H.; Gao, J.B.; Wu, S.H.; Hao, C.Y.; Zhao, D.S. Spatial-temporal change of soil organic carbon and its susceptibility to climate change in Inner Mongolia Grassland 1981–2010. Res. Environ. Sci. 2016, 29, 1050–1058. [Google Scholar]
- Zeng, Y.N.; Feng, Z.D.; Cao, G.C.; Xue, L. Soil organic carbon storage and distribution characteristics of alpine grassland in the source region of the Yellow River. Acta Geogr. Sin. 2004, 59, 497–504. [Google Scholar]
- Li, K.P.; Zhao, H.; Hou, X.W.; Jian, S.C.; Ma, G.Z. Situation analysis and counter measures research on the agricultural mechanization development in Shandong Province. J. Chin. Agric. Mech. 2018, 39, 97–100. [Google Scholar]
Figure 1.
Shandong Province study site location in China, indicating weather stations, dry farmland validation points and soil profile locations.
Figure 1.
Shandong Province study site location in China, indicating weather stations, dry farmland validation points and soil profile locations.
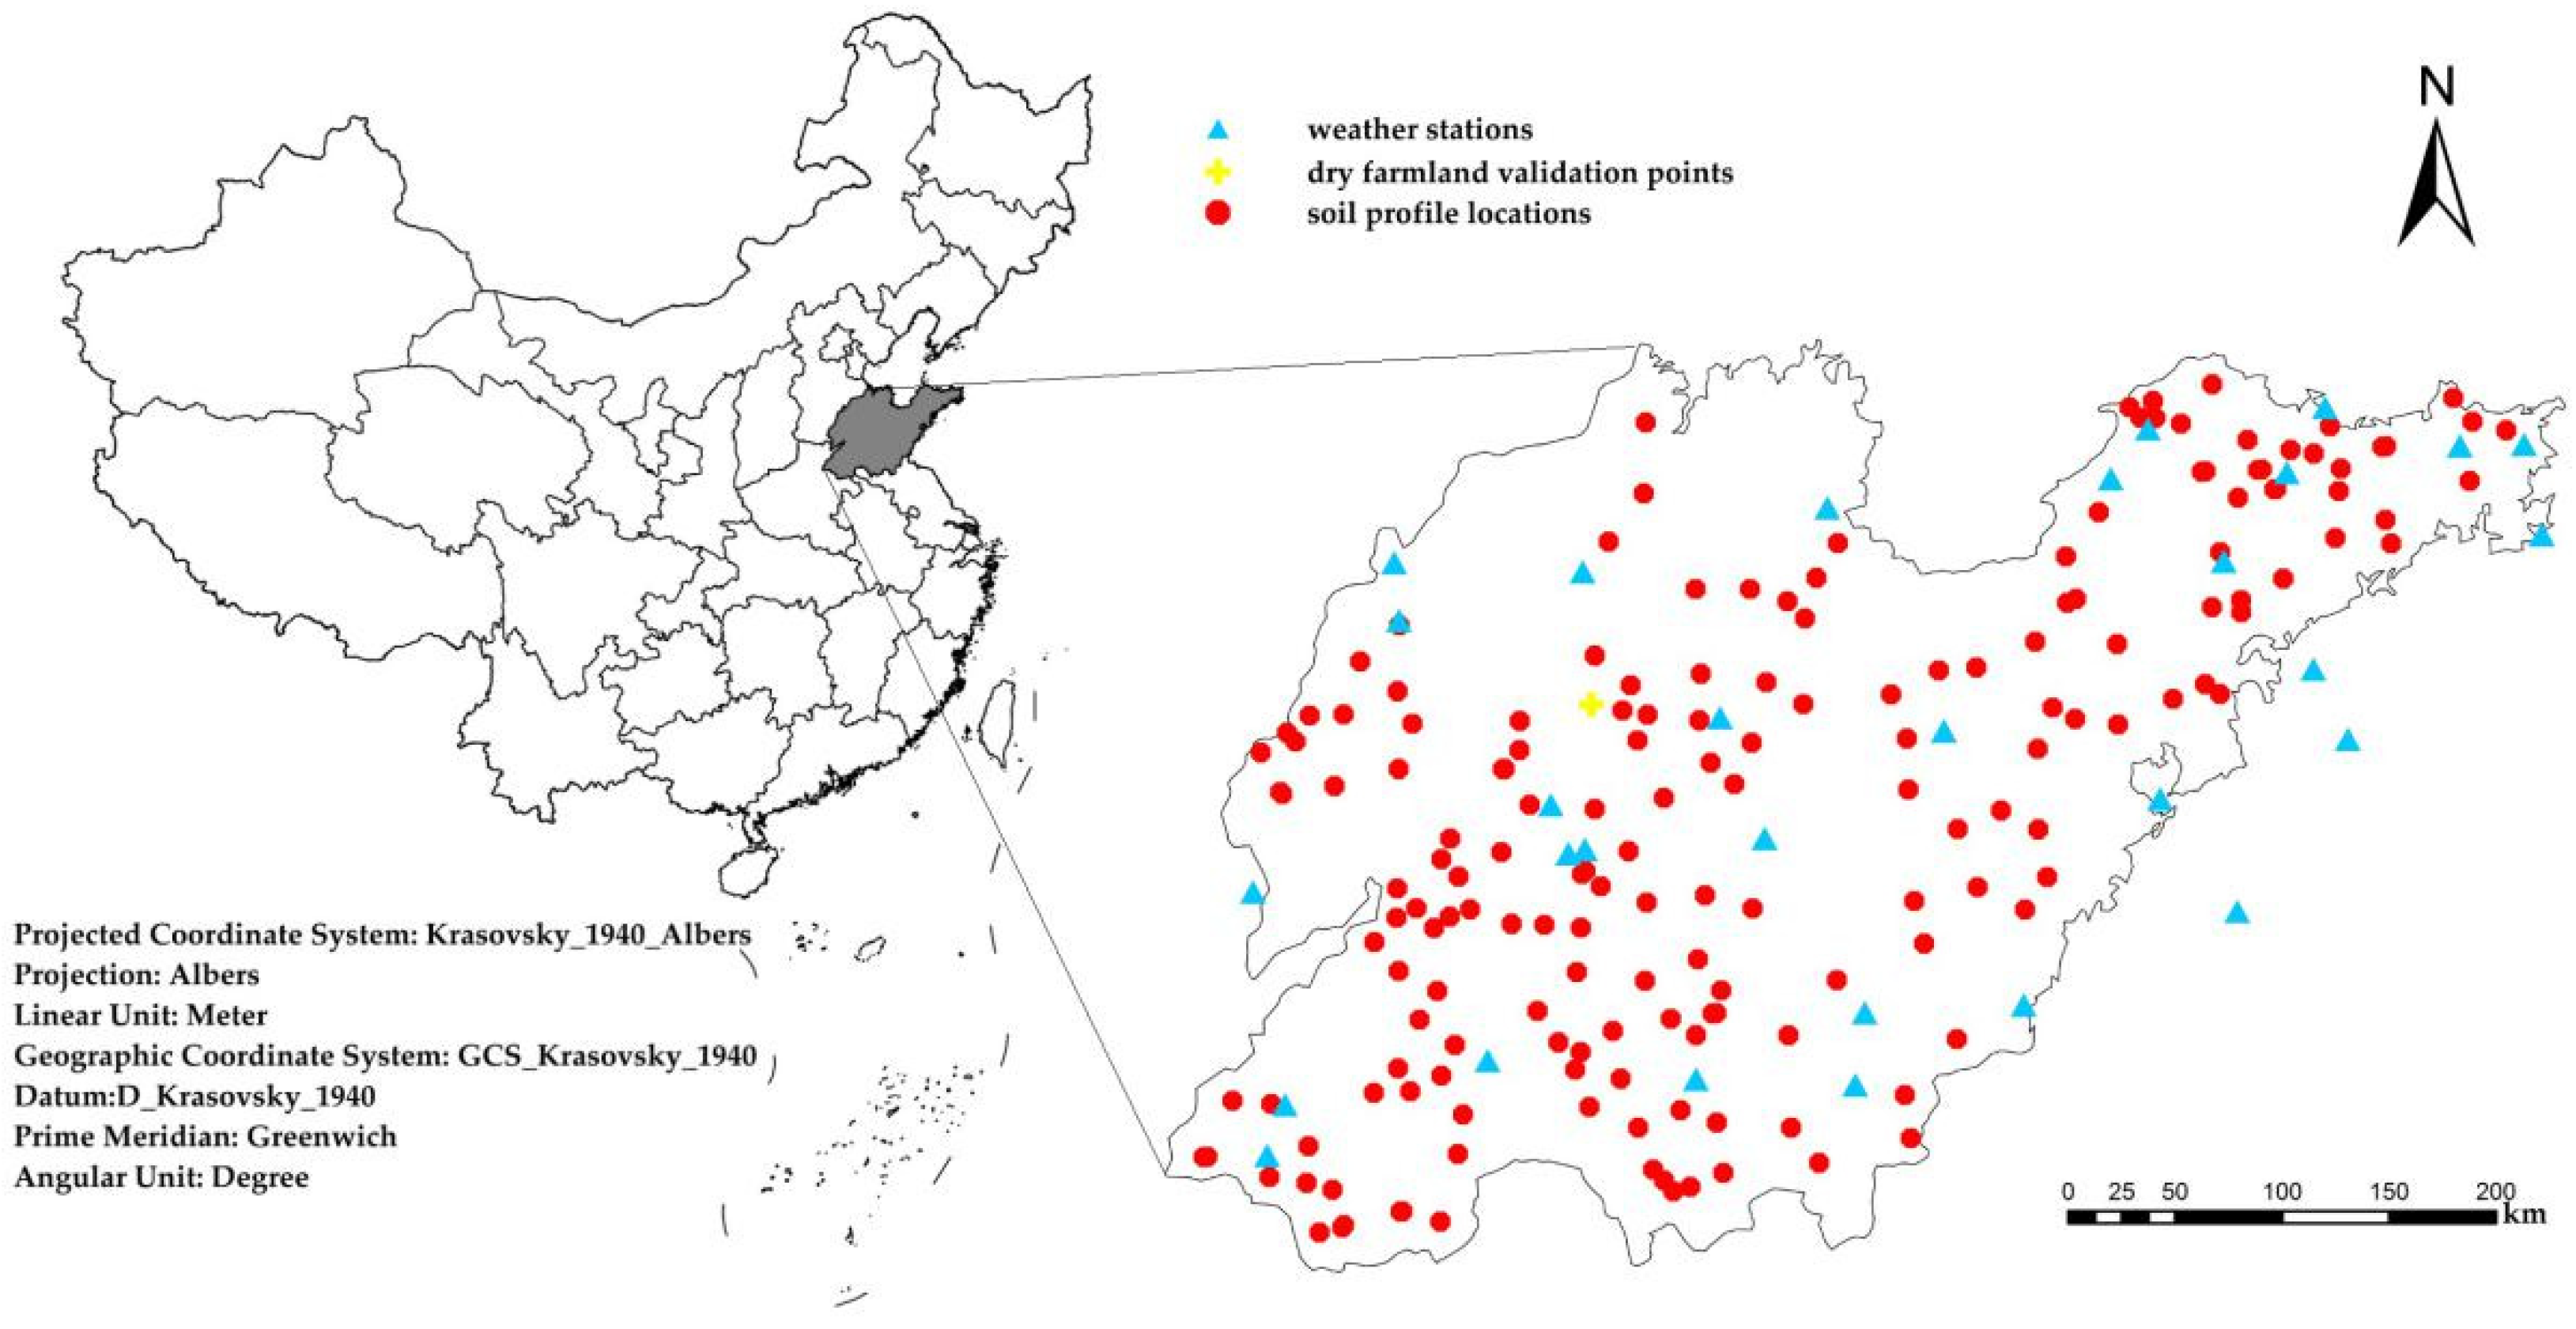
Figure 2.
The distribution of soil orders of dry farmland in Shandong Province.
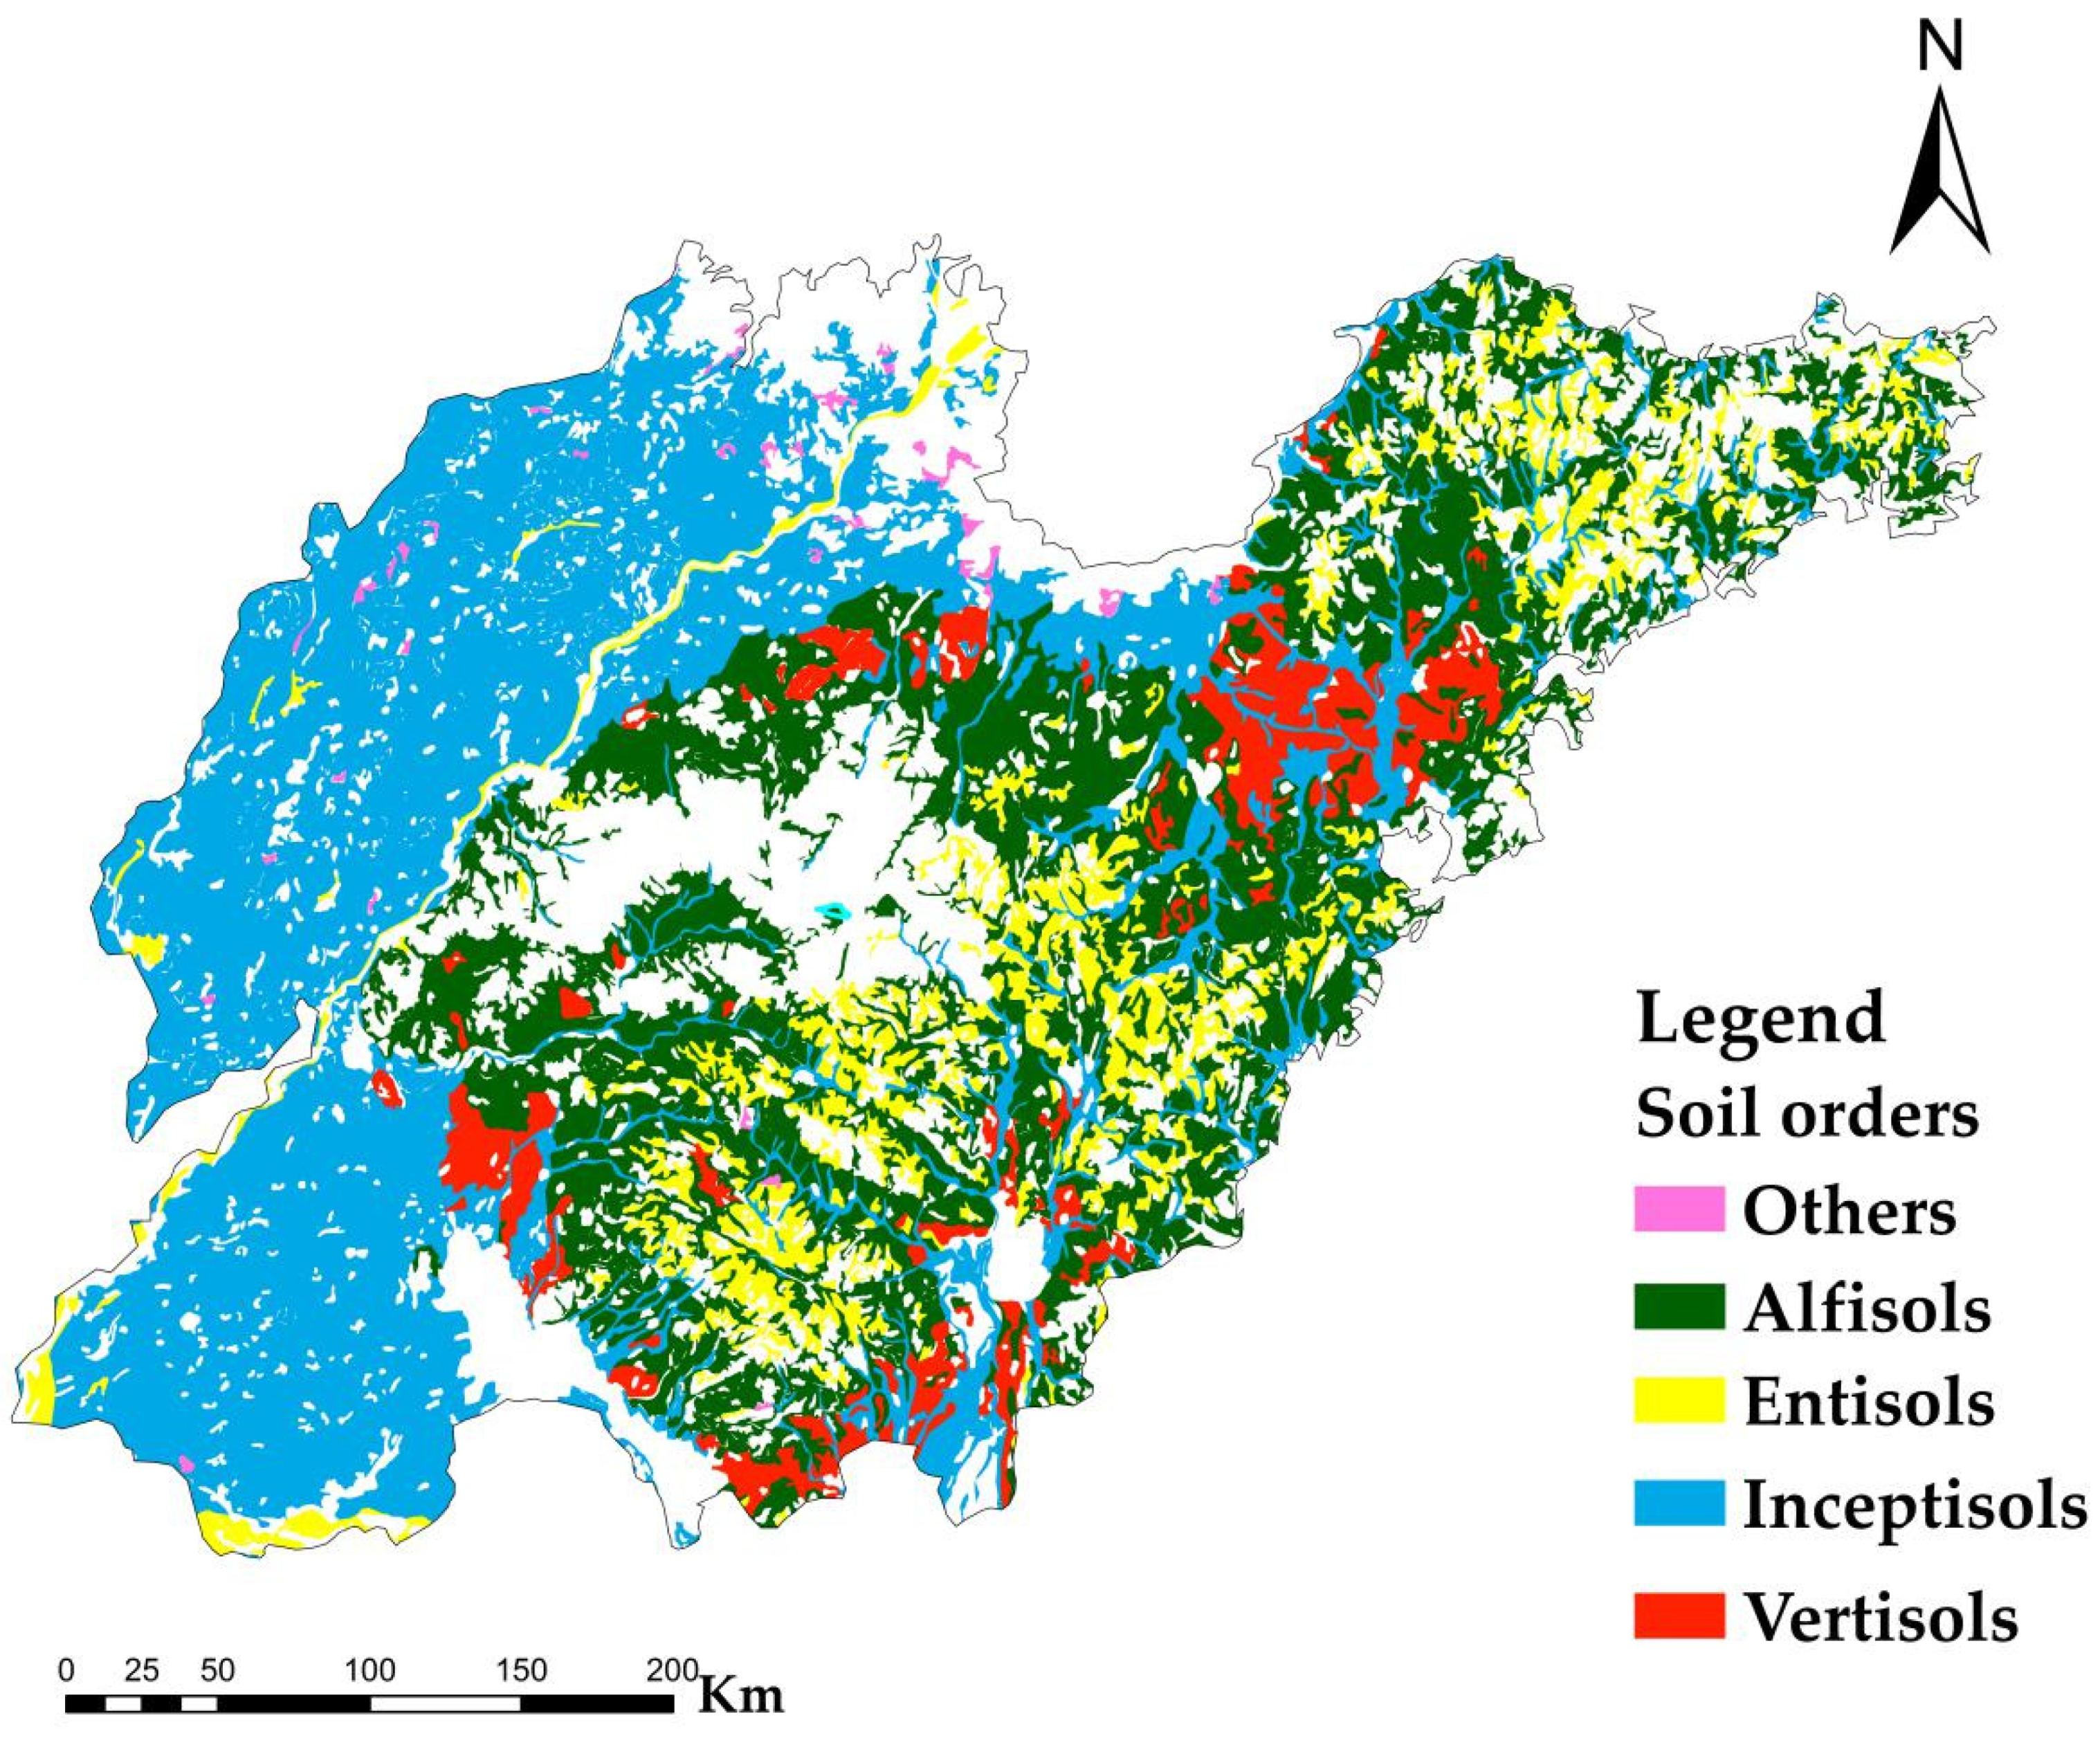
Figure 3.
Model simulation flow chart.
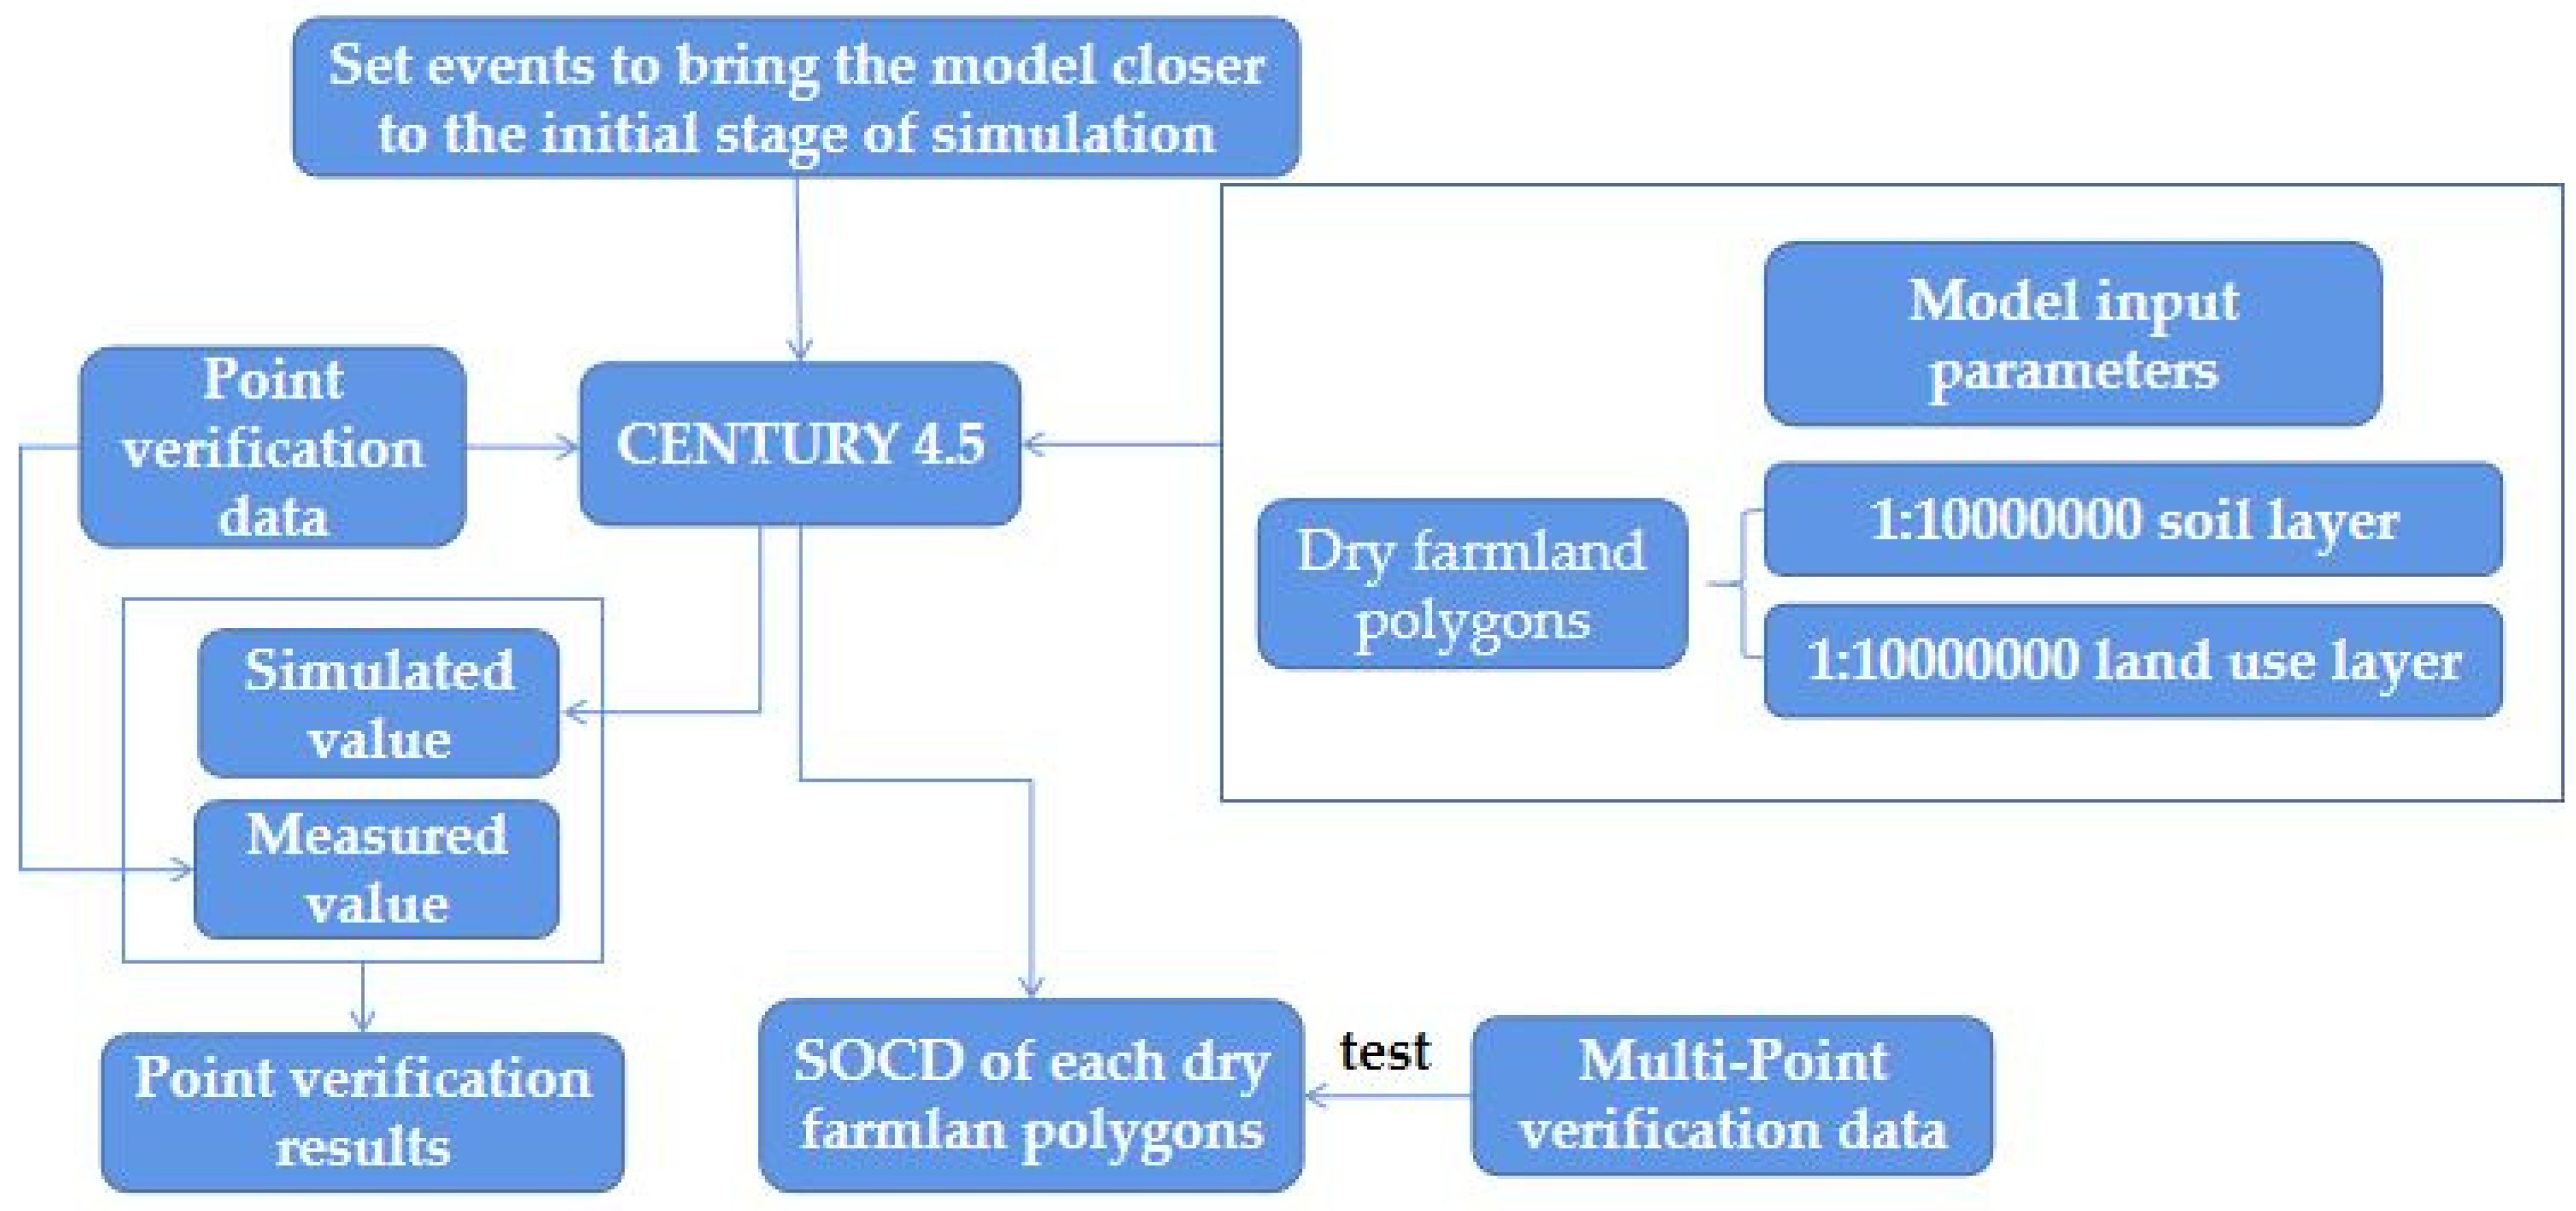
Figure 4.
Correlation analysis between measured and simulated SOCD in dry farmland, Jinan City, Shandong Province.
Figure 4.
Correlation analysis between measured and simulated SOCD in dry farmland, Jinan City, Shandong Province.

Figure 5.
SOCD simulated and measured values at multi-point in dry farmland, Lingxian County, Shandong Province.
Figure 5.
SOCD simulated and measured values at multi-point in dry farmland, Lingxian County, Shandong Province.
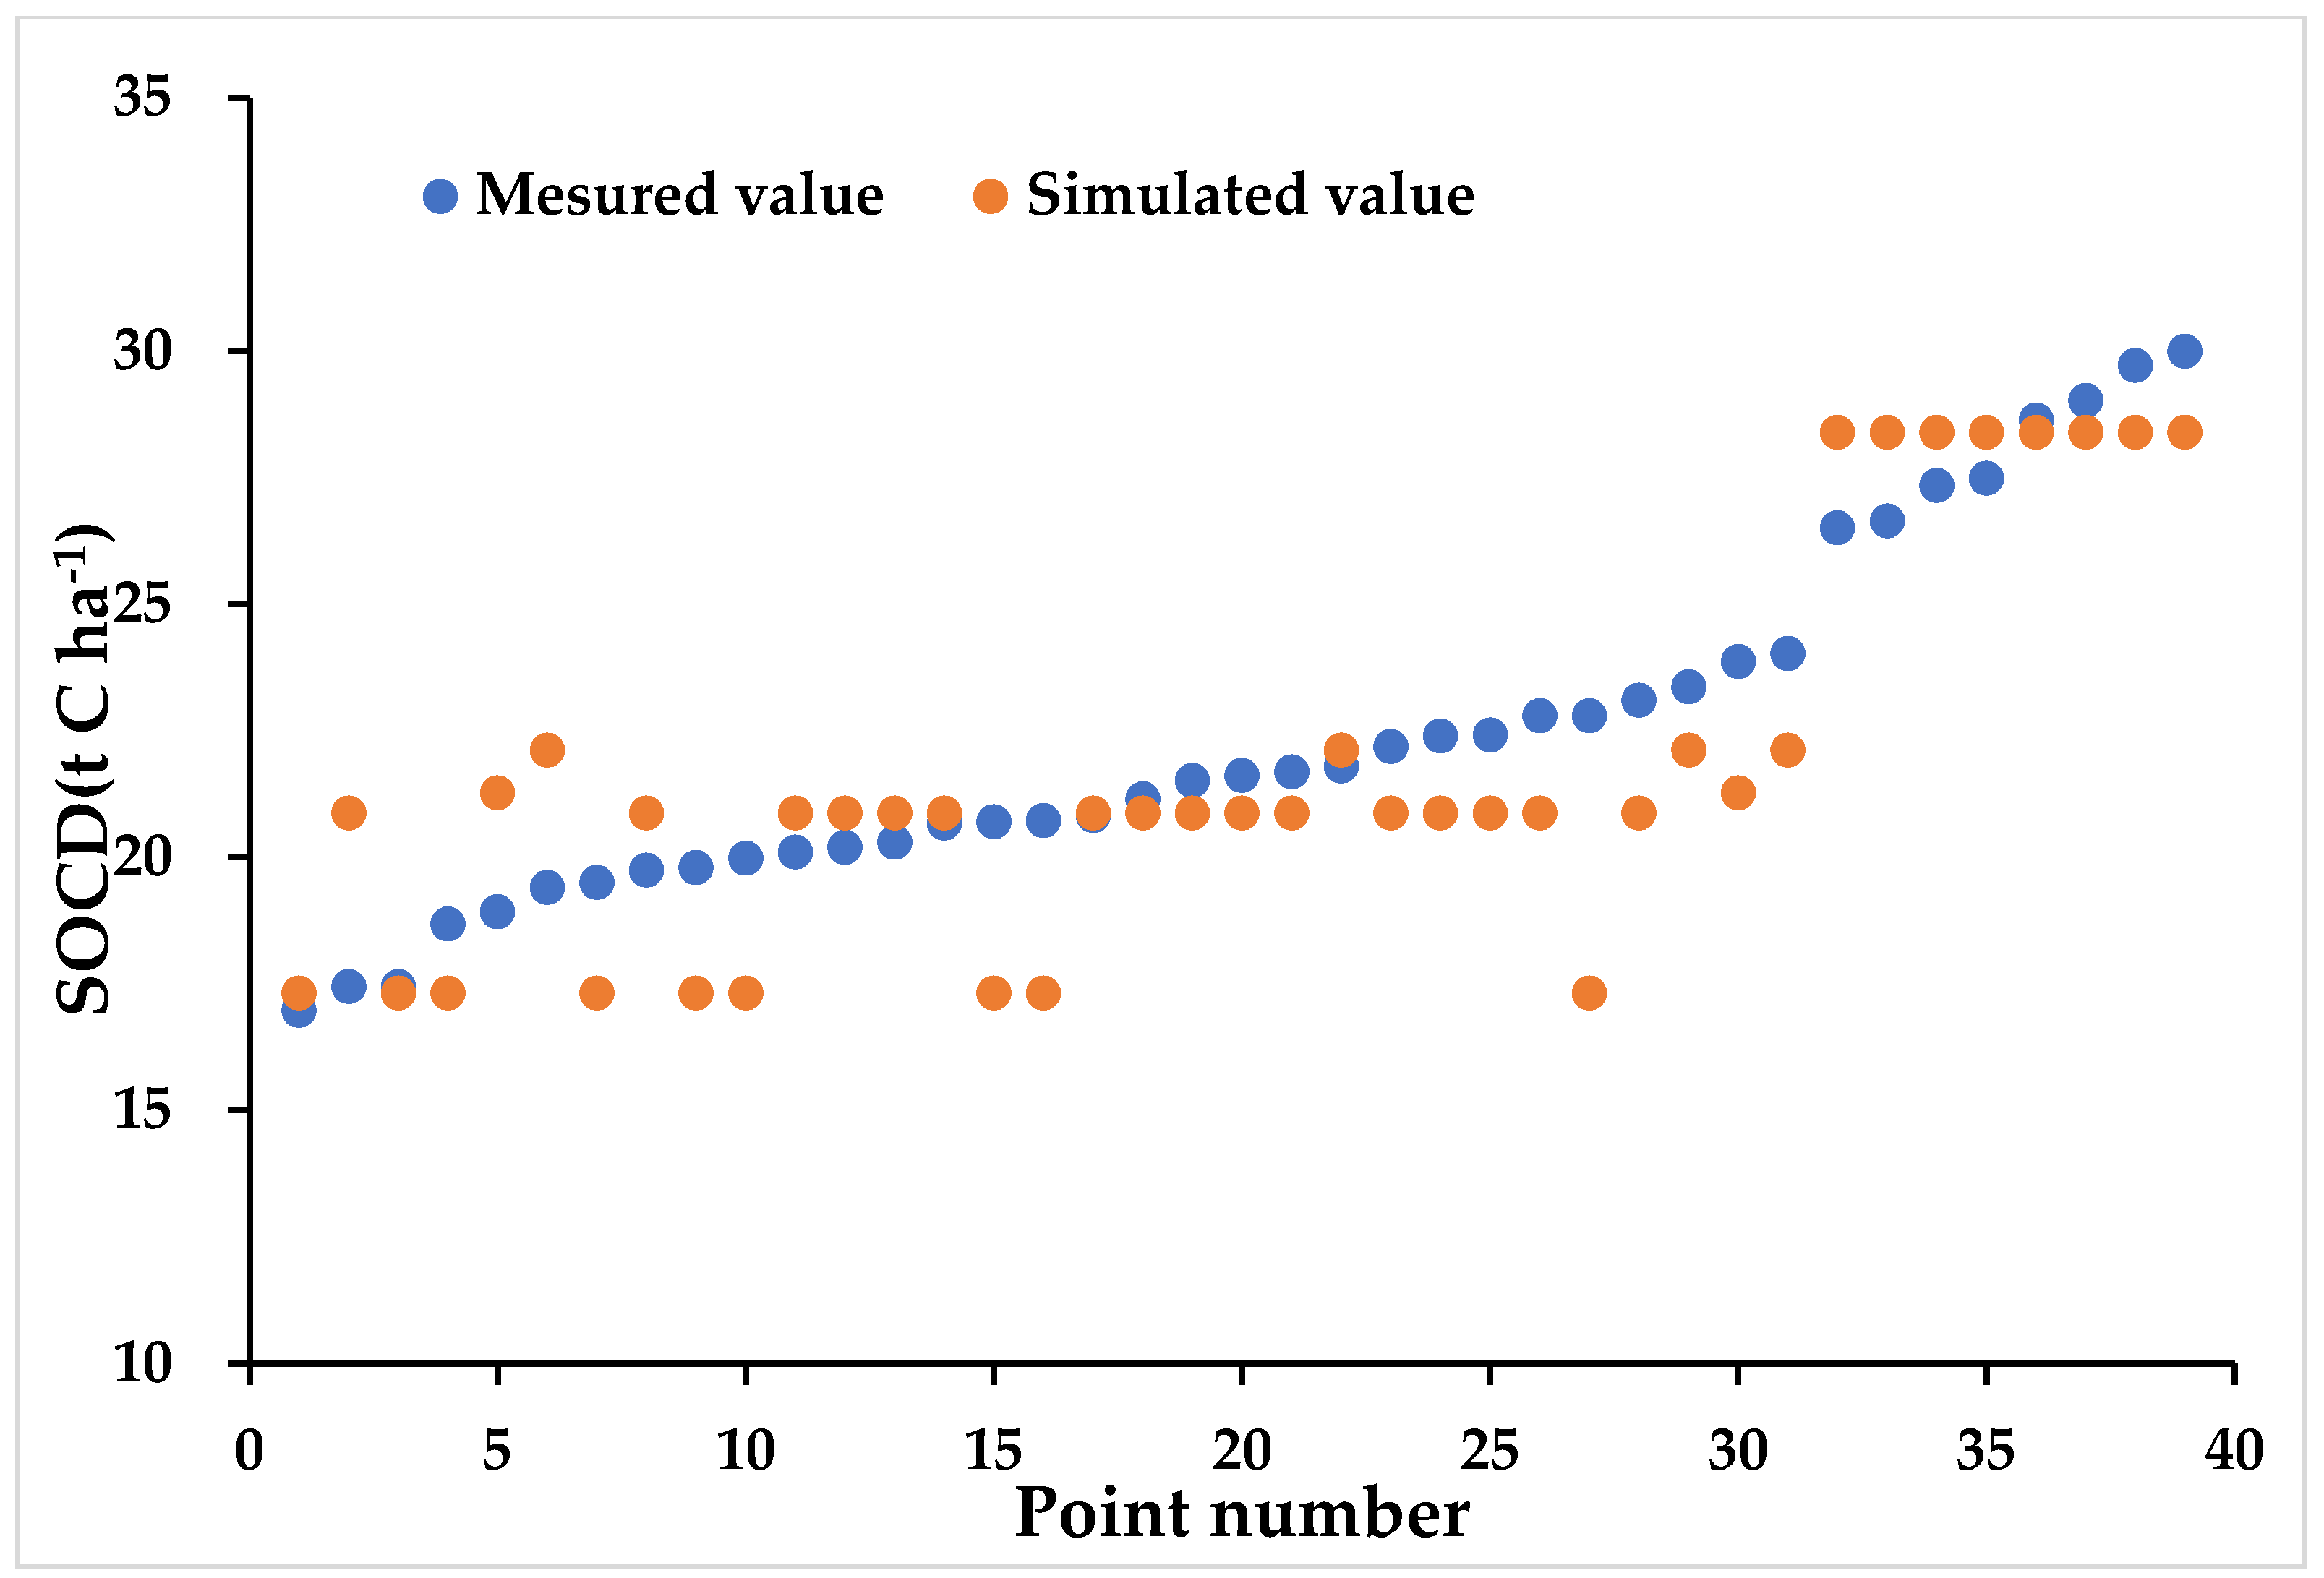
Figure 6.
Changes in soil organic carbon density (SOCD) and soil organic carbon storage (SOCS) from 1980 to 2016 in dry farmland, Shandong Province.
Figure 6.
Changes in soil organic carbon density (SOCD) and soil organic carbon storage (SOCS) from 1980 to 2016 in dry farmland, Shandong Province.
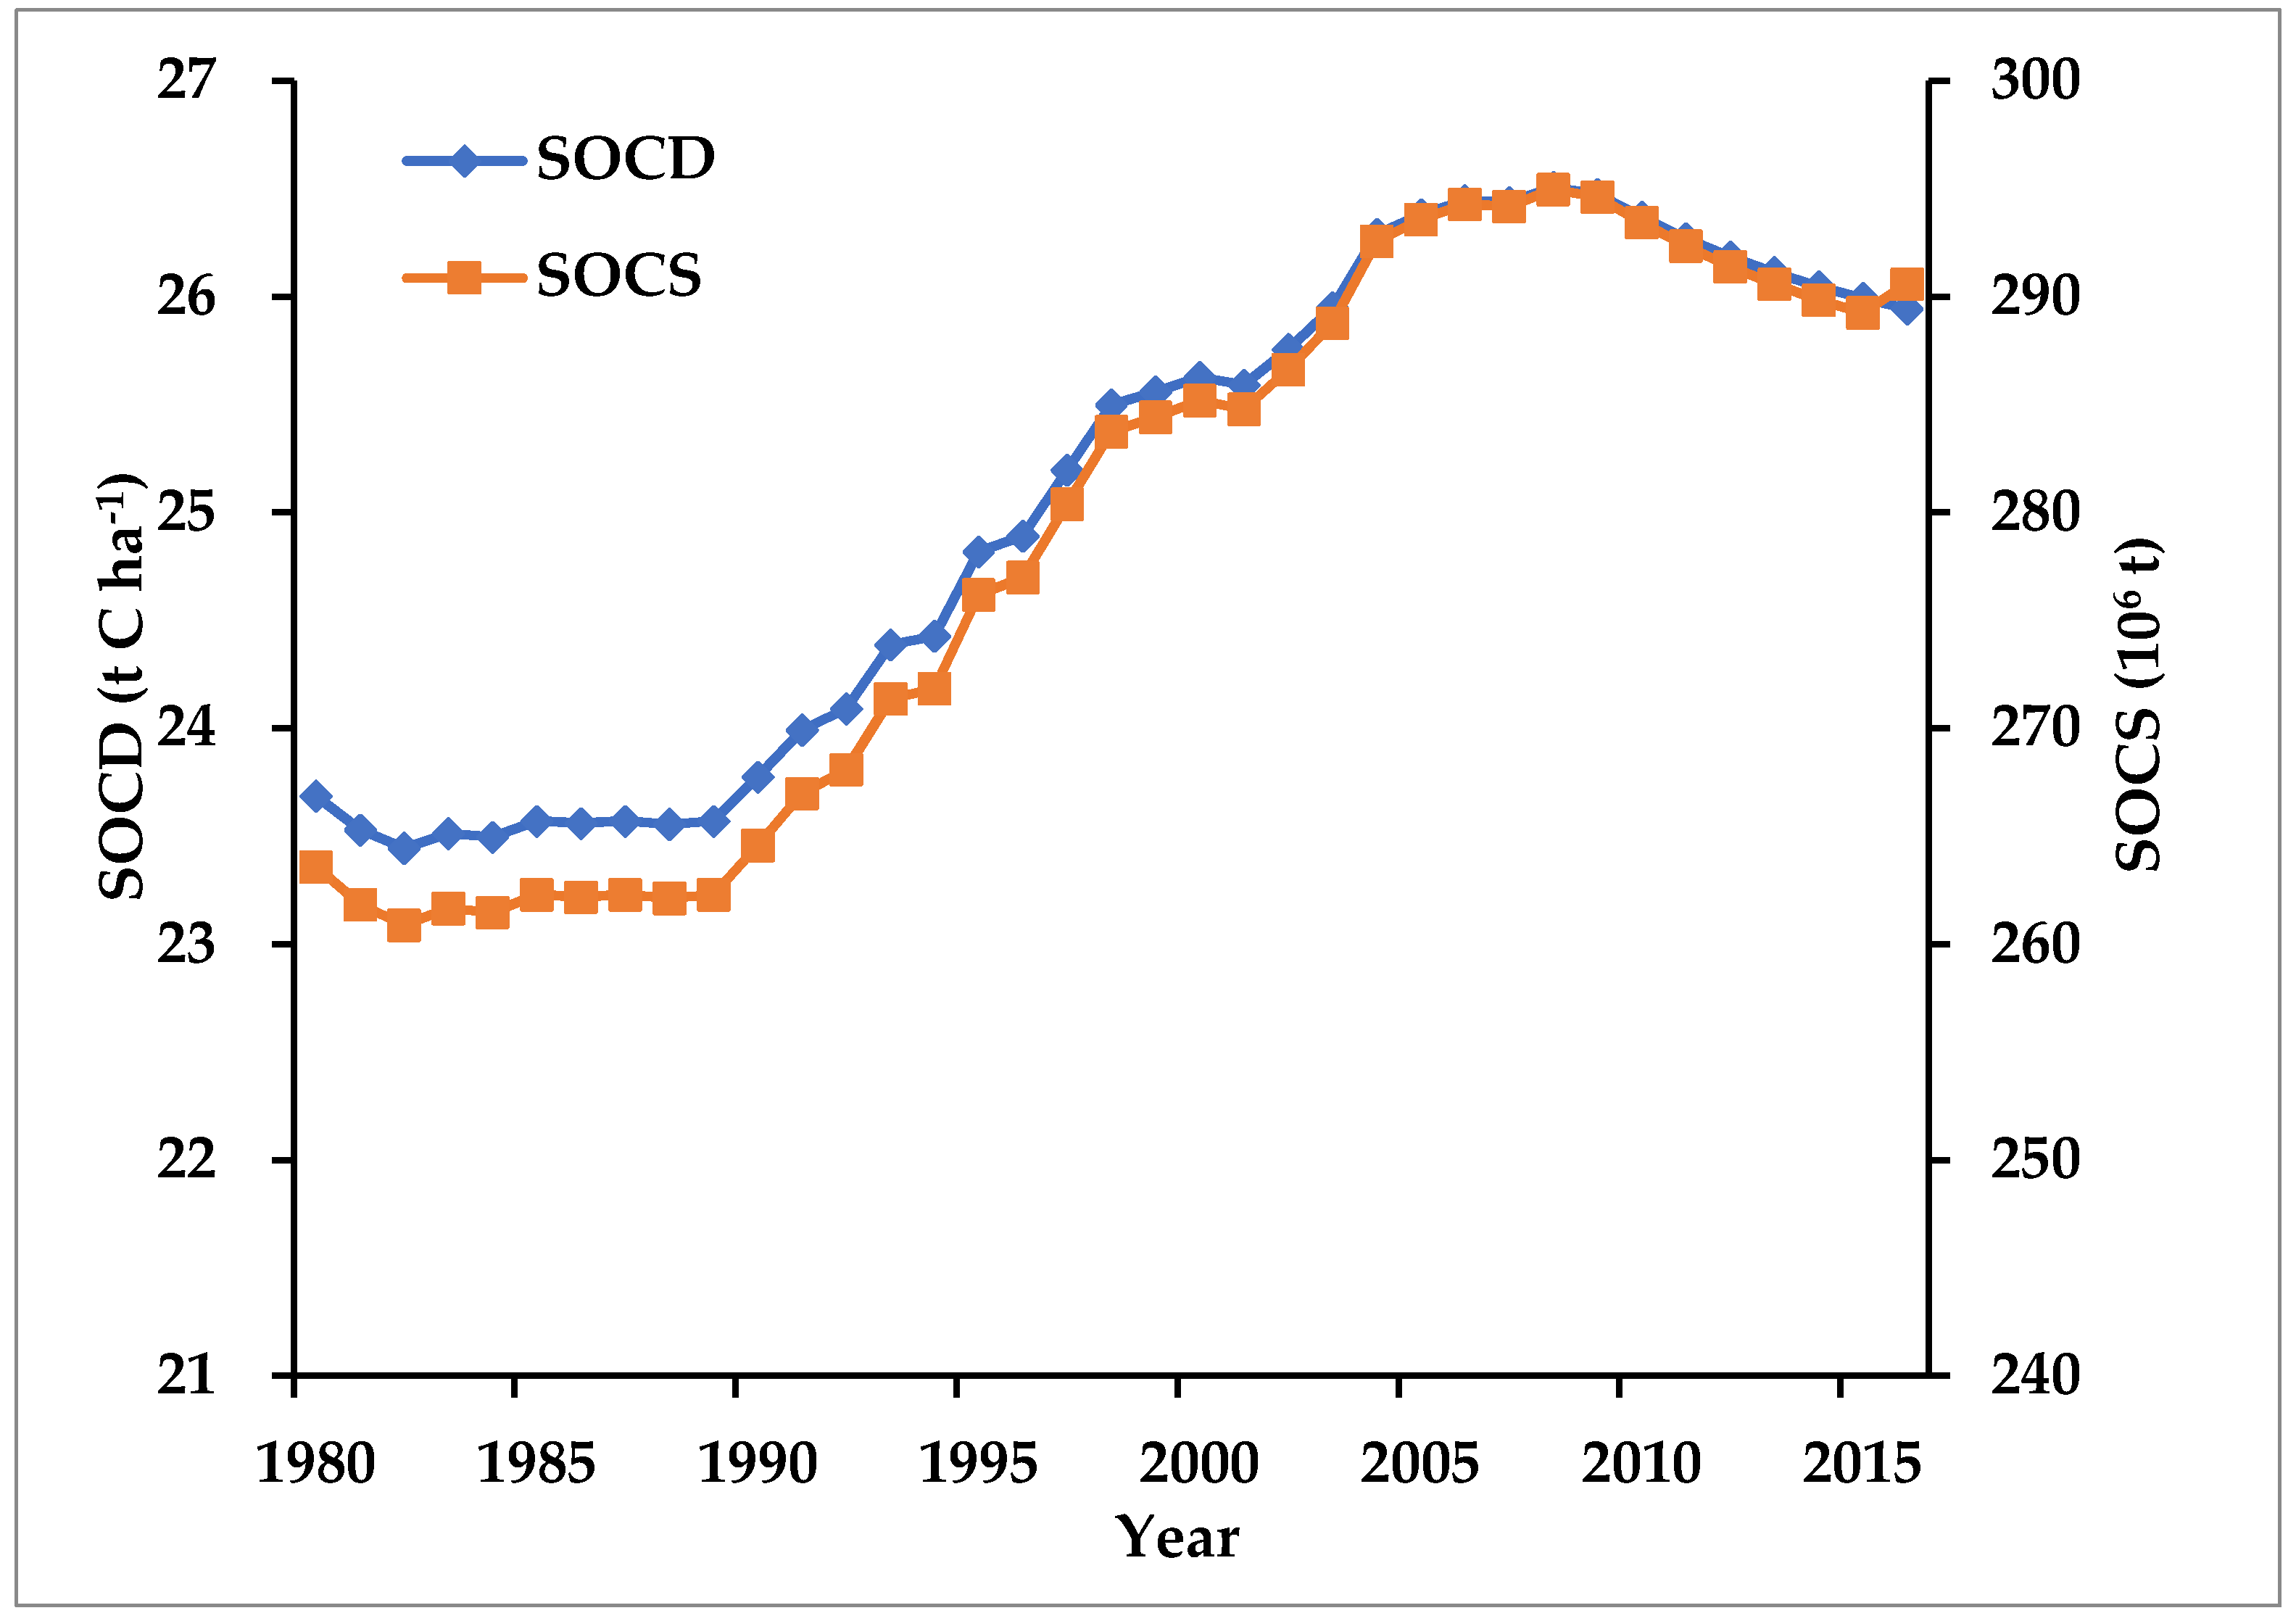
Figure 7.
The frequency of ΔSOCD polygons in categories of <−10, −10–−5, −5–0, 0–5, 5–10, and >10 t C ha−1 for four major dry farmland soil orders in Shandong Province.
Figure 7.
The frequency of ΔSOCD polygons in categories of <−10, −10–−5, −5–0, 0–5, 5–10, and >10 t C ha−1 for four major dry farmland soil orders in Shandong Province.
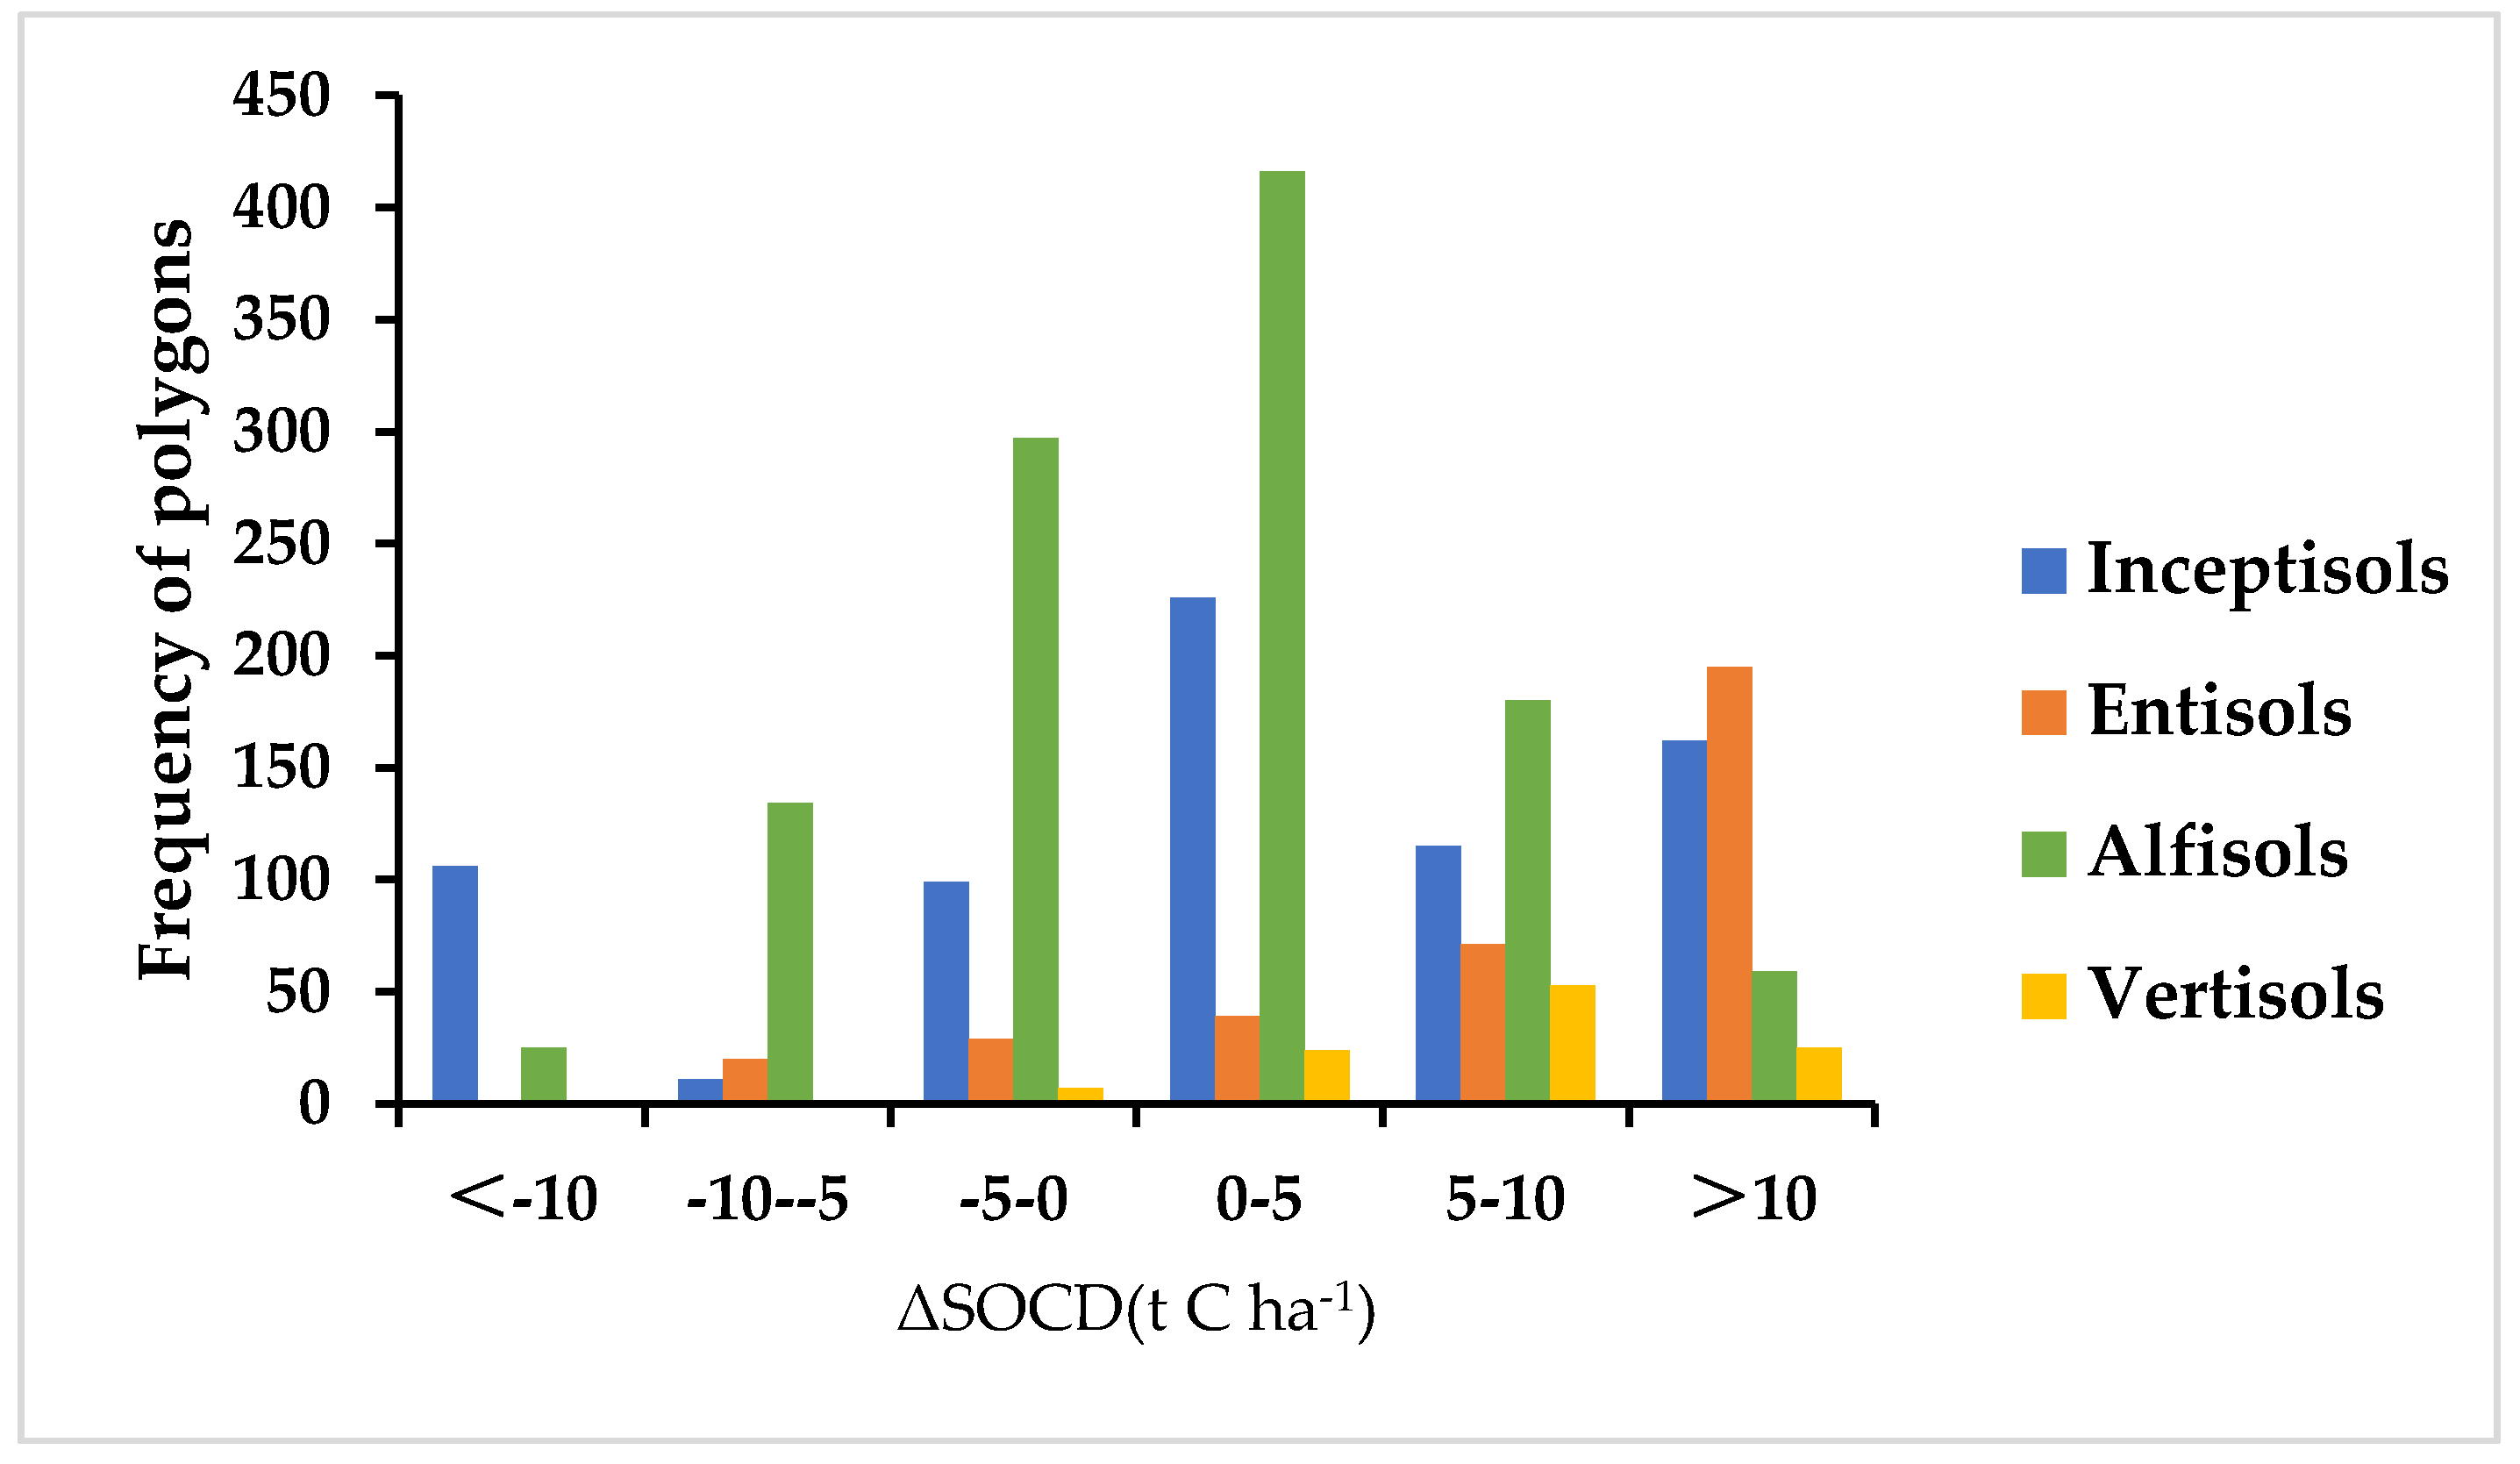
Figure 8.
Soil organic carbon density (SOCD) and its variation in inceptisols, entisols, alfisols, and vertisols between 1980 and 2016 in dry farmland, Shandong Province.
Figure 8.
Soil organic carbon density (SOCD) and its variation in inceptisols, entisols, alfisols, and vertisols between 1980 and 2016 in dry farmland, Shandong Province.
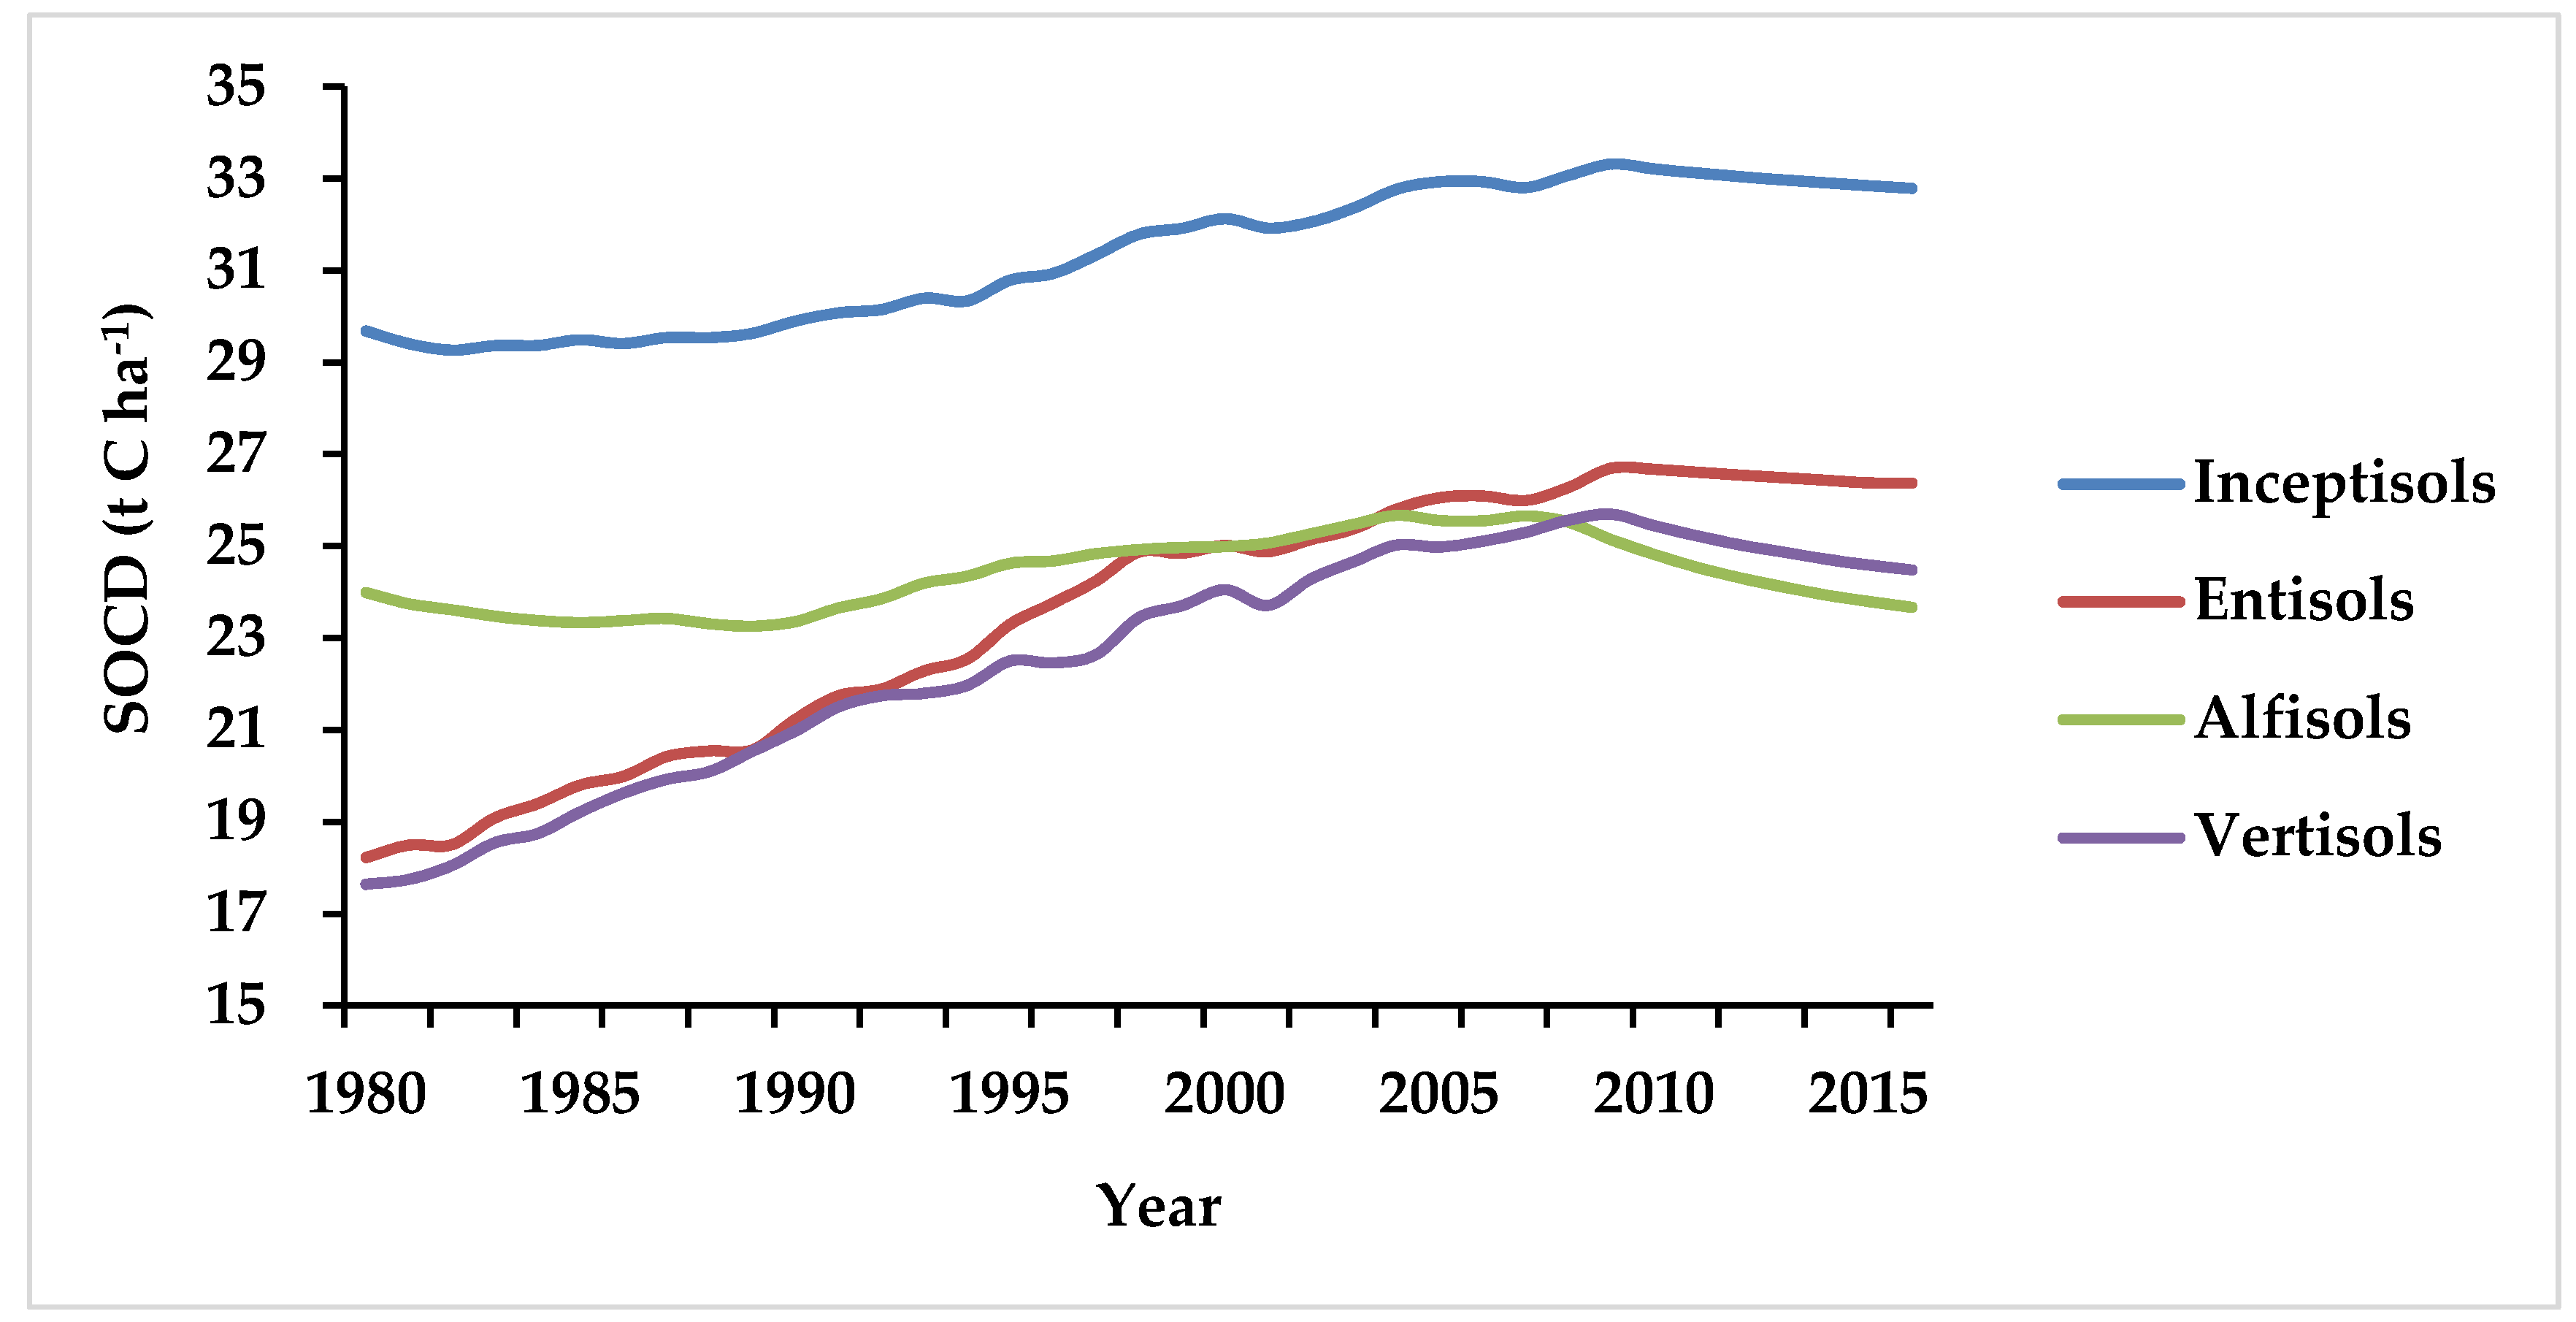
Figure 9.
The spatial distribution of soil organic carbon density (SOCD) in dry farmland in Shandong Province in (a) 1980; (b) 2016; and (c) from 1980 to 2016.
Figure 9.
The spatial distribution of soil organic carbon density (SOCD) in dry farmland in Shandong Province in (a) 1980; (b) 2016; and (c) from 1980 to 2016.


Table 1.
Main physical and chemical properties of the four soil orders of major dry farmland soils, Shandong Providence.
Table 1.
Main physical and chemical properties of the four soil orders of major dry farmland soils, Shandong Providence.
| Order | Sand | Silt | Clay | BD | pH | SOC |
|---|---|---|---|---|---|---|
| ----------%---------- | (g/cm3) | (g/kg) | ||||
| Inceptisols | 52.95 | 30.15 | 16.90 | 1.35 | 7.75 | 5.87 |
| Entisols | 71.39 | 17.39 | 10.98 | 1.36 | 6.91 | 3.73 |
| Alfisols | 58.05 | 23.28 | 18.67 | 1.33 | 7.01 | 5.61 |
| Vertisols | 40.52 | 31.66 | 27.82 | 1.42 | 7.65 | 7.03 |
Table 2.
Information of validation point in dry farmland of Shandong Province and its main physical and chemical properties.
Table 2.
Information of validation point in dry farmland of Shandong Province and its main physical and chemical properties.
| Site | Longitude/Latitude | Year Range | Crop Rotation | pH | BD | Sand | Silt | Clay | Order |
|---|---|---|---|---|---|---|---|---|---|
| g/cm3 | — | % | — | ||||||
| Jinan | 117.28° E/ 36.75° N | 1986–2007 | Winter Wheat-Corn | 7.7 | 1.36 | 61.5 | 20.9 | 17.6 | Inceptisols |
Table 3.
Basic multi-point information.
| Area | Number | Order | Soil Organic Carbon Density (SOCD) (t C ha−1) | |
|---|---|---|---|---|
| Range of Value | Average Value | |||
| Lingxian county | 39 | Inceptisols | 16.97–29.99 | 22.34 |
Table 4.
Dry farmland soil organic carbon density (SOCD) and related statistics in Shandong Province in 1980, 1985, 1990, 1995, 2000, 2005, 2010 and 2016.
Table 4.
Dry farmland soil organic carbon density (SOCD) and related statistics in Shandong Province in 1980, 1985, 1990, 1995, 2000, 2005, 2010 and 2016.
| Profile Number | Min | Max | Average | Range | Standard Deviation | Variance | |
|---|---|---|---|---|---|---|---|
| —— | t/ha | —— | |||||
| SOCD1980 | 2392 | 5.54 | 150.64 | 23.69 | 145.1 | 15.11 | 228.41 |
| SOCD1985 | 2392 | 6.01 | 135.89 | 23.57 | 129.88 | 13.90 | 193.16 |
| SOCD1990 | 2392 | 6.08 | 120.72 | 23.78 | 114.64 | 13.00 | 168.92 |
| SOCD1995 | 2392 | 6.98 | 112.19 | 24.82 | 105.21 | 12.15 | 147.51 |
| SOCD2000 | 2392 | 7.10 | 106.98 | 25.63 | 99.88 | 11.96 | 143.09 |
| SOCD2005 | 2392 | 7.05 | 104.22 | 26.38 | 97.17 | 11.80 | 139.20 |
| SOCD2010 | 2392 | 6.90 | 100.92 | 26.37 | 94.02 | 11.79 | 138.96 |
| SOCD2016 | 2392 | 6.09 | 98.12 | 25.94 | 92.03 | 11.89 | 141.45 |
© 2020 by the authors. Licensee MDPI, Basel, Switzerland. This article is an open access article distributed under the terms and conditions of the Creative Commons Attribution (CC BY) license (http://creativecommons.org/licenses/by/4.0/).
Share and Cite
MDPI and ACS Style
Tang, M.; Wang, S.; Zhao, M.; Qin, F.; Liu, X. Simulated Soil Organic Carbon Density Changes from 1980 to 2016 in Shandong Province Dry Farmlands Using the CENTURY Model. Sustainability 2020, 12, 5384. https://doi.org/10.3390/su12135384
AMA Style
Tang M, Wang S, Zhao M, Qin F, Liu X. Simulated Soil Organic Carbon Density Changes from 1980 to 2016 in Shandong Province Dry Farmlands Using the CENTURY Model. Sustainability. 2020; 12(13):5384. https://doi.org/10.3390/su12135384
Chicago/Turabian StyleTang, Min, Shihang Wang, Mingsong Zhao, Falyu Qin, and Xiaoyu Liu. 2020. "Simulated Soil Organic Carbon Density Changes from 1980 to 2016 in Shandong Province Dry Farmlands Using the CENTURY Model" Sustainability 12, no. 13: 5384. https://doi.org/10.3390/su12135384
Note that from the first issue of 2016, this journal uses article numbers instead of page numbers. See further details here.