Article

Sustainable Conservation Tillage Improves Soil Nutrients and Reduces Nitrogen and Phosphorous Losses in Maize Farmland in Southern China

1
College of Natural Resources and Environment, Joint Institute for Environmental Research & Education, South China Agricultural University, Guangzhou 510642, China
2
College of Water Conservancy and Civil Engineering, South China Agricultural University, Guangzhou 510642, China
*
Authors to whom correspondence should be addressed.
Sustainability 2019, 11(8), 2397; https://doi.org/10.3390/su11082397
Submission received: 18 March 2019 / Revised: 12 April 2019 / Accepted: 16 April 2019 / Published: 23 April 2019
(This article belongs to the Section Sustainable Agriculture)

Abstract

:
Monitoring nitrogen (N) and phosphorous (P) losses on farmland is essential for the prevention of agricultural non-point source pollution (NPS). This study was conducted on typical dry farmland in southern China to determine the effect of conservation tillage and conventional tillage (CT) on soil physical and chemical properties, nutrient movement, as well as on N and P losses. Four conservation tillage techniques (i.e., no-tillage direct seeding (NTDS), no-tillage transplanting (NTTS), minimum tillage direct seeding (MTDS), and minimum tillage transplanting (MTTS)), as well as one CT technique, were carried out in a randomized complete block design with three replicates each. The results suggest that MTDS and NTDS improved soil physical and chemical properties by ensuring adequate retention of these properties at the 0–20 cm soil depth. Low levels of N and P losses in runoff and drainage water were recorded under NTTS and NTDS compared to CT. Our results, therefore, suggest that conservation tillage approaches, such as MTDS and NTDS, are the most suitable tillage techniques for improving soil nutrients and reducing agricultural N and P losses while providing an eco-friendly and sustainable agricultural practice.

1. Introduction

Producing sufficient food has long been a priority for China due to the major challenges posed by limited arable land and huge population growth. After the onset of the green revolution in the 1950s, increasing use of inorganic fertilizers, organic manures, and pesticides became the principal means globally and in China for attaining high-crop yields [1]. Moreover, intensive agriculture with high inputs has resulted in rapid development of crop production in China, accompanied by negative environmental effects, such as serious non-point source (NPS) agricultural pollution [2]. NPS pollution is mainly caused by over-use of insect killing sprays, known as pesticides, and the overuse of chemical fertilizers [1]. The main two chemical pollutants found in chemical fertilizers are nitrogen and phosphorous. According to Norse, 2005, there is an increase of 120% usage of these chemicals on a yearly basis. Moreover, China is the main manufacturer and consumer of these chemicals. The application of chemical fertilizers is typically over-used by up to 50% more than necessary, which is more than intensive vegetable production needs [3]. However, exposure to pollutants from these chemicals is detrimental to the long-term health of the population. This is due to the consumption of chemicals and heavy metals via water and produce. Since the 1980s, there has been a decreasing trend in the fertilizer use efficiency of inorganic N fertilizers. N recovery by crops decreased from 57% in 1979 to 43% in 1998, along with a two-times increase of total N loss [1]. The continuous decline in nitrogen use efficiency since 1998 is an issue for all cereal and vegetable crops, as well as some tree crops. According to the national survey of pollution sources in 2007, the total nitrogen loss from cropland was about 1,600,000 tonnes, with 320,000 tonnes coming from surface runoff and >200,000 tonnes from underground leaching. The total phosphorus loss was much less at about 108,000 tonnes [4]. Field observations carried out to estimate the use of the main nitrogen fertilizers (urea, ammonium bicarbonate, and ammonium sulphate) for the main cereal crops (rice, wheat, and maize) and the main food production provinces of China showed that the total loss of nitrogen fertilizer from crops to the environment in the 1990s was about 19.1%, of which 5% entered the surface water by runoff, with 2% passing down to the groundwater by leaching, 1.1% entering the atmosphere through denitrification process (N2O), and 11% through the ammonia (NH3) volatilization process [5].
Moreover, mixed fertilizers with an unbalanced ratio can lead to physical and chemical and biological damage to soils, resulting in acidification, secondary salinization, and a reduction of microbial activity [6,7]. This destruction leads to a decline in crop yields as farmers attempt to compensate for the decline in soil productivity by applying more fertilizers, resulting in NPS pollution and continuous degradation of the environment. Investigation of eutrophication in Dianchi Lake in China suggests that the total N content (TN) generated by NPS pollution comprises 44.5% of the total pollution load, while the total P content (TP) comprises 26.7% [8].
To address the critical NPS pollution situation, it is important to have soil management measures aimed at reducing NPS pollutant loads. To achieve this, re-evaluation of traditional and environmentally friendly agricultural practices (EPSs), such as soil testing and fertilizer recommendation, introduction of slow and controlled-released fertilizer, conservation tillage (e.g., no-till or minimum tillage), crop rotation, straw retention to the field, as well as application of organic and inorganic fertilizers, are increasingly being researched to avoid agricultural NPS pollution, to ameliorate its effects, and protect the environment in China [2]. A difference in management practices often results in differences in biological, chemical, and physical properties of soil, which in turn, result in changes in the functional quality of soil [9]. Conventional tillage systems, especially plowing, disturb aggregates of soil and increase soil temperature and soil organic decay, which in turn results in a decline in C and N contents of soil [9].
More recently, conservation tillage was identified in literature as being necessary if producers hope to increase or maintain soil organic carbon (SOC) levels [10]. By the end of 2008, conservation tillage was being practiced on more than 3 million ha land in China [11]. No-tillage (NT) makes up about 50% of conservation tillage in China, which allows for low disturbance subsoiling or ripping in no-till fields [11]. Despite the many research works done on conservation tillage and its positive effect on soil management in China and around the world, many farming areas are yet to realize its potential in addressing soil management problems, such as reducing NPS pollution, as well as ensuring sustainable production. Therefore, the objectives of this project were as follows: (1) to determine the effect of conservation tillage and CT on soil physical and chemical properties; (2) to assess soil nutrient movement along the soil profile (0–100 cm); and (3) to determine the effect of such tillage techniques on agricultural NPS N and P loss and its environmental implication in an irrigated dry land farm under a maize double cropping system.

2. Materials and Methods

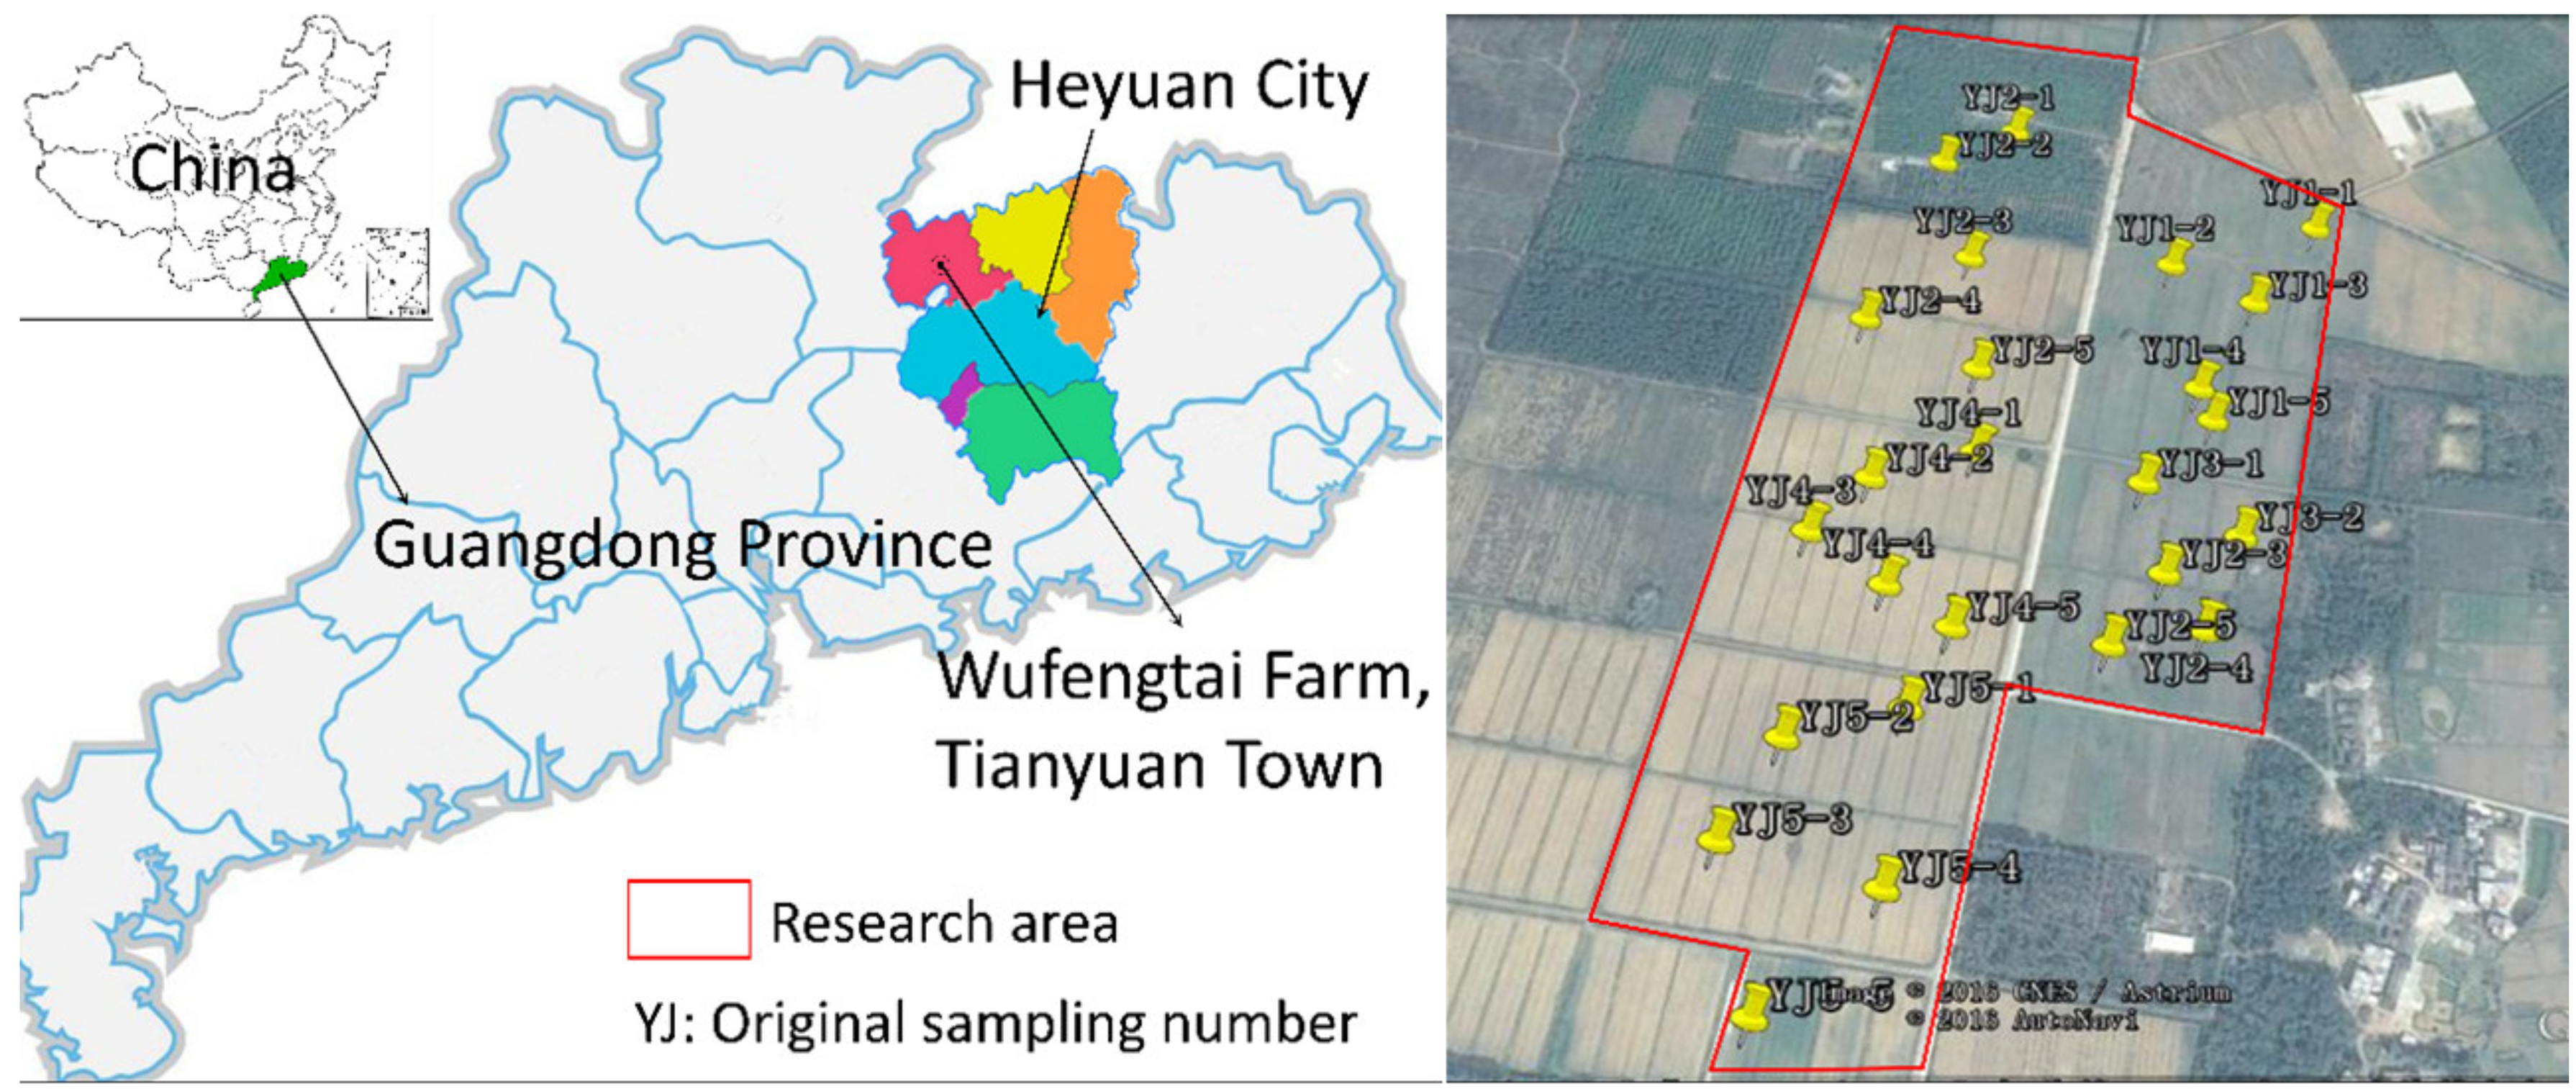
2.1. Study Site and Experimental Design

The study was conducted on an irrigated private experimental field of the Wufengtai farm located at Heyuan city of the Guangdong province of China (Figure 1, 24°09′23.33″ N; mean annual rainfall of 1779.7 mm and temperature range of 18.0~20.7 °C). The area has a mid-subtropical monsoon climate with a moderate temperature and plenty of sunlight. The soil of the experimental site is latosol (Orthic Acrisol, FAO-UNESCO system) derived from quaternary red earth with a sandy clay loam texture (58% sand, 19% silt, and 23% clay). The experimental field was established in December 2015. Five composite soil samples at 0–20 cm depth were collected and tested prior to applying the treatments, and the basic properties are shown in Table 1. Double cropping, consisting of corn and Chinese cabbage, was the main cropping system in this area. Detailed description of different tillage systems is necessary to compare the influence of tillage practices on environmental performance. The experiment was arranged in a randomized complete block design (RCBD) in replicates. Four conservation tillage techniques made of (1) no-till direct seeding (NTDS) with residue incorporation, no-till transplanting (NTTS) with residue, minimum tillage direct seeding (MTDS) with residue incorporation and minimum tillage transplanting (MTTS) with residue incorporation, and CT with residue incorporation were arranged in a randomized complete block design. The experimental unit size for each plot measured 10 m × 40 m 400 m2. Maize stalk residues from previous harvests were retained at the soil surface of the NTDS and NTTS treatment plots. The MTDS and MTTS plots were incorporated with maize residue by rotovating the soil and the corn residue at a depth of 8–10 cm using a power tiller. CT plots were ploughed, harrowed, and incorporated with maize residue using a tractor mounted disc plough and harrow. Prior to seeding in April 2016, the soil was irrigated to field capacity (FC) level using sprinkler irrigation. Under the NTDS, MTDS, and CT treatment fields, corn seed of Yue Tian 26 variety (Super sweet corn) with a planting dimension of 30 cm within rows and 65 cm between rows was planted at a density of 44,440 plants·ha−1 using a tractor mounted no-till corn planter (2BMQE-2A) manufactured by Lovol Heavy Industry Co., LTD, China. The planter was adjusted to correspond to the planting dimension. With the NTTS and MTTS treatment plots, 3–4-week-old sweet corn seedlings were transplanted using the corn transplanter with transplanting dimensions of 30 cm × 65 cm. Organic fertilizer obtained from composted maize stalks was applied to all the treatments at the rate of 7500 kg·ha−1 and 15,000 kg·ha−1 as the basal fertilizer, respectively, in the month of April each year, followed by a compound fertilizer of 220 kg N·ha−1, 80 kg P2O5·ha−1, and 150 kg K2O·ha−1. Crop protection (pest and disease control) was carried out according to the principles of integrated pest management (IPM), which aims to suppress pest populations below the economic injury level using insecticide (emamectin benzoate) at a rate of 450 kg·ha−1 on the experimental field.

2.2. Soil Sampling

Undisturbed soils were sampled in December 2015 (before treatment allocation) from surface horizon at a depth of 0–20 cm to establish the general physical and chemical properties of the soil at the experimental site. Subsequently, surface and subsurface disturbed soils from MTDS, MTTS, and CT treatments, as well as undisturbed soils from NTDS and NTTS treatments, were sampled in January (after treatment allocation), April (After seeding), July (at harvest), and November (when land was fallow and ready for the next production.), 2016–2017. Five samples were collected from each treatment plot from each sampling time using 5 cm diameter × 5 cm length cores and soil auger. Augured soil samples were placed in a plastic (zip lock) bag in the field and kept cool until transported to the laboratory for analysis. Augured soil samples were air dried for 4–5 days, and sieved into various sizes of 2 mm, 1 mm, and 0.15 mm for laboratory analysis. Soil physical and chemical properties, including bulk density, pH, soil total nitrogen (TN), soil alkaline hydrolytic nitrogen (AN), soil total phosphorous (TP), soil available phosphorous (AP), soil total organic carbon (TOC), nitrate nitrogen (NO3–N), and ammonium nitrogen (NH4+–N) were measured. TN, TP, NO3–N, and NH4+–N from surface and subsurface horizons (0–20 cm, 20–40 cm, 40–60 cm, 60–80 cm, and 80–100 cm) were measured as potential agricultural NPS pollutants. In addition to this, irrigation water, rainfall, and drainage were also measured. The basic physical and chemical properties were determined using standard methods. Undisturbed soil samples were used to determine soil bulk density using the core method [12]. Soil pH was measured using a glass electrode (pH meter) in a soil to water ratio of 1:2.5 [13]. Exchangeable K was determined using flame photometry [14]. Soil total N (TN) was determined by the macro-Kjeldahl wet oxidation method [15]. Soil Alkaline N (AN) content was determined using alkaline hydrolysis diffusion method [16]. Soil TOC was estimated using the potassium dichromate volumetric method [17]. Soil available phosphorus (AP) was determined by the Olsen method [18]. Nitrate-N (NO3–N) and NH4+–N were extracted using KCl [19], and determined by detection using a Skalar flow injection analyzer (SA 5000). Soil rapid available K (AK) content was determined using flame photometry following 1M NH4OAc extraction [14]. Soil physical and chemical properties of the initial soil sampled in January 2016 are shown in Table 1.

2.3. Nitrogen and Phosphorous Losses in Runoff

At the end of the experimental period, in November 2017, N and P input losses were calculated based on their concentrations in runoff water (mg·L−1) and sediment in runoff (g·m−2). To achieve this, an automatic rain gauge was installed at the farm. Also, 4 m by 1.5 m plots were oriented parallel to the direction of the slope of the experimental plots. A 100 mm wide, approximately 2 mm metal plate was inserted 30 mm into soil along the perimeter of each plot to channel runoff through an H-flume into a 310 L tank. The depth of rainfall recorded by the rain guage was then subtracted from the water depths in the uncovered tank. This was done before calculating the volume of runoff generated from each treatment plot. After every rainfall event, runoff water collected in the water tanks were mixed thoroughly and a sample was collected (500 mL) for analysis. Water samples collected were stored at a temperature of 4 °C and then filtered within a 24 h period. The mass of sediment was then calculated. Filtrates and sediments, as well as runoff water, were analyzed for total N and P.

2.4. Statistical Analysis

In this study, all experiments were conducted in triplicate. The data presented in figures and tables are the arithmetic mean values of the triplicate measurements. Data on soil physical and chemical properties, as well as N and P losses, were analyzed using statistical package (SPSS version 23). Significance level at 5% was used for all the analyses, along with mean separation based on Least Significance Difference (LSD).

3. Results

3.1. Soil Bulk Densityat the Depth of 0–20 cm

Soil bulk density values were affected by tillage techniques and varied over the sampling years (data shown in Table 2). Significant differences were recorded among all the tillage techniques in 2016, with the conservation tillage techniques recording high bulk density values compared with CT. Similarly, in 2017 CT recorded bulk density higher than the conservation tillage techniques. However, even though CT recorded the highest bulk density in 2017, the rate of decrease in bulk density was higher under the conservation tillage techniques. Generally, the average percentage decrease in bulk density for all the conservation tillage techniques (MTTS, MTDS, NTTS, and NTDS) was 4.5% compared to 2.4% with CT.

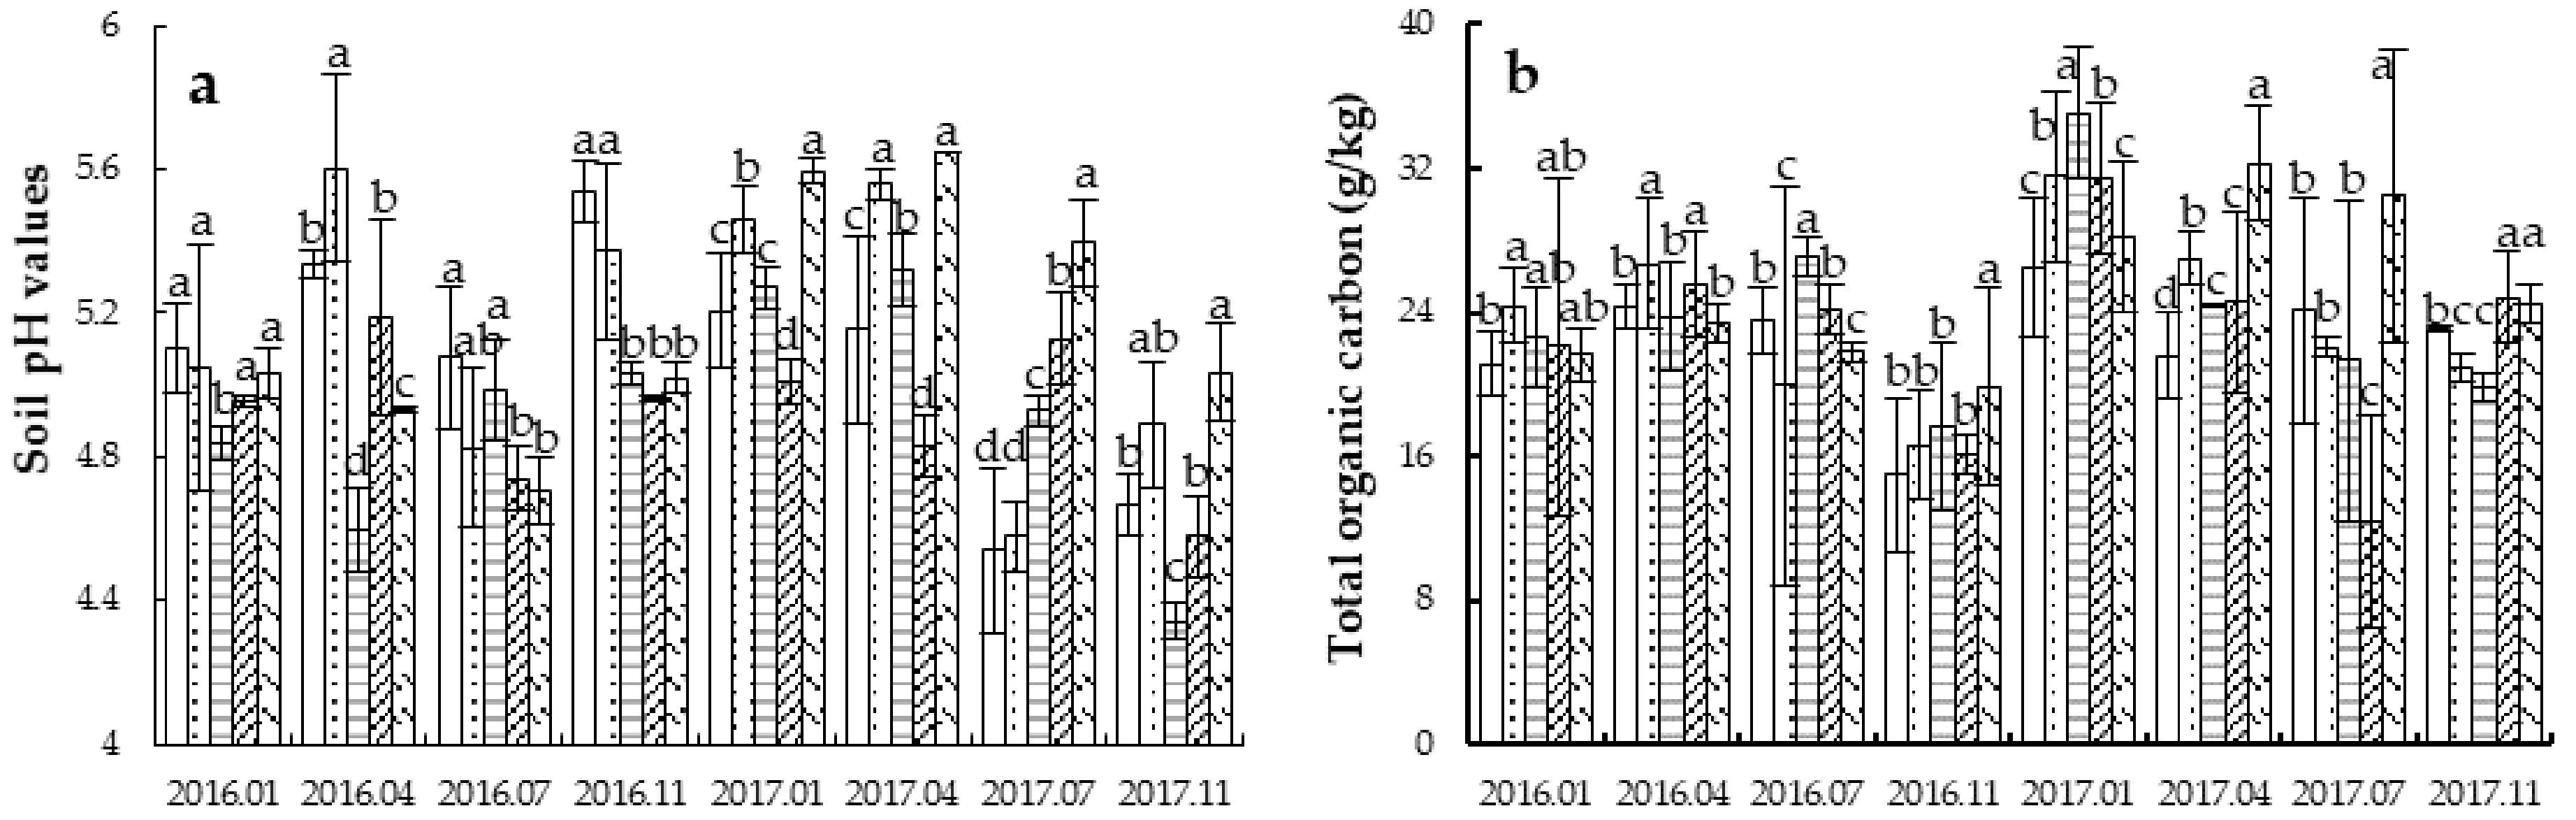
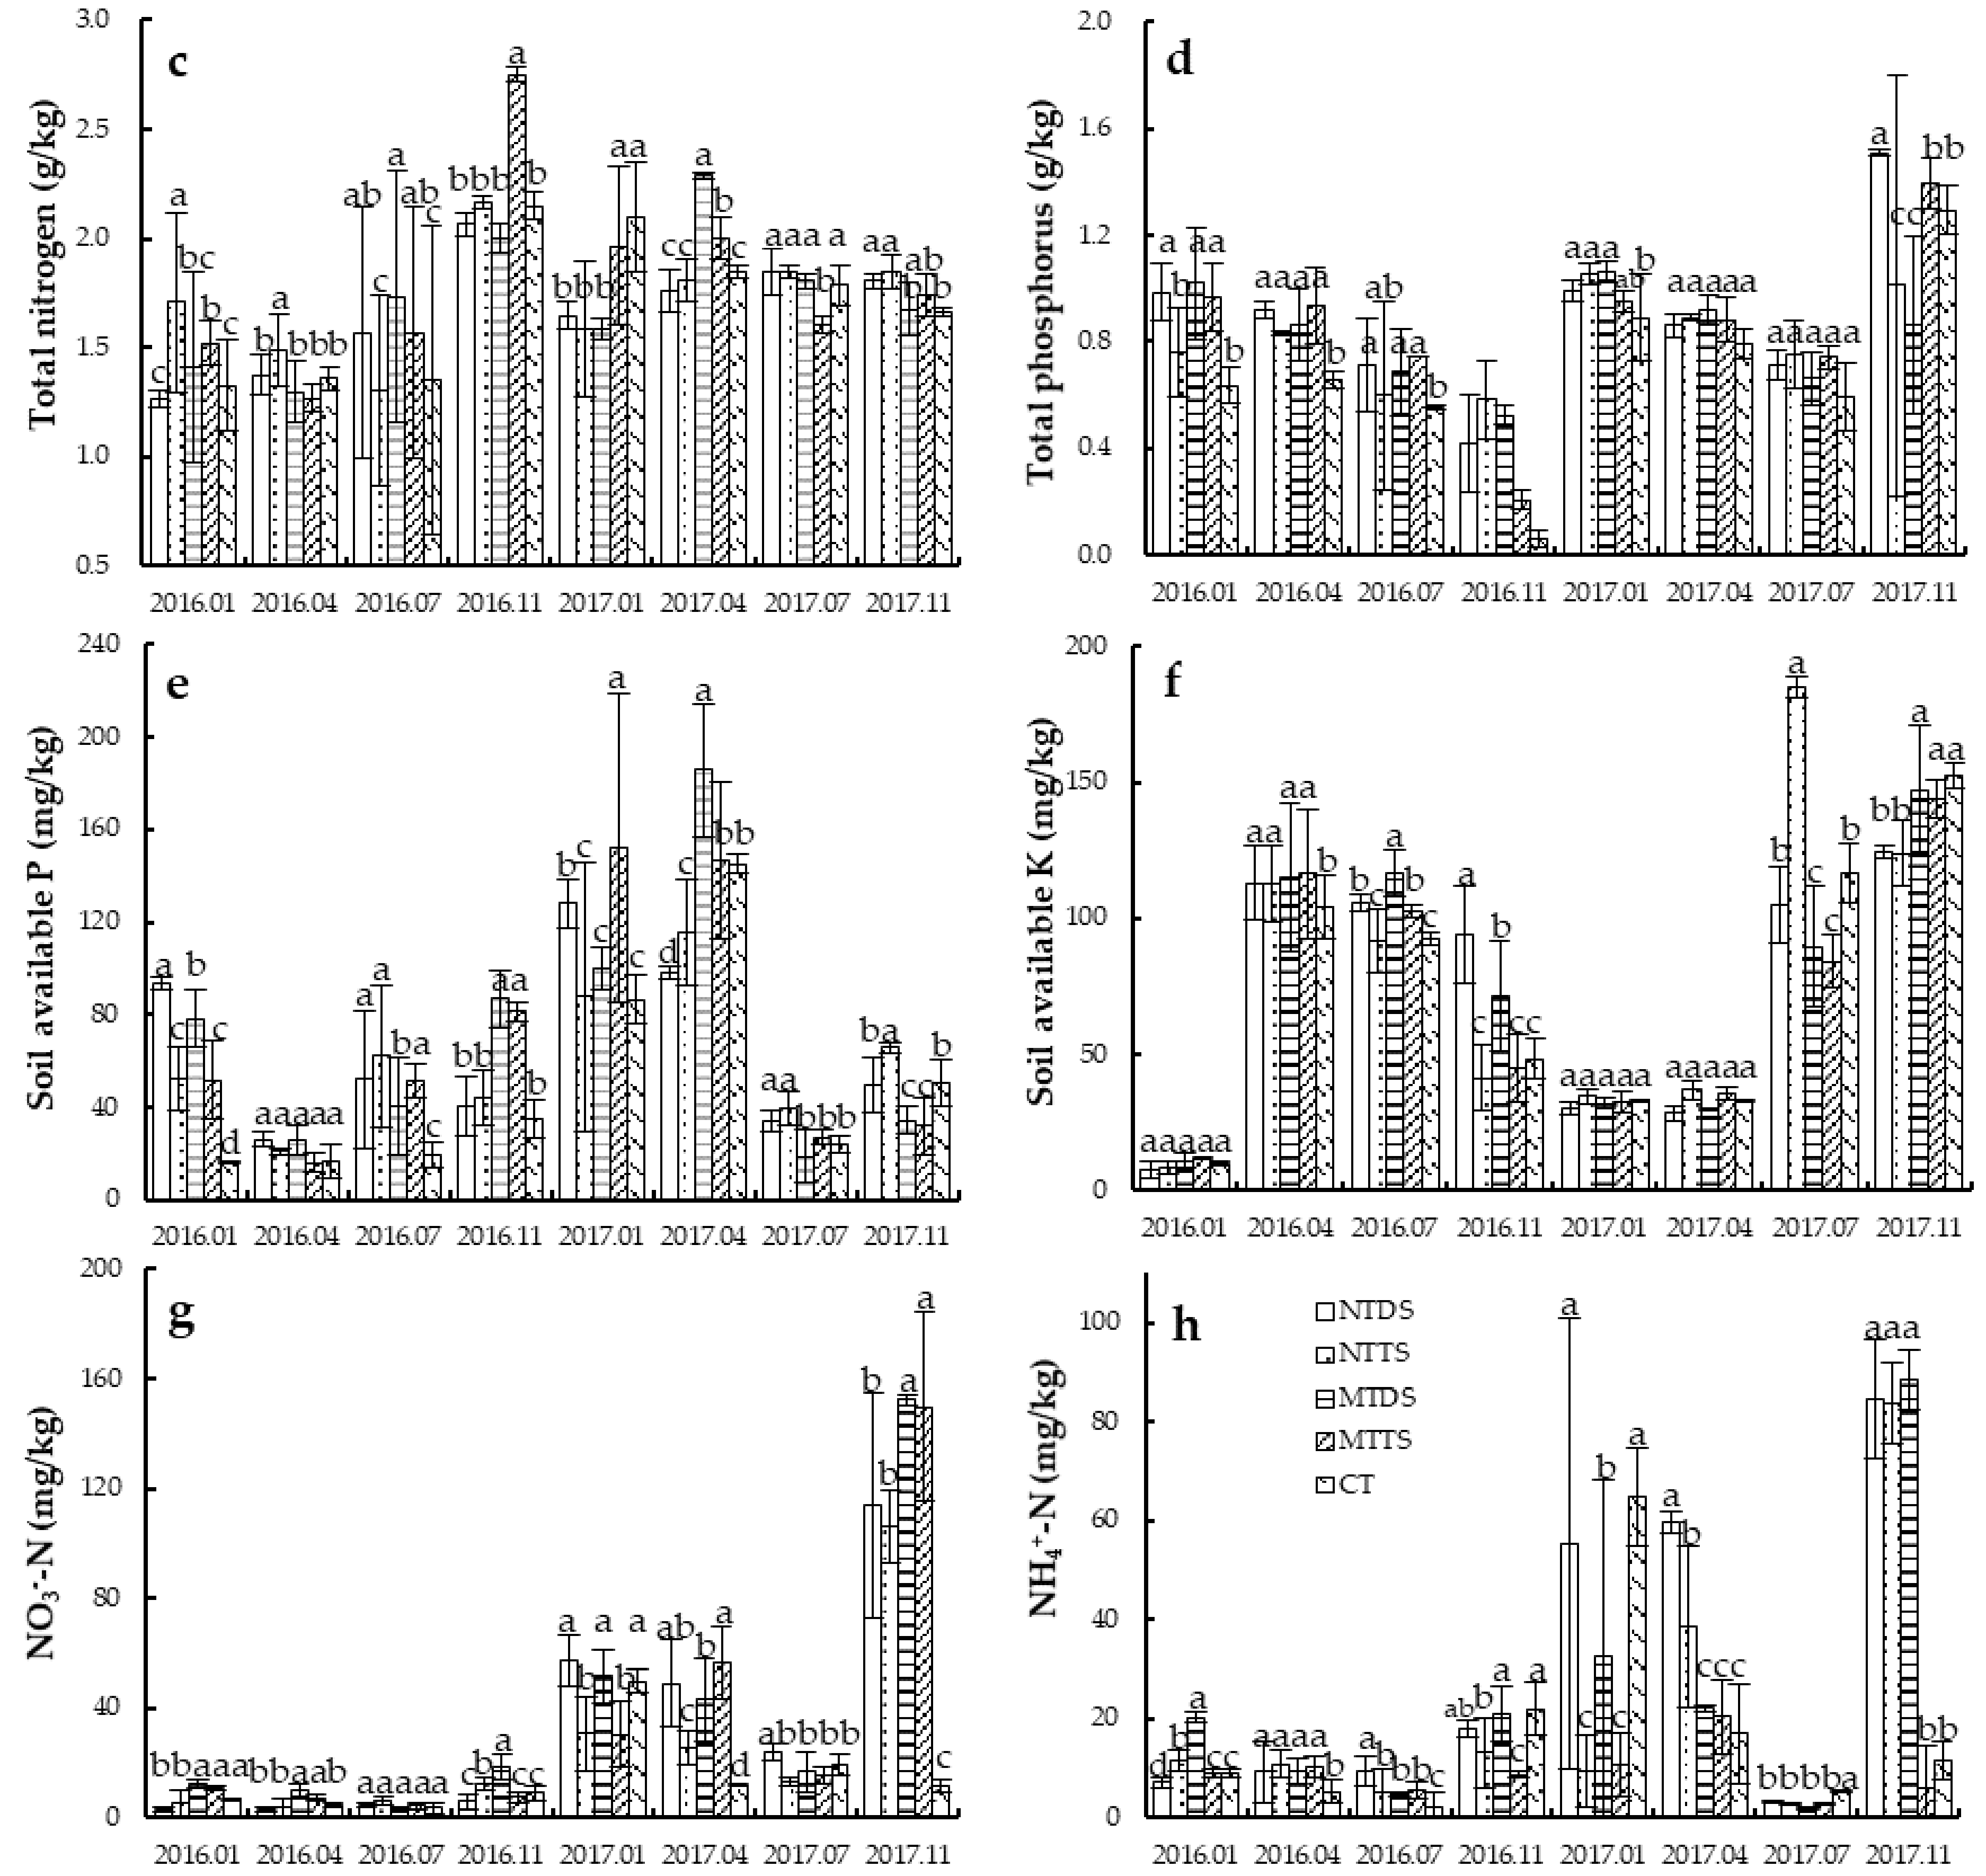
3.2. Soil Chemical Properties at the Depth of 0–20 cm

Results of this study showed that soil pH under conservation tillage measure was in the range of 5.12 to 5.17, while that of CT was 5.17, representing 2.87% lower than CT measure (Figure 2a). The TOC content in the conservation tillage techniques ranged from 22.41 to 23.99 g·kg−1, while that of CT was 25.27 g·kg−1 at the end of the study in 2017. Comparatively, CT recorded a TOC content that was 10.37% higher than conservation tillage techniques (Figure 2b). The two year average TN contents under the conservation tillage measures ranged from 1.67 to 1.80 g·kg−1, while that of CT was 1.70 g·kg−1. This represents a 1.65% increase in TN compared to conservation tillage measures (Figure 2c). The soil TP content ranged from 0.81 to 0.89 g·kg−1 in conservation tillage techniques, while that of CT was 0.68 g·kg−1, representing a 23.96% increase over the CT measures (Figure 2d). The soil AP content in conservation tillage techniques ranged from 61.00 to 71.30 mg·kg−1, with an average value of 66.82 mg·kg−1, while the CT measure was 49.20 mg·kg−1, representing a 35.82% increase over CT (Figure 2e). The soil AP content was 206.33 mg·kg−1 for the conservation tillage technique, while that of CT was 163.81 mg·kg−1, representing 25.96% higher than CT technique.
The average soil NO3–N content was 32.91 mg·kg−1 in conservation tillage measures, while CT recorded 14.65 mg·kg−1. This represents a 124.61% increase in NO3–N under conservation tillage over CT (Figure 2g). The average NH4+–N content for all the soils under conservation tillage measures at the end of the study was 21.78 mg·kg−1, while that of CT was 17.16 mg·kg−1. This shows that conservation tillage measures recorded an average NH4+–N of 26.88%, which was higher than CT (Figure 2h).

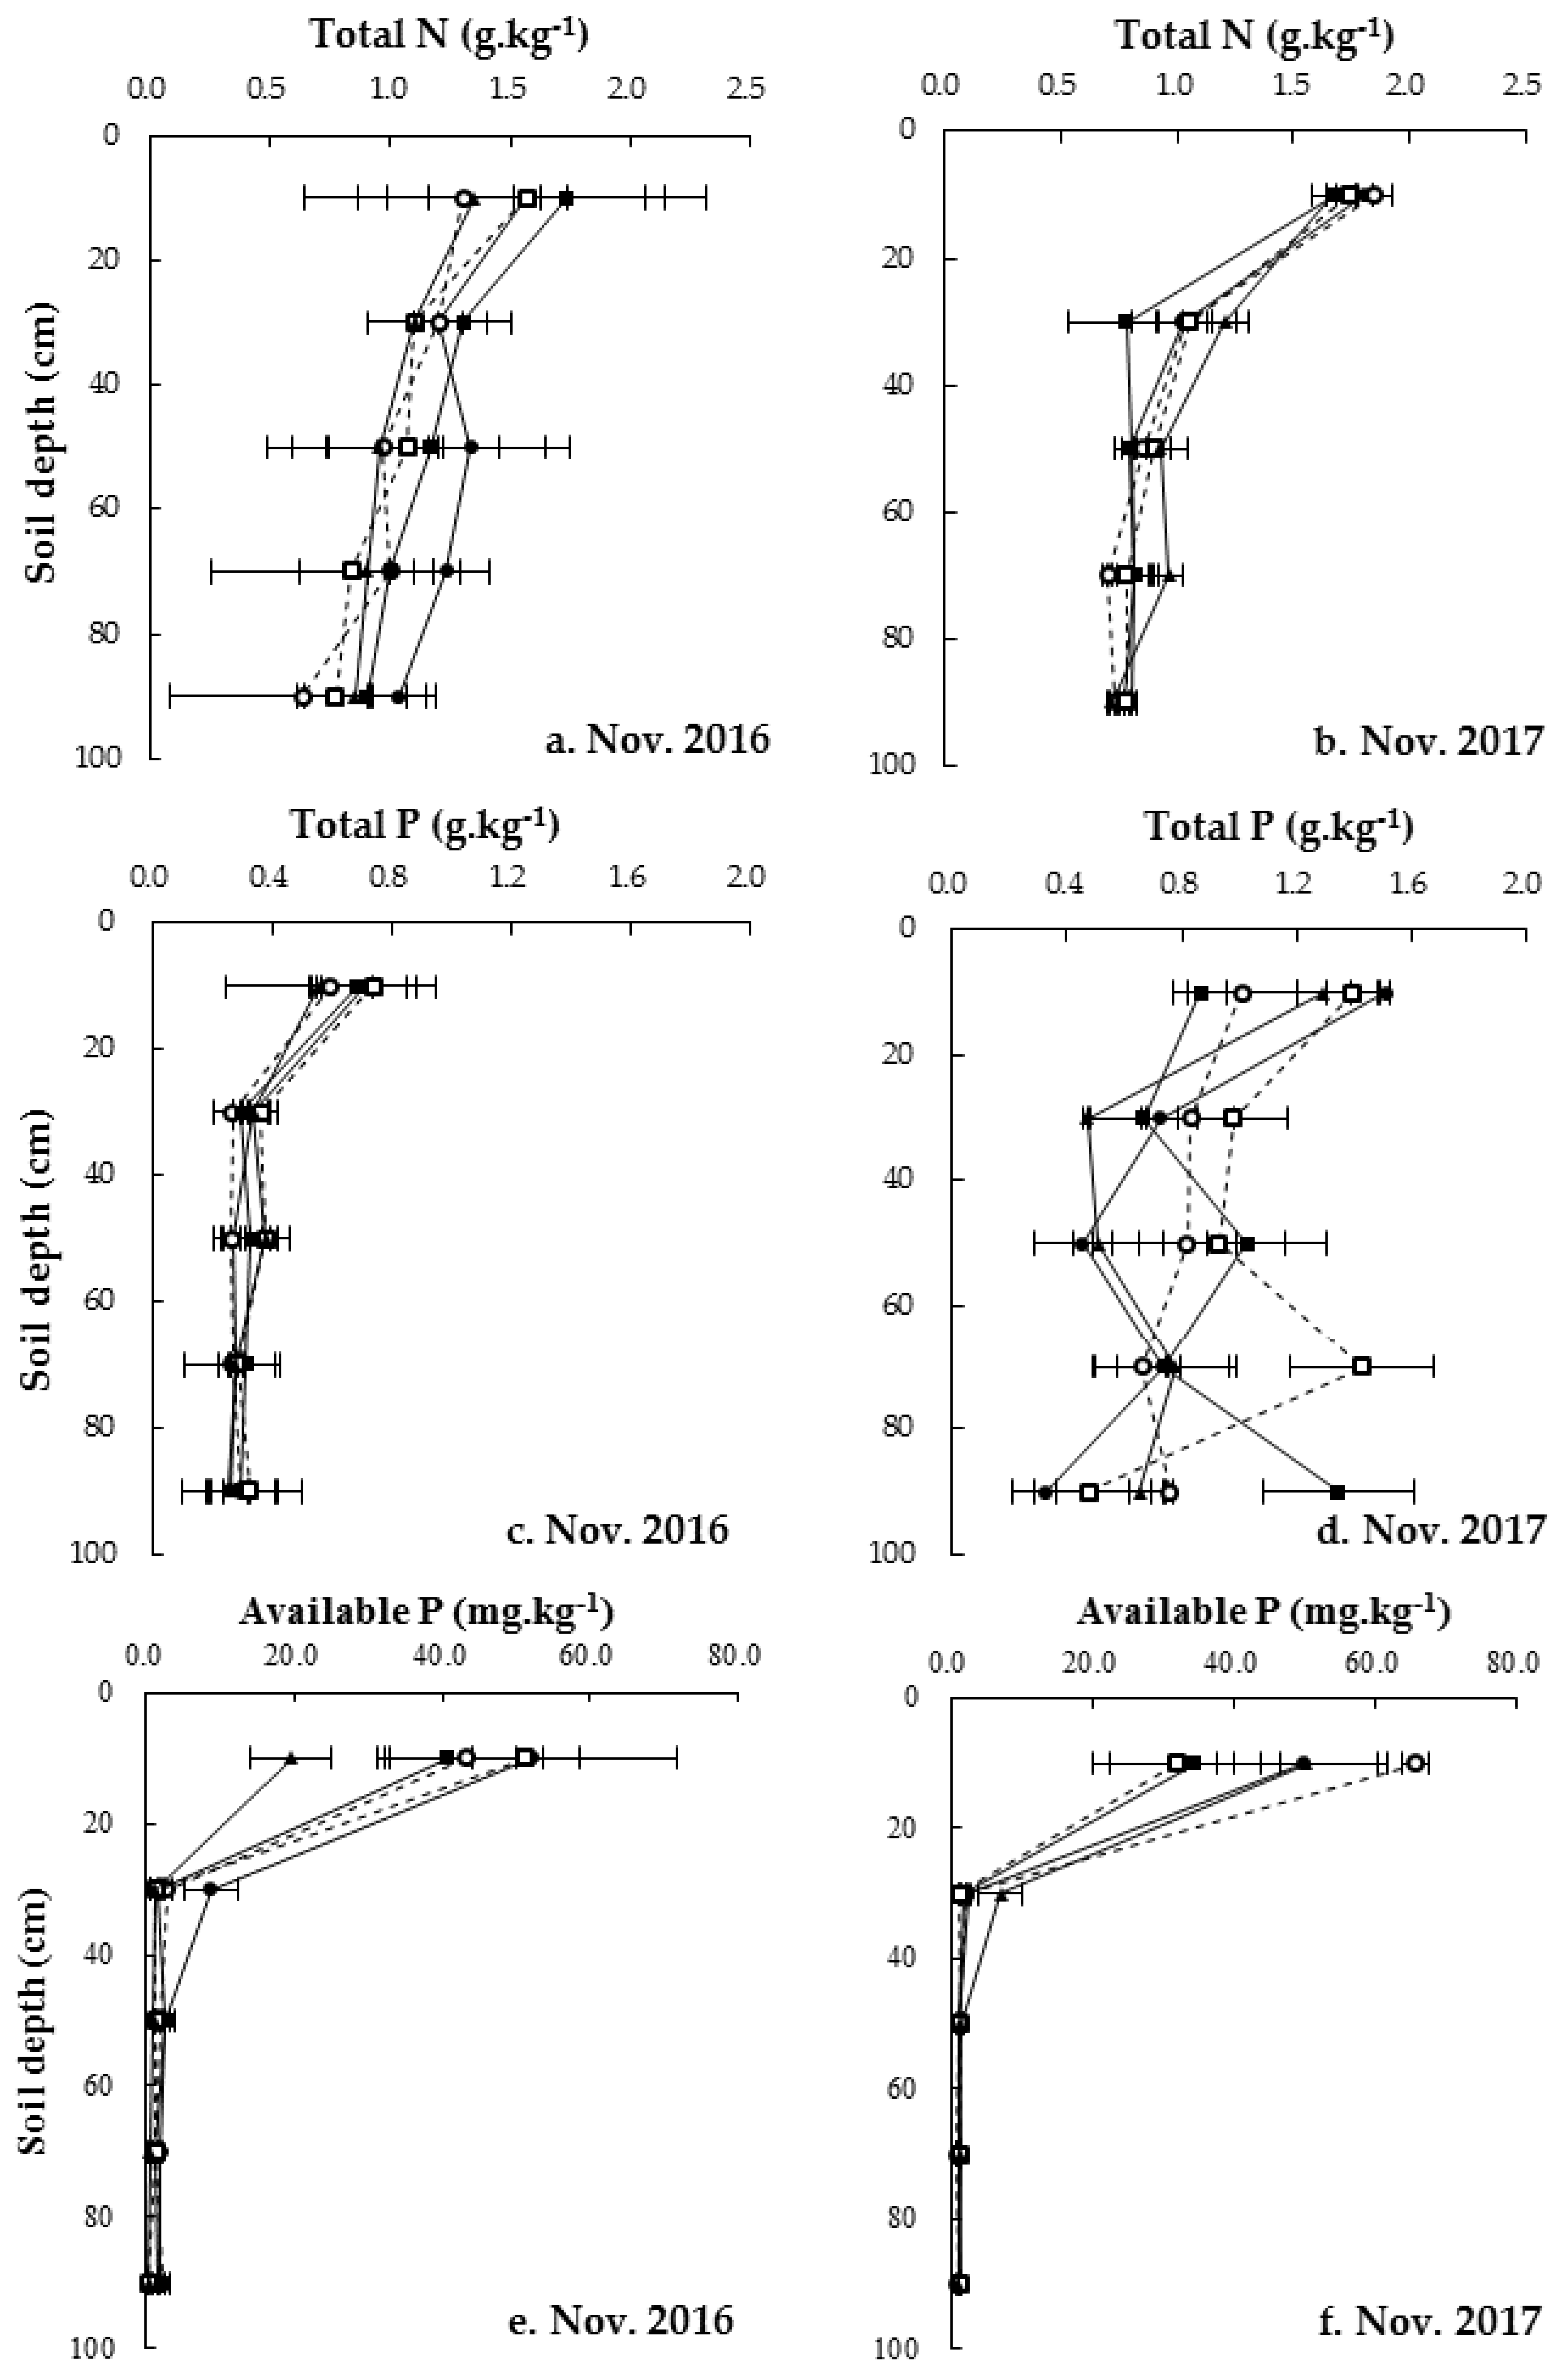
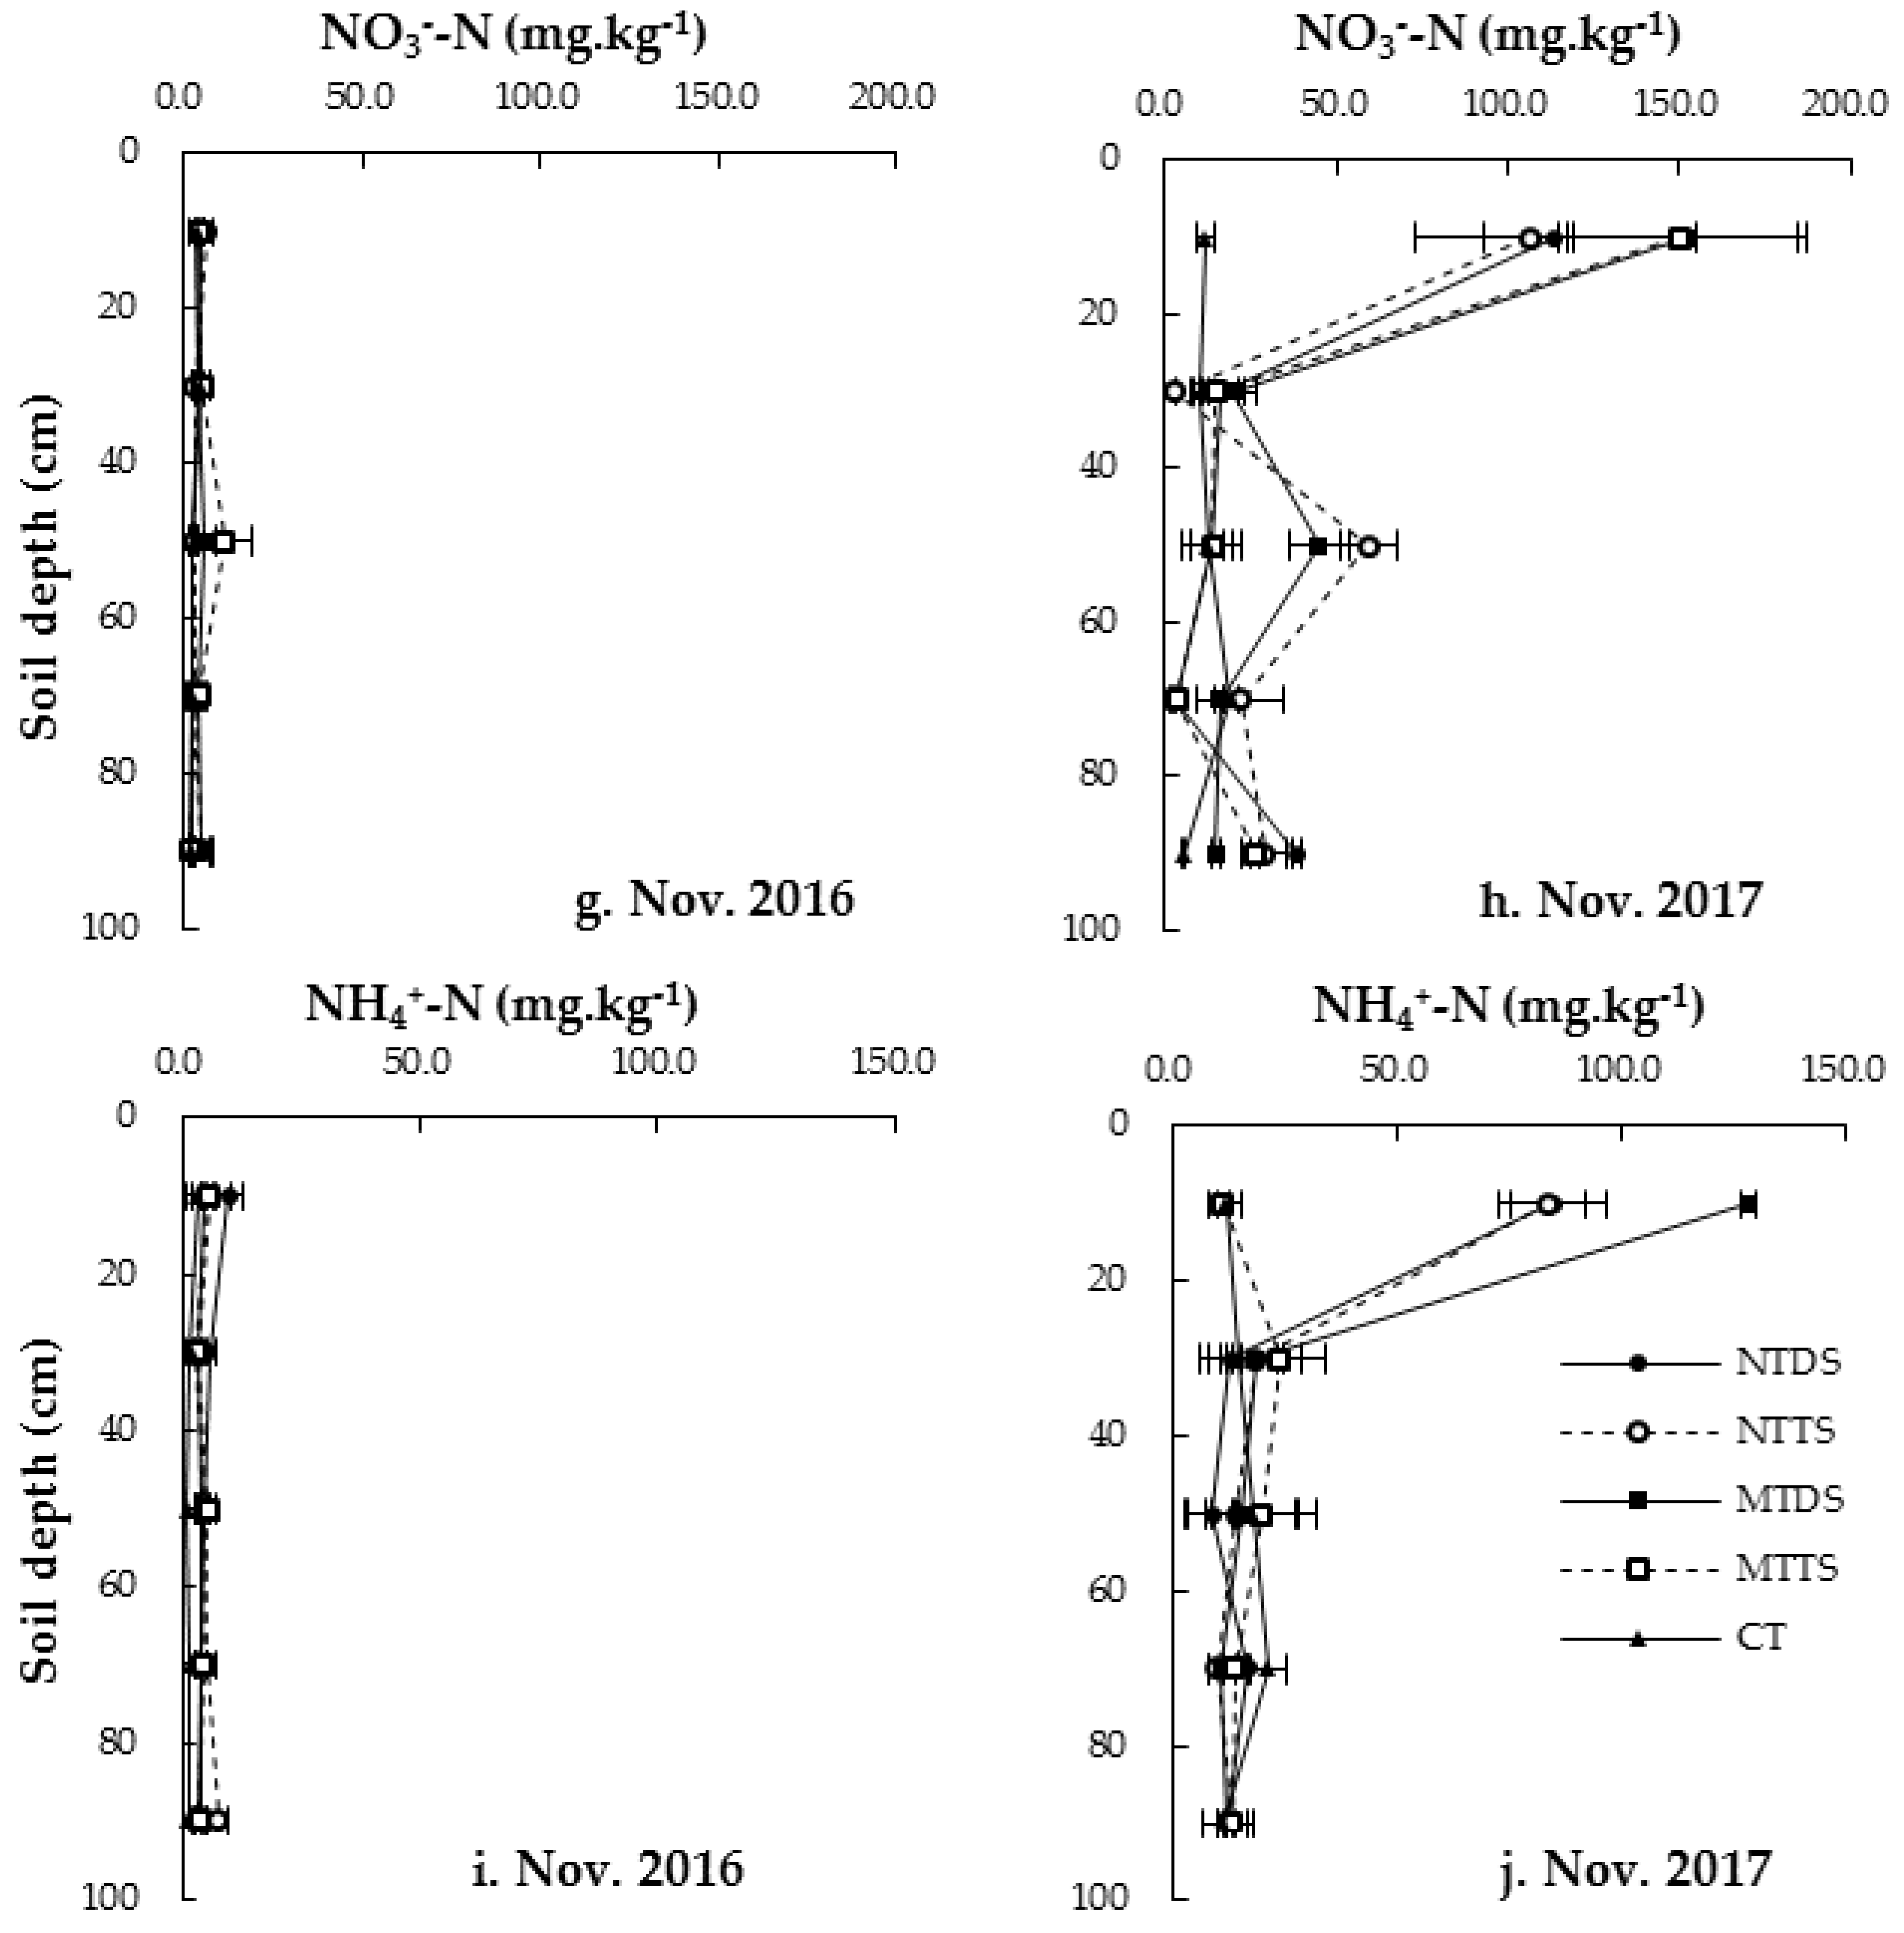
3.3. N and P Movement Along the Soil Profile (0–100 cm) in 2016 and 2017

The results of soil properties, such as TN, NO3–N, NH4+–N, TP, and AP, measured in November 2016 and 2017 are shown in Figure 3. The contents of soil TN in November 2016 and 2017 were different under various tillage conditions. The maximum TN content (1.88 g·kg−1, averaged over different soil depths) was found in MTTS fields and the minimum TN (1.33 g·kg−1, averaged over different soil depths) occurred in MTDS fields for the same years under consideration. The highest content of TN in the soil (1.10 g·kg−1, mean at different depths) appeared under CT conditions, while the lowest content of TN (1.03 g·kg−1) in soil was recorded under NTDS measures. The content of AP was the highest (14.18 mg·kg−1) under NTDS treatment and the lowest was 7.25 mg·kg−1 under the MTDS technique. The highest content of NO3–N (49.65 mg·kg−1) was recorded under the CT treatment (average of different depth), with the lowest content (11.99 mg·kg−1) recorded under CT. The highest content of NH4+–N (36.97 mg·kg−1) was recorded under the MTDS (average of different depth), with CT being the lowest. Total P contents of the soil for 2016 and 2017 were relatively lower under the CT treatments. Similarly, and for the same years, the AP in the soil was relatively higher (30.77 mg·kg−1 averaged over different soil depths) in MTTS fields.
The contents of TN, TP, AP, and NO3–N in the surface soil (0–20 cm) were higher than those in the deep soil (20–40 cm, 40–60 cm, 60–80 cm, 80–100 cm) in NTDS fields, and the mean content of TN surface soil (0–20 cm) was 2.07 g·kg−1, compared to the deep soil (20–40 cm, 40–60 cm, 60–80 cm, 80–100 cm), which was 1.48 g·kg−1 for both years under consideration. Under normal circumstances, the content of TN, TP, AP, NO3–N, and NH4+–N decreased with increasing soil depth, as shown in Figure 3.

3.4. Runoff N and P Loss

Table 3 shows the calculation of N and P loss in runoff sediment and runoff water. At the end of the study in November 2017, TP and TN bound in runoff sediment were in the range of 112–242 g·m−2 and 183–280 g·m−2, respectively. The least TP and TN were recorded under NTTS (113 g·m−2 and 183 g·m−2) and NTDS (112 g·m−2 and 185 g·m−2), respectively. Concentration of TN and TP in runoff water (mg·L−1) were in the range of 1.08–1.71 mg·L−1 and 1.98–2.91 mg·L−1, respectively. The least TN and TP were recorded by NTTS with 1.08 and 1.98 mg·L−1, respectively. In the present study, TP and TN measured in runoff water showed NTTS and NTDS recording the least values, which were significantly different from the rest of the treatments. The order of decrease was NTTS < NTDS < MTTS < MTDS < CT. The highest TP and TN values bound in runoff water recorded under CT were 2.91 and 1.71 mg·L−1, respectively.

4. Discussion

4.1. Tillage Effects on Bulk Density

Within the current study, conservational tillage techniques initially increased bulk density compared to the CT. However, a decrease in bulk density was recorded in the following year under conservation tillage techniques. The reason for the decrease in bulk density under CT was as a result of the complete inversion of the top soil by the tillage implement. This operation impacts the soil aggregate stability, thereby deforming the soil structure. Meanwhile, the surface mechanical compaction associated with reduced soil disturbance is among the possible reasons for the initial higher soil bulk density under the conservation tillage techniques. This result also shows that conservation tillage techniques have a higher tendency to increase the bulk density of the soil with time compared to CT, as shown in Table 2. This probably is as a result of the addition of adequate organic material in the soil, which increased the activities of biological organisms leading to the creation of well interconnected void spaces. Also, the addition of organic materials leads to an improvement in the soil aggregates, hence a decrease in soil bulk density. Comparison of bulk density results for January 2016 and 2017 showed that conservation tillage techniques, such as NTTS and NTDS recorded a decrease of 6.21% and 2.04%, compared to CT with a 2.30% decrease in soil bulk density. A similar trend was recorded in November 2016 and 2017. This finding confirmed the observations that long-term conservation systems may reduce soil bulk density and aggregate stability with increases in SOM and the introduction of cover crops [20]. Also, the increase in SOM is often responsible for greater aggregate stability, since SOM play an important role in binding particles and soil aggregation [21]. Moreover, this result contradicts the work done by Ishaq et al. [22], who also observed no significant effect of tillage methods on soil bulk density.

4.2. Effect of Tillage Methods on Soil Chemical Properties

This result suggests that conservation tillage has a tendency to decrease soil pH, while CT increases soil pH (Figure 2). Other studies have reported acidification in the top soil under the conservation tillage technique and have attributed this to retention of residues on the soil surface [23,24]. Incorporation of maize straw into the conservation tillage techniques was expected to increase the TOC of the soil, however, the results rather showed a decreasing trend. The reason could be as a result of the slow rate of decomposition of the incorporated maize straw, thereby affecting the TOC content of the soil. This slow response to crop and soil management practices and the variable nature of soil organic carbon (SOC) measurements requires a significant amount of time before the direction of change can be determined [25]. Generally, intensive tillage in agricultural systems can lead to a decline in SOC and TN concentrations due to destroying soil structure, exposing soil aggregates, and aggravating SOM decomposition [26]. The adoption of no-till (NT) in many cropping systems can minimize the risks of SOC and TN depletion, thus leading to higher or similar levels of SOC and TN compared with CT [26].
In general, the concentrations of soil TOC and TN increase in the top soil layer under the conservation tillage technique, but there may be either no significant differences or even some decrease compared with CT in the subsoil layers [27]. In comparison with CT, the conservation tillage technique can increase the soil C/N ratio in the surface layer (0–5 cm) and decrease it in the 5–20 cm depth [28]. In addition, the difference in the location of crop residues can result in a higher soil C:N ratio of the surface layer (0–5 cm) under conservation tillage, more so than under CT [29]. Several studies indicate that conservation tillage technique can enhance the stratification of SOC and nutrients due to minimum soil disturbance and residue retention on the soil surface [26]. However, our studies observed more heterogeneous distribution of nutrients under conservation tillage techniques due to the inadequate incorporation of crop residues and fertilizers within the 0–20 cm soil depth, as shown in Figure 1. Also, besides surface placement of organic residue, undisturbed soils offer a suboptimal decomposition environment, thus causing accumulation of SOM at the soil surface [30]. Long term (40–60 years) increases in SOC will probably be caused by the increase of cropping system diversity and changes in residue inputs and composition [31]. Soil TN is an important component of TOC, and greatly influences TOC decomposition and humification rates. Several studies have shown that conservation tillage, such as no-tillage (NT), usually increases soil N content compared to conventional tillage under dry land agriculture [19].
Higher temperature of uncovered soil, disruption of soil aggregates with exposition of protected organic matter to mineralization [32], and more rapid residue decomposition and nitrogen liberation are the main causes to which greater nitrogen mineralization rates can be attributed to in tilled soils [33].

4.3. N and P Movement along the Soil Profile (0–100 cm)

The results from this study provided evidence that CT generally encouraged the movement of soil nutrients mainly due to the lower levels of these nutrients in the surface depth of 0–20 cm compared to the high levels measured at lower soil depths. The reason for the low levels of N and P movement along the soil profile under the conservation tillage technique was probably due to the latter’s ability to reduce surface runoff and infiltration, thereby allowing most of the nutrients to be concentrated at the 0–20 cm soil depth. According to Liang et al. [34], a decrease in runoff was observed in the NT system compared with the CT system, ranging from 16.0 to 37.3% (average 25.9%), from 2008 to 2012, demonstrating a declining rate. The corresponding rates of TN and TP exports varied from 4.1 to 16.9% (average 8.5%) and from 5.6 to 10.3% (average 7.8%), respectively, for NT compared with results for CT [34]. The soil TN, NO3–N, AP and TP measured in November 2017 are also shown in Figure 3. The content of TP was in the range of 0.74–1.04 g·kg−1. Tillage management regimes had significant influences on NO3–N content leaching. However, previous studies on the effect of tillage practices on NO3–N found different results. Soil NO3–N content was higher in a traditional tillage system than in a no-till system located in the northern Great Plains, USA [19]. Similarly, a greater NO3–N content was observed in tilled soils relative to soils without tillage in continuous spring wheat systems [35]. Other studies proposed that tillage increased the moisture diffusion path, causing leaching of soil NO3–N [19]. In our study, the highest content of TP (0–100 cm average) was detected under NTTS at 1.04 g·kg−1, while the lowest content of TP of 0.74 g·kg−1 was recorded under CT measures. The above results suggest that conservation tillage has the tendency to reduce nutrient movement down the soil profile compared to CT.

4.4. Runoff N and P Loss

Highest runoff volume and sediment load were all recorded under CT, with NTTS and NTDS recording the least. The reason could be as a result of the ability of NTTS and NTDS to slow down the movement of water due to the presence of surface cover, straw retention, and good aggregation of soil particles. Furthermore, the incorporation of organic fertilizer in the conservation tillage field improved upon the adhesive and cohesive forces of the soil and reduced the rate of water infiltration, hence the reduction in nutrient movement. A substantial body of research exists on subsurface P transport, with macropore flow considered the primary pathway of transport by passing the reactive matrix of the subsoil [36]. According to Liang et al. [34], runoff is the main carrier of soil nutrients, and so a decrease in runoff volume will lead to a decrease in nutrient movement. In that study, the conservation tillage technique recorded an average N loss of 3.07 kg·ha−1 in runoff compared to 3.39 kg·ha−1 recorded by CT. Average TP loss recorded under conservation tillage techniques was 5.93 kg·ha−1 compared to CT with 7.37 kg·ha−1. This represents a 9.4 and 19.53% TN and TP reduction in runoff loss under conservation tillage techniques compared to CT. The least TN and TP in runoff losses was recorded by NTTS compared to the rest of the conservation tillage techniques and the CT. Conservation tillage could only prevent some of the N and P escaping from the surface soil; in contrast, some N in the form of organic N, or P in the form of soluble P, might have greater leaching potential under conservation tillage technique than under CT practice [34]. Indeed, P leaching has been documented in a wide array of soils, from fine to coarse textured [36], although the inherent integrity and continuity of macropores can profoundly affect P leaching potential, particularly for applied sources [37,38]. In contrast to P, subsurface N transport is generally assumed to be dominated by matrix flow [39], which accounts for a considerably larger proportion of flow in drainage waters than does macropore flow. In general, the amount of N and P loss under conservation tillage treatments (NTDS, NTTS, MTDS, and MTTS) was less than that of CT. However, no-tillage (NTDS and NTTS) had a better effect at reducing total N and P loss due to the retention of these nutrients at the top soil (0–20 cm). This implies that conservational farming, if managed well, can save fertilizer input loss by retaining nutrients in the top soil for efficient utilization by crops, reduce pollutant emissions to water bodies resulting from improved soil structure and texture that discourages the continuous leaching of nutrients, reduce non-point source pollution, and finally protect the ecological environment.

4.5. Implication of Conservation Tillage for NPS N and P Control on the Environment

Results from the study imply that increase and sustainable food production can be achieved with the use of conservation tillage techniques, especially NTDS and MTTS due to their ability to retain soil nutrients at the top 0–20 cm soil layer for proper utilization by plants. Additionally, their unique role in reducing runoff losses means they have the advantage of helping reduce NPS pollutant movement. If well designed and managed, the true role of conservation tillage technologies in reducing non-point source pollution would be realized, leading to an increased food production in an environmentally friendly manner. This research has provided additional insight about changes in physical and chemical properties, as well as NPS N and P movement resulting from practicing conservation tillage, straw retention, and fertilizer management. We observed that changes in physiochemical properties influencing NPS N and P movement require more years of conservation tillage practice to become evident. Therefore, consistent long term experiments up to 5 or more years should be conducted to determine the rate of N and P movement and loss along the soil profile of conservation tillage soil. This will afford researchers the opportunity to make long term decisions regarding environmental monitoring in order to accurately predict the potential effect of agricultural NPS pollution and to make appropriate recommendations to remedy the situation.

5. Conclusions

This study examined the effect of conservation tillage techniques and CT on soil physical and chemical properties, as well as N and P loss in an irrigated dryland farm in southern part of China. Results from the study showed that conservation tillage technique leads to improvement in soil physical and chemical properties by concentrating nutrients at the top soil (0–20 cm), and reduces nutrient movement along the soil profile with a subsequent reduction in potential agricultural NPS pollutants (N and P) compared to the CT. Overall, results of the study indicate that practicing conservation tillage with straw retention and fertilizer application will lead to improved soil nutrients, reduction in NPS N and P load, and will improve soil and water quality of the irrigated dry land farm area of southern China.

Author Contributions

J.-J.W. and Y.-T.L. designed the project. F.I., Z.-Q.Z., and E.A. performed the experiments and data analysis. J.-J.W., Z.Z. and J.-H.L. reviewed the manuscript. J.-J.W. handled the submission process. All authors have read and approved the manuscript.

Funding

This study was supported by the National Key Research and Development Program of China (No. 2017YFD0800103 and 2017YFD0800102), and the National Science and Technology Support Program (No. 2015BAD05B05).

Conflicts of Interest

The authors declare no conflict of interest.

References

  1. Sun, B.; Zhang, L.; Yang, L.; Zhang, F.; Norse, D.; Zhu, Z. Agricultural non-point source pollution in China: Causes and mitigation measures. Ambio 2012, 41, 370–379. [Google Scholar] [CrossRef] [PubMed]
  2. Luo, L.G.; Qin, L.H.; Wang, Y.; Wang, Q. Environmentally-friendly agricultural practices and their acceptance by smallholder farmers in China—A case study in Xinxiang County, Henan Province. Sci. Total Environ. 2016, 571, 737–743. [Google Scholar] [CrossRef] [PubMed] [Green Version]
  3. Norse, D. Non-point pollution from crop production: Global, regional and national issues. Pedosphere 2005, 15, 499–508. [Google Scholar]
  4. Ministry of Environmental Protection of the People’s Republic of China (MEP); National Bureau of Statistics of the People’s Republic of China (NBS); Ministry of Agriculture of the People’s Republic of China (MOA). The First National Survey of Pollution Sources Bulletin. 2010. Available online: http://www.gov.cn/jrzg/2010-02/10/content_1532174.htm (accessed on 6 October 2011). (In Chinese)
  5. Zhu, Z.L.; Chen, D.L. Nitrogen fertilizer use in China—Contributions to food production, impacts on the environment and best management strategies. Nutr. Cycl. Agroecosyst. 2002, 63, 117–127. [Google Scholar] [CrossRef]
  6. Guo, J.H.; Liu, X.J.; Zhang, Y.; Shen, J.L.; Han, W.X.; Zhang, W.F.; Christie, P.; Goulding, K.W.T.; Vitousek, P.M.; Zhang, F.S. Significant acidification in major Chinese croplands. Science 2010, 327, 1008–1010. [Google Scholar] [CrossRef] [PubMed]
  7. Cao, Z.H.; Huang, J.F.; Zhang, C.S.; Li, A.F. Soil quality evolution after land use change from paddy soil to vegetable land. Environ. Geochem. Health 2004, 26, 97–103. [Google Scholar] [CrossRef]
  8. Shen, Z.Y.; Liao, Q.; Hong, Q.; Gong, Y.W. An overview of research on agricultural non-point source pollution modelling in China. Sep. Purif. Technol. 2012, 84, 104–111. [Google Scholar] [CrossRef]
  9. Aziz, I.; Mahmood, T.; Islam, K.R. Effect of long term no-till and conventional tillage practices on soil quality. Soil Tillage Res. 2013, 131, 28–35. [Google Scholar] [CrossRef]
  10. Johnson, L.M.F.; Reicosky, D.; Allmaras, R.; Archer, D.; Wilhelm, W. A matter of balance: Conservation and renewable energy. J. Soil Water Conserv. 2006, 61, 120a–125a. [Google Scholar]
  11. He, J.; Kuhn, N.J.; Zhang, X.M.; Zhang, X.R.; Li, H.W. Effects of 10 years of conservation tillage on soil properties and productivity in the farming-pastoral ecotone of Inner Mongolia, China. Soil Use Manag. 2009, 25, 201–209. [Google Scholar] [CrossRef]
  12. Rahman, M.H.; Okubo, A.; Sugiyama, S.; Mayland, H.F. Physical, chemical and microbiological properties of an Andisol as related to land use and tillage practice. Soil Tillage Res. 2008, 101, 10–19. [Google Scholar] [CrossRef] [Green Version]
  13. Xu, S.; Zhao, Y.; Wang, M.; Shi, X. Comparison of multivariate methods for estimating selected soil properties from intact soil cores of paddy fields by Vis–NIR spectroscopy. Geoderma 2018, 310 (Suppl. C), 29–43. [Google Scholar] [CrossRef]
  14. Ji, W.; Shi, Z.; Huang, J.; Li, S. In Situ Measurement of Some Soil Properties in Paddy Soil Using Visible and Near-Infrared Spectroscopy. PLoS ONE 2014, 9, e105708. [Google Scholar] [CrossRef] [PubMed]
  15. Calvo-Fernández, J.; Taboada, Á.; Fichtner, A.; Härdtle, W.; Calvo, L.; Marcos, E. Time- and age-related effects of experimentally simulated nitrogen deposition on the functioning of montane heathland ecosystems. Sci. Total Environ. 2018, 613–614 (Suppl. C), 149–159. [Google Scholar] [CrossRef] [PubMed]
  16. Wang, J.J.; Zeng, X.B.; Zhang, H.; Li, Y.; Zhao, S.; Su, S.; Bai, L.; Wang, Y.; Zhang, T. Effect of exogenous phosphate on the lability and phytoavailability of arsenic in soils. Chemosphere 2018, 196, 540–547. [Google Scholar] [CrossRef]
  17. He, S.R.; Lu, Q.; Li, W.Y.; Ren, Z.L.; Zhou, Z.; Feng, X.; Zhang, Y.L.; Li, Y.T. Factors controlling cadmium and lead activities in different parent material-derived soils from the Pearl River Basin. Chemosphere 2017, 182, 509–516. [Google Scholar] [CrossRef] [PubMed]
  18. Egan, G.; Crawley, M.J.; Fornara, D.A. Effects of long-term grassland management on the carbon and nitrogen pools of different soil aggregate fractions. Sci. Total Environ. 2018, 613–614 (Suppl. C), 810–819. [Google Scholar] [CrossRef]
  19. Zhang, H.H.; Zhang, Y.Q.; Yan, C.R.; Liu, E.K.; Chen, B.Q. Soil nitrogen and its fractions between long-term conventional and no-tillage systems with straw retention in dryland farming in northern China. Geoderma 2016, 269, 138–144. [Google Scholar] [CrossRef]
  20. Higashi, T.; Yunghui, M.; Komatsuzaki, M.; Miura, S.; Hirata, T.; Araki, H.; Kaneko, N.; Ohta, H. Tillage and cover crop species affect soil organic carbon in Andosol, Kanto, Japan. Soil Tillage Res. 2014, 138, 64–72. [Google Scholar] [CrossRef]
  21. Kabiri, V.; Raiesi, F.; Ghazavi, M.A. Six years of different tillage systems affected aggregate-associated SOM in a semi-arid loam soil from Central Iran. Soil Tillage Res. 2015, 154, 114–125. [Google Scholar] [CrossRef]
  22. Ishaq, M.; Ibrahim, M.; Lal, R. Tillage effects on soil properties at different levels of fertilizer application in Punjab, Pakistan. Soil Tillage Res. 2002, 68, 93–99. [Google Scholar] [CrossRef]
  23. Hickman, M.V. Long-term tillage and crop rotation effects on soil chemical and mineral properties. J. Plant Nutr. 2002, 25, 1457–1470. [Google Scholar] [CrossRef]
  24. Houx, J.H.; Wiebold, W.J.; Fritschi, F.B. Long-term tillage and crop rotation determines the mineral nutrient distributions of some elements in a Vertic Epiaqualf. Soil Tillage Res. 2011, 112, 27–35. [Google Scholar] [CrossRef]
  25. Lal, R. Is crop residue a waste? J. Soil Water Conserv. 2004, 59, 136a–139a. [Google Scholar]
  26. Xue, J.F.; Pu, C.; Liu, S.L.; Chen, Z.D.; Chen, F.; Xiao, X.P.; Lal, R.; Zhang, H.L. Effects of tillage systems on soil organic carbon and total nitrogen in a double paddy cropping system in Southern China. Soil Tillage Res. 2015, 153, 161–168. [Google Scholar] [CrossRef]
  27. Baker, J.M.; Ochsner, T.E.; Venterea, R.T.; Griffis, T.J. Tillage and soil carbon sequestration—What do we really know? Agric. Ecosyst. Environ. 2007, 118, 1–5. [Google Scholar] [CrossRef]
  28. Puget, P.; Lal, R. Soil organic carbon and nitrogen in a Mollisol in central Ohio as affected by tillage and land use. Soil Tillage Res. 2005, 80, 201–213. [Google Scholar] [CrossRef]
  29. Lou, Y.L.; Xu, M.G.; Chen, X.N.; He, X.H.; Zhao, K. Stratification of soil organic C, N and C:N ratio as affected by conservation tillage in two maize fields of China. Catena 2012, 95, 124–130. [Google Scholar] [CrossRef]
  30. Franzluebbers, A.J. Soil organic matter stratification ratio as an indicator of soil quality. Soil Tillage Res. 2002, 66, 95–106. [Google Scholar] [CrossRef]
  31. West, T.O.; Post, W.M. Soil organic carbon sequestration rates by tillage and crop rotation: A global data analysis. Soil Sci. Soc. Am. J. 2002, 66, 1930–1946. [Google Scholar] [CrossRef]
  32. Oorts, K.; Nicolardot, B.; Merckx, R.; Richard, G.; Boizard, H. C and N mineralization of undisrupted and disrupted soil from different structural zones of conventional tillage and no-tillage systems in northern France. Soil Biol. Biochem. 2006, 38, 2576–2586. [Google Scholar] [CrossRef]
  33. Lupwayi, N.Z.; Clayton, G.W.; O’Donovan, J.T.; Harker, K.N.; Turkington, T.K.; Soon, Y.K. Nitrogen release during decomposition of crop residues under conventional and zero tillage. Can. J. Soil Sci. 2006, 86, 11–19. [Google Scholar] [CrossRef] [Green Version]
  34. Liang, X.Q.; Wang, Z.B.; Zhang, Y.X.; Zhu, C.Y.; Lin, L.M.; Xu, L.X. No-tillage effects on N and P exports across a rice-planted watershed. Environ. Sci. Pollut. Res. 2016, 23, 8598–8609. [Google Scholar] [CrossRef] [PubMed]
  35. Sainju, U.M.; Caesar-Tonthat, T.; Lenssen, A.W.; Evans, R.G.; Kolberg, R. Tillage and cropping sequence impacts on nitrogen cycling in dryland farming in eastern Montana, USA. Soil Tillage Res. 2009, 103, 332–341. [Google Scholar] [CrossRef]
  36. Kleinman, P.; Sullivan, D.; Wolf, A.; Brandt, R.; Dou, Z.X.; Elliott, H.; Kovar, J.; Leytem, A.; Maguire, R.; Moore, P.; et al. Selection of a water-extractable phosphorus test for manures and biosolids as an indicator of runoff loss potential. J. Environ. Qual. 2007, 36, 1357–1367. [Google Scholar] [CrossRef] [PubMed]
  37. Djodjic, F.; Borling, K.; Bergstrom, L. Phosphorus leaching in relation to soil type and soil phosphorus content. J. Environ. Qual. 2004, 33, 678–684. [Google Scholar] [CrossRef]
  38. Kleinman, P.J.A.; Church, C.; Saporito, L.S.; McGrath, J.M.; Reiter, M.S.; Allen, A.L.; Tingle, S.; Binford, G.D.; Han, K.; Joern, B.C. Phosphorus Leaching from Agricultural Soils of the Delmarva Peninsula, USA. J. Environ. Qual. 2015, 44, 524–534. [Google Scholar] [CrossRef] [PubMed]
  39. Kladivko, E.J.; Frankenberger, J.R.; Jaynes, D.B.; Meek, D.W.; Jenkinson, B.J.; Fausey, N.R. Nitrate leaching to subsurface drains as affected by drain spacing and changes in crop production system. J. Environ. Qual. 2004, 33, 1803–1813. [Google Scholar] [CrossRef] [PubMed]
Figure 1. Map of sampling sites in Wufengtai Farm, Heyuan City.
Sustainability 11 02397 g001
Figure 2. Effect of tillage treatments on soil chemical properties at a depth of 0–20 cm. Note: (a) is soil pH values under different treatments; (b) is the concentrations of soil total organic carbon; (c) is the concentrations of soil total nitrogen; (d) is the concentrations of soil total phosphorus; (e) is the concentrations of soil available phosphorus; (f) is the concentrations of soil rapid available potassium; (g) is the concentrations of soil NO3–N; (h) is the concentrations of soil NH4+–N
Sustainability 11 02397 g002aSustainability 11 02397 g002b
Figure 3. Soil total N and P along the various soil profiles (0–100 cm depth). Note: (a) is the concentrations of total nitrogen in soil profile obtained in 2016; (b) is the concentrations of total nitrogen in soil profile obtained in 2017; (c) is the concentrations of total phosphorus in soil profile obtained in 2016; (d) is the concentrations of total phosphorus in soil profile obtained in 2017; (e) is the concentrations of available phosphorus in soil profile obtained in 2016; (f) is the concentrations of available phosphorus in soil profile obtained in 2017; (g) is the concentrations of NO3–N in soil profile obtained in 2016; (h) is the concentrations of NO3–N in soil profile obtained in 2017; (i) is the concentrations of NH4+–N in soil profile obtained in 2016; (j) is the concentrations of NH4+–N in soil profile obtained in 2017.
Sustainability 11 02397 g003aSustainability 11 02397 g003b
Table 1. General physical and chemical properties at the experimental site (0–20 cm).
Bulk Density
(g·cm−3)
pHTOC
(g·kg−1)
Total N
(g·kg−1)
Total P
(g·kg−1)
Alkaline-N
(mg·kg−1)
NO3–N
(mg·kg−1)
NH4+–N
(mg·kg−1)
Availa le P
(mg·kg−1)
Available K
(mg·kg−1)
1.67 ± 0.075.05 ± 0.3424.40 ± 2.031.71 ± 0.420.76 ± 0.178.87 ± 2.384.49 ± 1.917.86 ± 2.9226.27 ± 10.12173.33 ± 30.55
Table 2. Soil bulk density at the depth of 0–20 cm.
Tillage Technique2016 Bulk Density (g·cm−3)2017 Bulk Density (g·cm−3)
JanAprilJulyNovemberJanAprilJulyNovember
NTTS1.54 ± 0.07a1.51 ± 0.06a1.40 ± 0.06ab1.44 ± 0.06a1.45 ± 0.03a1.43 ± 0.02a1.38 ± 0.02a1.41 ± 0.02a
NTDS1.47 ± 0.05ab1.48 ± 0.04a1.42 ± 0.02a1.45 ± 0.02a1.44 ± 0.01a1.40 ± 0.01a1.35 ± 0.01a1.41 ± 0.01ab
MTTS1.37 ± 0.02bc1.35 ± 0.02b1.29 ± 0.02cd1.35 ± 0.01ab1.37 ± 0.01b1.17 ± 0.05b1.15 ± 0.09b1.35 ± 0.01bc
MTDS1.34 ± 0.02bc1.33 ± 0.02b1.29 ± 0.01bc1.32 ± 0.01bc1.34 ± 0.01b1.21 ± 0.02b1.19 ± 0.01b1.31 ± 0.01cd
CT1.28 ± 0.01c1.25 ± 0.01b1.18 ± 0.01d1.23 ± 0.01c1.31 ± 0.03b1.16 ± 0.01b1.07 ± 0.04b1.28 ± 0.03d
NTTS: no-tillage transplanting; NTDS: no-tillage direct seeding; MTTS: minimum tillage transplanting; MTDS: minimum tillage direct seeding; CT: conventional tillage. Different letters within a column represent significant differences at the 5% level of significance (LSD).
Table 3. N and P loss in runoff water (g·kg−1) and runoff sediment (g·m−2) in November 2017.
Tillage TechniqueRunoff (mm)Sediment (g·m−2)Runoff Sediment Bound TP (g·m−2)Concentration of TP in Runoff Water (mg·L−1)Runoff Sediment Bound TN (g·m−2)Concentration of TN in Runoff Water (mg·L−1)
NTTS188 ± 17c600 ± 28b113 ± 19c1.98 ± 0.06b183 ± 16c1.08 ± 0.14b
NTDS188 ± 14c600 ± 46b112 ± 14c2.08 ± 0.07b185 ± 17c1.14 ± 0.06b
MTTS263 ± 18b664 ± 25ab222 ± 20b2.34 ± 0.06ab236 ± 24b1.34 ± 0.02ab
MTDS273 ± 18ab655 ± 21ab219 ± 26b2.37 ± 0.18ab237 ± 10b1.36 ± 0.13ab
CT312 ± 4a688 ± 15a242 ± 18a2.91 ± 0.44a280 ± 29a1.71 ± 0.19a
NTTS: no-tillage transplanting; NTDS: no-tillage direct seeding; MTTS: minimum tillage transplanting; MTDS: minimum tillage direct seeding; CT: conventional tillage. Different letters within a column represent significant differences at the 5% level of significance (LSD).

