Abstract
Military government was lifted from Kinmen in 1992. The opening-up of cross-strait relations transformed the island into a tourist destination. This transformation led to electricity and water shortages in Kinmen. With the reduction in the number of troops, military facilities fell into disuse and are now being released for local government use. The aim of this project was to monitor the carbon footprint of a reused military facility during renovation of the facility. The LCBA-Neuma system, a local carbon survey software developed by the Low Carbon Building Alliance (LCBA) and National Cheng Kung University in Taiwan, was used in this project. The system analyzes the carbon footprint of the various phases of the building life cycle (LC) during renovation and carbon compensation strategies were employed to achieve the low carbon target. This project has pioneered the transformation of a disused military facility using this approach. The carbon footprint of energy uses during post-construction operation (CFeu) accounted for the majority of carbon emissions among all stages, at 1,088,632.19 kgCO2e/60y, while the carbon footprint of the new building materials (CFm) was the second highest, at 214,983.66 kgCO2e/60y. Installation of a solar cell system of 25.2 kWp on the rooftop as a carbon offset measure compensated for an estimated 66.1% of the total life-cycle carbon emissions. The findings of this study show that the process of reusing old military facilities can achieve the ultimate goal of zero carbon construction and sustainable development.
1. Introduction
Kinmen, a small island of 150 km2, located off the southeast coast of China, is heavily dependent on tourism and sales of its famed local alcohol. It is highly vulnerable to the consequences of climate change. This has forced the island to adopt a prudent attitude to development, as it needs to be able to respond appropriately to environmental changes [1]. Currently, the special cross-strait relations between Taiwan and China have permitted the lifting of military rule on the island and its wealth of historical battle sites and military structures, including barracks, bunkers, cemeteries, coastal military bases, forts and underground tunnels have become integrated into the natural environment and made Kinmen a famous tourist destination [2].
During the 43 years of military rule, large numbers of military facilities were constructed on Kinmen. The high density and variety of military installations render Kinmen an extremely unusual historical site. After military government was lifted in Kinmen in 1992, troop numbers declined, and numerous military facilities fell into disuse. These facilities, along with land for civilian use, have gradually been handed over to the local government. These changes mean that Kinmen, once a world-famous battlefield, began to fade into obscurity [3]. Previous magistrates of Kinmen attempted to promote it as a tourist destination, resulting in large influx of tourists that worsened the shortages of electricity and water. Thus, the effects of these historical transformations have led the authorities on the island to reconsider its developmental trajectory and explore conservation and reuse of historical sites. Additionally, residents of Kinmen are becoming aware of the importance of the protection of the environment and sustainable management, which are important global issues [4].
With its lack of natural resources, development on Kinmen should be compliant with global trends in sustainability [5]. Thus, the aims of this study were to design a feasible plan to develop disused military facilities and enable Kinmen to achieve its low carbon targets [6].
In this study, part of a disused military facility in Wu Village was converted into a Makerspace center for hosting technology-based inventors, with the remainder developed as a demonstration site for smart buildings with local characteristics. This project employed low carbon approaches to revive the disused military facility as the first completed example of this kind, for architectural education purposes. Moreover, this design may serve as a guide for improving the development of other disused military facilities. To achieve the low carbon targets, this study employed the LCBA-Neuma system, a local carbon survey software developed by the Low Carbon Building Alliance (LCBA) and the Faculty of Architecture at National Cheng Kung University (NCKU). This evaluation method considers both the Building Carbon Footprint and the Total Carbon Footprint (TCF) [7] and using the LCBA-Neuma system, the carbon footprints of the various phases of the building life cycle (LC) during renovation were recorded to understand how its carbon footprint evolved [8].
2. Experimental Details
2.1. Building Life-cycle Carbon Emissions Assessment Tools
There are several commercially-available life-cycle assessment software packages for use in the architectural and construction industries. GaBi (Germany) is a database that includes 800 different resources/materials and manufacturing processes. SimaPro (University of Leiden, The Netherlands) features an Ecoinvent database that contains extensive data of materials from their manufacturing stages. EcoReport (Van Holsteijn en Kemna BV, The Netherlands) is a simplified life-cycle assessment software that can evaluate the environmental impact of products and analyze which products are most environmentally-friendly. The Boustead Model is a tool developed in the UK that contains a large database of energy and fuel products, which can be applied to a variety of complex merchandise. However, differences in local factors greatly affect the accuracy of the assessment and several of the tools cannot assess the environmental impact [9].
This study employed the LCBA-Neuma system [7], which draws on (1) the DoITPro database containing primary data of carbon footprints established by the Taiwan Industrial Research Institute, including data for the use of electricity, oil, fuel, metals, chemicals and plastics [10]; (2) a raw building materials carbon footprint database generated by the Taiwan Architecture and Building Research Institute [11]; and (3) a Neuma-sponsored carbon footprint database of processed building materials and building construction systems generated by the LCBA. LCBA-Neuma database is constructed using data from the most commonly used building materials in Taiwan. The building materials were collected and calculated according to the British Standards Institution (BSI) PAS2050 [12], International Organization for Standardization (ISO) ISO14040 [13] and ISO14067 [14] and Taiwan Environmental Protection Administration (Taiwan EPA, Carbon Footprint-Product Category Rules) [15].
2.2. Transformation Approach
In this study, a disused military facility (Figure 1A,B) currently managed by the local township office was transformed into a Makerspace center in Wu Village. The site is approximately 5 min by car or 25 min on foot from nearby high schools (Figure 1C). The township office agreed to this proposal to transform the building into workshops for inventors, with the remainder of the space used for educational purposes by high-school students and local residents. The process integrated low carbon building strategies into the development of the site with local characteristics. Students thus had the opportunity to experience hands-on development of low carbon designs.
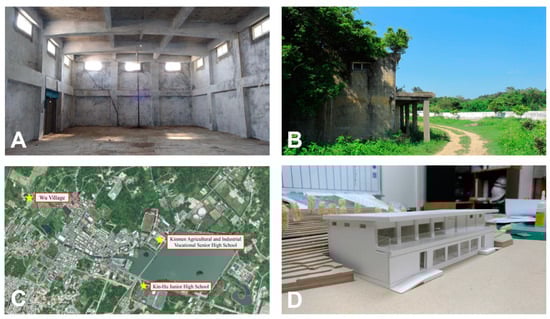
Figure 1.
Indoor (A) and outdoor (B) space of the facility. Location of the military facility (C) and model of the facility after transformation (D).
2.3. Details of the Transformation
The facility was built in the 1970s and its buildings were primarily used as warehouses (Figure 1A). The structure of the main building is a single-story construction with a high ceiling built using hollow brick walls without a basement, with tunnels extending between buildings. This study used a steel structure to build a second-story floor and renovated the outdoor open corridor into an indoor hallway. In addition to providing an indoor space for workshops to be used as the Makerspace center, the design also provided classrooms for use by high-school students and local residents. Outdoors, a solar photovoltaic system, a vertical green wall system and a water recycling facility were installed. These have energy saving and educational demonstration functions.
2.3.1. Transformation Designs
Without affecting the structure of the old building’s exterior shell, an independent structural system was built in the interior spaces of the building. In addition to employing a steel structure to convert the building into two floors, the transformation used low carbon designs, including environmentally-friendly paint and mineral fiber boards, for indoor and outdoor building surfaces and anti-slip terracotta bricks for the outdoor pavement (Figure 1D). The guiding principle was to avoid making unnecessary renovations. Other designs to offset the carbon footprint included a water reclamation system, roof insulation, green roofs, highly-energy-efficient LED bulbs, underground water storage, a solar chimney and a grid-connected photovoltaic generation system [16].
2.3.2. Carbon Inventory
To evaluate the TCF of the building, this project used the Building Carbon Footprint method established by LCBA in 2013. This method classifies the life-cycle of a building into five stages (Figure 2), which include the total carbon footprints of (1) new building materials (CFm); (2) the building construction process (CFc); (3) daily energy consumption (CFeu); (4) renovation and repair materials (CFrm); and (5) demolition and waste disposal (CFdw). The BCF method follows ISO in establishing ISO21930 Sustainability in buildings and civil engineering works -- Core rules for environmental product declarations of construction products and services [17]. EU EN15804, Sustainability of construction works [18], formed the basis for the local carbon inventory. It officially passed the application of Product Category Rules CFP-PCR [19] in 2017. It is a design-oriented assessment, which differs from the conventional product-oriented methods. This assessment tool not only uses the carbon footprint data of materials used in Taiwan but also considers energy types and climatic conditions and can simulate conditions to mimic building use [10,20]. The purpose of the carbon inventory is to identify items related to the bulk of the total carbon emissions and therefore enable designs that can help to achieve carbon neutrality for introduction during the detailed planning stage [21].
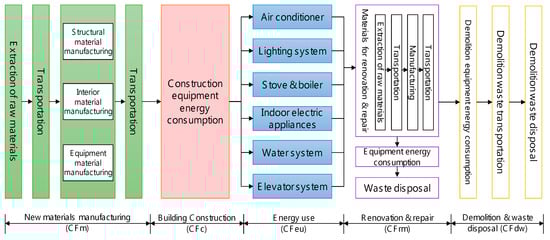
Figure 2.
Carbon footprint calculation for the stages of a building’s life cycle (Taiwan EPA, 2015).
3. Results and Discussion
3.1. Calculation of the Building’s Carbon Emissions across Different Stages of its Life Cycle
The length of a building’s life cycle (LC) was set based on data of carbon footprints of buildings published in 2015 by the Taiwan Environmental Protection Administration (EPA). According to the EPA a building with a reinforced concrete (RC) structure has an average LC of 60 years. Figure 3 and Table 1 show the distribution and calculation of the TCF for each stage of the buildings transformation.
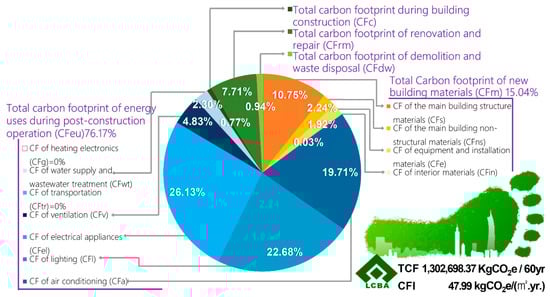
Figure 3.
Carbon footprint allocations of the five stages of the building life-cycle in this study (graphic drawn using LCBA software)

Table 1.
Detailed calculation of the carbon footprints during a building’s life cycle for each stage (unit: kgCO2e/60yr)
3.1.1. Carbon Footprint of New Building Materials (CFm)
CFm = CFs + CFns + CFe + CFin = 214,983.66 kgCO2e/60yr
CFs = 1.19 × [(Cs × W + Cb) × Bc + Cw] × LCr = 154,660.95 kgCO2e/60yr
CFs represents the CF of the construction materials used for the man structure and temporary works, including columns, beams, floors, external walls, structural interior walls and stairs.
Cs is the upper floor structure, Cb is the lower floor structure and Cw is the exterior wall structure. Cs and Cb are calculated based on the floor area, number of floors and seismic zoning coefficient, while CFs was adjusted using a construction factor (W) and life-cycle carbon reduction coefficient (LCr).
In this study, the building had two floors above ground, with a total floor area of 452.44 m2. For the upper floor structure Cs = 80935.00 kgCO2e/60yr, for the lower floor structure Cb = 10883.60 kgCO2e/60yr and for the exterior wall structure, Cw = 5290.29 kgCO2e/60yr. As no blast-furnace slag cement was used, Bc = 1. For the building body, the exterior wall was constructed using hollow bricks, while the 2nd floor was a steel structure. Hence, W was calculated to be 1.26. LCr was 1.0, as no building life extension design was incorporated. Environmental factors (such as air pollution, salt damage, vibration and location) may increase or decrease the LCr and a durable design and high-quality construction can also increase the LCr. As this building was located 2 km off the coast, the value of the LCr was set to 1.1.
CFns = CFow+CFw+CFiw+CFf+CFr = 32,254.60 kgCO2e/60yr
CFns includes the carbon footprints of the exterior wall materials (CFow, 3,170.52), window materials (CFw, 4,206.85), interior partition wall materials (CFiw, 6,927.57), floor materials (CFf, 12,770.98) and roof materials (CFr, 5,178.68).
CFe = CFac + CFe1 + CFe2 + CFe3 + CFt = 27,615.67 kgCO2e/60yr
This formula comprises the carbon footprints for materials used in the air conditioning system construction materials (CFac, 1,568.03), electrical equipment (CFe1, 16,160.75), water resource and drainage apparatus (CFe2, 9,886.89), fire safety equipment (CFe3, 0) and transportation equipment (CFt, 0). CFac and CFe1~3 were estimated by multiplying the floor area by the carbon emission coefficient of the pipeline [10]. CFe3 was 0 because two story buildings are not required by law to have a sprinkler system. CFt was calculated based on the materials, size and motor capacity, as reported in previous studies [10,22]. However, since no elevator or escalator was included in the design, CFt = 0.
CFin = 1.0 × AFIi = 452.44 kgCO2e/60yr
As only simple indoor painting was applied on the blank concrete walls, CFin was only 1.0 kgCO2e/m2 [10]. Based on the floor area of the main building (AFIi) being 452.44 m2, CFin was 452.44 kgCO2e/60yr.
3.1.2. TCF during Building Construction (CFc)
CFc = (0.286 + 0.589 × S + 1.327 × Sb) × AF × (1 + CFrm/CFm) × Lcr = 1107.49 kgCO2e/60yr
CFc includes the CF of the new construction and renovation/repair works stages. It was estimated based on the number of building floors, floor area and building carbon emission density. As these two stages are directly proportional in most situations, the calculation of CFc was adjusted by multiplying by (1+CFrm/CFm) [10,23].
3.1.3. TCF of Energy Uses during Post-construction Operation (CFeu)
CFeu = CFa + CFl + CFel + CFv + CFwt + CFtr + CFg = 1,088,632.19 kgCO2e/60yr
This item comprises the carbon footprints of energy used for air conditioning (CFa), lighting (CFl), electrical appliances (CFel), ventilation (CFv), water and wastewater treatment (CFwt), transportation (CFtr) and heating electronics (CFg). Because the building had no passenger elevator (CFtr) or heating system (CFg), these two items were both 0. The carbon emission coefficient of electricity, which is based on the report “Carbon Emission Coefficients of The Electricity” published by the Bureau of Energy, Ministry of Economic Affairs, Taiwan, 2017, β was equal to 0.554 kgCO2e/kWh [24].
The values of CFa, CFl and CFel were obtained based on the “Dynamic Energy Use Intensity Indicator Method” from the Green Building Assessment Handbook published by Lin et al. [25] and were 49 kWh/m2y, 35 kWh/m2y and 25 kWh/m2y, respectively. These numbers were then multiplied by the area of each item and the energy-saving potential and electrical carbon emissions reduction coefficient were also taken into account. During the operation of a normal 60-year building LC, the values of carbon emissions for CFa, CFl and CFel are 283,712.73, 326,348.59 and 375,977.64 kgCO2e/60yr, respectively.
CFv includes the energy consumption of the ventilation systems in the indoor parking lot and toilet space. In this case, there was no indoor parking but 32.42 m2 of toilet space was included. Thus, CFv was calculated to be 69,443.64 kg CO2e/60yr.
CFwt = Wt × β × LC = 33,149.59 kgCO2e/60y
Wt denotes the electricity use for the water supply and wastewater treatment and Wt = (Qw × Ewp + Qw × Ewt) × Rw. In this case, Qw = 1723.90 m3/yr. Since water conservation products, including the water-efficient toilet water tank and faucets, were used throughout the building, Rw was 0.65. According to a previous study, the electric water pump density (Ewp) and electric wastewater treatment (Ewt) density were 0.08 kWh/m3 and 0.81 kWh/m3, respectively [26]. Wt was calculated at 1534.27 kWh/y.
3.1.4. TCF of Renovation and Repair (CFrm)
CFrm = CFns* + CFe* = 110,934.06 kgCO2e/60yr
This item includes CFns and CFe, multiplied by the estimated number of renovations and repairs required during the entire life cycle. The RT numbers were chosen based on a previous study performed in Taiwan [10], with RT values shown in Table 2.
Table 2.
Calculation of the total carbon footprint of renovation and repair materials (CFrm; unit: kgCO2e/60yr)
3.1.5. TCF of Demolition and Waste Disposal (CFdw)
CFdw = (CFd + CFwa) × (1.0+CFrm/CFm) × LCr = 13,497.00 kgCO2e/60yr
This item includes the carbon footprints related to demolition (CFd, 963.70) and waste disposal (CFwa, 7108.67).
3.1.6. Carbon Footprint of User’s Own Self-certified Carbon Reduction (CFo)
CFo1 (CF reduction by solar photovoltaic system) = [CF reduction from power generated by solar photovoltaic system]—[CF of solar photovoltaic system manufacturing] = 23,579.35 kgCO2e/20yr. The CF reduction of the solar power system was calculated based on the average daily solar radiation, solar photovoltaic capacity and carbon emission coefficient. With an average life cycle of 20 years, the 14 panels of the 2.1 kWp solar photovoltaic system were estimated to generate sufficient power to reduce the CF by 25,478.46 kgCO2e [27]. The CF for the manufacturing of the solar photovoltaic system (solar wafers, steel frame and cement base) was 904.34 kg CO2e/kW. Thus, the system in this case generated a CF of 1899.11 kgCO2e.
CF reduction from reuse of the old building (CFo2)
The main structure of the old building body was a one story, high ceilinged (hollow brick wall) structure with no basement. The renovation created a second floor using a steel structure and the exterior open corridor was renovated into an indoor hallway for the first floor. After renovation, the total floor area was increased from 239.2 m2 (one floor) to 452.44 m2 (two floors). As shown in Figure 4, the CF reduction from reuse of the old building (CFo2) was calculated using the method described in Section 3.1.1; thus, CFo2 = CFs of the old building (i.e., 10,2876.68 kgCO2e).
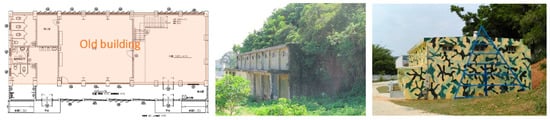
Figure 4.
Schematic diagram of the reuse of the old building (left: floor plan of 1F, center: before renovation, right: after renovation).
Based on the aforementioned information, the TCF of the building in this study during its 60-year life cycle was projected to be 1,302,698.37 kgCO2e/60y. The itemized values of each building stage are listed in Table 1. When the TCF is converted to carbon emissions per unit of floor area, the Carbon Footprint Index (CFI) is obtained: CFI = TCF/Floor Area (AFI)/LC = 47.99 kgCO2e/m2y. The results indicated that the energy use during the post-construction operation stage (or CFeu, which was 1,088,632.19 kgCO2e/60y) formed the major part of the building’s LC carbon emissions.
3.2. Analysis of Bulk Carbon Emissions
Table 1 and Figure 5 show carbon footprints of the five stages. CFm, CFc, CFeu, CFrm and CFdw were 15.04%, 0.08%, 76.17%, 7.76% and 0.94%, respectively. When the carbon footprint of each stage were plotted into a pie chart (Figure 5) as a percentage, CFeu is clearly the major source of energy consumption. This was in agreement with a previous study [28] showing that daily energy use accounts for the major proportion of the carbon footprint of a building. The second highest carbon emissions were those arising from new building materials. Carbon emissions arising from renovation and repair materials ranked third. While certain daily energy consumption is unavoidable, introducing a low carbon design and using recycled materials can help to reduce the demand for the import of new building materials to the island, effectively reducing carbon emissions [29].
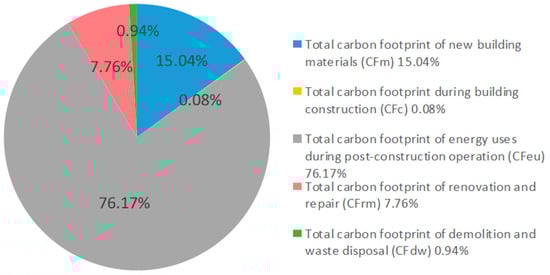
Figure 5.
Allocation of the carbon footprint in the five stages of the building life cycle.
3.2.1. Assessment of Daily Energy Consumption
The carbon footprint allocation of the daily energy consumption can be classified into appliances (CFel = 34.54%), lighting (CFl = 29.98%), air conditioning (CFa = 26.06%), ventilation (CFv = 6.38%) and water supply and drainage (CFwt = 3.05%) (Figure 6). As no elevator or escalator was installed, CFtr = 0%. Since no bathroom hot water or kitchen cooking equipment were required, CFg = 0%. If energy-saving sockets and Energy Star-qualified appliances are used, the energy consumption will be reduced. Additionally, the use of automatic dimming controls, high-reflectance white coating in combination with fluorescent lamps, infrared remote-control light switches, light sensors by windows for automatic adjustment of indoor lighting and zoning (daylight versus control zones) will further reduce the energy consumption by lighting. As the ventilation areas are as high as 240.06 m2 because most areas are close to open windows, the air-conditioning usage in spring and autumn will be reduced. As a split-type air conditioning system was used, the proportion of CFa was lower than that of ordinary buildings.
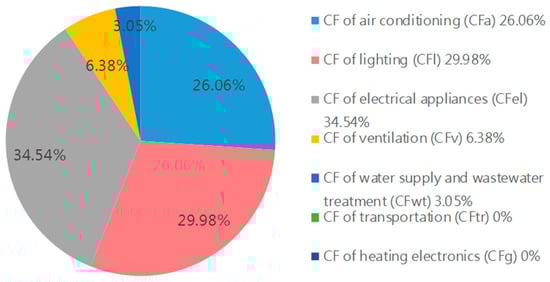
Figure 6.
Allocation of the carbon footprint of daily energy consumption.
3.2.2. Carbon Footprint of Building Construction Materials
The allocation of the carbon footprints of the materials used for new building construction and renovation/repair is shown in Figure 7. The CF of the main structural construction accounted for the majority of the total CF, which was 47.45%, followed by the CF of equipment materials (CFe: 19.83%), exterior walls (CFow: 11.67%), flooring (CFf: 11.43%) and roof exterior construction (CFr: 4.77%). Other minor items were the outside windows (CFw: 2.58%), interior partition wall materials (CFiw: 2.13%) and basic blank decoration for the interior (CFin: 0.14%).
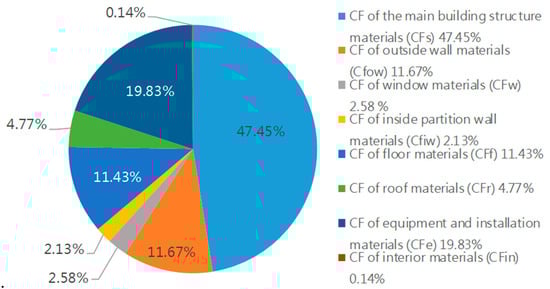
Figure 7.
Distribution of the carbon footprint of CFm and CFrm.
3.3. Discussion of Result
This study employed LCBA-Neuma, a tool for assessing the life-cycle carbon emissions of buildings. It uses data for local materials and found that the two main sources of carbon emissions of this building over its life cycle were the carbon footprint from daily energy consumption (CFeu, 1,088,632.19 kgCO2e/60y) and new building materials (CFm, 214,983.66 kgCO2e/60y). CFeu accounts for 76.17% of the building’s TCF over a life cycle of 60 years, with a carbon footprint of approximately 1,965,040.05 kW (1 kWh electricity generates carbon emissions of 0.554 kg CO2, Taiwan Power Company, 2017). CFeu = CFa + CFl + CFel + CFv + CFwt + CFtr + CFg (Figure 5) air conditioning = 512, 089.43 kW (CFa = 26.06% of CFeu), lighting = 589, 119.01 kW (CFl = 29.98% of CFeu), Electrical appliances = 678,724.83 kW (CFel = 34.54% of CFeu), ventilation=125,369.55 kW (CFv = 6.38% of CFeu) and drainage = 59,933.72 kW (CFwt = 3.05% of CFeu). Transportation CFtr and heating electronics CFg are both 0 (see Section 3.2.1). From these results the conversion can clearly express the energy needs of the building’s equipment in the future after the completion of the renovation. The building in this study had a flat roof of 300 m2 (10 m × 30 m) and a double-layered system of 126-piece solar photovoltaic panels (1 m × 2 m, 200 Wp each) that generates 25.2 kWp. The CF for the manufacturing of the solar photovoltaic system of 20 years (solar wafers, steel frame and cement base) was 904.34 kg CO2e/kW, meaning that the system in this case generated a CF of 68,368.10 kgCO2e over the assumed 60 years life of the building. Based on calculations from Lin, 2018 [10] and Lin, 2015 [25], the daily average solar radiation in Kinmen is 3.8 kWh/m2day, yielding 76.61 kWh/day of electricity, which can cut carbon emissions by 15,491.31 kgCO2/year. For a reinforced concrete building with an average LC of 60 years, this design can compensate for 66.1% of the TCF. Furthermore, from the results shown in Figure 3, the CFs of lighting (CFl) and wastewater treatment (CFwt) can be significantly reduced using highly energy efficient LED bulbs and installing a water reclamation system. In addition, installation of roof insulation and green roofs further helps to achieve the low carbon target. These measures are expected to neutralize an additional 33.9% of the TCF. Even in the future, the building can achieve zero-detection targets through other low-carbon methods.
4. Conclusions
Because of its historical background, similar facilities may be found across Kinmen Island. This study represents only a single feasible approach and process, out of many possible approaches. It shows, however, that old military facilities do not have to be completely demolished. Instead, their life cycle can be extended through low-carbon renovation. Thus, dismantling the buildingand increasing the environmental load on the island can be avoid. This study demonstrated that carbon inventory analysis prior to reviving a disused building can help to identify the major carbon emissions stages of the overall building LC. Once these key carbon footprint items are found, designs that can help to achieve carbon neutrality may then be introduced at the planning stage. Therefore, analysis of a building carbon footprint over its LC is important, as it can significantly lower the carbon footprint of the building during its future operation. We used the locally-produced LCBA-Neuma software to evaluate the carbon footprint of the building retrofitting. This method is both reasonable and feasible. The carbon footprint of each material is based on local conditions and data from the Taiwan EPA and the BSI (British Standards Institution). Therefore, the calculated carbon footprint is more credible since the software follows both local and international methods, data and definitions.
The results showed that revival of an old building can be designed for zero-carbon construction [30]. The study provides a useful example of using a carbon inventory to identify methods that create unnecessary carbon footprints and achieving low carbon or even zero carbon targets when transforming and reviving a disused military facility. This approach can reduce greenhouse gas emissions by decreasing waste and reducing traditional energy usage, which is in line with the vision of Kinmen as a low carbon island and enables us to evaluate methods for achieving sustainable development.
Funding
This research was funded by [Taiwan Ministry of Science and Technology] grant number [MOST 107-2410-H-507-006-].
Acknowledgments
This study was partially supported by Taiwan Ministry of Science and Technology (Funding number: MOST 107-2410-H-507-006-) and was also sponsored in part by the Environmental Education and Low Carbon Island Research Center of the author’s institute.
Conflicts of Interest
The author declares no conflict of interest.
References
- Barnett, J.; Campbell, J. Climate Change and Small Island States: Power, Knowledge and the South Pacific; Earthscan: London, UK, 2010. [Google Scholar]
- The Preservation and Re-Activation of Historical Sites of Battlefields. Kinmen Daily News; 28 September 2008. Available online: http://www.kmdn.gov.tw (accessed on 12 June 2017).
- Chiang, B.W. Preliminary Plan for the Regeneration and Management of The Military Facilities in Kinmen; Kinmen County Government: Kinmen County, Taiwan, 2007. (In Chinese)
- Liu, H.-Y. Regeneration of Kinmen military installations through the integration of renewable energy technologies and battlefield resources. Renew. Energy 2012, 43, 165–171. [Google Scholar] [CrossRef]
- Kucukvar, M.; Egilmez, G.; Tatari, O. Life Cycle Assessment and Optimization-Based Decision Analysis of Construction Waste Recycling for a LEED-Certified University Building. Sustainability 2016, 8, 89. [Google Scholar] [CrossRef]
- Cheng, Y.-H. Architects & Associates The Inventory and Planning for the Regeneration of the Existing Military Installations in Kinmen; Kinmen County Government: Kinmen County, Taiwan, 2006. (In Chinese)
- LCBA-Neuma 2018. Low Carbon Building Alliance (LCBA). Available online: http://www.lcba.org.tw/ (accessed on 1 November 2018).
- Kim, T.; Lee, S.; Chae, C.U.; Jang, H.; Lee, K. Development of the CO2 Emission Evaluation Tool for the Life Cycle Assessment of Concrete. Sustainability 2017, 9, 2116. [Google Scholar] [CrossRef]
- Industry Technology Research Institute (ITRI). Carbon Footprint Calculation Platform; ITRI: Hsinchu City, Taiwan, 2016. [Google Scholar]
- Lin, H.-T. Construction Industry Cabon Footprint; Chan’s Arch-Publishing Co. Ltd.: Taipei, Taiwan, 2018. (In Chinese) [Google Scholar]
- Lasvaux, S.; Habert, G.; Peuportier, B.; Chevalier, J. Comparison of generic and product-specific Life Cycle Assessment databases: Application to construction materials used in building LCA studies. Int. J. Life Cycle Assess. 2015, 20, 1473–1490. [Google Scholar] [CrossRef]
- British Standards Institution. PAS 2050:2011—Specification for the Assessment of the Life Cycle Greenhouse Gas Emissions of Goods and Services; BSI: London, UK, 2011; ISBN 978-0-580-71382-8. [Google Scholar]
- International Organization for Standardization. ISO 14040:2006 -Environmental Management—Life Cycle Assessment—Principles and Framework; International Organisation for Standardisation: Geneva, Switzerland, 2006. [Google Scholar]
- International Organization for Standardization. ISO/TS 14067:2013—Greenhouse Gases—Carbon Footprint of Products—Requirements and Guidelines for Quantification and Communication; International Organisation for Standardisation: Geneva, Switzerland, 2013. [Google Scholar]
- Taiwan Environmental Protection Administration. Carbon Footprint—Product Category Rules (Book in Chinese); Taiwan EPA: Taipei, Taiwan, 2010. [Google Scholar]
- Fthenakis, V.; Frischknecht, R.; Raugei, M.; Kim, H.C.; Alsema, E.; Held, M.; de Wild-Scholten, M. Methodology Guidelines on Life Cycle Assessment of Photovoltaic Electricity. IEA PVPS Task. 2011. Available online: http://www.iea-pvps.org/fileadmin/dam/public/report/technical/rep12_11.pdf (accessed on 23 November 2018).
- International Organization for Standardization. ISO 21930:2017—Sustainability in Buildings and Civil Engineering Works—Core Rules for Environmental Product Declarations of Construction Products and Services; International Organisation for Standardisation: Geneva, Switzerland, 2017. [Google Scholar]
- European Committee for Standardization. BS EN 15804:2012+A1:2013 Sustainability of Construction Works—Environmental Product Declarations—Core Rules for the Product Category of Construction Products; BSI: London, UK, 2012; ISBN 978-0-580-82232-2. [Google Scholar]
- Taiwan Environmental Protection Administration. Carbon Footprint—Product Category Rules: Building (Book in Chinese); Taiwan EPA: Taipei, Taiwan, 2017. [Google Scholar]
- American Institute of Architects (AIA). AIA Guide to Building Life Cycle Assessment in Practice; AIA: Washington, DC, USA, 2012. [Google Scholar]
- Vigovskaya, A.; Aleksandrova, O.; Bulgakov, B. Life Cycle Assessment (LCA) in building materials industry. MATEC Web Conf. 2017, 106, 08059. [Google Scholar] [CrossRef]
- Lin, Y.-W. A Study on the Carbon Footprint Assessment of Building Transportation Equipment. Master’s Thesis, National Cheng Kung University, Tainan, Taiwan, 2014. (In Chinese). [Google Scholar]
- Chang, Y.-S. Life Cycle Assessment on the Reduction of Carbon Dioxide Emission of Buildings. Ph.D. Thesis, Department of Architecture, National Cheng Kung University, Tainan, Taiwan, 2002; pp. 67–136. [Google Scholar]
- Bureau of Energy, MOEA, Taiwan. Carbon Emission Coefficients of The Electricity Published by the Bureau of Energy; Ministry of Economic Affairs (MOEA): Taipei City, Taiwan, 2017. [Google Scholar]
- Lin, H.-T.; Lin, T.-P.; Tsay, Y.-S. Green Building Evaluation Manual—Basic Version; Architecture and Building Research Institute, Ministry of the Interior: Taipei, Taiwan, 2015. (In Chinese) [Google Scholar]
- Cheng, C.-L.; Liu, A.-P. A Study on Energy Consumption in Residential Plumbing Systems. J. Archit. 1999, 31, 107–117. (In Chinese) [Google Scholar]
- Peng, J.; Lu, L.; Yang, H. Review on life cycle assessment of energy payback and greenhouse gas emission of solar photovoltaic systems. Renew. Sustain. Energy Rev. 2013, 19, 255–274. [Google Scholar] [CrossRef]
- Nässén, J.; Holmberg, J.; Wadeskog, A.; Nyman, M. Direct and indirect energy use and carbon emissions in the production phase of buildings: An input–output analysis. Energy 2007, 32, 1593–1602. [Google Scholar] [CrossRef]
- Liu, H.-Y. From Low Carbon Building to No Carbon House–LowtoNo–Use of a Single-Family House in Kinmen as an Example (Chinese/English dual Language Edition); Angle Publishing: Taipei, Taiwan, 2017. [Google Scholar]
- Finkbeiner, M.; Schau, E.M.; Lehmann, A.; Traverso, M. Towards Life Cycle Sustainability Assessment. Sustainability 2010, 2, 3309–3322. [Google Scholar] [CrossRef]
© 2019 by the author. Licensee MDPI, Basel, Switzerland. This article is an open access article distributed under the terms and conditions of the Creative Commons Attribution (CC BY) license (http://creativecommons.org/licenses/by/4.0/).