Article

The Interactive Impact of Building Diversity on the Thermal Balance and Micro-Climate Change under the Influence of Rapid Urbanization

1
School of Architecture and Urban Planning, Huazhong University of Science and Technology, Wuhan 430074, China
2
Department of Landscape Architecture, College of Architecture and Urban Planning, Tongji University, Shanghai 200092, China
3
School of Architecture and Urban Planning, Islamic Azad University of Izeh, Izeh 6391675568, Iran
*
Author to whom correspondence should be addressed.
Sustainability 2019, 11(6), 1662; https://doi.org/10.3390/su11061662
Submission received: 22 January 2019 / Revised: 27 February 2019 / Accepted: 13 March 2019 / Published: 19 March 2019
(This article belongs to the Special Issue Urban Sprawl and Sustainability)

Abstract

:
Numerous cities face the serious problems of rapid urbanization and climate change, especially in recent years. Among all cities, Wuhan is one of the most affected by these changes, accompanied by the transformation of water surfaces into urban lands and the decline of natural ventilation. This study investigated the impact of surface urban heat island enlargement (SUHI) and block morphology changes in heat balance. Accordingly, the interactive impact of building diversity with major building forms (low-rise, mid-rise, and high-rise) on thermal balance and microclimate changes under the influence of urban land expansion at the residential block scale was studied. To investigate the heat balance changes by air temperature intensification and air movement reduction, a long-term and field observational analysis (1980–2018) coupled with computational fluid dynamic simulation (CFD) was used to evaluate the impact of building diversity on thermal balance. Outcomes show that urban heat island intensity (UHII) increased by 2 °C when water surfaces in urban areas decreased; consequently, there was a deterioration in the air movement to alleviate UHII. Thus, the air movement declined substantially with UHII and SUHI enlargement, which, through increased urban surfaces and roughness length, will become worse by 2020. Furthermore, the decline in air movement caused by the transformation of urban water bodies cannot contribute to the heat balance unless reinforced by the morphology of the urban blocks. In the design of inner-city blocks, morphological indicators have a significant impact on microclimate and heat balance, where increasing building density and plot ratio will increase UHII, and increasing water surfaces will result in an increase in urban ventilation. Lastly, a substantial correlation between air temperature and relative humidity was found, which, together with the block indicators, can help control the air temperature and adjust the urban microclimate.

1. Introduction

Urbanization is a global phenomenon resulting in urban expansion, land use/cover transformation, and climate change [1,2]. In China, according to historical data, urbanization growth began in the 1980s and rapidly increased to more than double in the last two decades [3,4]. Wuhan is a city that has been most affected by these changes, accompanied by the transformation of water surfaces into urban land and a decline in natural ventilation [5]. As a result of urban sprawl, urban morphology has significantly changed and urban surfaces have become geometrically complex, dense, and highly diverse with higher thermal capacity and more impervious surfaces compared to rural surfaces [6]. In this regard, natural elements/surfaces have been transformed by the use of manufactured materials with distinctive thermal and radiative properties, which has caused surface urban heat island (SUHI) enlargement. These properties create multiple reflections among buildings through long-wave (LW) and short-wave (SW) radiation, which can considerably impact on thermal balance. All these changes as a result of city expansion and increased urban surface roughness have affected the reflection, transmission, and absorption of radiation, leading to more heat accumulating between urban blocks and increased urban heat island intensity (UHII), thereby influencing the heat balance. Consequently, urban form causes the formation of various microclimates within the built environment [6].
Accordingly, many studies have investigated the impact of land use/cover changes on climate by using simulation techniques to account for the various urban surfaces and solve statistical problems [7,8,9,10]. Through these alterations, the amount of accumulated heat within urban blocks can be increased and made even worse by extending surface roughness and building diversity. Roughness length increases under the urbanization process creating a decline in the natural ventilation and poor quality of thermal comfort within urban blocks [11,12]. Subsequently, a large amount of heat accumulated cannot be released efficiently, which intensifies the artificial heat and increases the high outdoor air temperature to levels above those of rural open spaces. Thus, rapid urbanization intensifies surface urban heat islands (SUHI) and changes the heat balance of the urban spaces. The influence of SUHIs and the heat balance change can cause the air temperature in inner urban spaces to be noticeably warmer (2–3 °C) than in rural open spaces [13,14]. On this subject, Taleghani studied the impact of heat mitigation strategies on the energy balance of a neighborhood [15]. Rashdi analyzed an ideal building form in relation to lower cooling load and found that additional trees and cool pavements led to the largest reductions in air temperature [16]. Cheng used the computational fluid dynamics (CFD) technique to achieve natural ventilation strategies for early building design [17]. However, in previous studies, the interactive impact of building diversity with major building forms (low-rise, mid-rise, and high-rise) on the thermal balance and micro-climate change under the influence of rapid urbanization is not well documented. Nevertheless, very little is known about adjusting urban climate using a linkage of a numerical relationship between urban growth, building diversity, heat balance, and microclimate change within block scale to fill these gaps in knowledge.
In regard to city expansion, a key question is how UHII can be released efficiently or how its negative effects can be mitigated. In this respect, natural ventilation performance and heat loss/gain are linked to the urban morphological layout which may increase UHII [18,19,20,21]. Also, the buildings’ energy consumption can increase due to the impact of UHII. However, by improving the urban form and block morphology, the buildings’ energy consumption can be decreased by about 4.5% [22]. The physical patterns, layouts, and structures should be considered using urban design indicators such as building density (BD), plot ratio (PR), greenery ratio (GR), building configuration (BC), and water surfaces (WS) [23]. Indicators mentioned as strongly affecting urban microclimate parameters (wind characteristics, air temperature, humidity, and solar radiation) are continuing to rise with the fast growth in urbanization and UHII [24]. According to the significant impact of land use, urban morphology, building form, and design layout on UHII [20,25,26,27,28,29] and the lack of proper tactics to get rid of the UHII, methods and roadmap to accomplish the goal of the study are as follows.
First of all, satellite remote sensing techniques (SRST) [30,31,32] coupled with the geographic information system (GIS) [33,34] are applied to investigate the land-use transformation in Wuhan Metropolitan Area (WMA, Supplementary Materials) (1980–2016). Applying long-term observational study based on SRST and GIS obviously demonstrates substantial land use changes during Wuhan’s urbanization where water surfaces (declined by about 16% of the total range) have been dramatically transformed into urban land (3.45 times larger than in 1980). These changes directly affect the ecosystem and change heat balance due to the rapid urbanization of Wuhan, which will become worse in 2020 as Li [3] predicted that the population of Wuhan will increase by about 11.8 million. Therefore, construction of residential urban blocks has been highlighted and studying this is the aim of this work.
Second of all, long term land use considered together with long term meteorological data analysis are applied to evaluate the effect of land use on microclimate changes. By increasing urban lands and decreasing water surfaces, relative humidity declined and air temperature increased, which affects UHII. The purpose is to evaluate the impact of the water surface reduction on wind environment decline and UHII enhancement.
Finally, UHII mitigation [35], or its efficient release, is the goal of this study. By clarification of the significant changes and points regarding long-term observation (morphological changes and climate factors under rapid urbanization), urban blocks in major residential building classes (low rise, mid-rise, and high-rise buildings) [36] are carefully selected and studied and their heat balance carefully measured. Accordingly, the simulation method of computational fluid dynamics (CFD) [37] is used to assess urban microclimates and the interactive impact of building diversity on the thermal environment and wind conditions.

2. Materials and Methods

2.1. Long-Term and Mobile Observational Study Using SRST and GIS Analysis Together with the CFD Approach

To alleviate the negative effects of UHII or its efficient release under rapid urbanization, four distinct aspects and approaches were used which provided targeted strategies for urban design to improve and regulate urban microclimates:
(a)
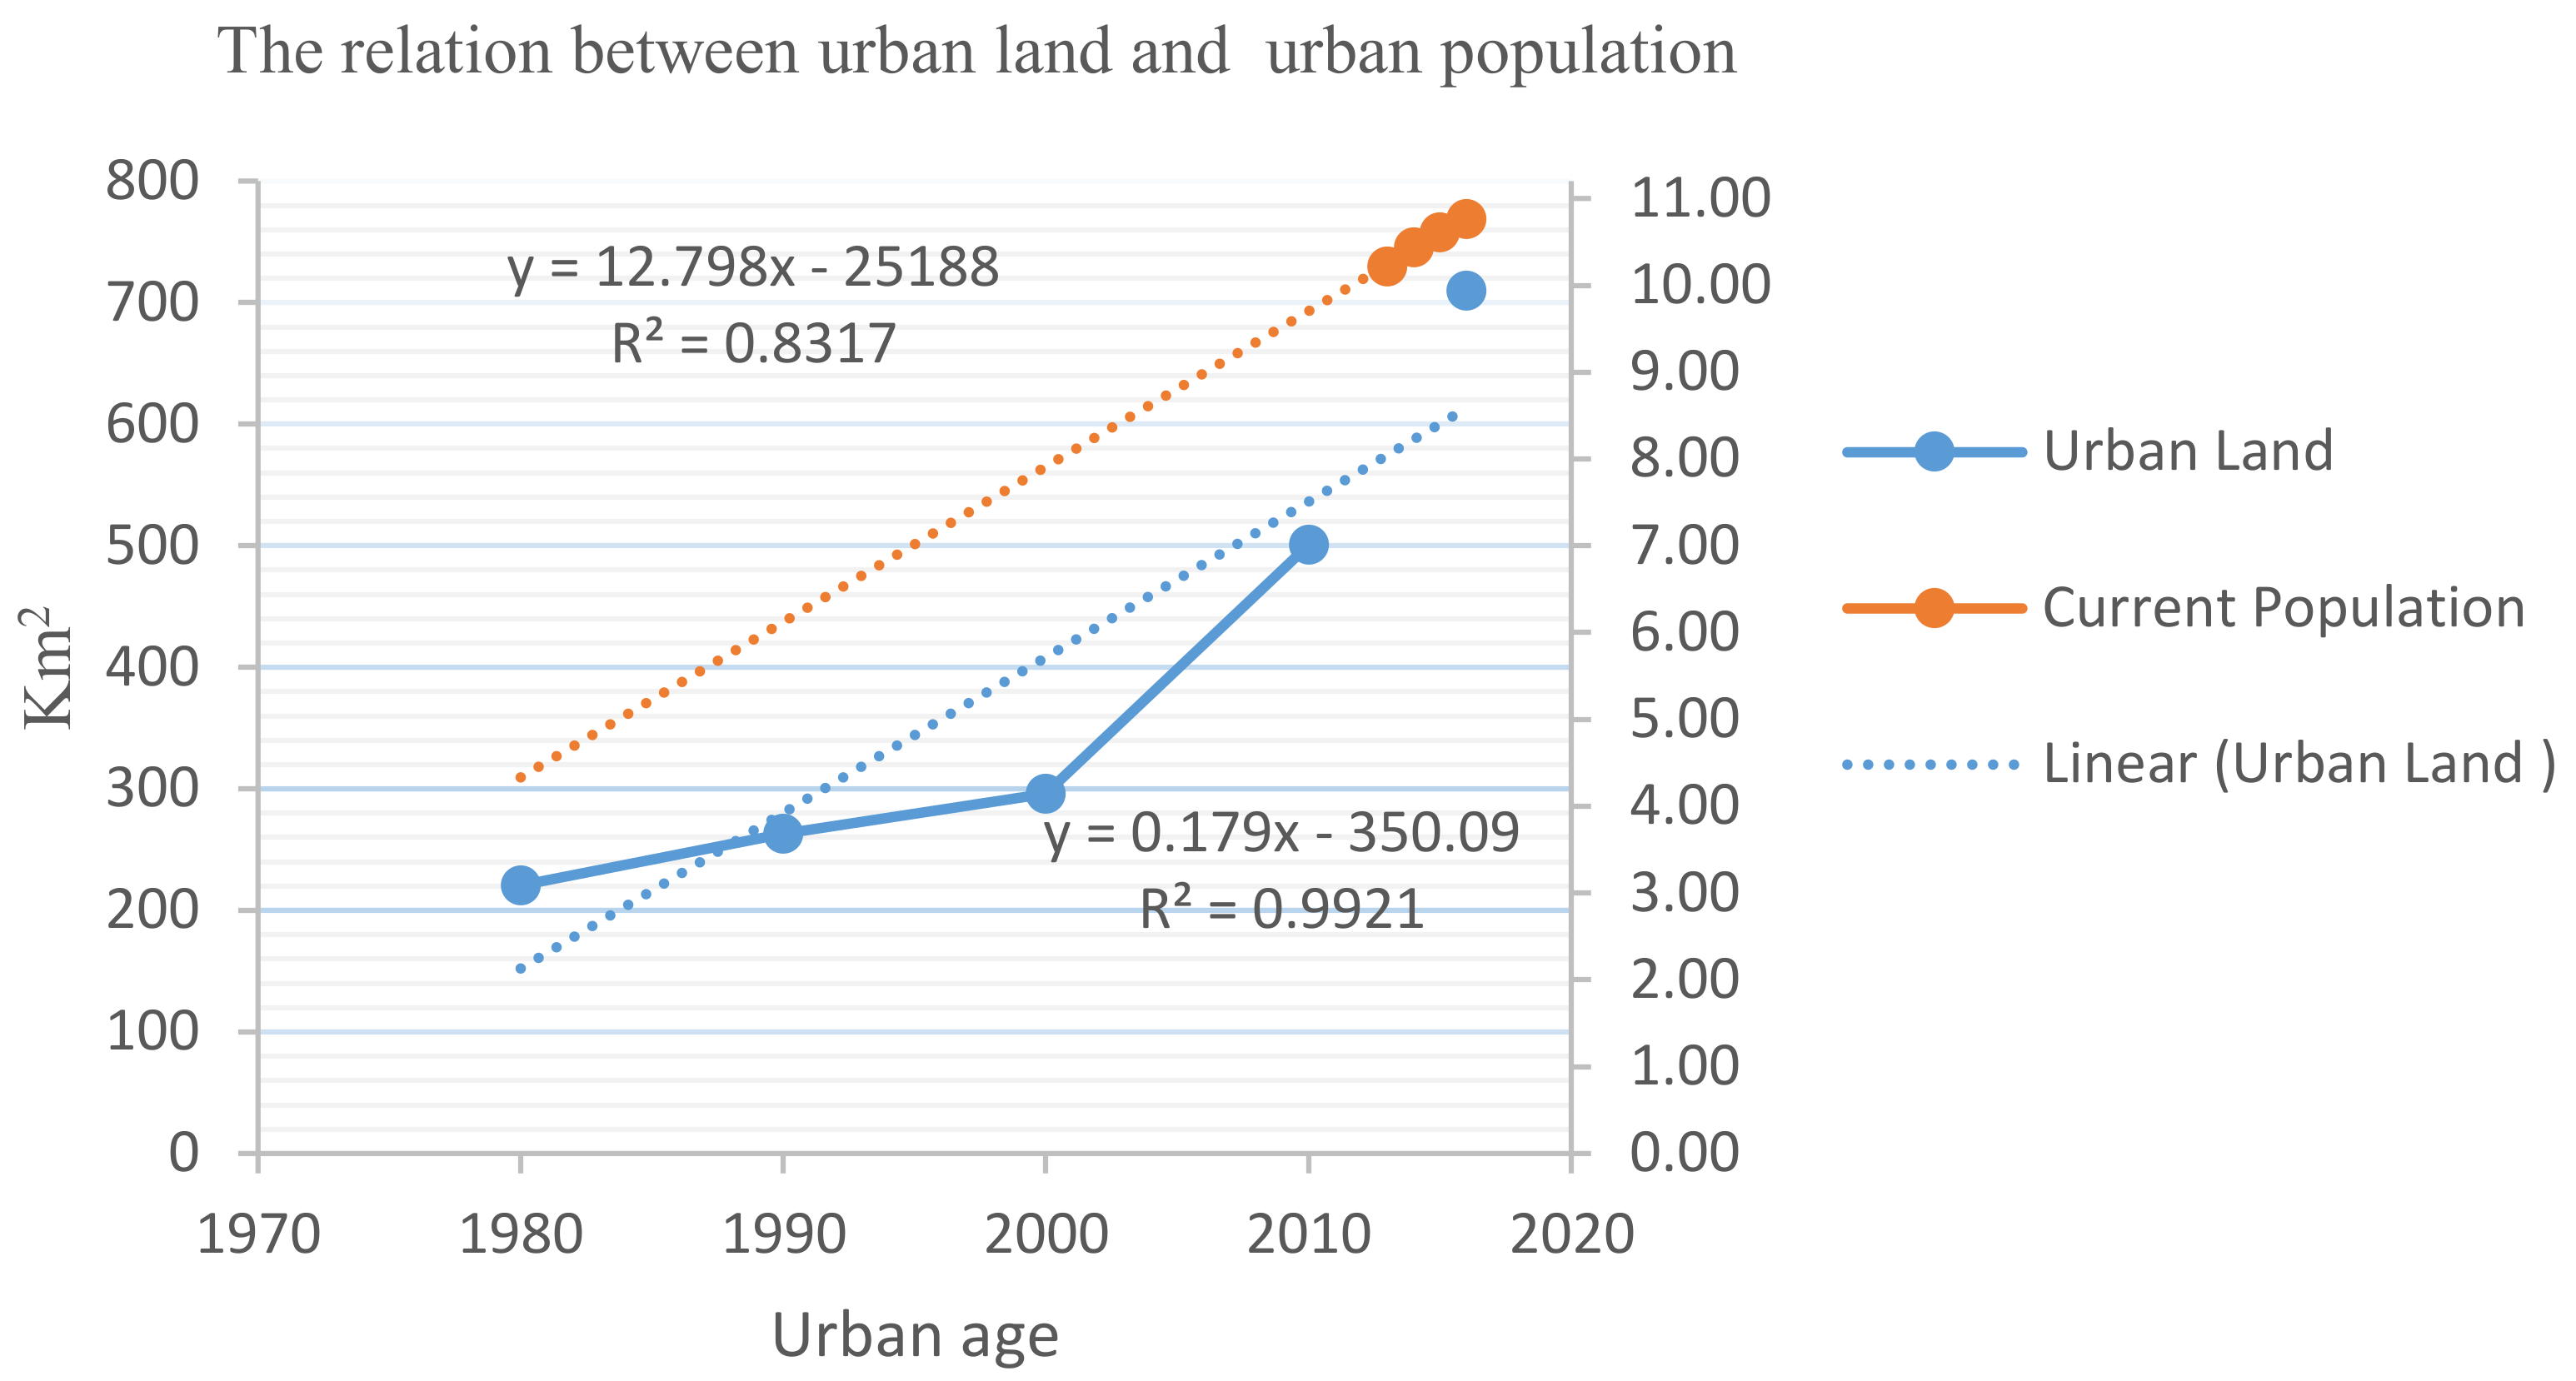
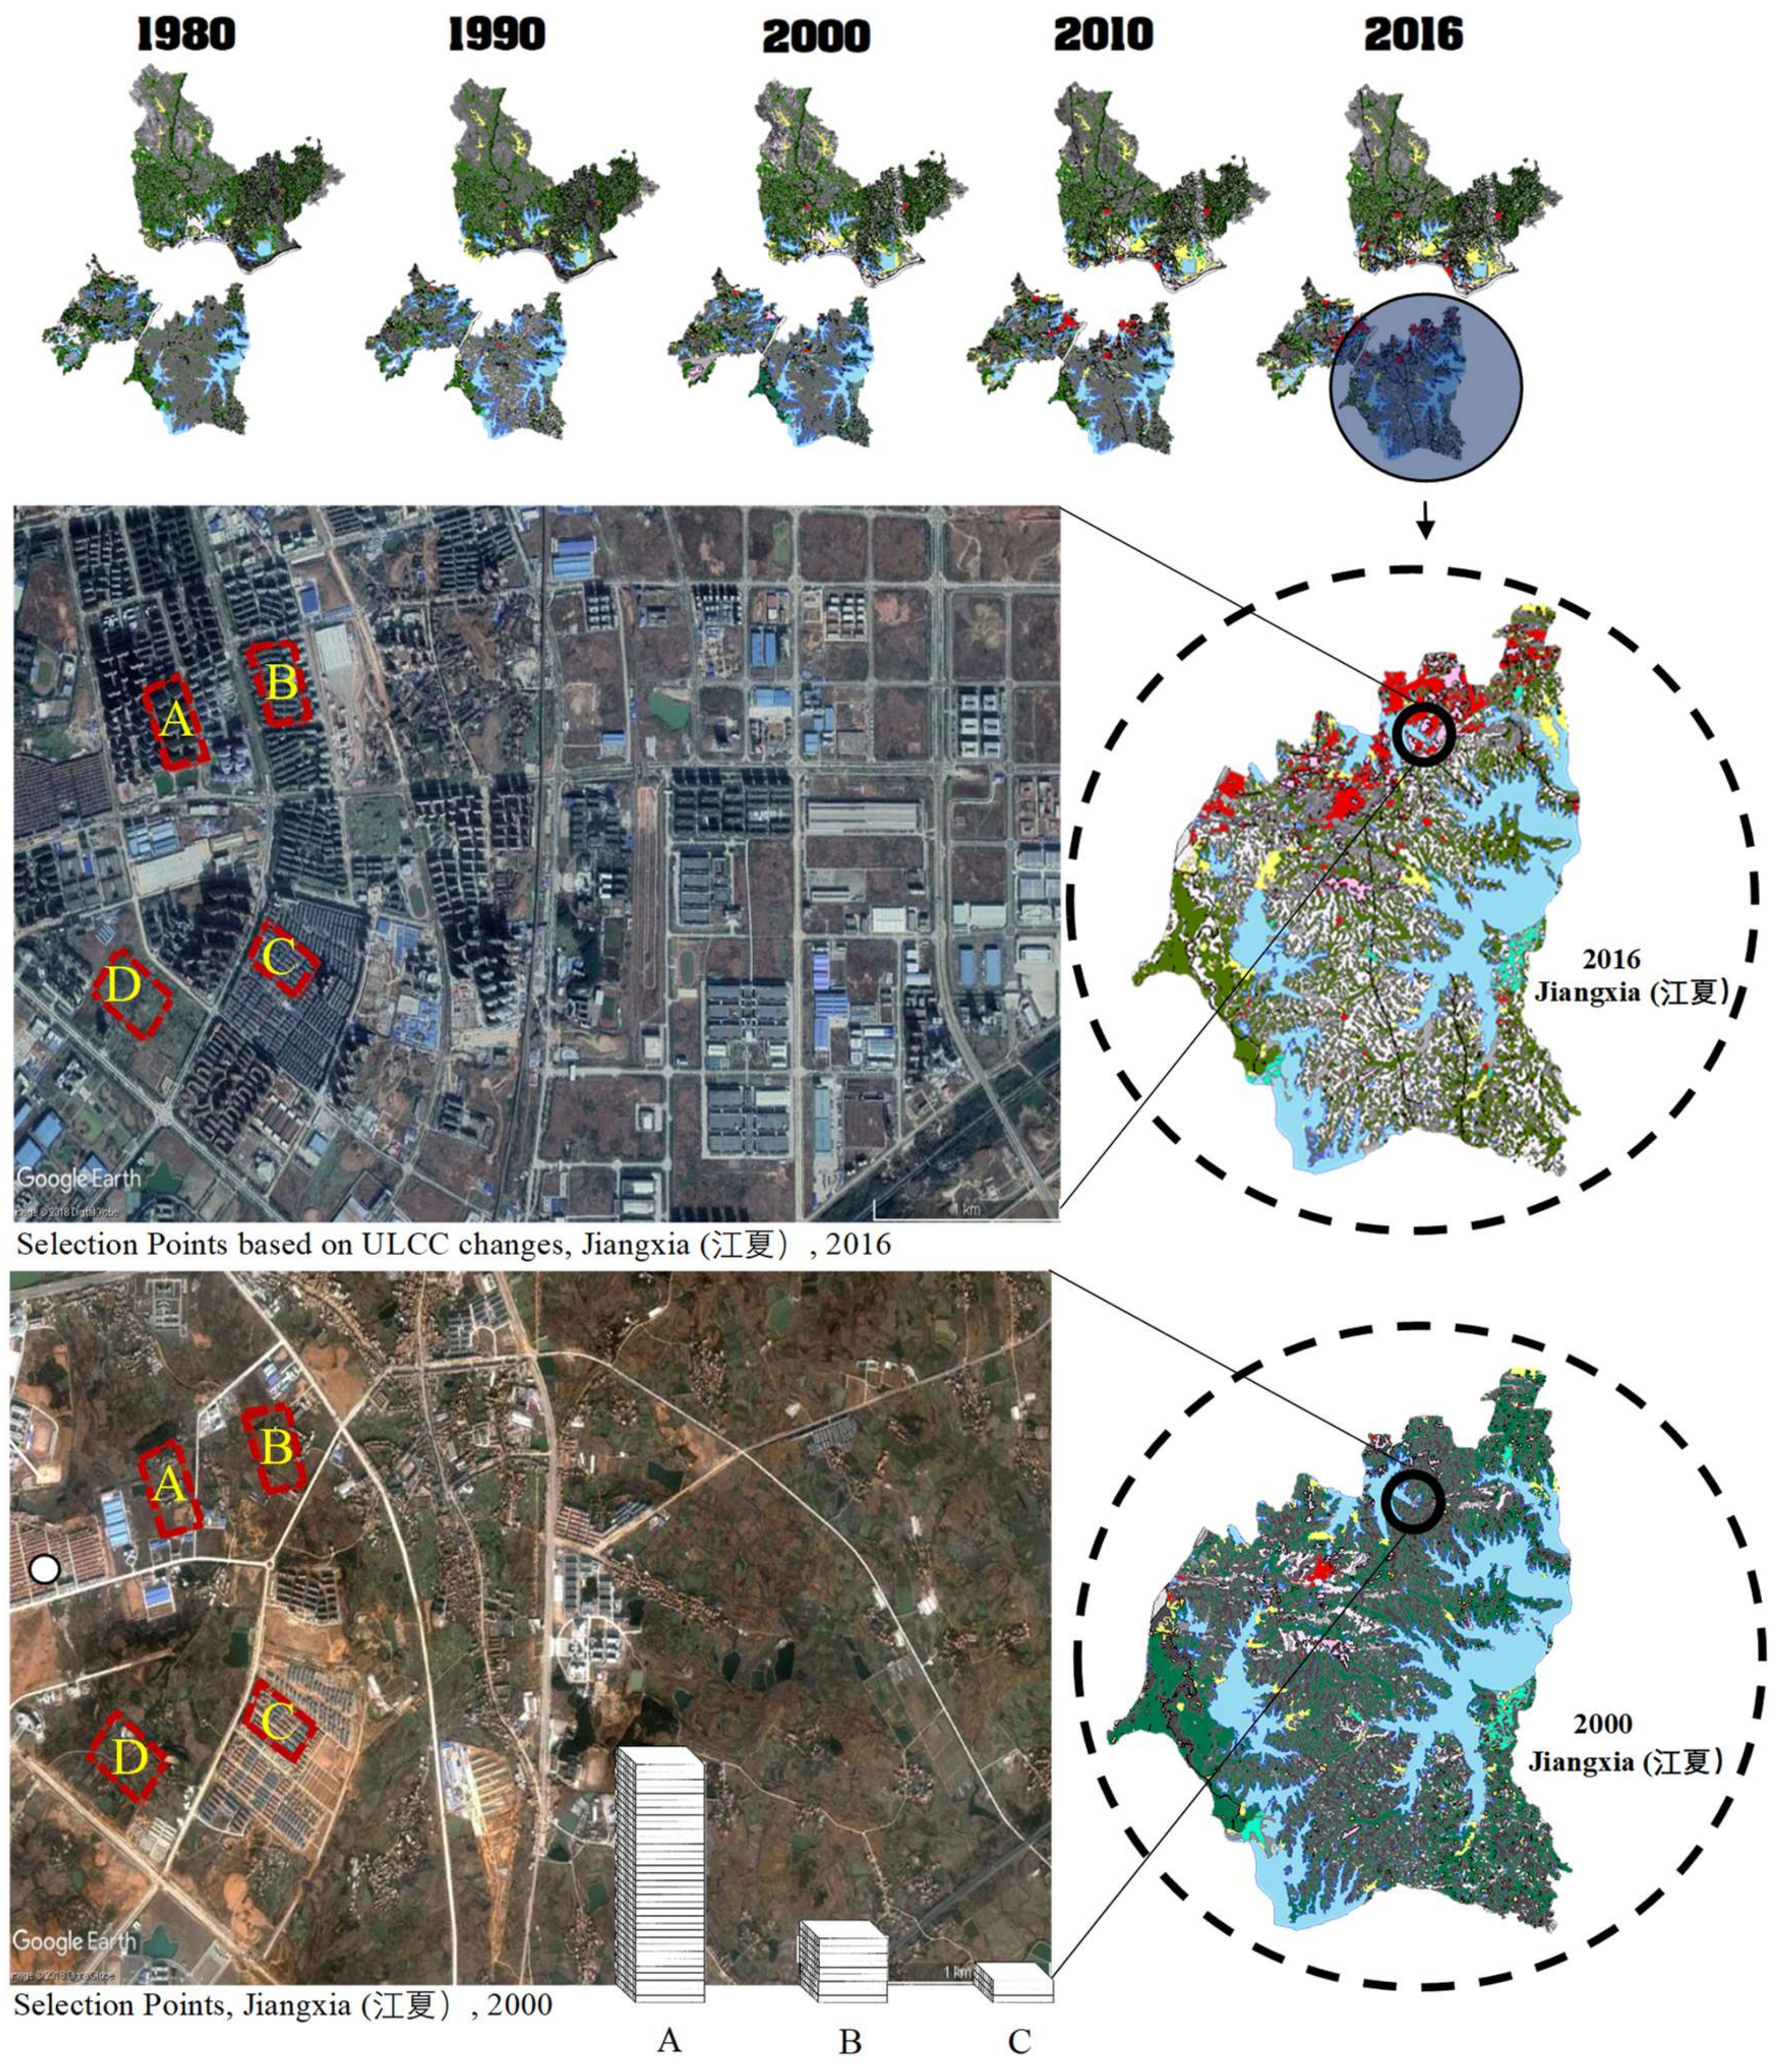
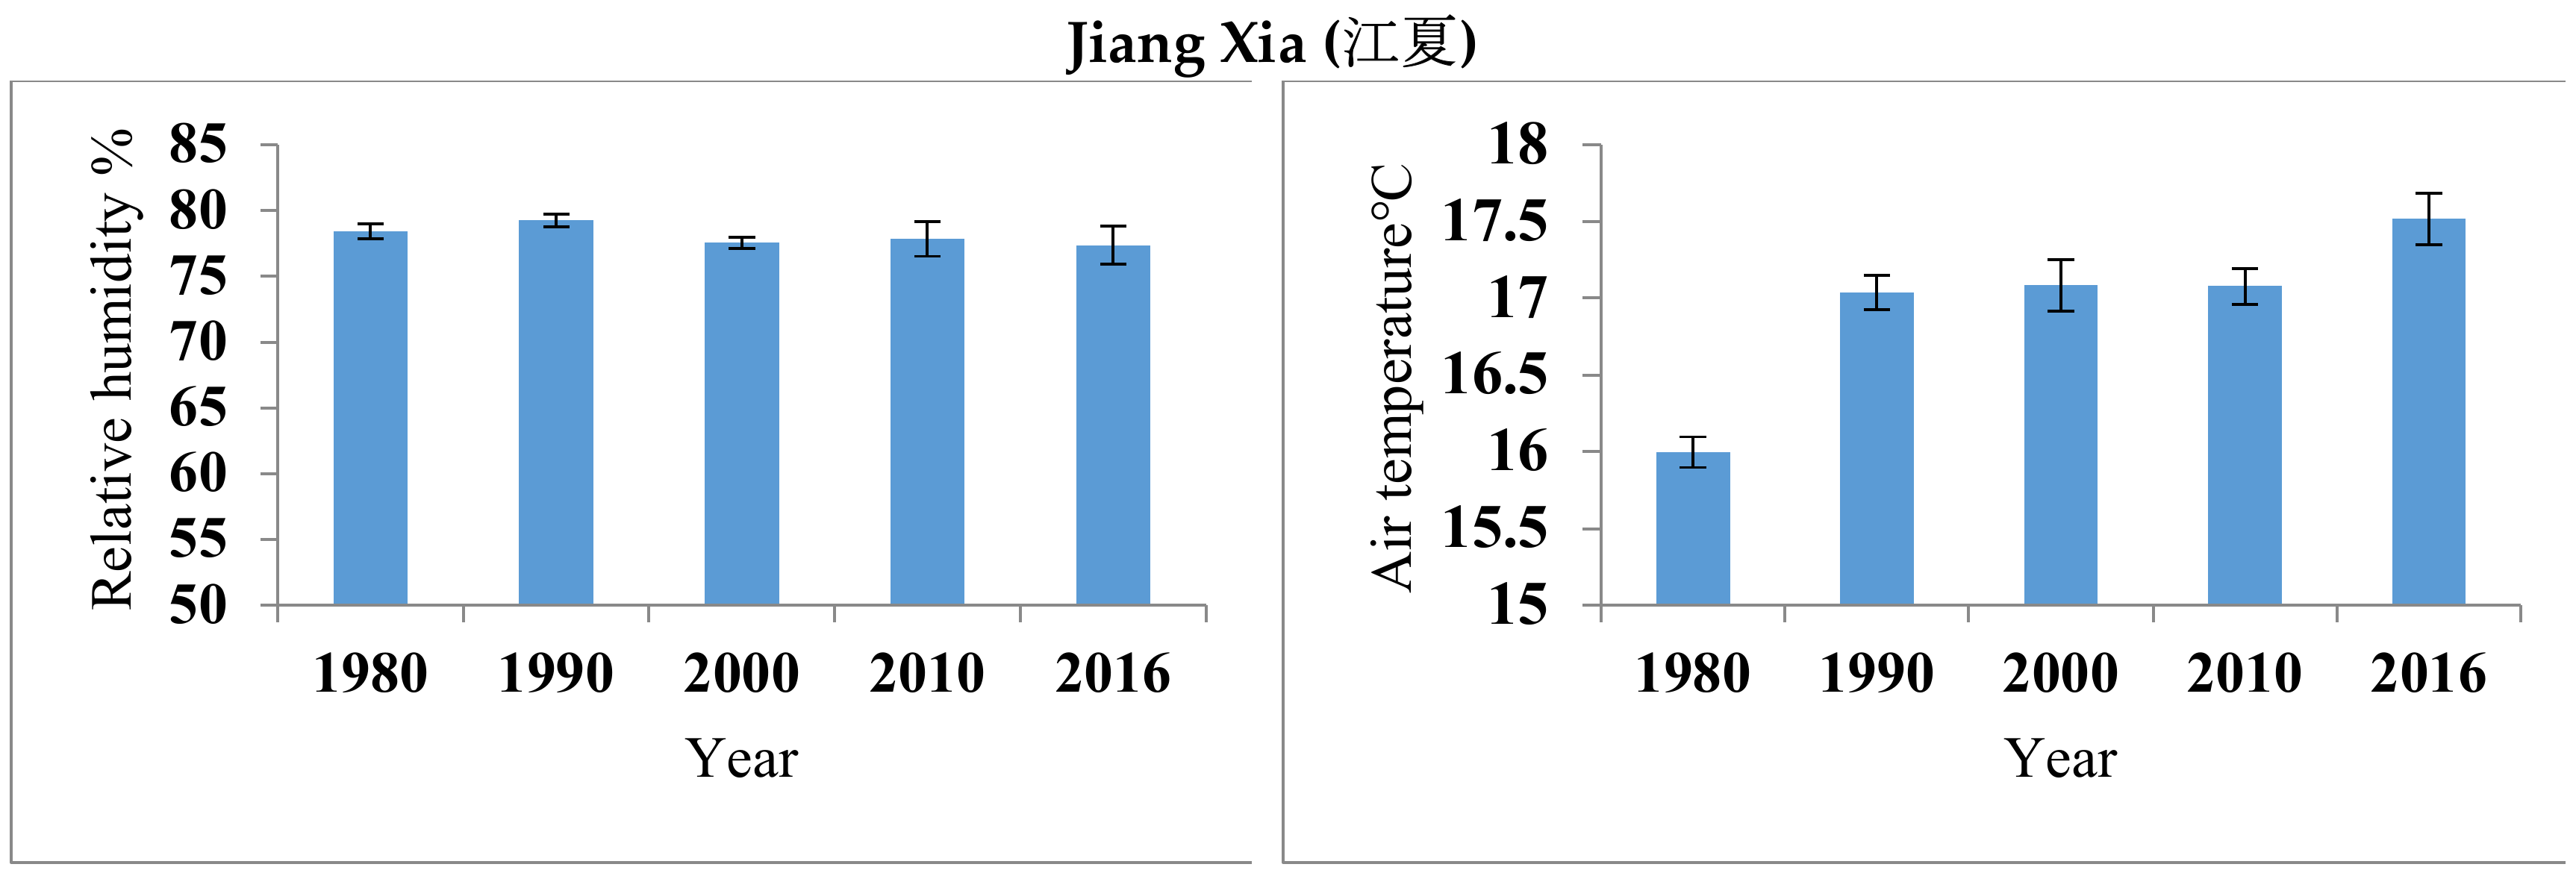
Firstly, long-term observation [38] of meteorological data [39,40], climate factors [41], and remote sensing images [42] during the period 1980–2016 were applied and analyzed. For this purpose, raster maps of Wuhan City (8573 km2) at ten-yearly intervals from 1980 to 2016 were established and carefully analyzed using specified raster information. Afterwards, SRST coupled with GIS [43] approaches were used and data analyzed by ArcMap 10.4.1 (Esri China Information Technology Co. Ltd, Beijing, China) with the property of cell size (X, Y) and value 30, 30, and a spatial reference system of one meter. Accordingly, land-use changes were carefully assessed and measured due to the long-term impact of rapid urbanization [44]. In 2016, the urban land cover area was 709.9 km2, a 3.21 times increase from 220.5 km2 (1980) to about 489.3 km2 (2016) and the water surfaces (WS) [45] declined by 145.64 km2 (16% of the total range) in the urban area of Wuhan. As it was predicted [3], the rate of urbanism may reach 84% and the population of the built-up spaces will be 5.02 million, where the total population will increase by about 11.8 million. If the growth of the city continues on this trend, by 2020, the decrease has been predicted to be about 204.45 km2 (22%). On this point, we aimed to determine the long-term impact of the urbanization process on climate factors (Ta; air temperature, RH; relative humidity) to get the accrued data, which is needed to find the significant changes that have been linked with the greatest climate and land-use changes [46] over time during urban transformation.
(b)
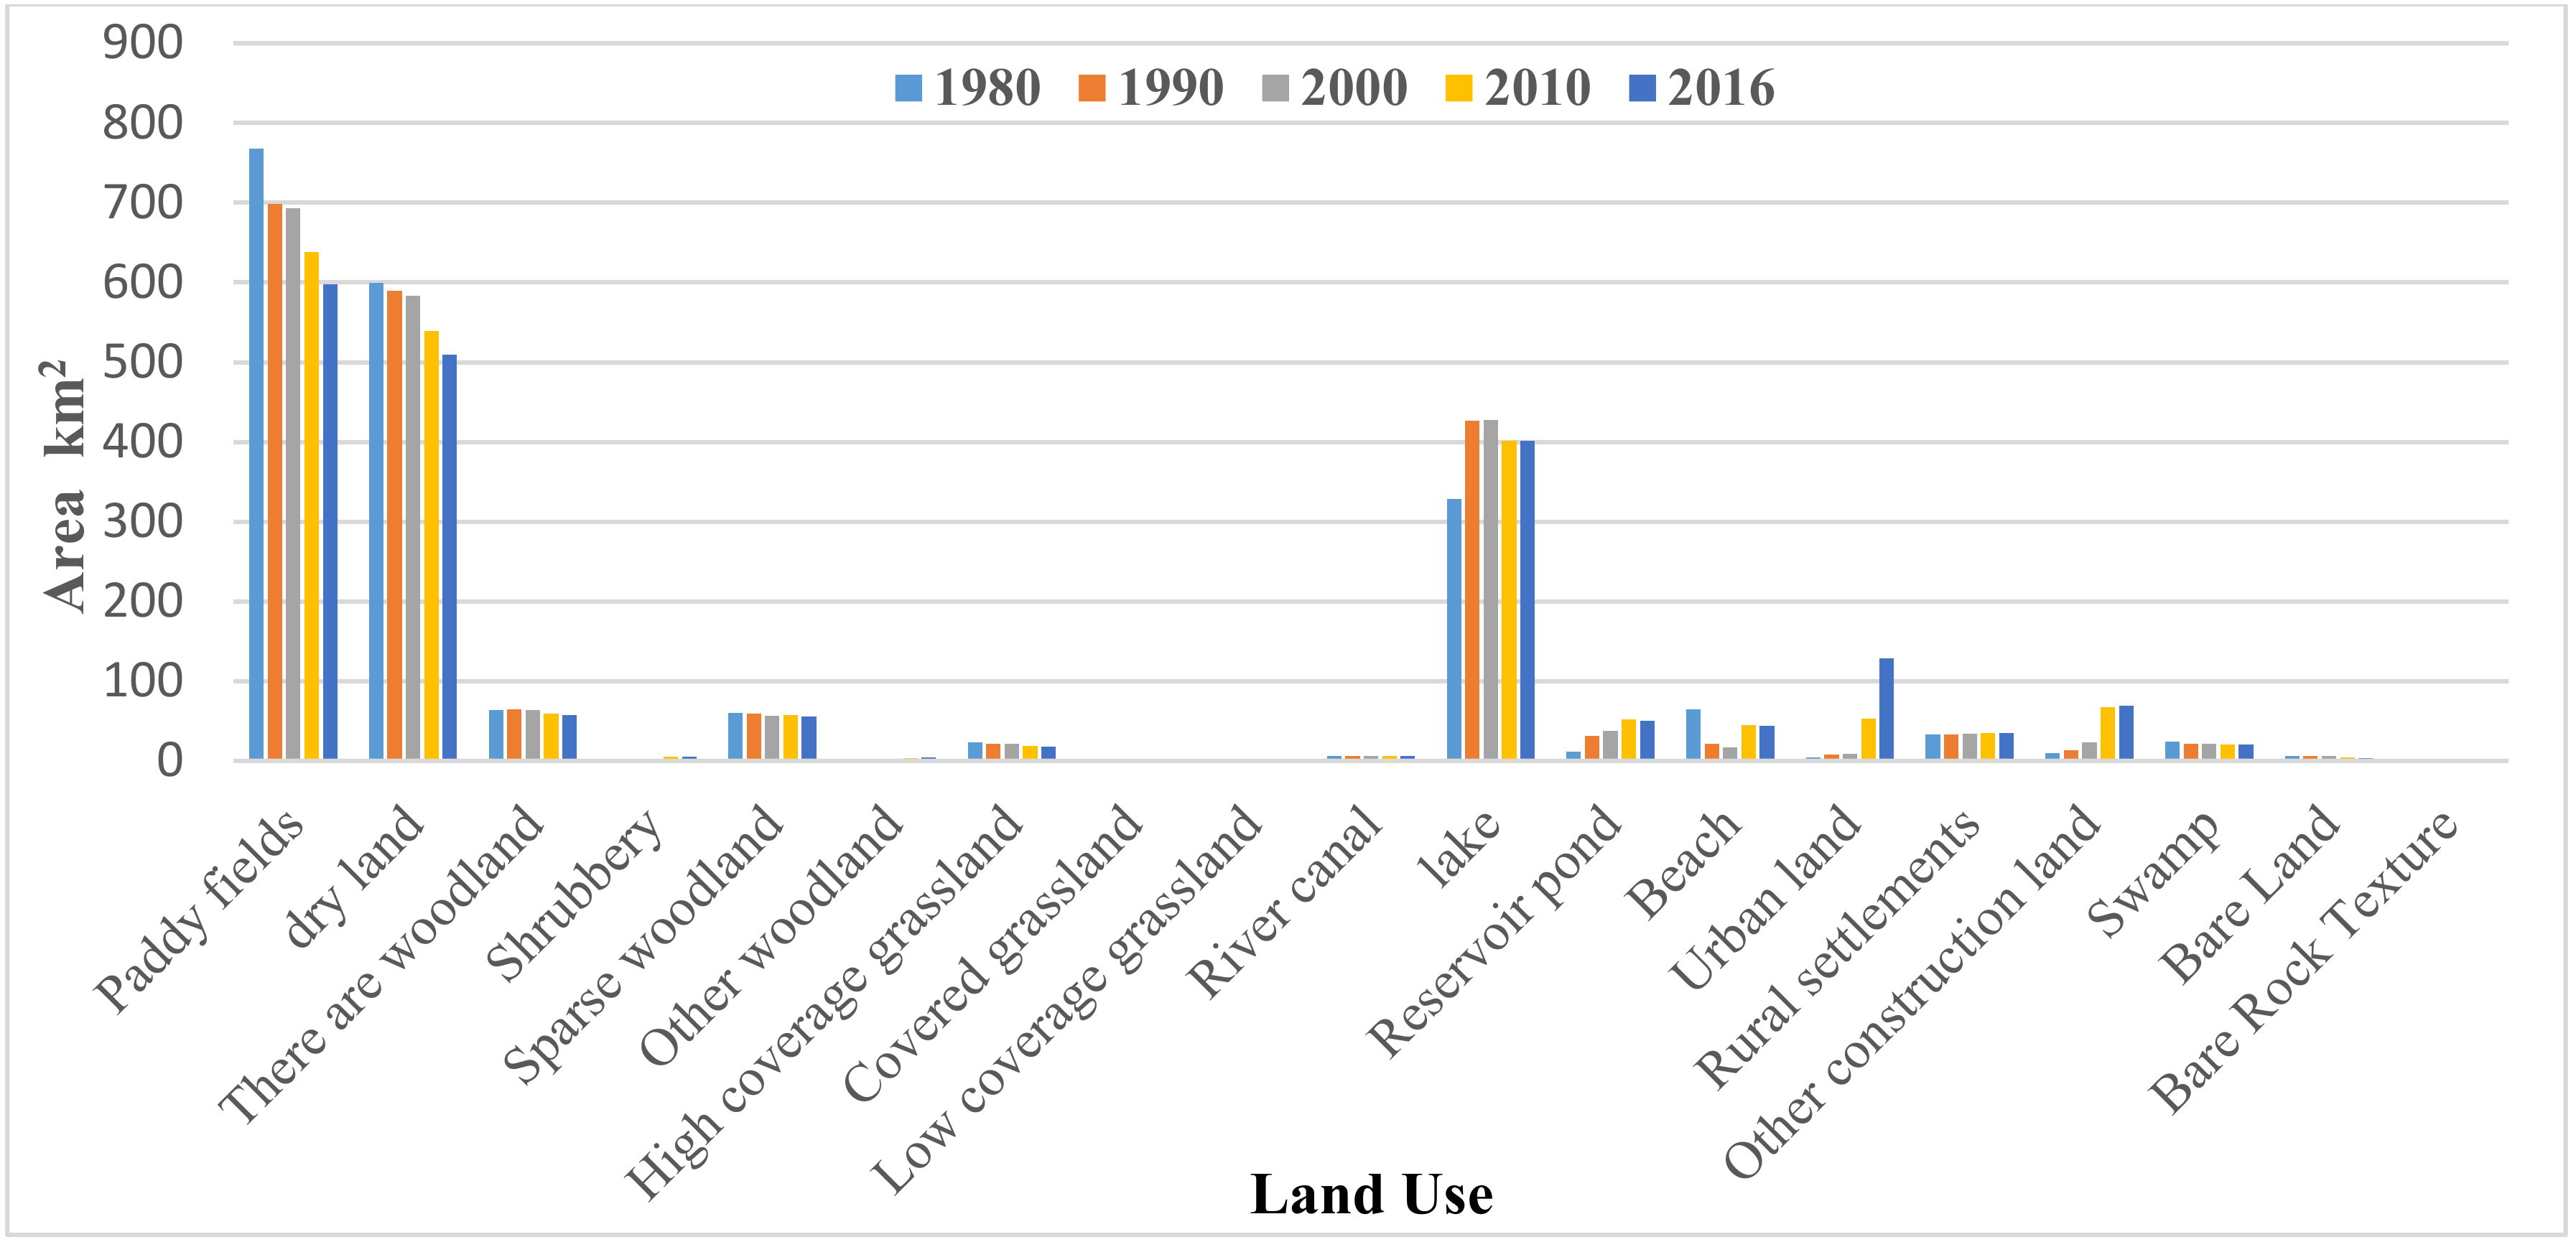
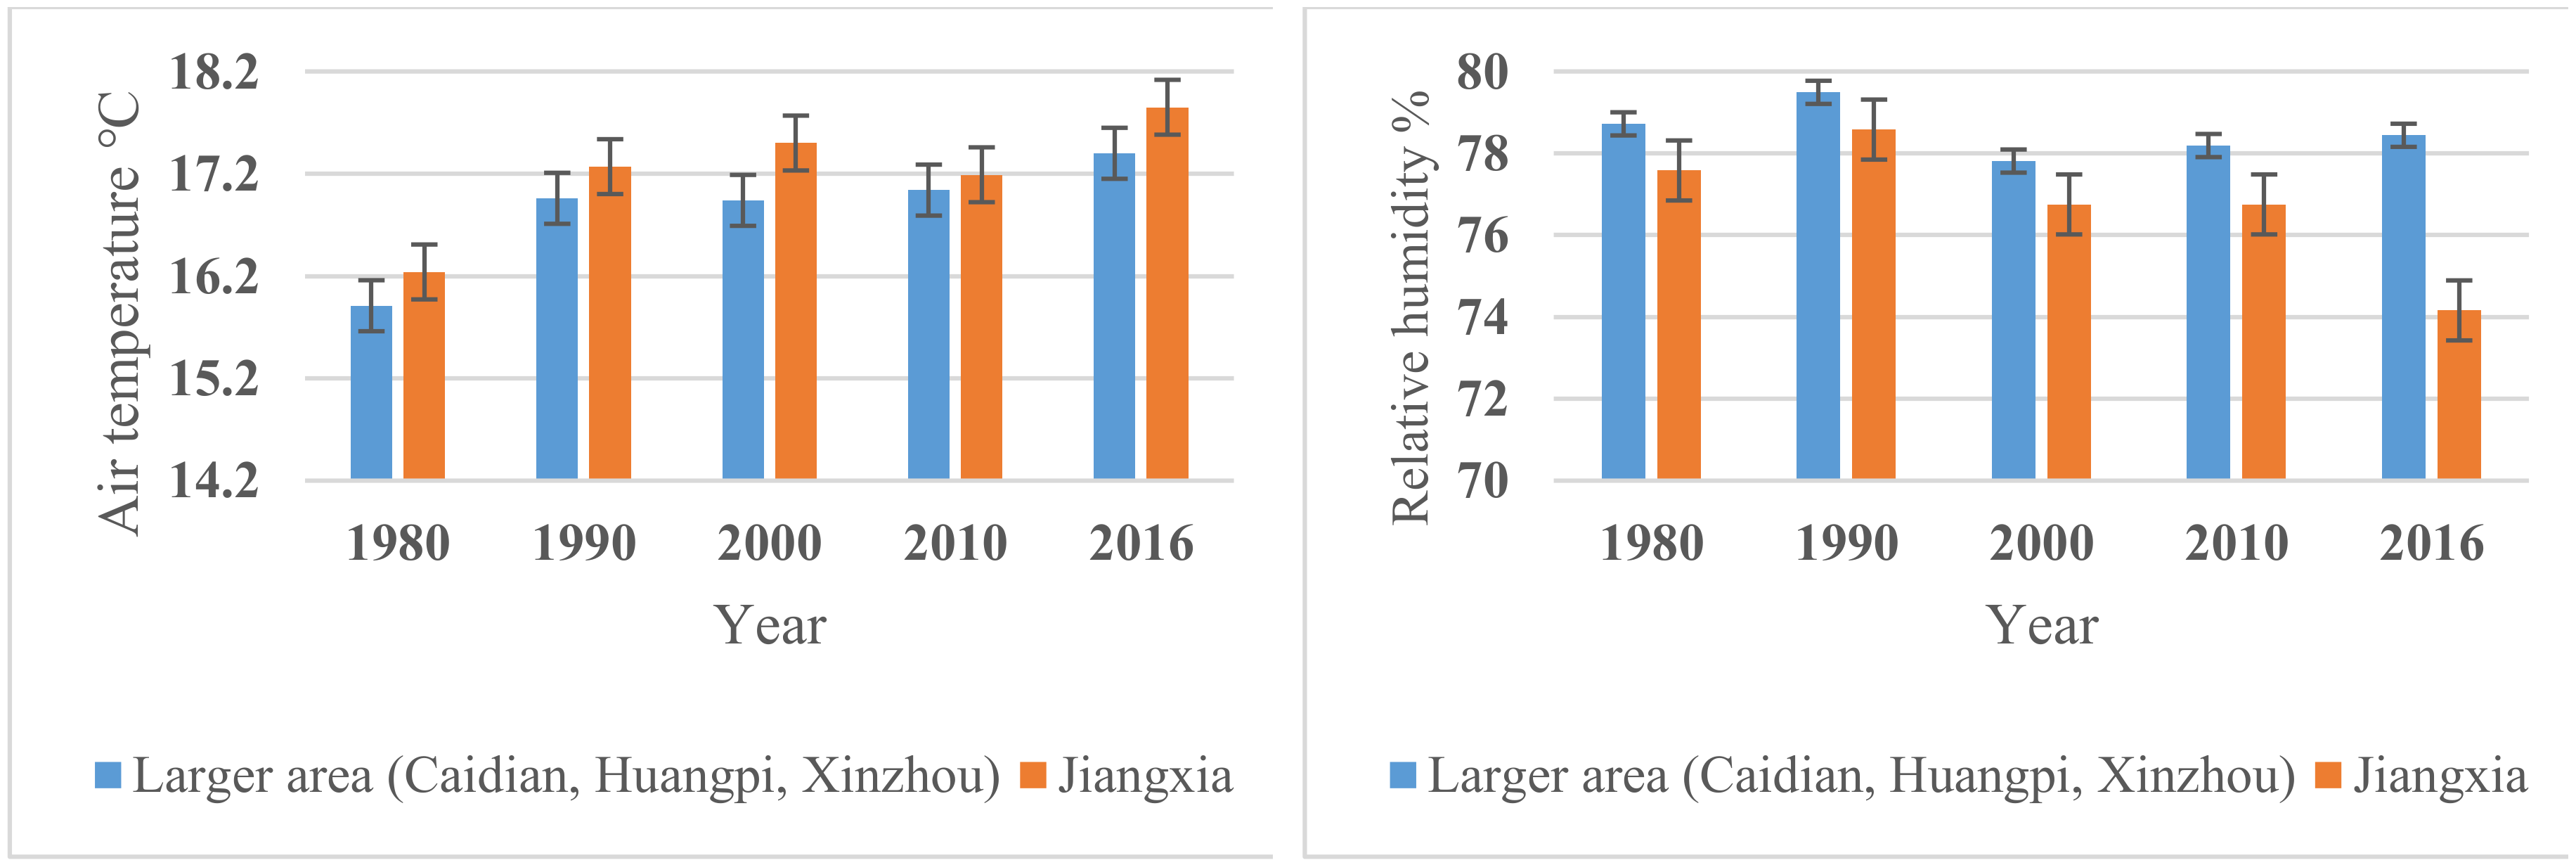
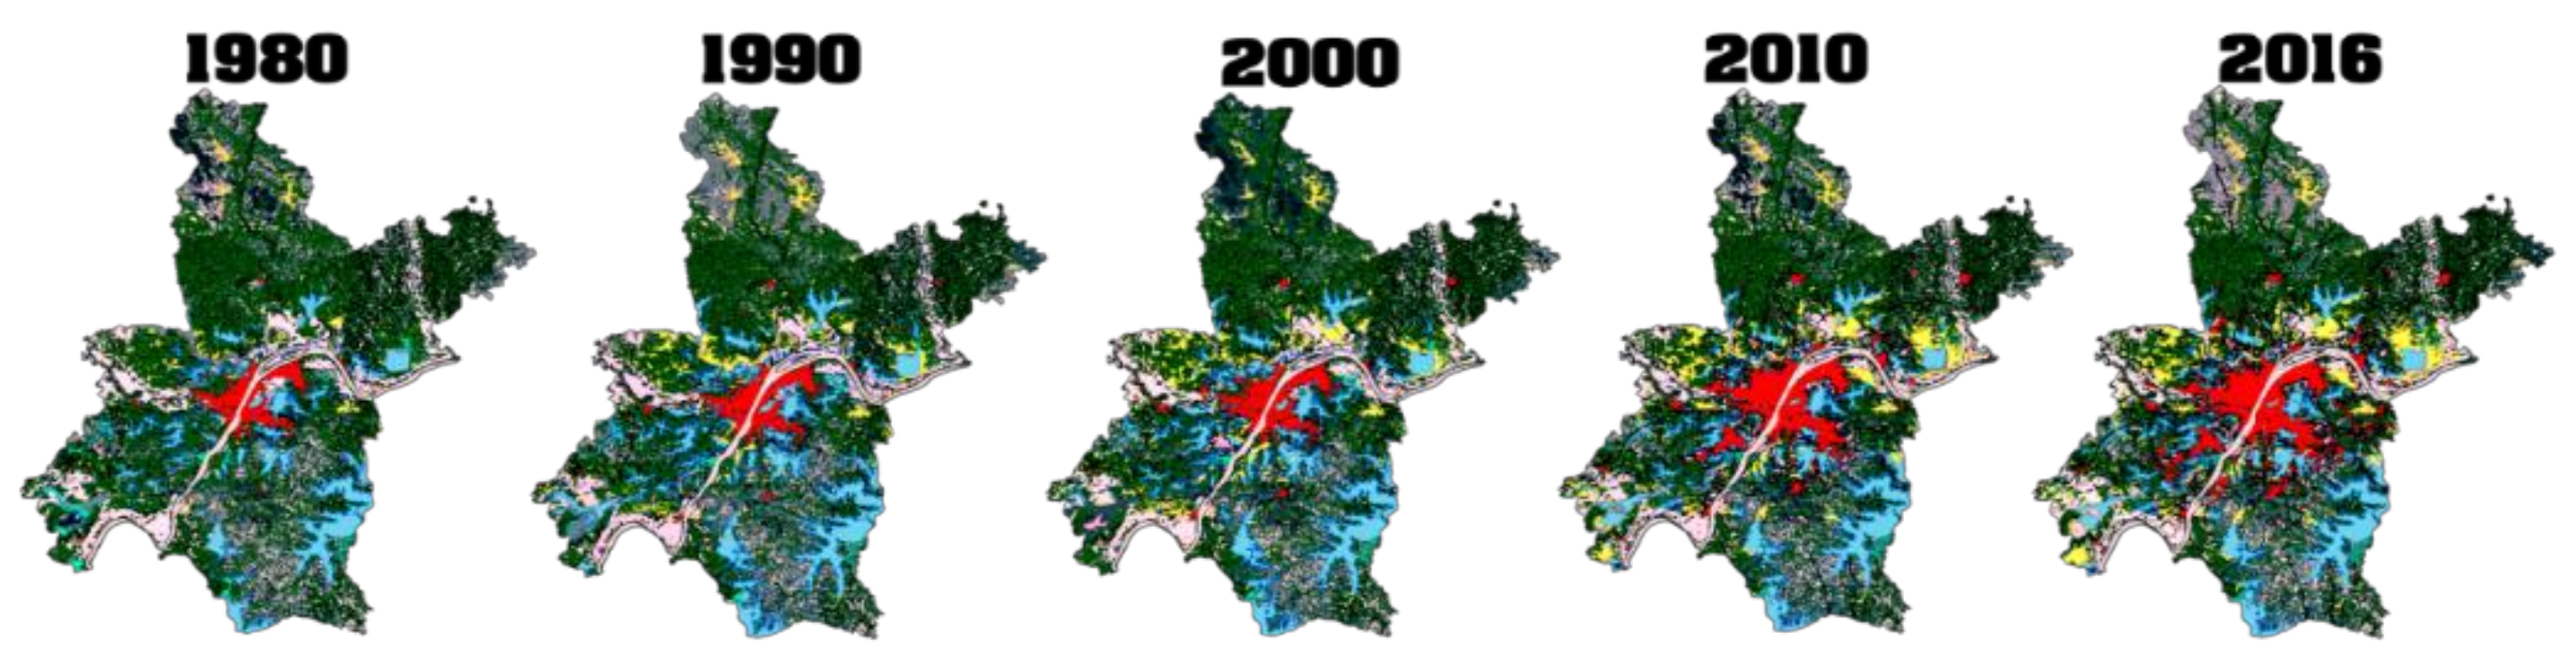
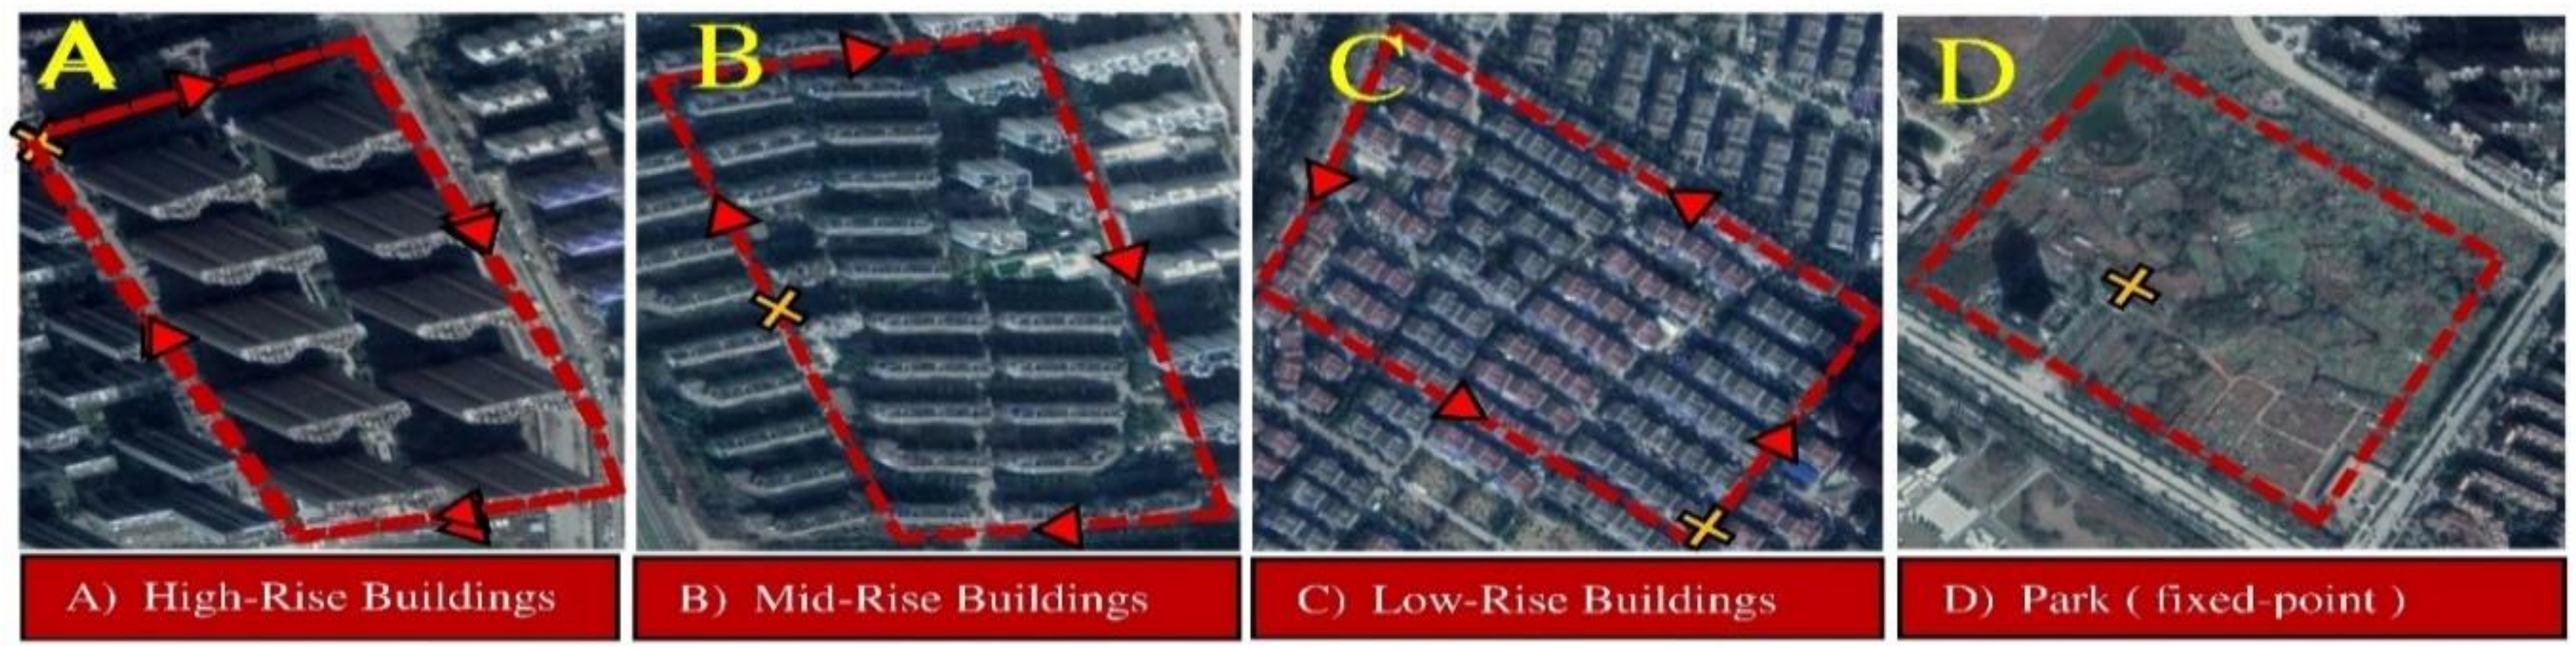
As the second step, data collection for the long-term observational study [47] (1980–2016) was conducted from the weather stations at Huangpi (黄陂; 30°52′55.7″ N, 114°22′32.4″ E), Xinzhou (新洲; 30°50′26.2″ N, 114°48′03.2″ E), Caidian (蔡甸; 30°34′54.5″ N, 114°01′45.6″ E), and Jiangxia (江夏; 30°22′29.8″ N, 114°19′15.8″ E), which are available in the metrological bureau of Wuhan. Due to the long-term observation, tipping points were selected to represent the most significant changes regarding the transformation of water surfaces into urban construction land. Accordingly, and due to the major objective of this study, quantitative evaluation and measurement of these changes on the urban microclimate were undertaken in different residential urban blocks under the impact of UHII. These were classified as A, B and C; high-rise buildings (10–34 stories), mid-rise buildings (7–9 stories), and low-rise buildings (1–3 stories), respectively [36]. All the changes discovered in land-use transformation during Wuhan City’s urbanization from 1980 to 2016 can be seen in Figure 1.
(c)
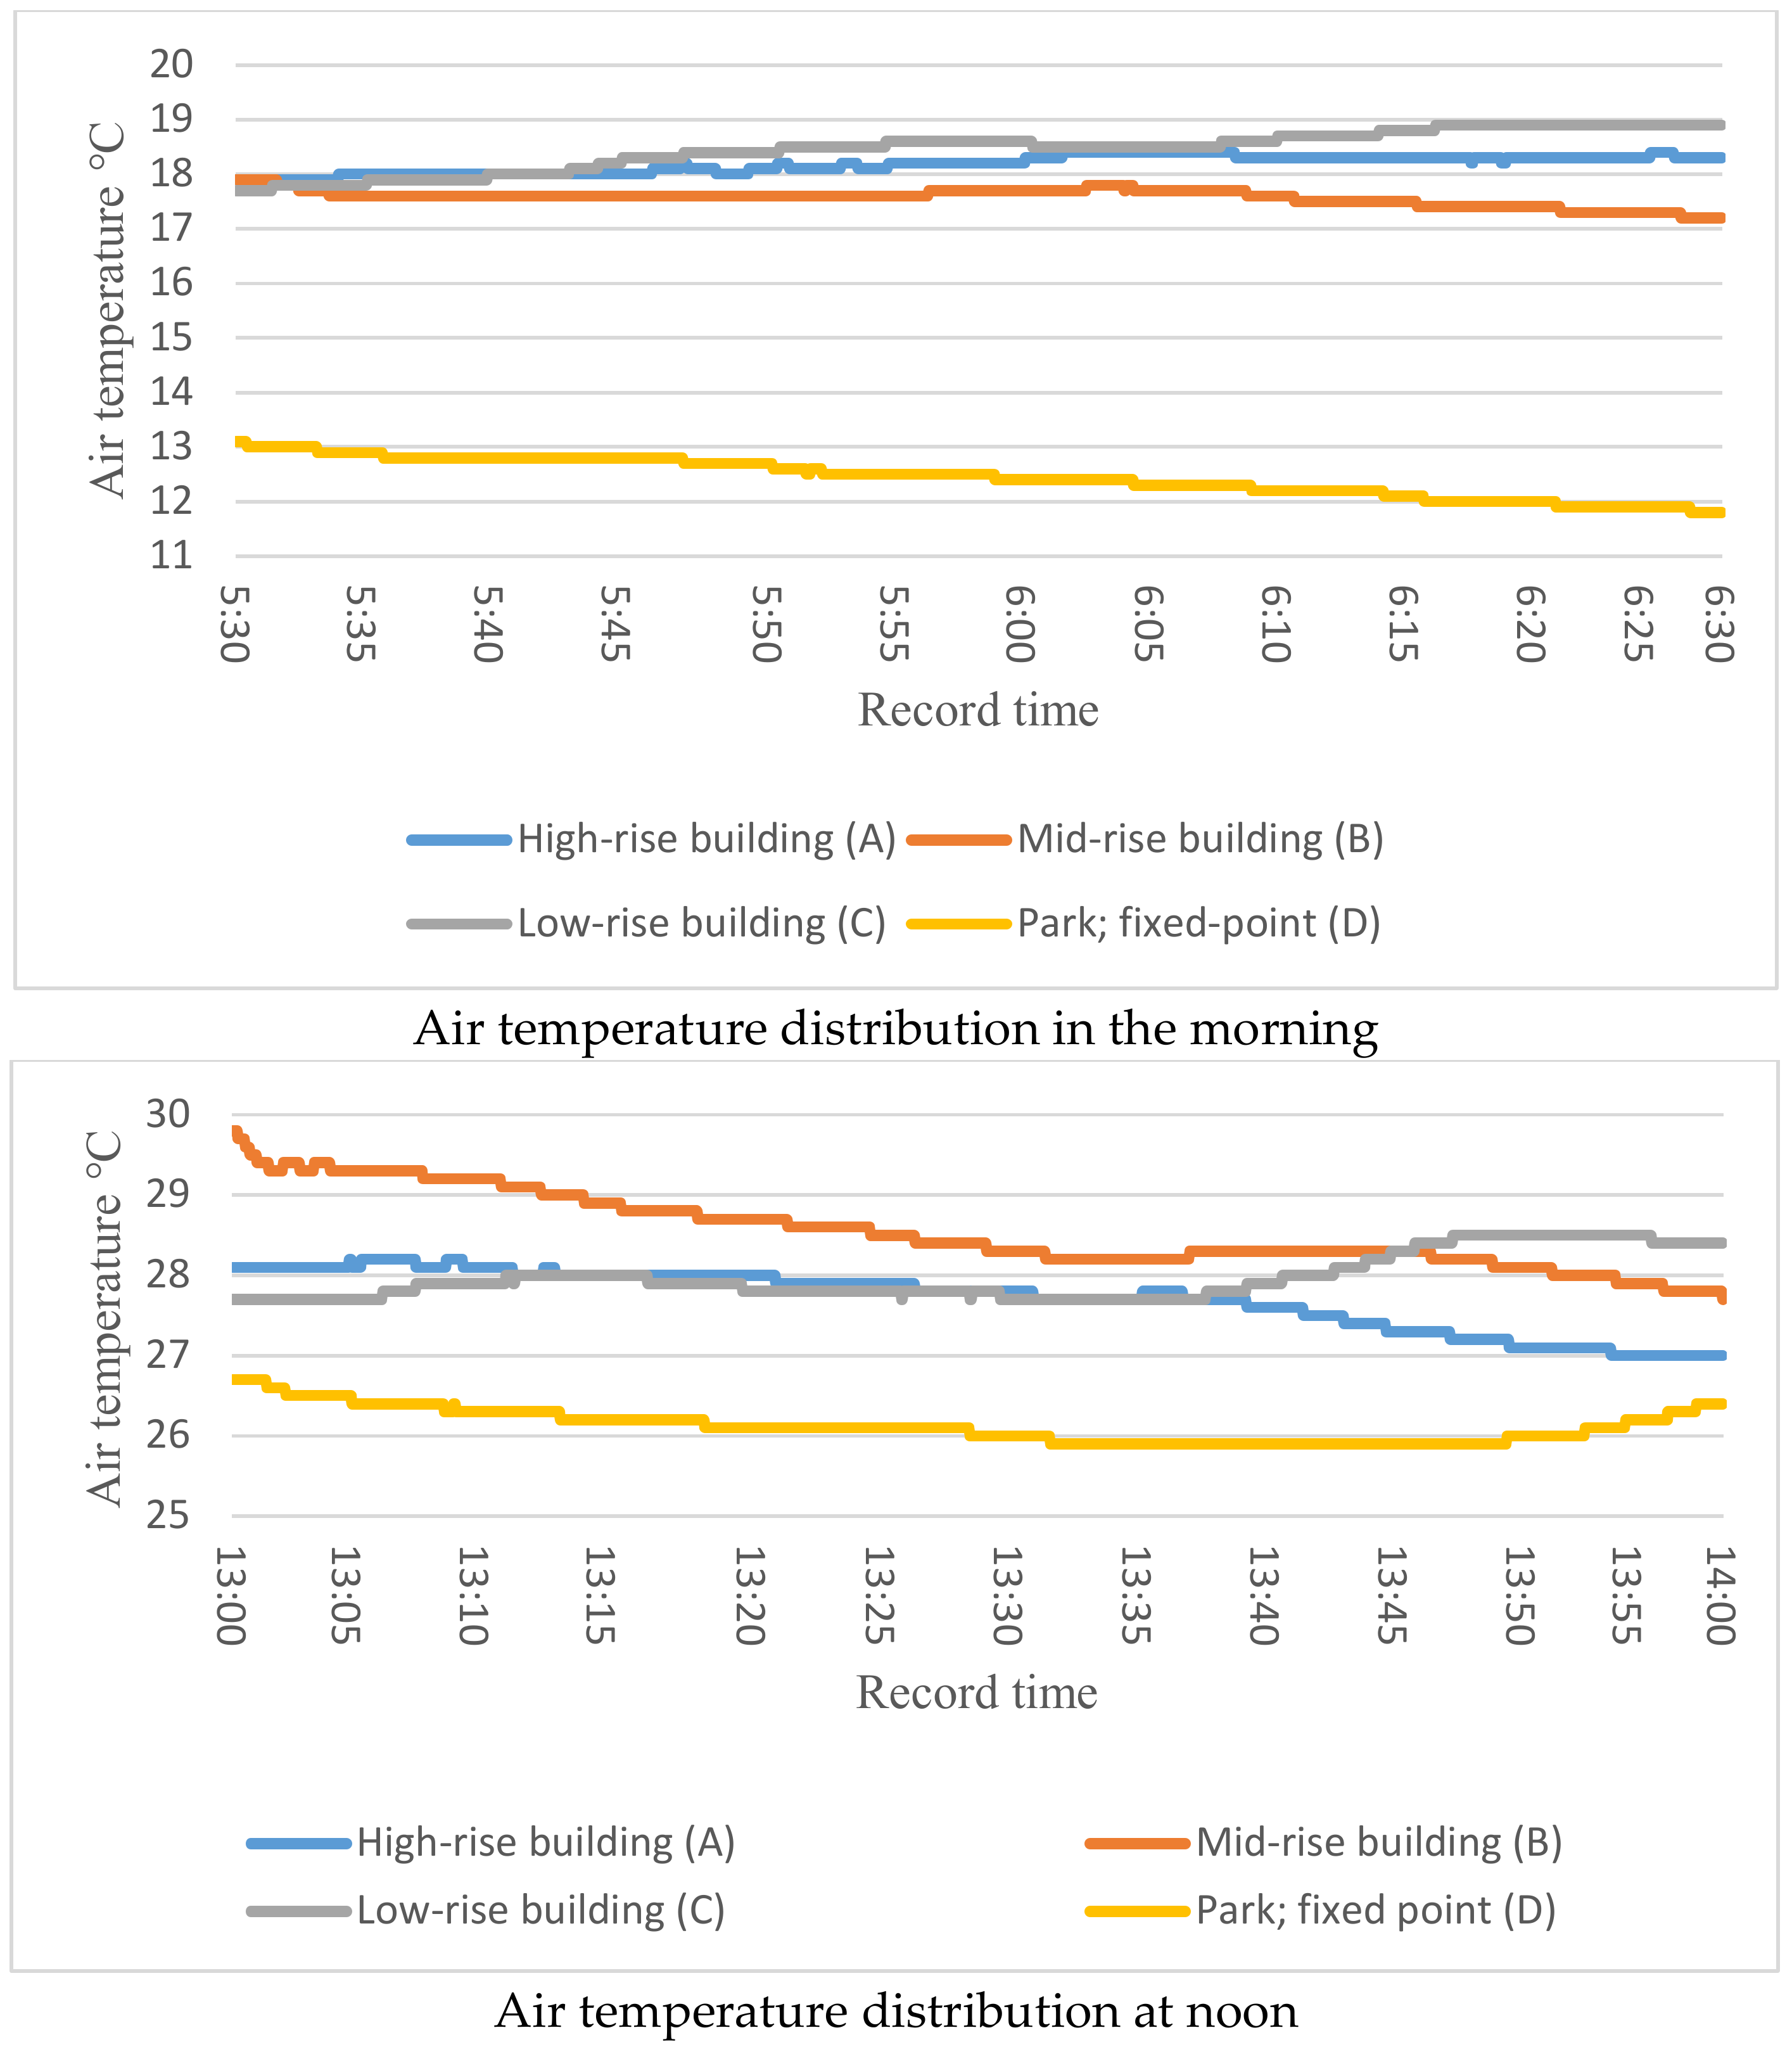
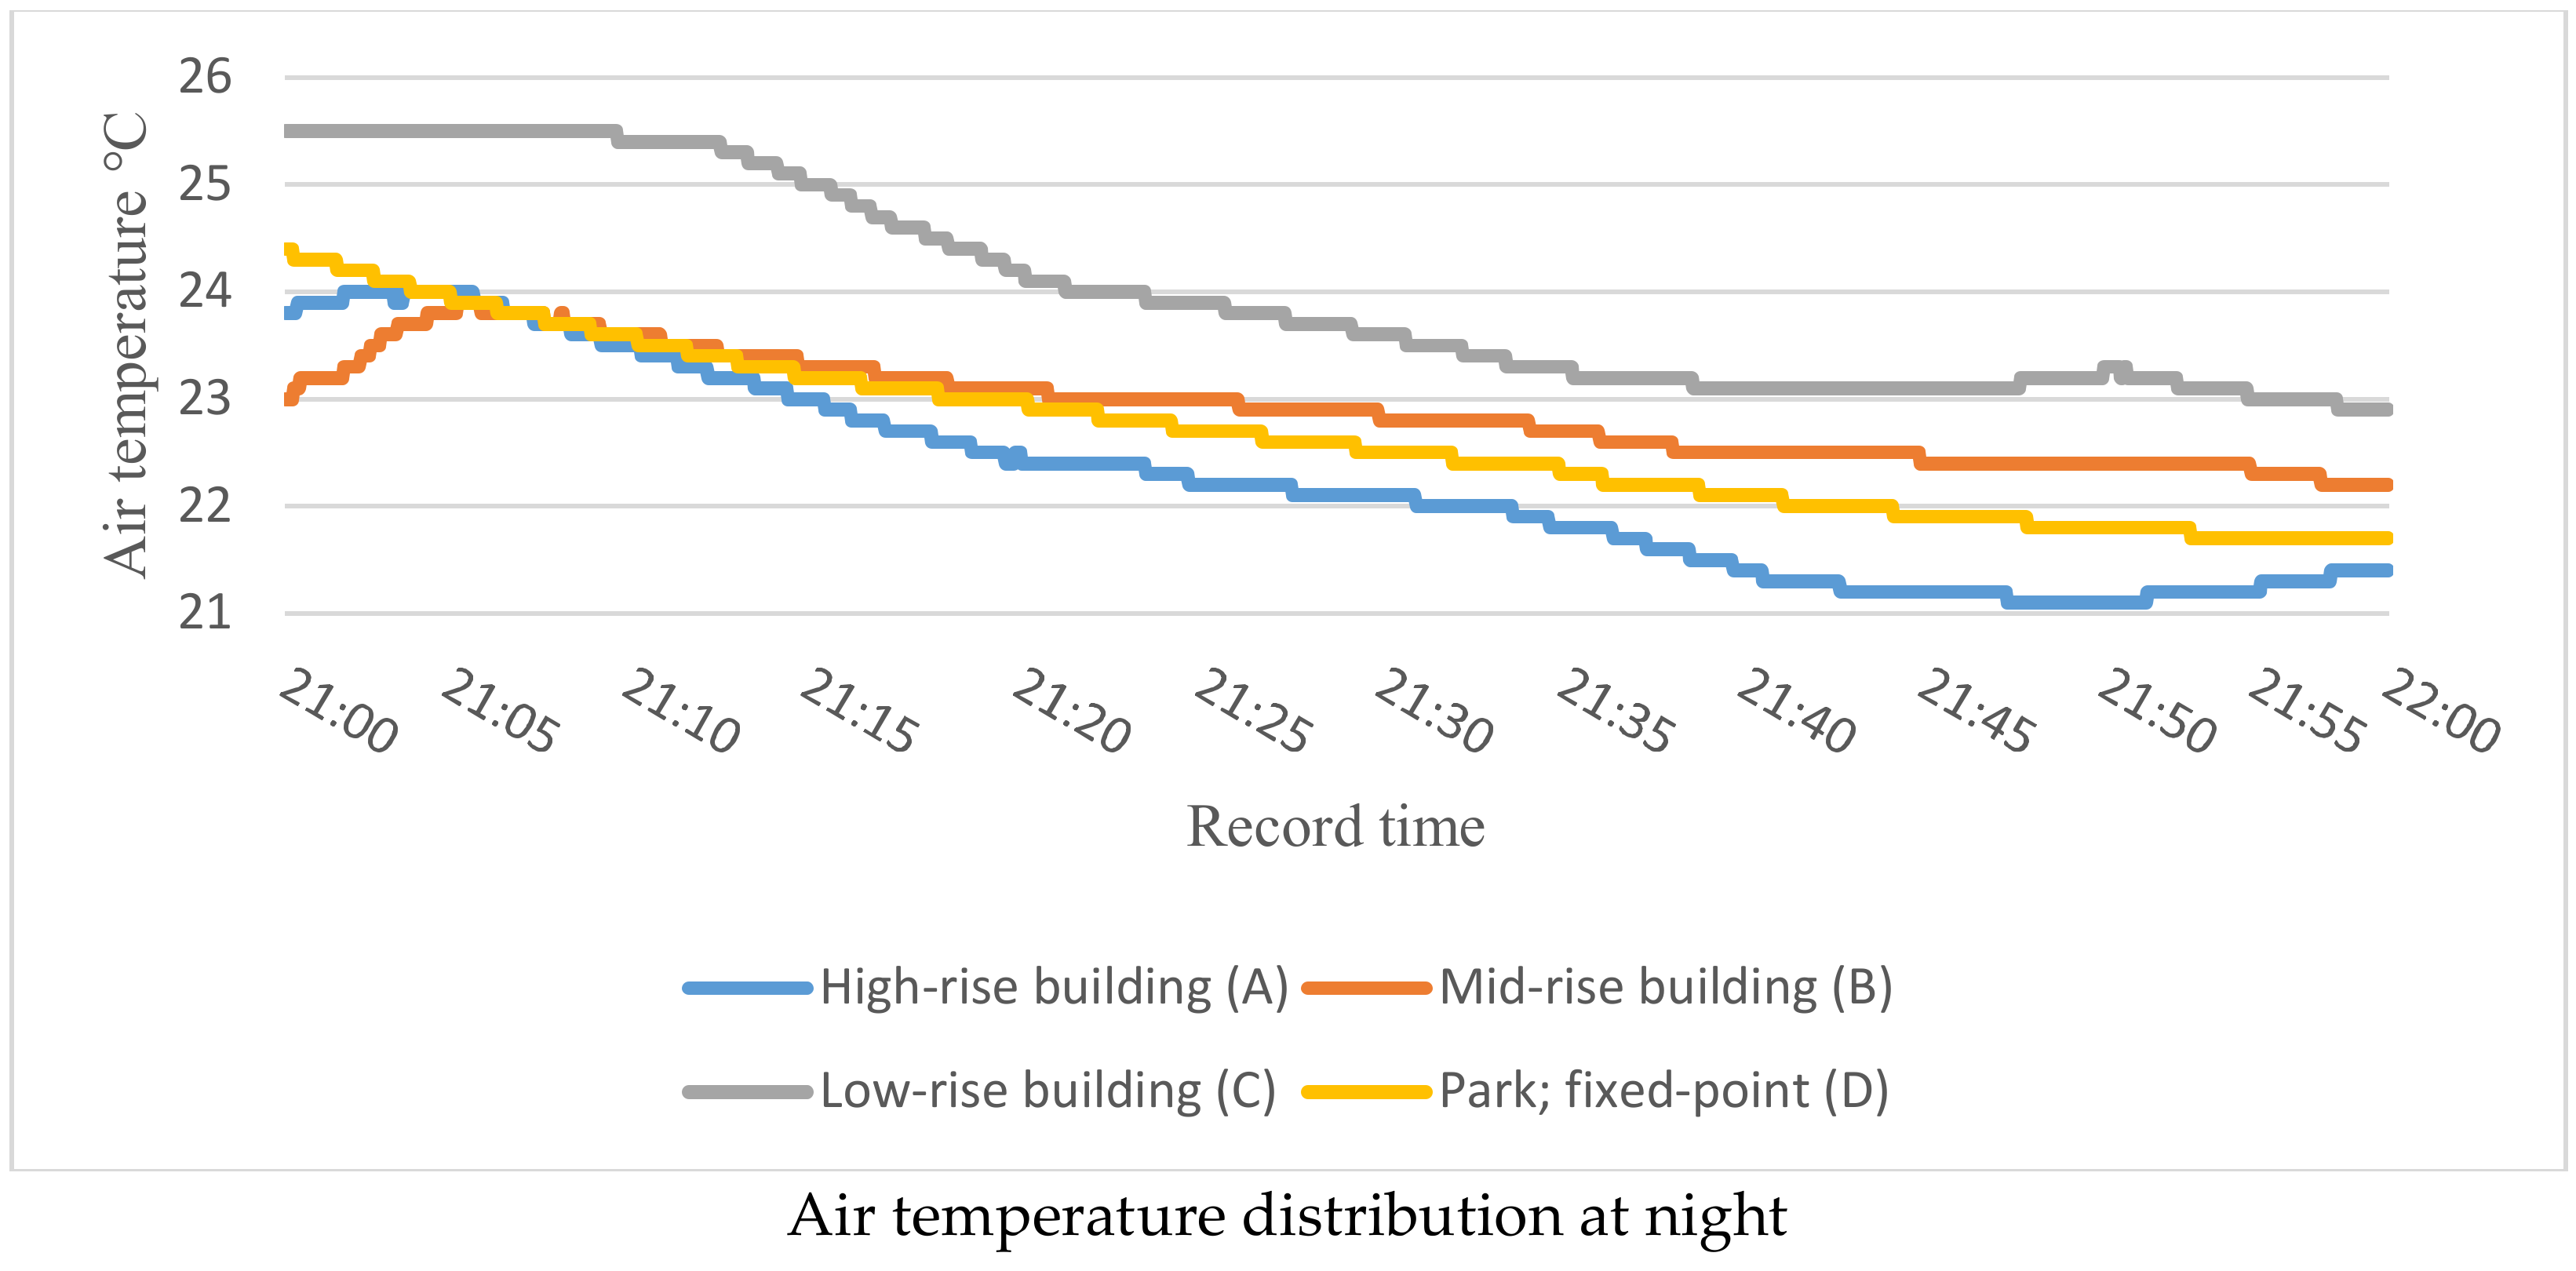
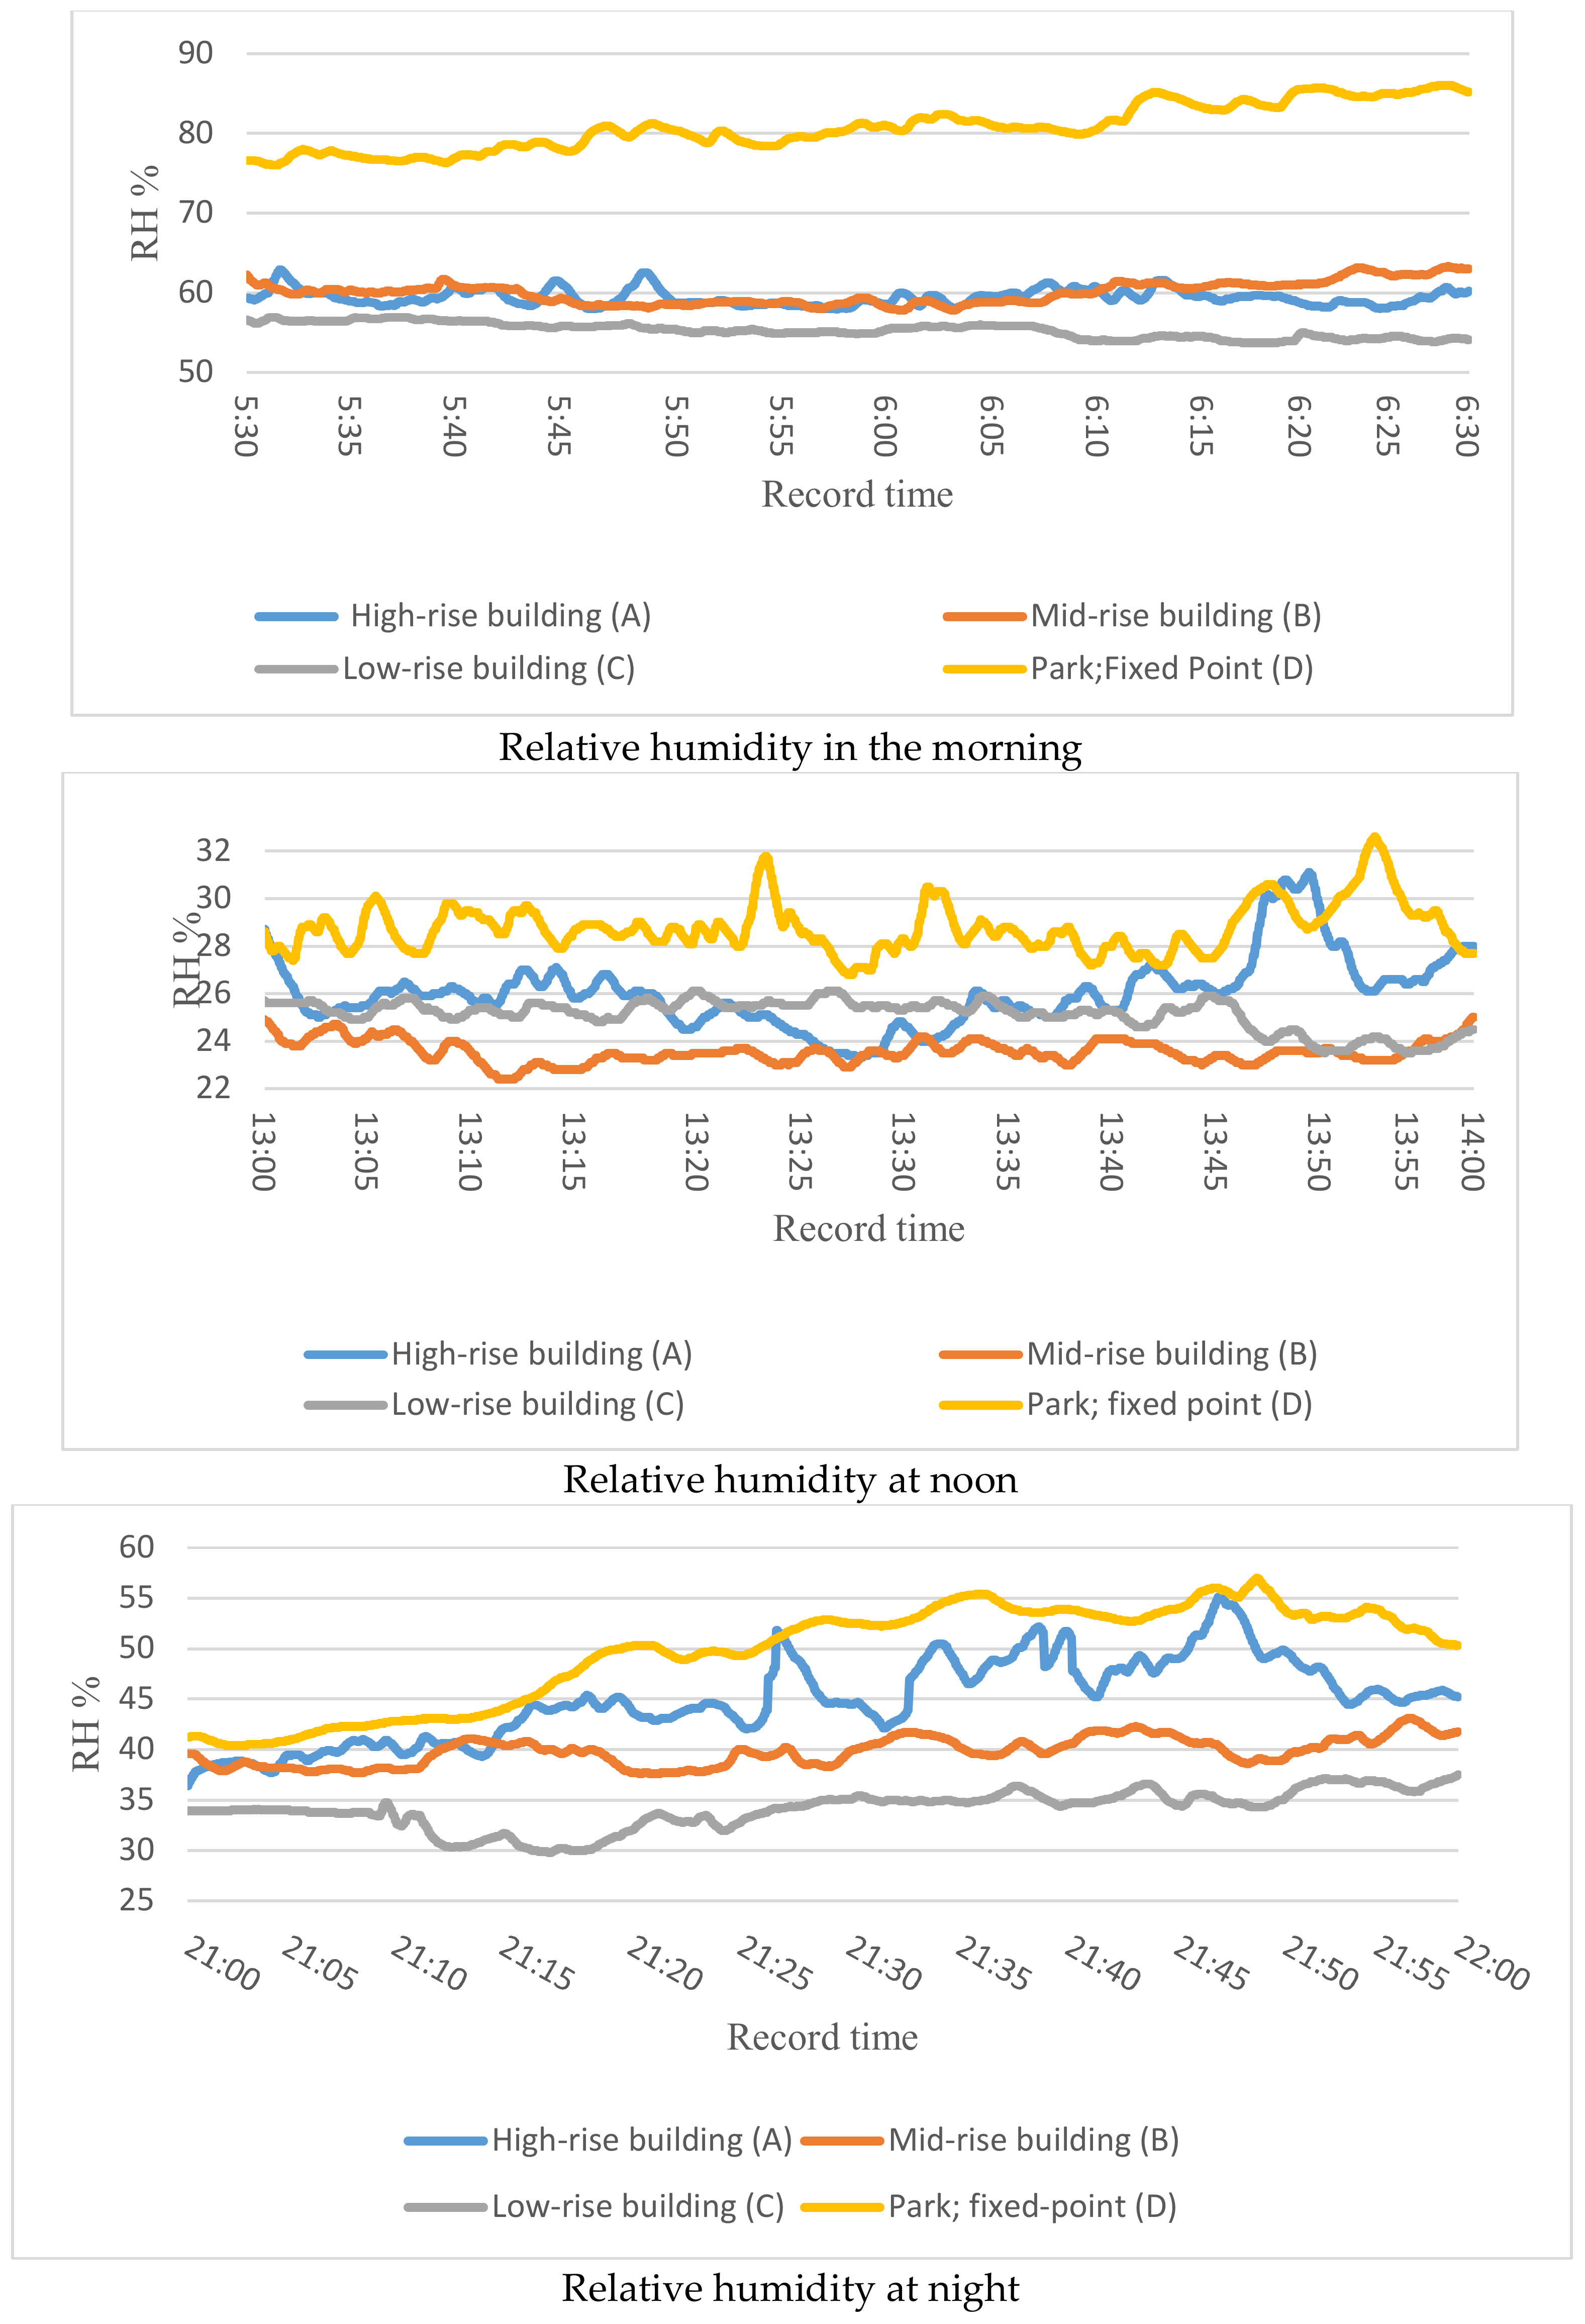
The third step involved the mobile observation [48] of meteorological data, remote sensing images, and climate factors focusing on air temperature (Ta), relative humidity (RH), solar radiation, and wind. Therefore, in order to study the influence of block morphology (form and height) on urban microclimates, fixed and mobile observation was adopted [49]. The main equipment and instruments included a small weather station that included a wind speed and direction indicator, anemometer (placed 1.5 m above ground and using JTSOFT Meter V1.3 software to extract the data—(JT Technology, Beijing, China), a small portable temperature and humidity meter (data-logger using TRLog software to extract the data), mobile camcorder, and a handheld global positioning system (HhGPS). For the mobile observation approach, a walking method at a speed of 3 km/s for all blocks was used in the morning (5:30–6:30 am), at noon (13:00–14:00 pm), and in the evening (21:00–22:00 pm). Observations and measurements were recorded at the same time for all blocks within the area of 1 km.
(d)
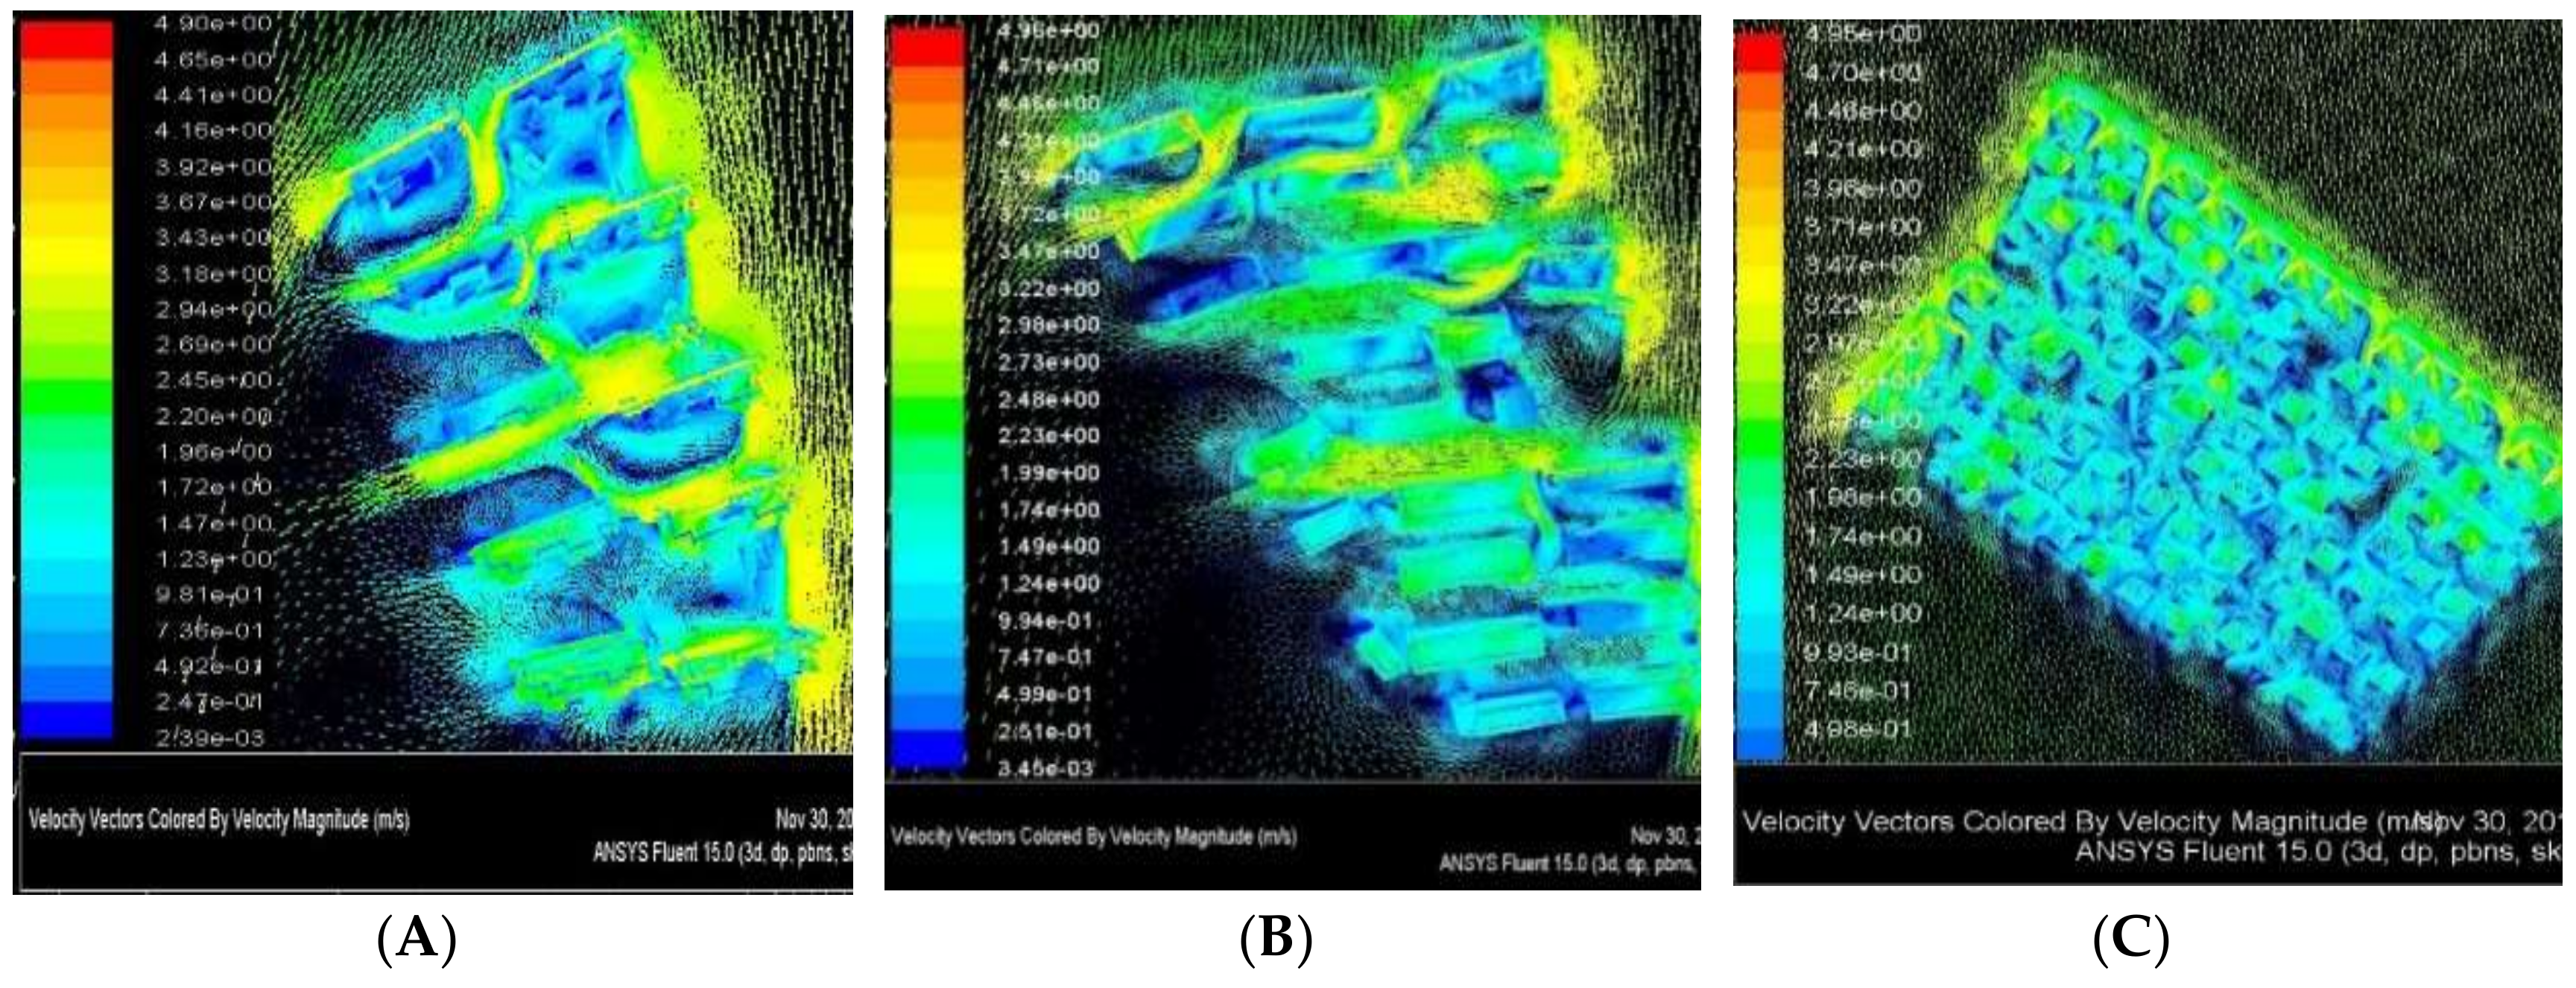
The fourth step was a simulation method using CFD [50,51,52,53] analysis in which digital models of low-rise, mid-rise, and high-rise residential blocks were generated (using AutoCAD 2018—AUTODESK, California, USA) and a CFD domain [54] was set up after adding proper mesh [55] on models by ICEM-CFD 15. The study was performed to evaluate urban microclimates with the interactive impact of building diversity on the thermal balance that involves wind flow.

2.2. Modeling Using the CFD Technique

2.2.1. RANS Equation System (Setting up the Standard k-ε Model)

Models that were classified as low-rise, mid-rise, and high rise residential blocks were digitally constructed and the CFD simulation was performed using ANSYS Fluent. A k-ε model was used and set as the standard model which is carefully chosen from the viscous model to set parameters for turbulent flow. The standard governing equations of incompressible turbulent wind flow around building models are connected and the Reynolds-averaged Navier–Stokes equations (RANS) (motion for fluid flow used to explain turbulent flows) are described as follows:
ρ ( u . ) u = . [ ρ l + ( μ + μ T ) ( u + ( u ) T ) 2 3 ( μ + μ T ) ( . u ) l 2 3 ρ k l ] + f
. ( ρ u ) = 0
ρ ( u . ) k = . [ ( μ + μ T σ k ) k ] + P k ρ ε
ρ ( u . ) ε = . [ ( μ + μ T σ ε ) ε ] + C e 1 ε k P k C e 2 ρ ε 2 k
μ T = ρ c μ k 2 ε
ρ k = μ T [ u : ( u + ( u ) T ) 2 3 ( u ) 2 ] 2 3 ρ k . u
where µ is the fluid’s dynamic viscosity (kg/ms); µT is the turbulent viscosity (kg/ms); u is the velocity field (m/s); ƿ is the density of the fluid(kg/m3); P is the pressure (Pa); k is the turbulent kinetic energy (m2/s2); and ε is the turbulent dissipation rate (m2/s3) of the turbulence model. The model constants in this simulation method are shown in Table 1.
These approaches are used to reflect the differences in the influence of different types of block morphology (block form; high-rise, mid-rise, and low rise) [36,57] on the urban microclimate and wind environment, which can provide targeted strategies for urban design to improve and regulate urban microclimates.

2.2.2. Computational Domain Size within the Urban Block Scale

To achieve more accurate results, the computational domain size for the three-dimensional (3D) model was recommended by Tominaga [58]; the lateral and the top boundary was 5H where H is the height of the object. Outlet-flow boundaries had a 15H max, where H max is the height of the tallest building. It should be taken into account that there is a probability of unrealistic consequences if the computational domain is expanded without exemplification of the environmental background. In this respect, natural ventilation of urban outdoor spaces is an essential approach in the direction of a sustainable and energy-efficient built environment and it can significantly alleviate UHII and energy consumption.

3. Study Area and Setting

3.1. Study Area

Wuhan City is the capital of Hubei province, which is located at the confluence of the Han and Yangtze rivers. It is the most populous city in central China [59]. Wuhan occupies a total land area of 8573.5 km2, 1014.8 km2 of which is urbanized, including 709.9 km2 of urban land, and 304.9 km2 of other construction lands. Wuhan has been affected by urbanization to a high population density (1200 persons per km2), making the population about 11.08 million in total. By 2020, it is predicted to increase to 11.4 million. Development at this rate will require more construction land to accommodate the population. Accordingly, in 2016, the area of land use for urban land construction in the urban area had reached 709.9 km2. Accordingly, the mean air temperature enhancement in Wuhan for every decade has reached 0.4 °C, with the UHII of the area achieving 2 °C.
Consequently, there is a strong relationship between urban population and urban land, which increases the UHII. In Figure 2, the parallel lines obviously show this strong correlation. Therefore, Wuhan along with Shanghai has experienced rapid urbanization over the past three decades. Apart from the rapid expansion of built areas, large changes in landscape structure formed UHIs, which are the most significant and dramatic reflection of an urbanization process and this causes serious consequences for the ecological environment.
In general, Wuhan has a humid subtropical climate with abundant rainfall; the average temperature ranges from 15–20 °C, the mean annual precipitation is about 1300 mm and the summer period is approximately 135 days a year [60]. According to the meteorological data analysis, Wuhan’s prevailing wind direction in winter is northeast (NNE) and southeast (SE) in summer [61]. The study areas are at latitude 30°26′25.7″–30°26′37.5″–30°25′50.9″ and longitude 114°26′17.3″–114°26′37.6″–114°26′41.5″, which correlate to the urbanized area according to the urban expansion of Wuhan. For field and mobile observation and measurements, we set all devices related to climate change to measure the environmental change influenced by different main building classes in the urban area. Accordingly, to more closely examine the effects of urban form, we selected three sample zones from the Jiang Xia district, which are residential high-rise buildings (A), residential mid-rise buildings (B), and residential low-rise buildings (C). These samples are located in the urban fringe where the land-use cover has been most changed by transforming suburban areas into urban land, where farmlands and lakes have turned into construction land due to the urbanization process. Figure 3 shows a rapid urbanization process on Wuhan’s fringe and the case study areas in the Jiang Xia sector with building density classification according to gross floor area (GFA)/PR.

3.2. Case Settings

For this study, three cases with a fixed point area were designed accompanied by four groups for field/mobile observations to quantitatively investigate the interactive impact of building diversity on the thermal balance and microclimate. There are the frequently-used spaces with the three major types of buildings on which city formation generally depends and which significantly influence the environment and urban microclimate. Regarding land-use/land-cover changes (LU/LC), all cases are based on the city transformation, especially the reduction in farmlands and water bodies in Wuhan from 1980 to 2018. Therefore, the first group of cases in area A is a high-rise residential building sample; the second group in area B is a mid-rise residential building sample and the third group in area C is a low-rise residential building sample. These were selected for mobile observation. In addition, the last group in area D was selected for fixed observation. The observation and measurement of all cases simultaneously begins and ends at the same time in the morning, noon, and evening, which obviously can show and discover heat balance change (heat gain and heat loss) in the urban residential environment. The study investigated the impact of residential building diversity on the surrounding environment regarding morphological indicators to mitigate UHII [25]. Accordingly, mobile/field observations were implemented to examine the impact of building diversity with morphology on urban microclimate factors within urban blocks. Figure 4 presents the main samples of residential blocks as a concept for field/mobile observation (A, B, C) and also presents sample D, which is a flat area in the park with entirely natural vegetation, as a fixed point. Therefore, the surrounding environmental modifications of each of the dominant samples are measured and analyzed to identify the heat gain and heat loss of the surfaces. The details of the case settings are provided in Table 2. By 2020, we predict that the area of land used for urban construction in the built-up area will rise to 542.2 km2, which may intensify UHII and change the heat balance.

3.3. Data Source

For long-term observations, monthly meteorological data of air temperature, relative humidity, and wind velocity were applied and used for this study. This data was provided by Hubei Meteorological Bureau (HMB) in Wuhan for every ten years. In this study, satellite remote sensing techniques were also applied and analyzed to highlight all the changes due to the urbanization and UHII. Therefore, to clarify the effect of urbanized areas on urban microclimates and the surrounding environment, field and mobile observation data of the different building classes of urban blocks, which are the most frequently used spaces for residents, were collected. Based on the long-term observation of Wuhan’s urbanization and land cover changes, a fixed and mobile observation dataset to determine heat balance change quantity regarding heat loss and heat gain was established. Data for land-cover changes, especially water surfaces and urban land, were investigated by ArcMap 10.4.1 as a geospatial processing program based on raster maps with the property of cell size (X, Y) and value 30, 30 and at a spatial resolution of one meter (linear unit). Case setting data of cases (A, B, C), such as building density, plot ratio, and greenery ratio, were set based on the field/mobile observation at Wuhan’s fringe in 2018. The final data were calculated to show the effect of residential urban blocks on microclimates and thermal environments, which are intensified by increasing urban lands (ULs).

4. Results

4.1. The Impact of Land Use Change on UHII

Since the last century, urbanization due to rapid economic development has caused a reduction of water bodies in the urbanized area of Wuhan. However, in 1980, land-use transformation became more serious with farmlands and water surfaces being transformed into urban land. According to the record from 1980 to 2016, land cover was transformed significantly in the inner-city of Wuhan; water surfaces were reduced by 145.64 km2, around 16% of the total range of the water bodies. By land-use transformation, urban land increased 3.2 times, about 489.3 km2. Figure 5 shows the land-use transformation which formed the urban morphology of the case study area.
To investigate the impact of land-use transformation on UHII, we compared the climate change in air temperature and relative humidity of Jiang Xia from 1980 to 2016 (Figure 6). To optimize the results of climate change at Wuhan, Jiangxia area was compared, by the average temperature and relative humidity, to a larger area (Caidian, Huangpi, Xinzhou). Figure 7 shows a correlation between the air temperature and relative humidity during the urbanization process, regarding the urban land extension and water surface reduction of Wuhan, which have determined climate change. By this connection, Jiangxia, with a higher relative humidity (4.05%) and temperature (0.7%) compared to the larger area, has a greater climate change. Significantly, results show that Wuhan is facing more serious climate change problems due to the unprecedented growth of urbanism and rural-urban migration, which accelerates the UHII. Due to the decrease in the water surface area, the UHII increased in the urbanized area. Accordingly, the air temperature in Wuhan is increasing at a mean rate of 0.4 °C per decade, while the dominant UHII of the area is approximately 2 °C. Therefore, the time periods mentioned above are those with the most obvious impact on UHII by land cover transformation. Urban microclimates have changed, and in urban areas people experience more heat due to the surface urban heat island enlargement (SUHI), which has considerably affected their thermal comfort.
As discussed above, by increasing urban land and reducing the water surface, the total average area of UHII increased in the urbanized environment of Wuhan. The results of long-term observation in both remote sensing images and meteorological data indicate that the reduction in water surface can greatly decrease the possibility of alleviating the UHII through urban ventilation. Data analysis from the Wuhan weather station reveals that the mean annual wind speed is 2.8 m/s. The final results of long-term observation show that the UHII in 1980 was not as serious as in 2016, especially before water surfaces were transformed into urban land. The outcome shows that under present conditions, night-time ventilation is not as effective as before, according to the lake area reduction. It is well-known that the water area causes cooling of the urban atmosphere. The area of the water surface as an open space in the city may reinforce urban ventilation and relieve the gained heat through the urban surfaces within the city blocks. However, contemporary urbanization has progressively but surely reduced the cooling effect. Land-use transformation increasingly reduced the air cooling effect on the surrounding environment with outcomes that clearly show that outdoor thermal comfort in Wuhan is not as good as in 1980.

4.2. The Impact of Urban Block Morphology on Urban Microclimates

Figure 8 gives the daytime air temperature of different residential sampling zones in case A (high-rise buildings), case B (mid-rise buildings) and case C (low-rise buildings). This provides the distribution of the air temperature difference between the three cases at distinct times. The impact of urban block morphology and building diversity on air temperature during the day is revealed in Table 3. Furthermore, Figure 9 presents the relative humidity in cases A, B, C, and D regarding the fixed and mobile observations at distinct times (a, b, c); the results of which are evidently interrelated with air temperature. In general, all field observations and investigations for each sampling zone were applied in the morning (5:30–6:30 am), noon (1:00–2:00 pm), and night (9:00–10:00 pm), respectively. The air temperature distribution in the early morning shows a significant gap between case D and the other built-up environments in residential urban blocks; a difference of 5.4 °C. Accordingly, results show that at night, the amount of air temperature distribution is different according to the block morphology indicators, which, in the case of D, are higher than the high-rise buildings and lower than the low-rise and mid-rise buildings, respectively. These changes show the significant impact of urban block morphology on the urban microclimate, which is intensified by SUHI in developed areas.
The air acts as a natural insulator and does not transfer heat easily. Therefore, when the sun heats the urban land, the warm surfaces of the land will gradually heat the layers of air around the urban surfaces. Outcomes illustrate that the gained heat between urban blocks gradually transferred to the air layers near the earth but not to the higher air layers, thereby impacting on the urban microclimate. In this regard, comparison of the cases shows a significant impact of different residential urban block morphological indicators; especially BD and PR, together with GR and WS, on the surrounding environment, which can certainly change the heat balance and urban microclimate. In view of that, the air temperature difference between case D and the other cases is about 5.4 °C, which is caused by the greenery ratio (80%) and water body/surfaces (7.2%) within the field measurement area. This area is the coldest area with a significant air temperature difference on the block atmosphere as obtained from the comparative analysis in the morning. At the same time, the air temperature in case C is higher than in other cases because the building density ratio is 23%, which is higher than other types.
In this respect, we can define a link between air temperature change and building density ratio. Moreover, the plot ratio in case A is about 16.6, which has a considerable impact on the heat balance in high rise buildings, whereas cases B and C are 5.6 and 2.1, respectively. This morphological factor can increasingly influence the air temperature as well, where building density (BD-A_19%) is lower than in other cases (BD-B_21%, BD-C_23%) but the plot ratio (PR) is higher. This demonstrates that BD is a significant indicator, along with PR, in residential urban blocks, which are the most frequent use of space in the city blocks. Additionally, for case B, the air temperature is less than cases A and C because the greenery ratio in case B is 25% of the total area, while building density and plot ratio are 21% and 5.6%, respectively. This illustrates that air temperature reduction will occur when the greenery ratio (GR) increases and BD decreases within the built-up area.
At noon, solar radiation heats up the urban surfaces, which continually absorb it. Hence, these surfaces will not simply continue to heat up but, in response to this heating will emit long-wave radiation into space and these emissions cool the surfaces. Through the influence of the morphological factors mentioned above; according to the reflection, transmission, and absorption of heat gained all over the land surfaces, the air temperatures in all cases decline, except in case C which increased because of the higher BD ratio, as well as the lower GR and PR. Accordingly, gained heat is accumulated as a result of the reduction of air movement in a densely built-up area which changes the heat balance, which increasingly affects the air temperature that increases by about 1 °C. The air temperature in other cases decreases due to the effect of building density and greenery ratio factors. In this respect, BD_GR in cases B and A are 21%_25 and 19%_19, respectively. This indicates a strong relationship between building density and green ratio on the surrounding environment. In comparing the cases, we revealed that the UHII in the higher density area (case C) is more significant during both times of day and at night, while due to the air flow obstruction effect of high rise buildings (case A), the UHII is more significant at night time. Therefore, according to the dense area of case C, the speed of air movement to mitigate the UHII is lower for the other cases.
Investigation of building diversity within the urban block scale revealed that block morphological indicators have a significant impact on the urban microclimate and outdoor thermal comfort during the day, especially when urban block surfaces are cooling due to nighttime heat loss. These indicators can greatly impact urban microclimates due to the heat balance changes, thereby intensifying UHIs. In this regard, urban block morphology indicators have a strong impact on adjusting urban microclimates to achieve a desired thermal environment within a city block.

4.3. CFD Simulation Results

Computational fluid dynamic (CFD) simulation for wind flow around a building was conducted with a k-ε turbulence model to investigate the impact of morphological indicators and building diversity on the urban microclimate. The simulation procedure starts with the creation of the building geometry via three-dimensional models, followed by grid generation with ICEM CFD 15 followed by the mathematical solution of the problem through simulation using ANSYS Fluent (ANSYS, Inc, Pennsylvania, USA). As a result of water surface reduction and the significance of the wind environment to mitigate UHII and adjust the thermal environment, a steady-state RANS simulation provides an average flow field to study the wind environment pattern [62]. Comparative analyses of different layouts with major building models (A, B, C) are shown in Figure 10 and the results are as follows:
(a)
The air change rates in cases A, B, and C are 3 m/s, 2.4 m/s, and 1.2 m/s, respectively. It shows that high-rise buildings with a high-value plot ratio can increase the air movement around the building and force the wind at the top of the buildings downwards to the earth.
(b)
The low-rise building model in the compact and dense area shows that heat gained during the day increases, but cannot be released efficiently and so increases the air temperature because of a lack of ventilation.
(c)
By reducing the air movement in the dense area in case C, relative humidity will decline substantially and increase UHII.
(d)
In the mid-rise building model, the air movement is almost at the average rate with a larger comfort zone, which is related to the proportion rate between building density and plot ratio.
(e)
Overall, building density is the most important morphological indicator to increase UHII compared with open spaces which, according to the plot ratio indicator, can reinforce air movement and increase natural ventilation to mitigate the negative effects of UHIIs.
Consequently, depending on the city, the building density and plot ratio are the most important morphological indicators to adjust the thermal environment and reduce building energy demand. On this subject, the heat balance change is directly linked to the urban morphology layout and improvements in the urban form and the appropriate building design can mitigate the increased thermal load and efficiently adjust both the urban microclimate and energy consumption.

5. Discussion

China’s urbanization rate increased by approximately 40% in 30 years [63]. Through urbanization, urban land cover has dramatically changed, which has had a serious effect on urban microclimates and caused environmental deterioration [64,65,66]. This long-term observational study illustrated that Wuhan has been increasingly urbanized and UHII has become more serious and has dramatically altered heat balance and effects on thermal comfort. The present study shows that a great land-use transformation occurred in Wuhan city fringe, which has significantly accelerated UHII due to the land-use transformation of green spaces, farmland, and water bodies into urban land.
Based on the related studies of urbanization and land use/land cover changes [1,20], and according to the statistical data analysis, we found a linear and strong relationship between the current population and urban land use which can change the urban morphology and increase UHII (Figure 3). In this regard, the mean air temperature for Wuhan increased by 0.4 °C in every decade, thereby progressively increasing the UHII.
Referring to the importance of the impacts of urban surfaces on the surrounding environment [11,12], water surface reduction has caused the increase of UHII. In addition, together with an urban surface expansion and roughness length growth, it has significantly deteriorated the natural ventilation and the air movement, which could have alleviated the negative effects of UHII. The water bodies as open spaces in the city can reinforce urban ventilation and relieve the gained heat through the urban surfaces. The results of long-term observation, according to the land-use transformation for Wuhan show that UHII in 1980 was considerably less serious than in 2018.
Air movement with natural ventilation is beneficial for the sustainable development of cities and in this regard, urban morphology parameters need to be considered [67]. In addition to the above results, we also discuss the impact of urban block morphology indicators and their changes on the urban microclimate. By comparing the major building classes in residential areas, we discovered that block morphological indicators such as BD, PR, GR, and WS have a great impact on the surrounding environment, and can strongly influence the air movement, air temperature, and outdoor thermal comfort. By that connection, the air temperature will increase, together with increasing BD and PR indicators (Figure 7). Accordingly, by increasing GR and WS, the air temperature will decrease and this present study indicates the significance of these indicators in adjusting microclimates within urban block morphology.
By just increasing PR, the air temperature will become lower than a higher BD development pattern in the daytime, which is linked to the air movement and the obstruction effect of the densely built-up area (Figure 7). Furthermore, we also found that relative humidity (RH) and air temperature are interrelated in both day-time and night-time; while RH rises, the temperature falls and as the temperature rises, the RH falls as shown in Figure 7 and Figure 8. Accordingly, the temperature is lower in a high-rise building at night, because the RH is higher, and in the dense area of case C, the temperature is higher because the RH is lower. We found that in a high-density development layout, an increase in wind speed is necessary to alleviate the UHII phenomenon.
Heat balance and SUHI effects on UHIs are discussed in previous studies [68,69]. We also discuss the heat balance change due to the heat gain and heat loss to discover the interactive impact of building diversity on the microclimate within residential urban blocks, which can mitigate the UHII. Microclimate changes are affected by SUHI and we found that after the aggregation of heat, and due to the heat gain and heat loss, SUHI values increase dramatically during daytime more than at nighttime. Therefore, an increasing SUHI causes air temperature to rise, which can significantly impact heat balance changes.
Also, the simulation method with CFD analysis with a three-dimensional (3D) k-ε turbulence model was used to solve the Reynolds-averaged Navier-Stokes equations [43]. This method was applied to investigate the interactive impact of major building classes on the thermal environment. Modeling and analysis using the CFD technique revealed that building density has a great impact on increasing UHII, which, according to the plot ratio indicator, can reinforce air movement via natural ventilation.
Correlations show that urban block morphology and its indicators, together with SUHI expansion, have a significant impact on urban microclimates. They can greatly affect heat balance change and the urban thermal environment, which makes considering them during urban block design essential for achieving thermal comfort for residents.

6. Conclusions

The twenty-first century has witnessed a change in urban morphologies of the cities in China due to rapid urbanization. Of all the cities, Wuhan City has been dramatically affected by these changes, which has been accompanied by the transformation of water surfaces into urban land and the decline of natural ventilation. The present study aimed to investigate the interactive impact of building diversity on the thermal balance and micro-climate change under the influence of rapid urbanization. After a series of data analyses, conclusions are drawn as follows:
(1)
The UHII increased by 2 °C as a result of a 16% decrease in water surface area within the developed regions of Wuhan, and the wind speed decreased substantially because of an increase in urban land cover and a reduction in water surfaces in urban areas. This change in water surface area also caused a decline in both natural ventilation and air movement that could have alleviated UHII.
(2)
Wuhan urban land cover area has turned over three-fold compared to that of 1980, which consequently has enlarged the SUHI. This increase, with reduction in water surfaces in developed areas, has caused more heat gain, which has led to the destruction of the ecosystem and changed the heat balance and microclimate within urban blocks.
(3)
Investigations have shown that Wuhan is developing rapidly with more of a tendency to develop in the urban fringe, and if the city develops along the same lines, UHII will progressively increase and natural ventilation will dramatically decrease by 2020.
(4)
Urban morphology and block morphological indicators have a significant impact on microclimate and heat balance within the urban blocks, in which building density has the strongest effect on the environment, and plot ratio is another indicator that can intensify the air movement within the blocks. Depending on the combination of changes for the indicators, various changes can be found for air temperature and UHII. These indicators can mitigate UHII by controlling the air movement around the building.
This study shows that there is a strong relationship between urban morphology and the local climate; consequently, there is a strong linkage of block morphological indicators with climate factors, which can adjust urban microclimate.

Supplementary Materials

The following are available online at https://www.mdpi.com/2071-1050/11/6/1662/s1.

Author Contributions

Conceptualization—M.M.; Formal analysis—M.M.; Funding acquisition—B.L.; Investigation—M.M., M.E. and Z.K.; Methodology—M.M. and Z.K.; Project administration—M.M.; Software—M.M.; Supervision—B.L.; Validation—M.M.; Writing—original draft, M.M.; Writing—review and editing, M.A.—Investigation and data collection.

Funding

This research was funded by the State Key Program of National Natural Science of China (Grant No. 51538004), and the Independent Innovation Fund of Huazhong University of Science and Technology (Grant No.0118220100).

Acknowledgments

This work was supported by the State Key Program of National Natural Science of China (Grant No. 51538004) and the Independent Innovation Fund of Huazhong University of Science and Technology (Grant No. 0118220100).

Conflicts of Interest

The authors declare no conflict of interest.

References

  1. Arsiso, B.K.; Mengistu Tsidu, G.; Stoffberg, G.H.; Tadesse, T. Influence of urbanization-driven land use/cover change on climate: The case of Addis Ababa, Ethiopia. Phys. Chem. Earth Parts A/B/C 2018, 105, 212–223. [Google Scholar] [CrossRef]
  2. Dihkan, M.; Karsli, F.; Guneroglu, A.; Guneroglu, N. Evaluation of surface urban heat island (SUHI) effect on coastal zone: The case of Istanbul Megacity. Ocean Coast. Manag. 2015, 118, 309–316. [Google Scholar] [CrossRef]
  3. Li, X.; Li, B.; Chen, H. Study on the relationship between urban land sprawl extension and urban thermal environment—Taking Wuhan city as an example. Theor. Appl. Climatol. 2018. [Google Scholar] [CrossRef]
  4. Li, Y.; Jia, L.; Wu, W.; Yan, J.; Liu, Y. Urbanization for rural sustainability—Rethinking China’s urbanization strategy. J. Clean. Prod. 2018, 178, 580–586. [Google Scholar] [CrossRef]
  5. Wu, J.; Xie, H. Research on Characteristics of Changes of Lakes in Wuhan’s Main Urban Area. Procedia Eng. 2011, 21, 395–404. [Google Scholar] [CrossRef]
  6. Lindberg, F.; Onomura, S.; Grimmond, C.S.B. Influence of ground surface characteristics on the mean radiant temperature in urban areas. Int. J. Biometeorol. 2016, 60, 1439–1452. [Google Scholar] [CrossRef]
  7. Li, H.; Zhou, Y.; Wang, X.; Zhou, X.; Zhang, H.; Sodoudi, S. Quantifying urban heat island intensity and its physical mechanism using WRF/UCM. Sci. Total Environ. 2019, 650, 3110–3119. [Google Scholar] [CrossRef]
  8. Noro, M.; Lazzarin, R. Urban heat island in Padua, Italy: Simulation analysis and mitigation strategies. Urban Clim. 2015, 14, 187–196. [Google Scholar] [CrossRef]
  9. Wang, C.; Wang, Y.; Wang, R.; Zheng, P. Modeling and evaluating land-use/land-cover change for urban planning and sustainability: A case study of Dongying city, China. J. Clean. Prod. 2018, 172, 1529–1534. [Google Scholar] [CrossRef]
  10. Salazar, A.; Baldi, G.; Hirota, M.; Syktus, J.; McAlpine, C. Land use and land cover change impacts on the regional climate of non-Amazonian South America: A review. Glob. Planet. Chang. 2015, 128, 103–119. [Google Scholar] [CrossRef]
  11. Garuma, G.F.; Blanchet, J.-P.; Girard, É.; Leduc, M. Urban surface effects on current and future climate. Urban Clim. 2018, 24, 121–138. [Google Scholar] [CrossRef]
  12. Garuma, G.F. Review of urban surface parameterizations for numerical climate models. Urban Clim. 2018, 24, 830–851. [Google Scholar] [CrossRef]
  13. Lee, D.; Oh, K. Classifying urban climate zones (UCZs) based on statistical analyses. Urban Clim. 2018, 24, 503–516. [Google Scholar] [CrossRef]
  14. Gaur, A.; Eichenbaum, M.K.; Simonovic, S.P. Analysis and modelling of surface Urban Heat Island in 20 Canadian cities under climate and land-cover change. J. Environ. Manag. 2018, 206, 145–157. [Google Scholar] [CrossRef] [PubMed]
  15. Taleghani, M.; Crank, P.J.; Mohegh, A.; Sailor, D.J.; Ban-Weiss, G.A. The impact of heat mitigation strategies on the energy balance of a neighborhood in Los Angeles. Sol. Energy 2019, 177, 604–611. [Google Scholar] [CrossRef]
  16. Rashdi, W.S.S.W.M.; Embi, M.R. Analysing Optimum Building form in Relation to Lower Cooling Load. Procedia Soc. Behav. Sci. 2016, 222, 782–790. [Google Scholar] [CrossRef]
  17. Cheng, J.; Qi, D.; Katal, A.; Wang, L.; Stathopoulos, T. Evaluating wind-driven natural ventilation potential for early building design. J. Wind Eng. Ind. Aerodyn. 2018, 182, 160–169. [Google Scholar] [CrossRef]
  18. Gu, Y.; Li, D. A modeling study of the sensitivity of urban heat islands to precipitation at climate scales. Urban Clim. 2018, 24, 982–993. [Google Scholar] [CrossRef]
  19. Levermore, G.; Parkinson, J.; Lee, K.; Laycock, P.; Lindley, S. The increasing trend of the urban heat island intensity. Urban Clim. 2018, 24, 360–368. [Google Scholar] [CrossRef]
  20. Zhou, X.; Chen, H. Impact of urbanization-related land use land cover changes and urban morphology changes on the urban heat island phenomenon. Sci. Total Environ. 2018, 635, 1467–1476. [Google Scholar] [CrossRef]
  21. Pakarnseree, R.; Chunkao, K.; Bualert, S. Physical characteristics of Bangkok and its urban heat island phenomenon. Build. Environ. 2018, 143, 561–569. [Google Scholar] [CrossRef]
  22. Zhou, Y.; Zhuang, Z.; Yang, F.; Yu, Y.; Xie, X. Urban morphology on heat island and building energy consumption. Procedia Eng. 2017, 205, 2401–2406. [Google Scholar] [CrossRef]
  23. Liu, M.; Zhong, Y.; Tan, J. Impact of Urban Planning Indicator on Spatial Distribution of Residential Heating and Cooling Energy Demand. Procedia Eng. 2017, 205, 959–966. [Google Scholar] [CrossRef]
  24. Dimoudi, A.; Kantzioura, A.; Zoras, S.; Pallas, C.; Kosmopoulos, P. Investigation of urban microclimate parameters in an urban center. Energy Build. 2013, 64, 1–9. [Google Scholar] [CrossRef]
  25. Yin, C.; Yuan, M.; Lu, Y.; Huang, Y.; Liu, Y. Effects of urban form on the urban heat island effect based on spatial regression model. Sci. Total Environ. 2018, 634, 696–704. [Google Scholar] [CrossRef]
  26. Guo, G.; Zhou, X.; Wu, Z.; Xiao, R.; Chen, Y. Characterizing the impact of urban morphology heterogeneity on land surface temperature in Guangzhou, China. Environ. Model. Softw. 2016, 84, 427–439. [Google Scholar] [CrossRef]
  27. Feyisa, G.L.; Meilby, H.; Darrel Jenerette, G.; Pauliet, S. Locally optimized separability enhancement indices for urban land cover mapping: Exploring thermal environmental consequences of rapid urbanization in Addis Ababa, Ethiopia. Remote Sens. Environ. 2016, 175, 14–31. [Google Scholar] [CrossRef]
  28. O’Malley, C.; Piroozfar, P.; Farr, E.R.P.; Pomponi, F. Urban Heat Island (UHI) mitigating strategies: A case-based comparative analysis. Sustain. Cities Soc. 2015, 19, 222–235. [Google Scholar] [CrossRef]
  29. Hu, Y.; White, M.; Ding, W. An Urban Form Experiment on Urban Heat Island Effect in High Density Area. Procedia Eng. 2016, 169, 166–174. [Google Scholar] [CrossRef]
  30. Ngie, A.; Abutaleb, K.; Ahmed, F.; Taiwo, O. Spatial modelling of urban change using satellite remote sensing: A review. In Proceedings of the IGU Urban Geography Commission, Johannesburg, South Africa, 21–26 July 2013; Available online: https://www.researchgate.net/publication/272183077_Spatial_modelling_of_urban_change_using_satellite_remote_sensing_a_review (accessed on 10 February 2019). [CrossRef]
  31. Chen, J.; Fan, W.; Li, K.; Liu, X.; Song, M. Fitting Chinese cities’ population distributions using remote sensing satellite data. Ecol. Indic. 2019, 98, 327–333. [Google Scholar] [CrossRef]
  32. Chen, W.; Zhang, Y.; Gao, W.; Zhou, D. The Investigation of Urbanization and Urban Heat Island in Beijing Based on Remote Sensing. Procedia Soc. Behav. Sci. 2016, 216, 141–150. [Google Scholar] [CrossRef]
  33. Langat, P.K.; Kumar, L.; Koech, R. Monitoring river channel dynamics using remote sensing and GIS techniques. Geomorphology 2019, 325, 92–102. [Google Scholar] [CrossRef]
  34. Kar, R.; Obi Reddy, G.P.; Kumar, N.; Singh, S.K. Monitoring spatio-temporal dynamics of urban and peri-urban landscape using remote sensing and GIS—A case study from Central India. Egypt. J. Remote Sens. Space Sci. 2018, 21, 401–411. [Google Scholar] [CrossRef]
  35. Kim, H.; Gu, D.; Kim, H.Y. Effects of Urban Heat Island mitigation in various climate zones in the United States. Sustain. Cities Soc. 2018, 41, 841–852. [Google Scholar] [CrossRef]
  36. Mavridou, M.; Hoelscher, C.; Kalff, C. The impact of Different Building Height Configurations on Navigation and Wayfinding. In Proceedings of the 7th International Space Syntax Symposium: Proceedings, Stockholm, Sweden, 8–11 June 2009; KTH Royal Institute of Technology: Stockholm, Sweden, 2009. [Google Scholar]
  37. Chang, S. Integrating CFD and GIS into the Development of Urban Ventilation Corridors: A Case Study in Changchun City, China. Sustainability 2018, 10, 1814. [Google Scholar] [CrossRef]
  38. Song, S.; Xu, Y.P.; Zhang, J.X.; Li, G.; Wang, Y.F. The long-term water level dynamics during urbanization in plain catchment in Yangtze River Delta. Agric. Water Manag. 2016, 174, 93–102. [Google Scholar] [CrossRef]
  39. Gui, K.; Che, H.; Wang, Y.; Wang, H.; Zhang, L.; Zhao, H.; Zheng, Y.; Sun, T.; Zhang, X. Satellite-derived PM2.5 concentration trends over Eastern China from 1998 to 2016: Relationships to emissions and meteorological parameters. Environ. Pollut. 2019, 247, 1125–1133. [Google Scholar] [CrossRef]
  40. Shi, T.; Huang, Y.; Wang, H.; Shi, C.-E.; Yang, Y.-J. Influence of urbanization on the thermal environment of meteorological station: Satellite-observed evidence. Adv. Clim. Chang. Res. 2015, 6, 7–15. [Google Scholar] [CrossRef]
  41. Du, Y.-D.; Ai, H.; Duan, H.-L.; Hu, Y.-M.; Wang, X.-W.; He, J.; Wu, H.-Y.; Wu, X.-X. Changes in Climate Factors and Extreme Climate Events in South China during 1961–2010. Adv. Clim. Chang. Res. 2013, 4, 1–11. [Google Scholar] [CrossRef]
  42. Wang, W.; Liu, K.; Tang, R.; Wang, S. Remote sensing image-based analysis of the urban heat island effect in Shenzhen, China. Phys. Chem. Earth Parts A/B/C 2019. [Google Scholar] [CrossRef]
  43. Zheng, Y.; Ren, C.; Xu, Y.; Wang, R.; Ho, J.; Lau, K.; Ng, E. GIS-based mapping of Local Climate Zone in the high-density city of Hong Kong. Urban Clim. 2018, 24, 419–448. [Google Scholar] [CrossRef]
  44. Mahmoud, S.H.; Gan, T.Y. Long-term impact of rapid urbanization on urban climate and human thermal comfort in hot-arid environment. Build. Environ. 2018, 142, 83–100. [Google Scholar] [CrossRef]
  45. Zhang, F.; Zhan, J.; Li, Z.; Jia, S.; Chen, S. Impacts of urban transformation on water footprint and sustainable energy in Shanghai, China. J. Clean. Prod. 2018, 190, 847–853. [Google Scholar] [CrossRef]
  46. Cai, D.; Fraedrich, K.; Guan, Y.; Guo, S.; Zhang, C.; Zhu, X. Urbanization and climate change: Insights from eco-hydrological diagnostics. Sci. Total Environ. 2019, 647, 29–36. [Google Scholar] [CrossRef] [PubMed]
  47. Wai, K.M.; Wang, X.M.; Lin, T.H.; Wong, M.S.; Zeng, S.K.; He, N.; Ng, E.; Lau, K.; Wang, D.H. Observational evidence of a long-term increase in precipitation due to urbanization effects and its implications for sustainable urban living. Sci. Total Environ. 2017, 599–600, 647–654. [Google Scholar] [CrossRef] [PubMed]
  48. Guo, L.; Li, B. Observation and Analysis of Urban Micro-Climate and Urban Morphology on Block Scale in Zhengzhou City. World Acad. Sci. Eng. Technol. Int. J. Mar. Environ. Sci. 2018, 12, 5. [Google Scholar]
  49. Sato, T.; Ooka, R.; Murakami, S. Analysis of sensible heat, latent heat and mean kinetic energy balance of moving control volume along sea breeze based on meso-scale climate simulation. J. Environ. Eng. 2004, 73, 1029–1035. (In Japanese) [Google Scholar] [CrossRef]
  50. Nazarian, N.; Kleissl, J. CFD simulation of an idealized urban environment: Thermal effects of geometrical characteristics and surface materials. Urban Clim. 2015, 12, 141–159. [Google Scholar] [CrossRef]
  51. Thordal, M.S.; Bennetsen, J.C.; Koss, H.H.H. Review for practical application of CFD for the determination of wind load on high-rise buildings. J. Wind Eng. Ind. Aerodyn. 2019, 186, 155–168. [Google Scholar] [CrossRef]
  52. Mompean, G. Numerical simulation of a turbulent flow near a right-angled corner using the Speziale non-linear model with RNG K–ε equations. Comput. Fluids 1998, 27, 847–859. [Google Scholar] [CrossRef]
  53. Shuojun, M.; Jingjing, C.; Jiangtao, H.; Jihao, Z.; Lirong, T.; Fuyun, Z. Numerical simulation of urban ventilation with different building scales. In Proceedings of the 2014 ISFMFE—6th International Symposium on Fluid Machinery and Fluid Engineering, Wuhan, China, 22–22 October 2014; pp. 1–6. [Google Scholar]
  54. Khalilzadeh, A.; Ge, H.; Ng, H.D. Effect of turbulence modeling schemes on wind-driven rain deposition on a mid-rise building: CFD modeling and validation. J. Wind Eng. Ind. Aerodyn. 2019, 184, 362–377. [Google Scholar] [CrossRef]
  55. Houda, S.; Belarbi, R.; Zemmouri, N. A CFD Comsol model for simulating complex urban flow. Energy Procedia 2017, 139, 373–378. [Google Scholar] [CrossRef]
  56. Song, J.; Meng, X. The Improvement of Ventilation Design in School Buildings Using CFD Simulation. Procedia Eng. 2015, 121, 1475–1481. [Google Scholar] [CrossRef]
  57. Pakzad, E.; Salari, N. Measuring sustainability of urban blocks: The case of Dowlatabad, Kermanshah city. Cities 2018, 75, 90–100. [Google Scholar] [CrossRef]
  58. Tominaga, Y.; Mochida, A.; Murakami, S.; Sawaki, S. Comparison of various revised k-ε models and LES applied to flow around a high-rise building model with 1:1:2 shape placed within the surface boundary layer. J. Wind Eng. Ind. Aerodyn. 2008, 96, 389–411. [Google Scholar] [CrossRef]
  59. Salman Ali, a.B.L. Evaluating the Impact of the Morphological Transformation of Urban Sites on the Urban Thermal Microenvironment. Buildings 2018, 8, 182. [Google Scholar]
  60. Zhang, L.; Zhang, M.; Yao, Y. Mapping seasonal impervious surface dynamics in Wuhan urban agglomeration, China from 2000 to 2016. Int. J. Appl. Earth Obs. Geoinform. 2018, 70, 51–61. [Google Scholar] [CrossRef]
  61. Mehdi Makvandi, B.L.; Zhu, J. Natural ventilation design strategy through CFD approach to mitigate the negative effects of microclimate changes due to the urbanization in urban block scale at Wuhan city fringe (part 3). In Proceedings of the 3rd International Conference on Urban Management Civil Engineering and Technology in Moderm Architecture, Amsterdam, The Netherlands, 16 July 2018. [Google Scholar]
  62. Toparlar, Y.; Blocken, B.; Maiheu, B.; van Heijst, G.J.F. A review on the CFD analysis of urban microclimate. Renew. Sustain. Energy Rev. 2017, 80, 1613–1640. [Google Scholar] [CrossRef]
  63. Yang, Y.; Liu, J.; Lin, Y.; Li, Q. The impact of urbanization on China’s residential energy consumption. Struct. Chang. Econ. Dyn. 2018. [Google Scholar] [CrossRef]
  64. Wei, R.; Song, D.; Wong, N.H.; Martin, M. Impact of Urban Morphology Parameters on Microclimate. Procedia Eng. 2016, 169, 142–149. [Google Scholar] [CrossRef]
  65. Niu, W.Y. China New Urbanization Report; Science Press: Beijing, China, 2013. [Google Scholar]
  66. Huang, Q.; Huang, J.; Yang, X.; Fang, C.; Liang, Y. Quantifying the seasonal contribution of coupling urban land use types on Urban Heat Island using Land Contribution Index: A case study in Wuhan, China. Sustain. Cities Soc. 2019, 44, 666–675. [Google Scholar] [CrossRef]
  67. Wang, B.; Sun, S.; Duan, M. Wind potential evaluation with urban morphology—A case study in Beijing. Energy Procedia 2018, 153, 62–67. [Google Scholar] [CrossRef]
  68. Hu, L.; Brunsell, N.A. The impact of temporal aggregation of land surface temperature data for surface urban heat island (SUHI) monitoring. Remote Sens. Environ. 2013, 134, 162–174. [Google Scholar] [CrossRef]
  69. Cosar-Jorda, P.; Buswell, R.A.; Mitchell, V.A. Determining of the role of ventilation in residential energy demand reduction using a heat-balance approach. Build. Environ. 2018, 144, 508–518. [Google Scholar] [CrossRef]
Figure 1. Urbanization in Wuhan (1980–2016); urban land increase (red color) and water surface decline (blue color).
Sustainability 11 01662 g001
Figure 2. A linear and parallel relationship between urban land (based on the results of long-term observational studies of land use change of Wuhan) and urban population [3] which increases UHII.
Sustainability 11 01662 g002
Figure 3. Urbanization process in Wuhan’s fringe and case study area in Jiang Xia sector with building density classification in diverse gross floor area (GFA). (A) High-rise building; (B) Mid-rise building; (C) Low-rise building; (D) Park.
Sustainability 11 01662 g003
Figure 4. Fixed and field/mobile observation within residential urban blocks.
Sustainability 11 01662 g004
Figure 5. Land use transformation which formed urban morphology in the case study area at Jiang Xia from 1980 to 2016 (outcomes are based on GIS/Arc-Map analysis of long-term observational studies).
Sustainability 11 01662 g005
Figure 6. Climate Change according to the air temperature and relative humidity of Jiang Xia from 1980 to 2016 (outcomes are based on meteorological data analysis during long term observational studies).
Sustainability 11 01662 g006
Figure 7. Climate change according to the air temperature and relative humidity of Jiang Xia compared to a larger area (Caidian, Huangpi, Xinzhou) from 1980 to 2016 (outcomes are based on meteorological data analysis during long term observational studies).
Sustainability 11 01662 g007
Figure 8. Air temperature distribution in cases A, B, C, D regarding fixed and mobile observations at distinct times.
Sustainability 11 01662 g008aSustainability 11 01662 g008b
Figure 9. Relative humidity in cases A, B, C, D regarding the fixed and mobile observations at distinct times.
Sustainability 11 01662 g009
Figure 10. Computational Fluid Dynamics (CFD) analysis (A—high-rise building, B—mid-rise building, C—low-rise building) and the impact of building diversity on the thermal environment.
Sustainability 11 01662 g010
Table 1. The model constants, which are verified and used in the governing equations from experimental data [52,53,55,56].
ConstantValue
0.09
Ce11.44
Ce21.92
σk1.0
σε1.3
Table 2. Case setting (average value).
CasesObservation TechniqueBuilding TypesBuilding Density (Built-up Area/Total Site Area) (%)Plot Ratio (Gross Floor Area/Total Site Area)Greenery Ratio (Green Area/Total Site Area) (%)Water Area Reduction (km2)
AMobile observationHigh-rise (10~34 story building)1916.619-
BMid-rise (7~9 story building)215.625-
CLow- rise (1~3 story building)232.113-
DFixed observationPark-1.6804.5 (7.2%)
Wuhan (LU/LC)Long-term observation (1980–2016)Building/urban morphology--136.4 reduction 145.64 (16% of the total range)
Table 3. The impact of urban block morphology on air temperature (air temperature °C).
CasesCategories/TypesTime RecordMoring
(5:30–6:30)
Noon
(1:00–2:00)
Night
(9:00–10:00)
AHigh-rise BuildingSR1828.123.8
ER18.42721.4
BMid-rise BuildingSR1829.523
ER17.227.722.2
CLow-rise BuildingSR17.827.625.5
ER18.928.422.9
DParkSR13.226.724.4
ER11.826.422.7
Sustainability 11 01662 i001

