Article

Spatial Distribution and Changes of the Realizable Triple Cropping System in China

1
College of Land Science and Technology, China Agricultural University, Beijing 100193, China
2
Key Laboratory of Agricultural Land Quality, Ministry of Natural Resources, Beijing 100193, China
3
Sustainable Land Use in Developing Countries, Leibniz Centre for Agricultural Landscape Research (ZALF e.V), Eberswalder Straße 84, 15374 Müncheberg, Germany
4
Department of Agricultural Economics, Humboldt University of Berlin, Rudower Chausee 16, 10099 Berlin, Germany
*
Author to whom correspondence should be addressed.
Sustainability 2019, 11(6), 1654; https://doi.org/10.3390/su11061654
Submission received: 20 February 2019 / Revised: 11 March 2019 / Accepted: 15 March 2019 / Published: 19 March 2019
(This article belongs to the Section Sustainable Agriculture)

Abstract

:
Exploiting the full potential of the realizable triple cropping system (RTCS) is one of the most effective methods for increasing land productivity, thus promoting food security. However, insufficient attention is paid to the spatial distribution of the RTCS in China. Here, a method is developed to assess the RTCS in China, considering terrain, climatic conditions, crop climatic-ecological suitability, and the spatial changes in the RTCS between 1951 and 2010. Results indicate that a decrease of 19 Mha was caused by topographic correction, while climate change increased the same area by 14 Mha. Based on crop climatic-ecological conditions, the suitability of the RTCS was indicated for 1068 counties. The boundary of the RTCS moved northward by 100–200 km in the Middle-Lower reaches of the Yangtze River, but southward by approximately 250 km in Yunnan Province. The area of the RTCS is 135 Mha distributed across 775 counties in Southern China. These findings are useful for guiding the policy of cultivated land use in Southern China. The approach can be adopted elsewhere to determine the RTCS for sustainable land use and increasing land productivity.

1. Introduction

While rising population is expected to drive a 70% increase in global demand for agricultural production by 2050, the amount of available cultivated land is not increasing to meet this growing demand [1,2]. Multiple cropping is receiving increasing attention as a way to meet the growing demand for agricultural products [3], especially where there is limited space to expand area of the cultivated land [4]. Multiple cropping is the intensification of cropping along temporal and spatial dimensions by growing two or more crops on the same field in one year [5,6]. The practices and the potential of increasing multiple cropping have been investigated for a number of regions, including China [7,8,9], India [10,11], the Philippines [12], Thailand [13], the U.S. [14], Brazil [15], the European continent [16,17], and globally [18,19].
The possibility of multiple cropping is largely determined by local climatic characteristics, especially temperature and precipitation conditions [20]. Globally, about 30% of the total cropland area is able to adopt multiple cropping [21]. China, with approximately 21% of the world’s population [22], is home to intensively cultivated land under multiple cropping [23,24]. In China, multiple cropping is practiced on nearly half of the cultivated land, thus helping to feed the country’s large population despite having only 7% of the world’s arable land [22]. Further, a large part of the cropland located in Southern China can grow three crops a year. Triple cropping system (TCS) is an intensive farming system in which three crop species are grown on the same piece of land in sequential seasons, thus seeking to maximize the use of natural resources [25]. TCS not only provides provisioning services (crop production), but also provides other key ecosystem services, including pest and disease regulation, erosion control, climate regulation, and maintenance of soil fertility [26]. Multiple cropping is regarded as one of the simplest ways to increase grain production on the same land with the least damage to the ecology [27,28,29]. It plays an important role in maintaining food security for China under the pressures of growing demand for agricultural products and little room for cropland expansion [30]. Therefore, clarifying the quantity, spatial distribution, regional differences, temporal changes, and spatial changes of TCS is attracting increasing attention from many researchers.
Climate change is affecting the agro-ecosystem through changing temperatures, water supply, and other environmental factors. Studies show that due to climate change, not only did the northern limits of the multiple cropping system in China move northward [31,32], the limits also expanded to include cropland at middle and high elevations [33,34]. For example, the northern limits of TCS showed the maximum spatial displacement in the Anhui, Jiangsu, Hubei, Hunan, and Zhejiang provinces of China [35]. Compared with the period of 1961–80, the northern limits of cropping rotations, including winter wheat-early rice-late rice, early rice-late rice and winter wheat-middle rice, moved approximately 6.4 km in the Middle-Lower Yangtze Plains between 1981 and 2007 [36]. The new stable area for planting rice increased by 11.5 Mha between 1981 and 2010 [37]. Therefore, the boundaries for TCS are shifting northward due to climate change. Moreover, between 1981 and 2010, the geographic ranges of several multiple cropping systems in China shifted markedly northward, resulting in a 2.2% (approx. 8 Mt) increase in national production of three major crops (maize, wheat, and rice) [38]. Therefore, there is a need to determine to what extent the TCS can be expanded to produce more food. It is important to determine the distribution of the TCS to adjust cropland use in China, thereby promoting national food security and sustainable agricultural development.
Previous studies have explored potential and actual TCS areas at various geographic scales using different kinds of data [39,40] to assess the current situation of the TCS in China. Such data include climate conditions [41] as well as the temporal and spatial variations of actual TCS based on statistical data [42], agro-meteorological observations, and remote sensing information [40,43]. The methods of estimating potential TCS include agro-meteorology [9], the Agricultural Ecology Zone (AEZ) model [39,44], and economic models [45]. The agro-meteorological method, whereby potential TCS is evaluated based on key climate elements such as annual accumulated temperature, growing degree days and precipitation [21,35,46,47], has been the most used. Generally, studies take terrain as a simple background element by using spatial interpolation of ArcGIS or ANUSPLIN software. However, it is known that terrain can significantly affect the spatial distribution of climatic resources, so it is a very important physical factor for evaluating cropping systems [41,48,49,50,51,52]. Despite this, there is limited information available on the quantitative description of the impacts of topography on climate elements and the spatial distribution of the TCS. Therefore, to bridge this gap, the objectives of this study are to: (1) establish a model that explores the area of the RTCS based on terrain, climate resources, and climatic-ecological suitability; (2) estimate spatial changes of the RTCS in China between 1951 and 2010; and (3) verify the distribution of the RTCS in China.

2. Materials and Methods
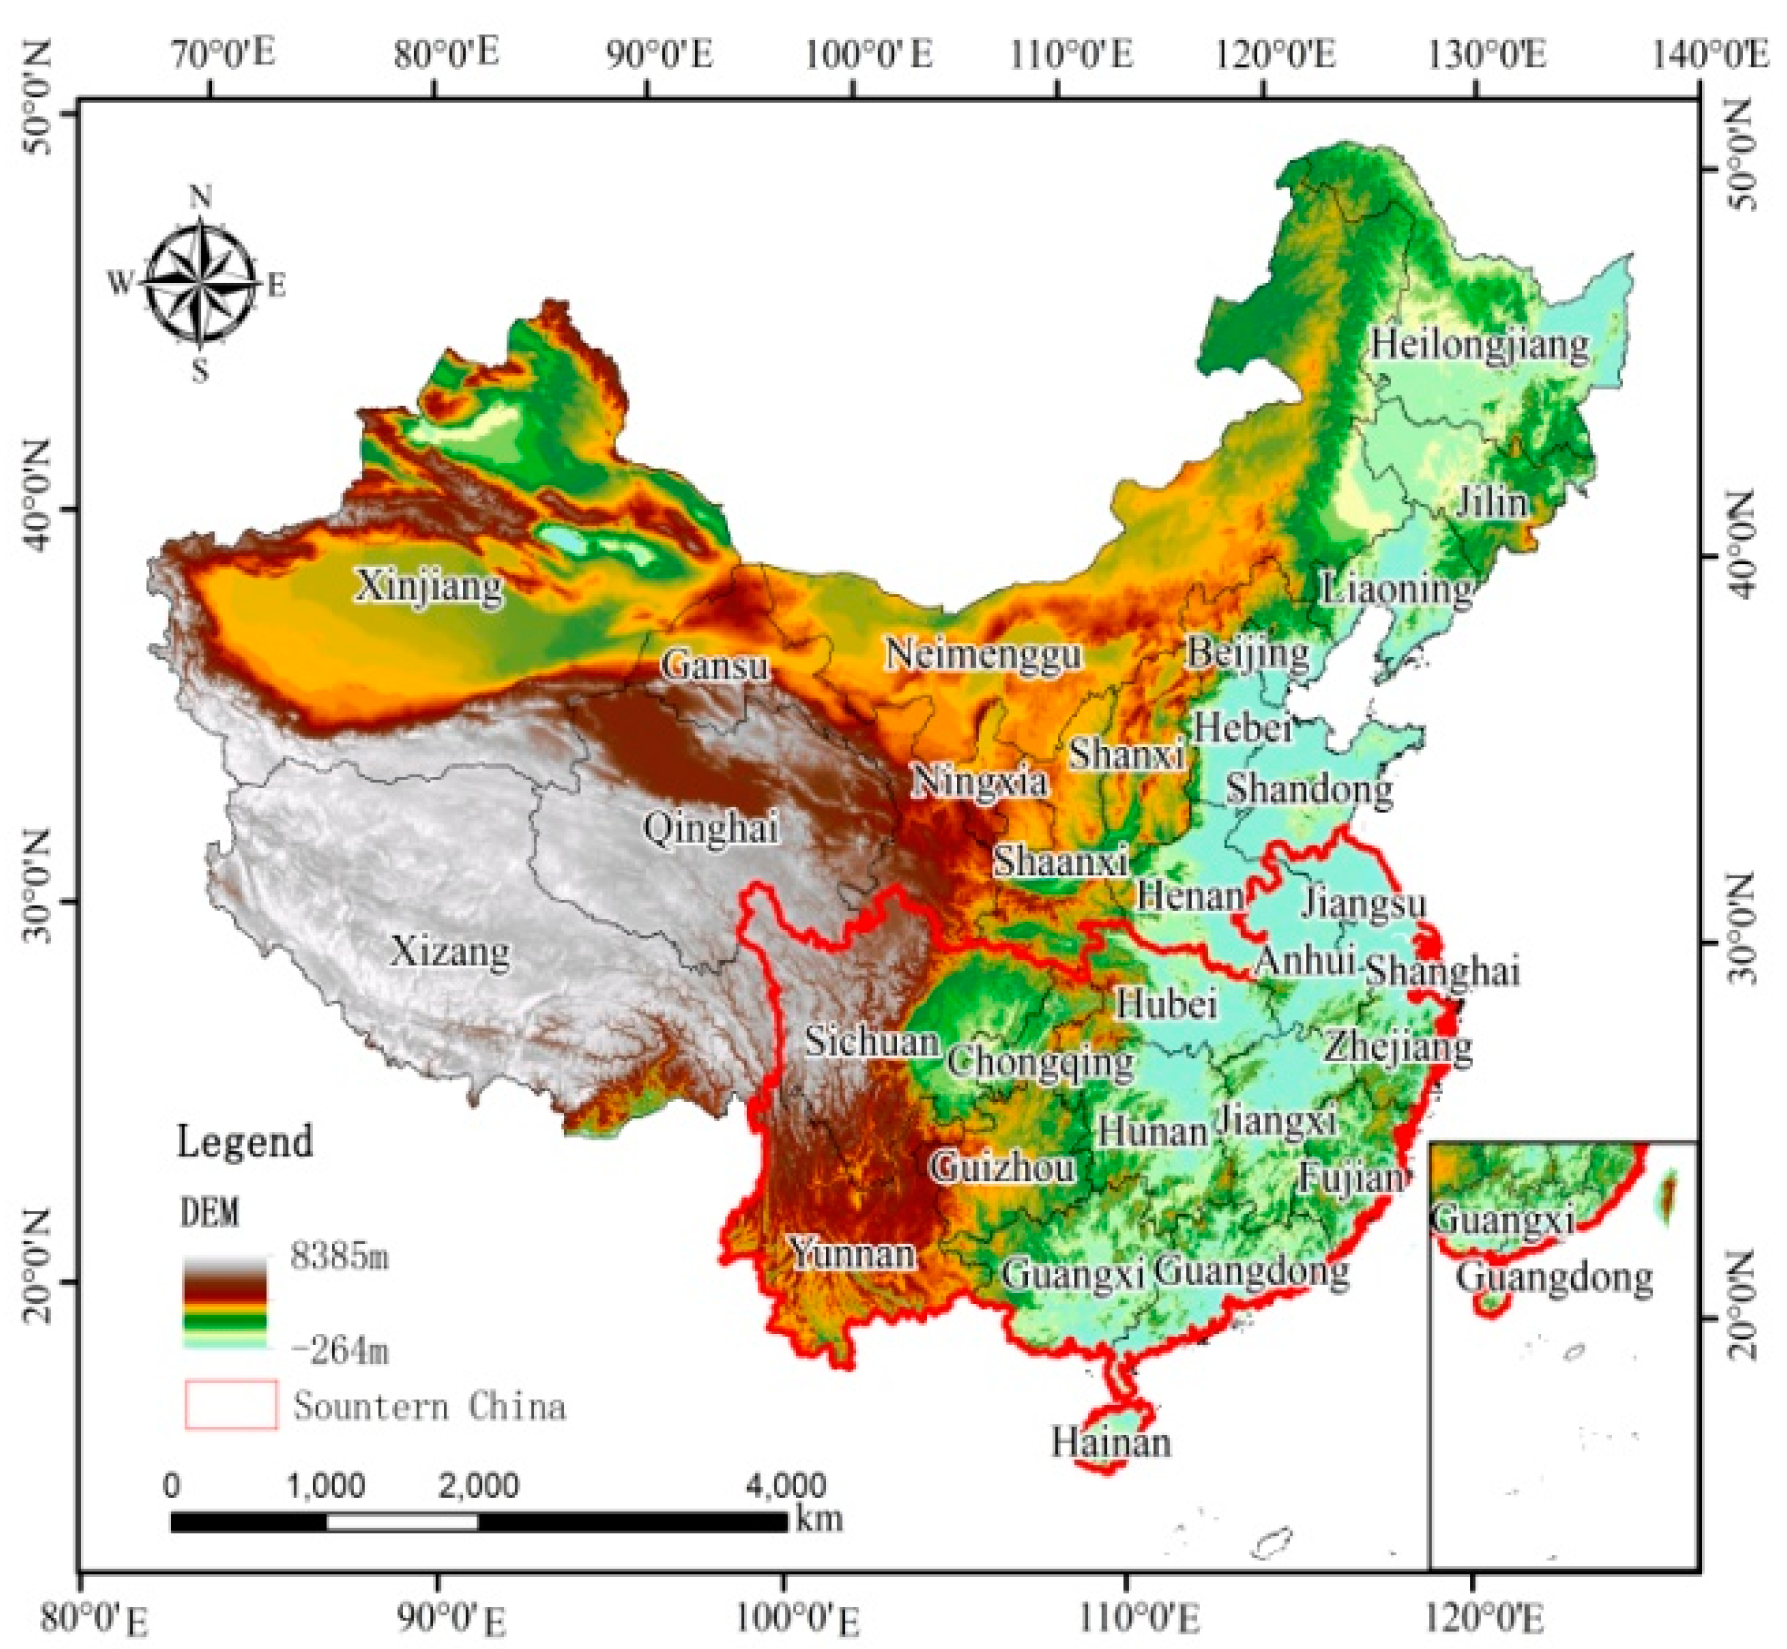
2.1. Study Area

This study was conducted in Southern China (Figure 1), including Anhui, Chongqing, Hubei, Hunan, Hainan, Jiangsu, Jiangxi, Fujian, Guangdong, Guangxi, Guizhou, Yunnan, Shanghai, Sichuan, and Zhejiang provinces and cities. Hong Kong, Macao, and Taiwan were not included because of limited data availability. The area is characterized by a long warm season and abundant precipitation that allows for triple cropping rotations. However, double cropping rotations are the dominant cropping systems instead of triple cropping rotations [53]. Normally, two-season rice and one seasonal crop in the winter (e.g., wheat, rapeseed, and sweet potato) are grown. The landscape is very flat, and land cover is relatively homogenous in the northern part of the study area, where double rotation (e.g., winter wheat-rice, rapeseed-rice) is popularly practiced. In the western and southern parts of the study area, the fraction of the landscape allocated to croplands is generally much less than in the northern part. Land cover types in those areas are more heterogeneous and are influenced by increased complexity of the topography [13]. Early rice-late rice is the most frequent cropping rotation in the fields of those areas.

2.2. Data Sources

The data categories used in the study include meteorological, crops phenology, terrain elevation, and land use. Historical weather data were obtained from the China Meteorological Data Sharing Service (http://data.cma.cn). The weather data used were daily mean temperature, daily maximum temperature, daily minimum temperature, and daily precipitation. A total of 721 meteorological stations providing data from 1951 to 1980 were used, along with 1970 sites providing data from 1981 to 2010. As cropping rotations often change, this study principally focused on four representative planting rotations for estimating the climatic-ecological suitability of the RTCS in Southern China. These rotations are winter wheat-early rice-late rice (WRR), rapeseed-early rice-late rice (RRR), sweet potato-early rice-late rice (SRR), and winter wheat/spring maize/sweet potato (WMS). The phenology data on the growing period for the aforementioned crops (including 779 sites) were also obtained from the China Meteorological Data Sharing Service, covering 1992 through 2008. Remote sensing data of land use in 2015 and digital elevation model (DEM) datasets in China were provided by the Data Center for Resources and Environmental Sciences, Chinese Academy of Sciences (RESDC) (http://www.resdc.cn). Based on the DEM data, longitude, latitude, and altitude were generated using ArcGIS 10.1 software. The raster data of cultivated land as the base map was extracted from land use to calculate the cropland area of the RTCS.

2.3. Methods

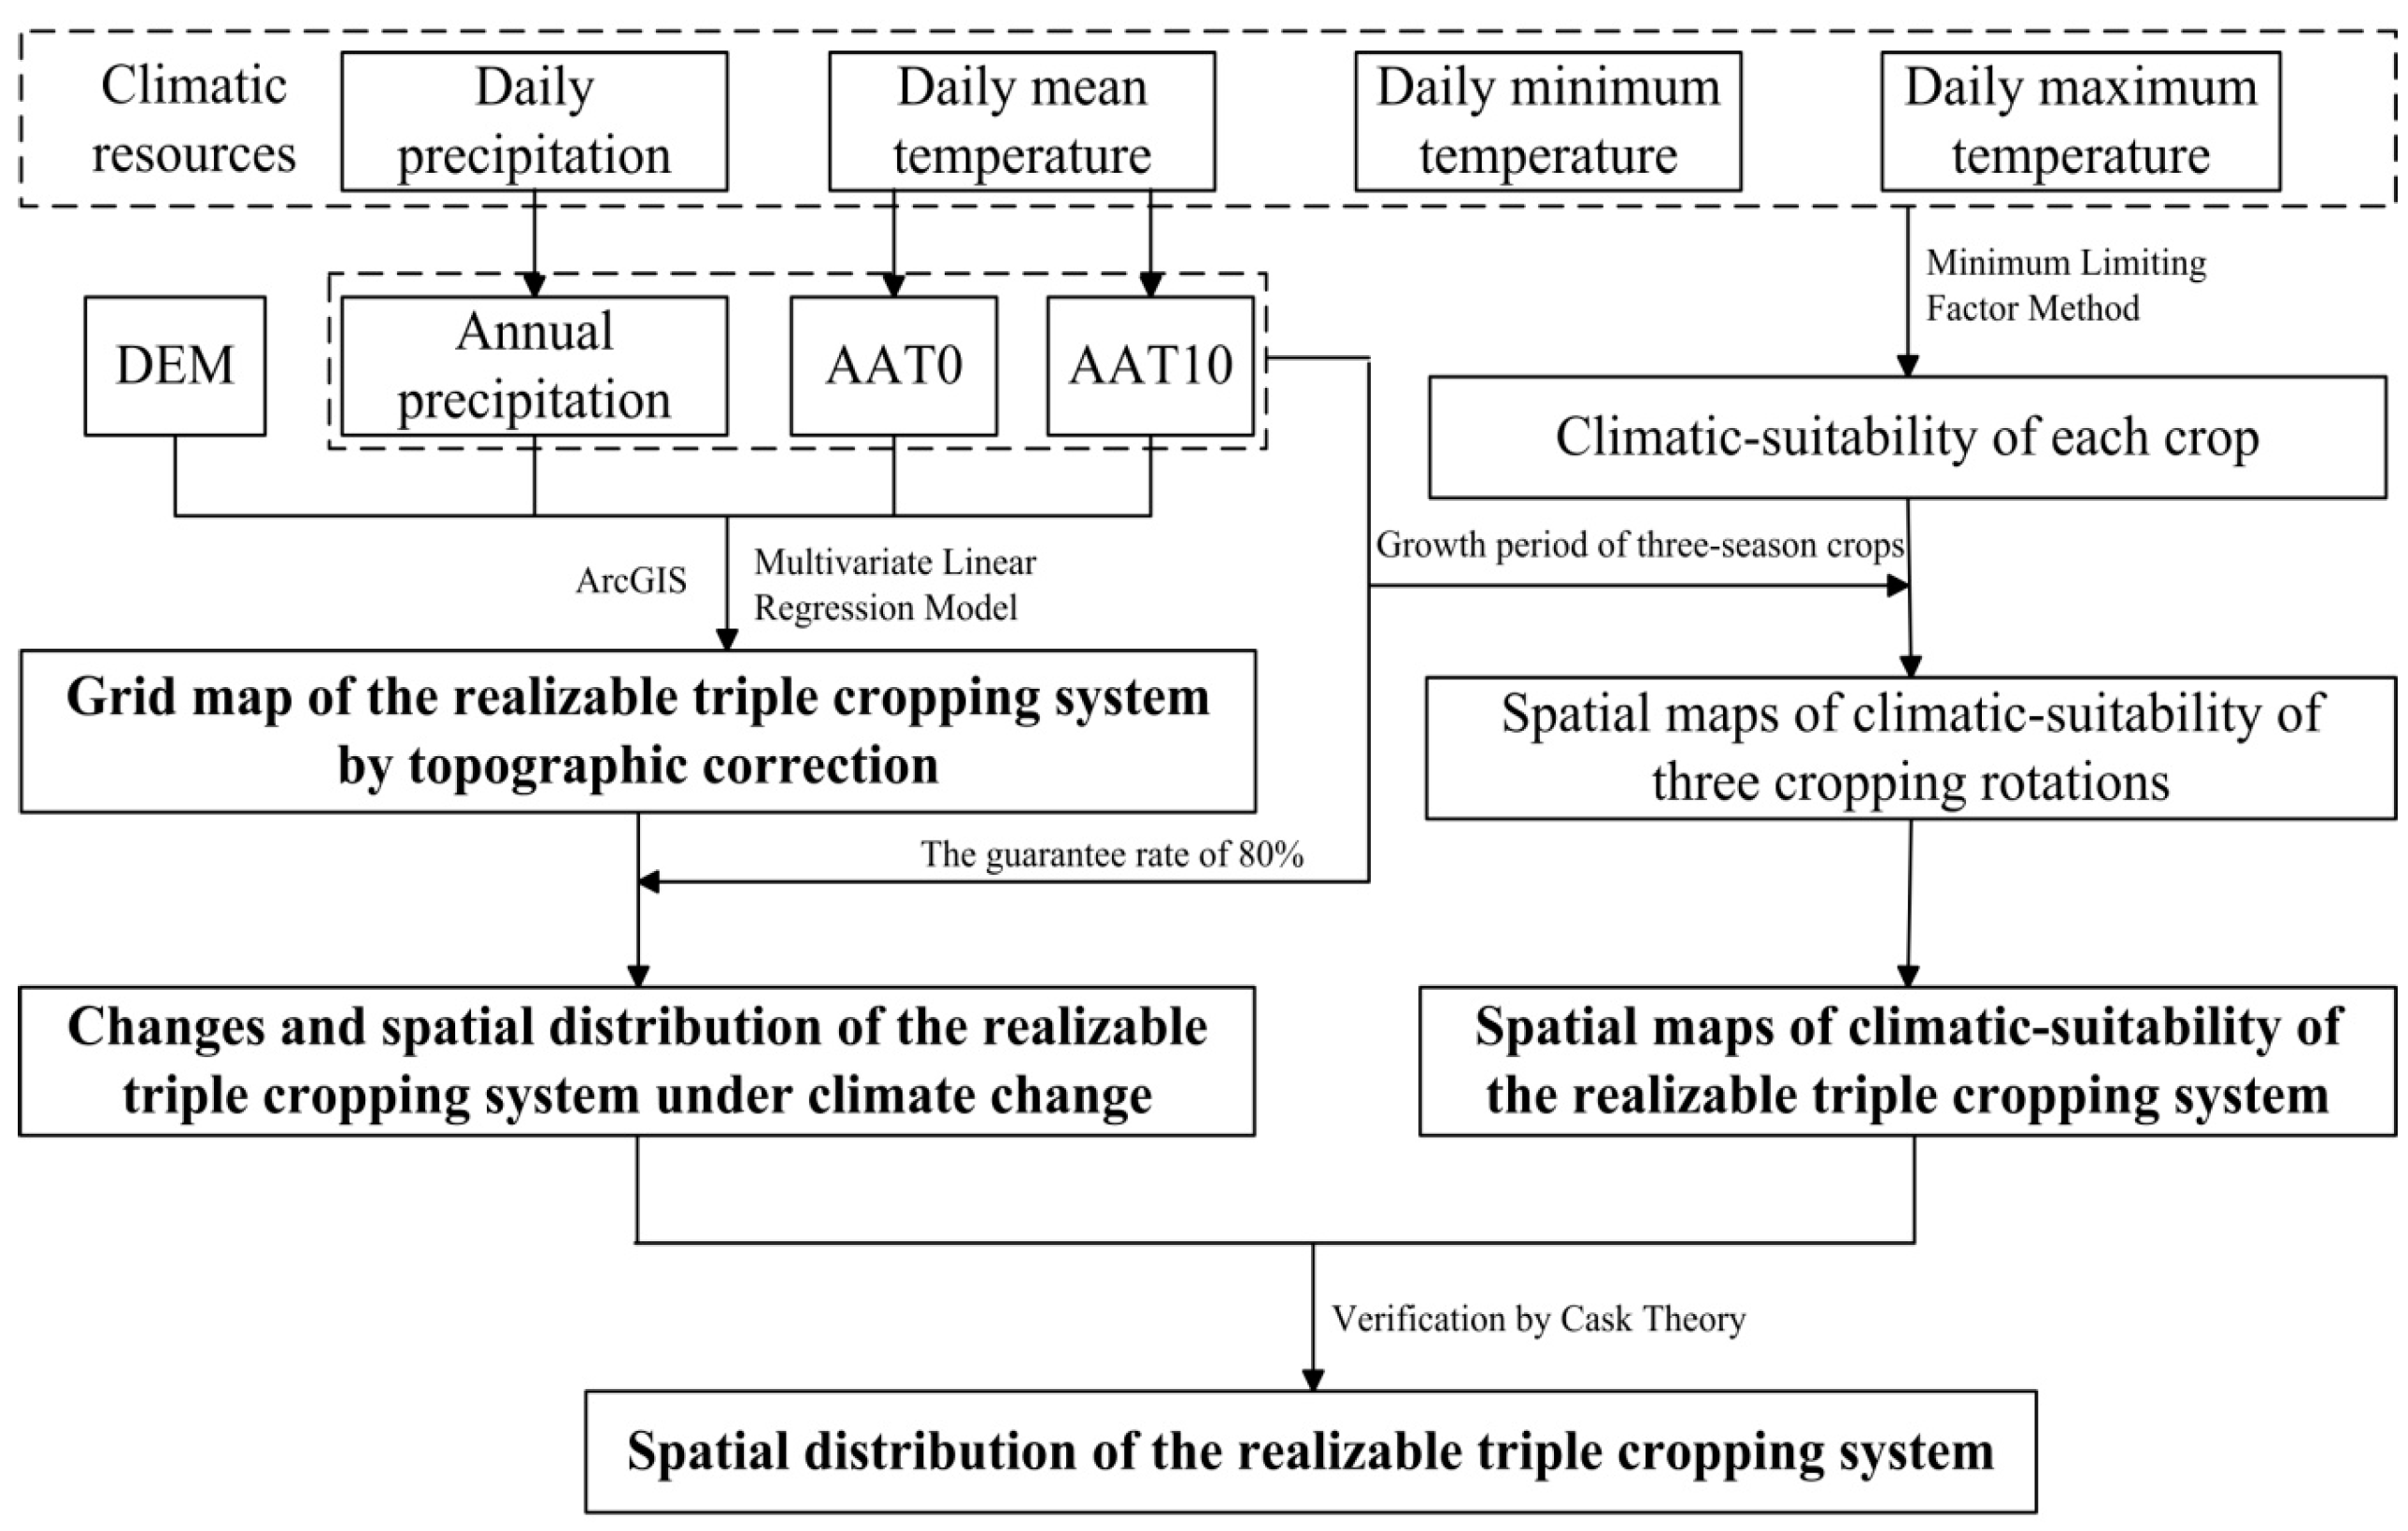
2.3.1. Definition and Conceptual Framework for Assessing the Spatial Distribution of the RTCS

The RTCS in this study is defined as the management of a cropping pattern to maximize benefits from local natural resources under current social-economic conditions. In fact, the full exploitation of this potential of the RTCS is subject to a number of constraints from biophysical and social-economic factors. Biophysical factors are hard to change as inherent characteristics of farmland ecosystems. However, social-economic factors are easily improved by human beings. Therefore, the assumption is that the full exploitation of the RTCS is mainly constrained by natural resources, especially climatic conditions and terrain, without the limitations of social-economic factors.
According to the above definition, the distribution of the RTCS was evaluated with respect to the following four goals: (1) to qualitatively evaluate the impact of topography on the distribution of the RTCS; (2) to identify the changes in the RTCS based on the annual accumulated temperature above 0 °C (AAT0), the annual accumulated temperature above 10 °C (AAT10), and precipitation under climate change; (3) to explore the climatic-ecological suitable area of the RTCS based on four principal triple cereal cropping rotations; and (4) to verify the distribution of the RTCS by statistical data, and farmland observation data based on Cask Theory (Figure 2).

2.3.2. Calculation of Annual Accumulated Temperature and Precipitation

The AAT0, AAT10, and annual mean precipitation are used to define the TCS zone in China [41,54]. The basic criteria of the area in the study is considered to be the RTCS, with AAT0, AAT10, and annual mean precipitation higher than 5900 °C, 4800 °C, and 1000 mm, respectively.
AAT0 and AAT10 were calculated as the sum of the average daily temperatures (TDi on day i) above the baseline temperature of 0 °C or 10 °C during the period with TDi steadily above 0 °C or 10 °C [55]. The AAT0 and AAT10 were calculated as [41,56]:
A A T 0 = i = s e T D i , T D i 0
A A T 10 = i = s e T D i , T D i 10
where TDs and TDe are the average daily temperatures on the starting day (Ds) and the ending day (De), respectively, of the continuous period during which the average daily temperatures are greater than 0 °C or 10 °C.
The annual precipitation was calculated as [57]:
P = i = 1 n R i
where P is the annual precipitation, Ri is the daily precipitation at each station, i is the number of days from 1 to 365, and n = 365.
To understand the effects of inter-annual variations of climate resources on the RTCS from 1951 to 2010, the guarantee rate of 80% for climate resources was calculated to estimate the climatic stability in the area of the RTCS. The stable area of the RTCS is obtained by simultaneously meeting the 80% guarantee rates of AAT0, AAT10, and annual precipitation; otherwise the area is categorized as an unstable area for the RTCS. The guarantee rates of 80% for AAT0, AAT10, and precipitation were obtained using the empirical frequency method [58].

2.3.3. Estimating the Impact of Topography on Key Climate Elements

Two datasets were used to identify the influence of terrain on key climatic elements. For the ordinary climate dataset, this study used the Ordinary Kriging method to interpolate AAT0, AAT10, and precipitation without taking longitude, latitude, and altitude into account. For the terrain-based climate dataset, it established a Multivariate Linear Regression (MLR) model with AAT0, AAT10, and precipitation, taking into consideration longitude, latitude, and altitude. Comparing the two datasets, the geospatial changes in the RTCS may be caused by topographic correction.
MLR analysis was done using the Ordinary Least Squares (OLS) procedure with backward elimination of variables [59]. The resulting model was approved after satisfying the following conditions: First, the linearity between the climatic factor and the remaining predictor variables had to be verified. Then, the independence, normality and homoscedasticity of the residuals also had to be confirmed as well as the non-collinearity between the predictor variables. The independence of the residuals was verified through the Durbin–Watson test that analyzed the randomness of the residues. From the results of MLR by SPSS software (Table 1), it showed that the multiple regression analysis between climatic factors and topographical variables meets all the criteria of verification.
Considering that AAT0, AAT10, and annual precipitation are correlated with longitude, latitude and altitude, the MLR model in this study was calculated as follows [60,61]:
Y y c = b 0 + b 1 J + b 2 W + b 3 H
where Yyc is the prediction results from AAT0, AAT10, and precipitation; J, W, and H are the longitude, latitude, and altitude of each meteorological station, respectively; b0 is a constant; and b1, b2, and b3 are the partial correlation coefficients.
The observed result (actual result) is the sum of the prediction result and its residual result [60,61]:
Y = Y y c + y
where Y, Yyc, and y are the observed result, the prediction result, and the residual result of AAT0, AAT10, and precipitation, respectively.
The prediction results from the regression equation and the correlation coefficients of AAT0, AAT10, and precipitation were first obtained for the periods of 1950–80 and 1981–2010. Then, the spatial interpolations of AAT0, AAT10 and precipitation for the periods of 1951–80 and 1981–2010 were obtained based on the regression equations and the ArcGIS Spatial Analyst extension.

2.3.4. Crop Climatic-Ecological Suitability Assessment Model

This study adopted the Minimum Limiting Factor Method (namely, Liebig’s Law of the Minimum) to assess crop climatic-ecological suitability; i.e., if one factor is unsuitable, then the overall assessment result is unsuitable. After that, four cropping rotations in the RTCS were obtained according to the assessment results of climatic-ecological suitability of each crop. For example, the climatic-ecological suitability of WRR is given when winter wheat, early rice, and late rice are suitable to successfully plant in succession in given regions. Therefore, the assessment result of climatic-ecological suitability is determined by the factor with the lowest suitability level [62]. This can be calculated by the following equation:
X = min (x1, x2, …, xn)
where X is the evaluation result of the crop climatic-ecological suitability; x1, x2, and xn are the suitability levels of the different evaluation factors, and n is the number of evaluation factors.
As shown in Table 2, seven indicators were considered when assessing crop climatic-ecological suitability, including thermal conditions (AAT0, AAT10, average temperature, and thermal thresholds of seed germination) and water conditions (annual precipitation) [63,64]. Among these, AAT0, AAT10, and annual precipitation were calculated by Equations (1)–(3). Average temperature during the growth duration is equal to the average value of daily temperature from sowing to harvesting. The threshold of PT means that daily temperatures need to be in the range of PT during the seed germination, while the thresholds of MinT and MaxT mean that the daily minimum temperature and the daily maximum temperature need to be in the range of MinT and MaxT during the seed germination of each crop.

2.3.5. Verification Method of the RTCS Based on Cask Theory

As mentioned above, while the information concerning the actual TCS is used to verify the rationality of the RTCS from statistical data, field surveys, and remote sensing technology, this is difficult to implement due to the large variation in the spatio-temporal ranges of actual TCS, especially on a large scale. According to Cask Theory, if one triple cropping rotation is practiced in a region where the RTCS has the poorest climate conditions, then it will be adopted in other regions with better weather conditions. In this study, the lowest AAT0, the lowest AAT10, and the lowest annual precipitation in the new region of the RTCS are identified as verification points.

3. Results

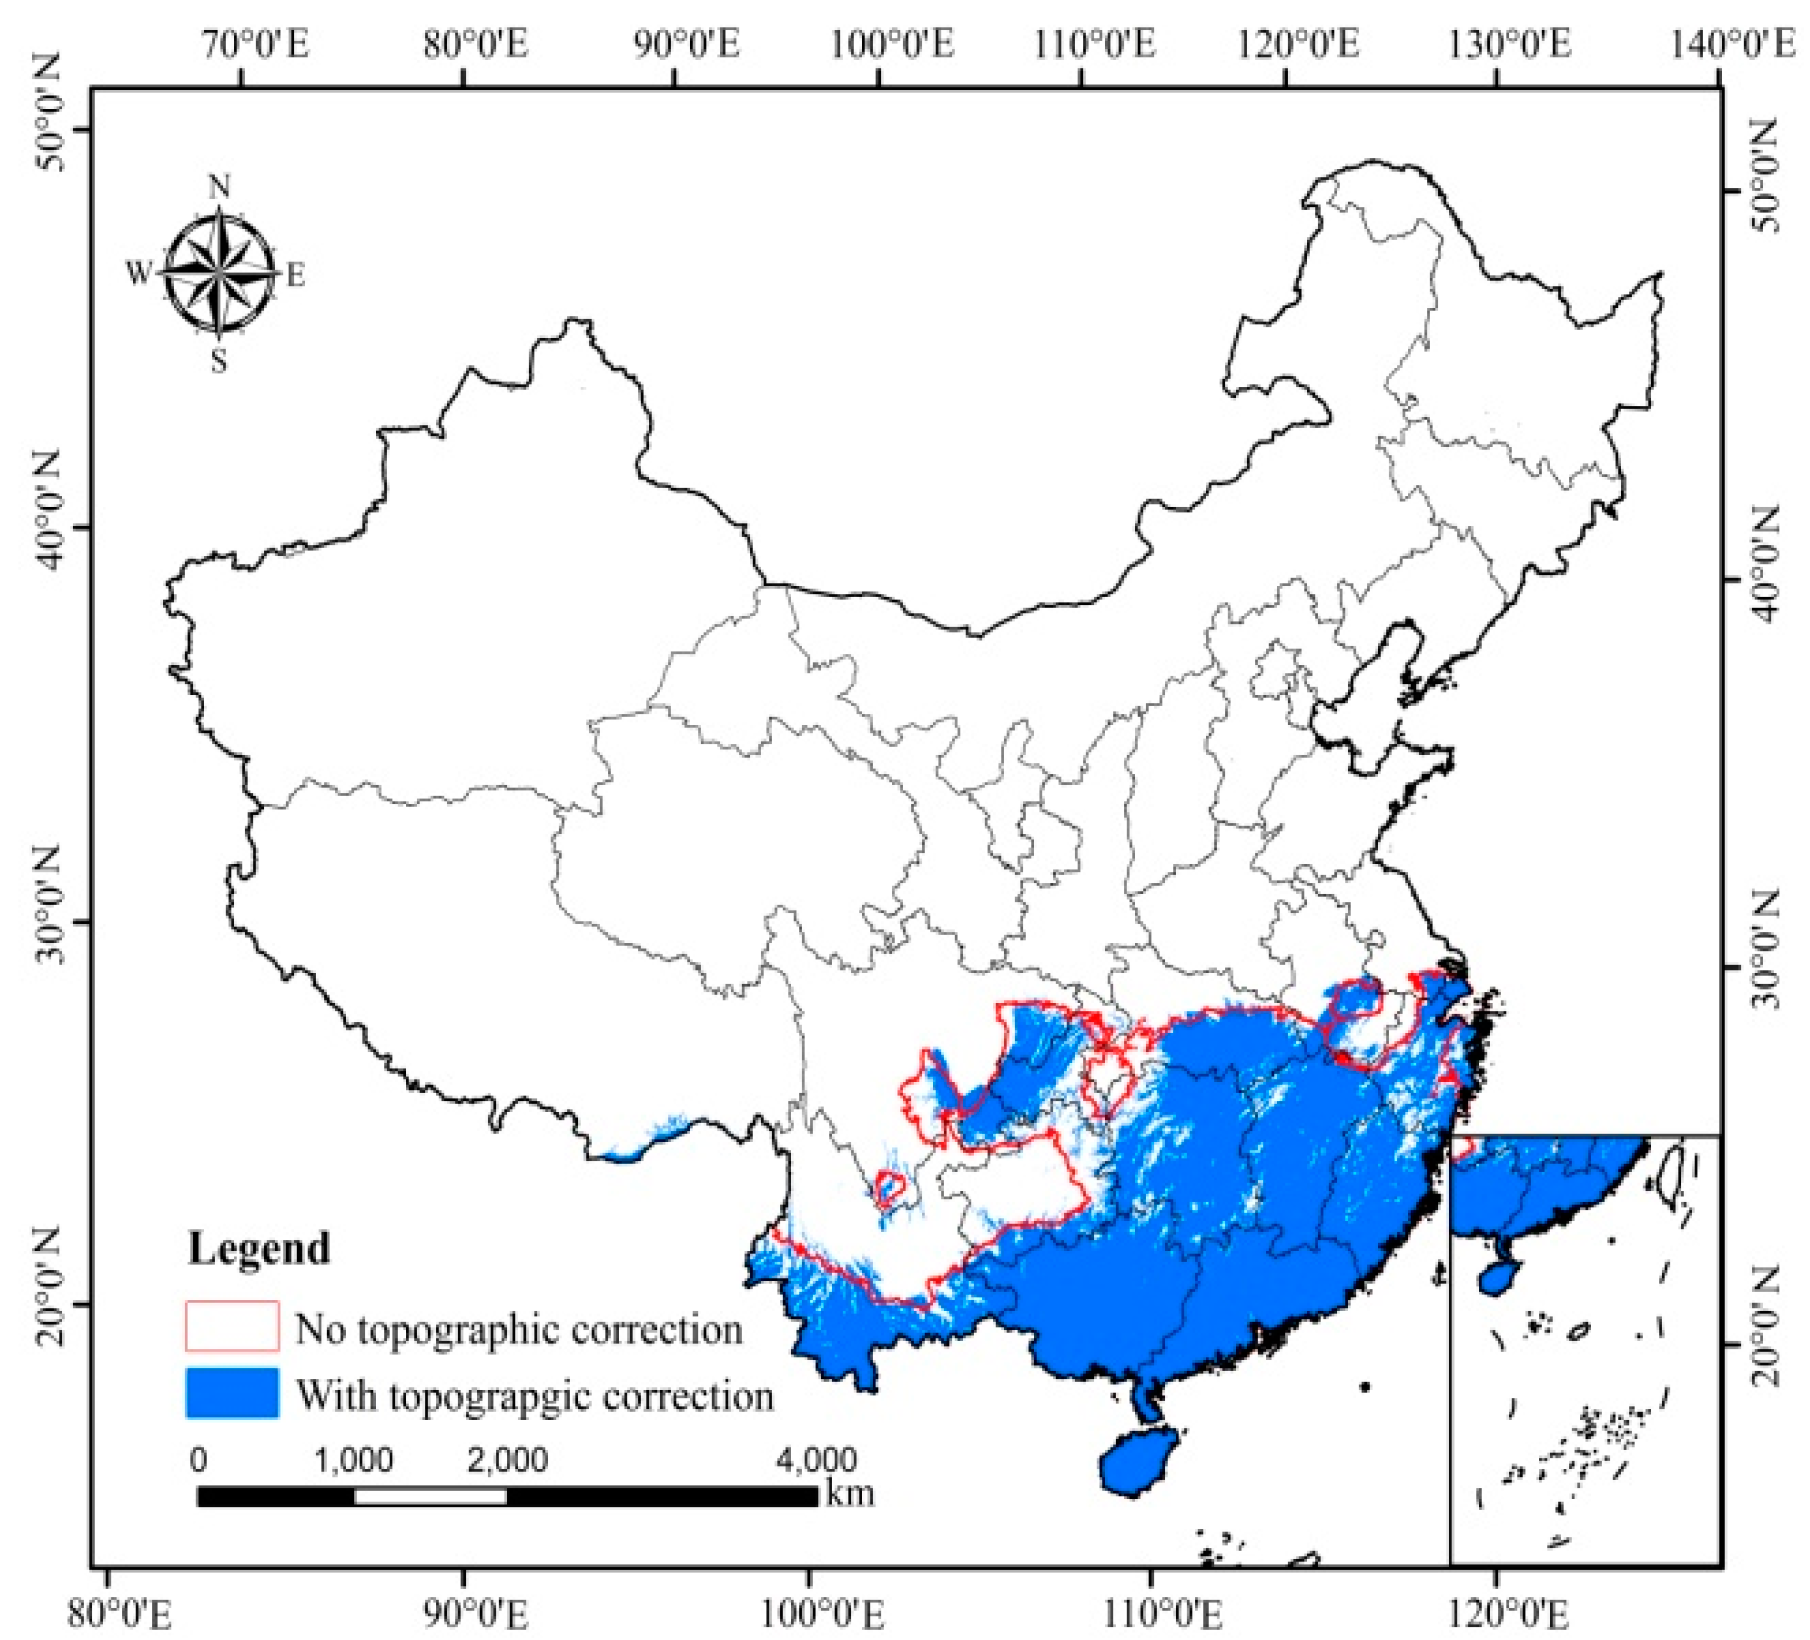
3.1. The Influence of Topography on the RTCS

From the results of the MLR model for the period between 1951 and 2010 (Table 3), AAT0, AAT10, and precipitation were significantly correlated with longitude, latitude, and altitude. Specifically, AAT0 and AAT10 were negatively correlated with longitude, latitude, and altitude, while annual precipitation was positively correlated with longitude but negatively correlated with latitude and altitude.
The RTCS had undergone significant changes caused by topographic correction over the 1981–2010 period (Figure 3). Without considering topographic effects on climatic data, the area of RTCS was 154 Mha, in which the cropland was 43.5 Mha, accounting for 28%. When taking into account topographic effects on climatic data, the area of the RTCS decreased to 135 Mha, with cropland accounting for 40.9 Mha. Comparing these two results, topographic correction reduced the area of RTCS by 19 Mha, mainly from mountainous areas such as Sichuan, Chongqing, Hunan, and Hubei.

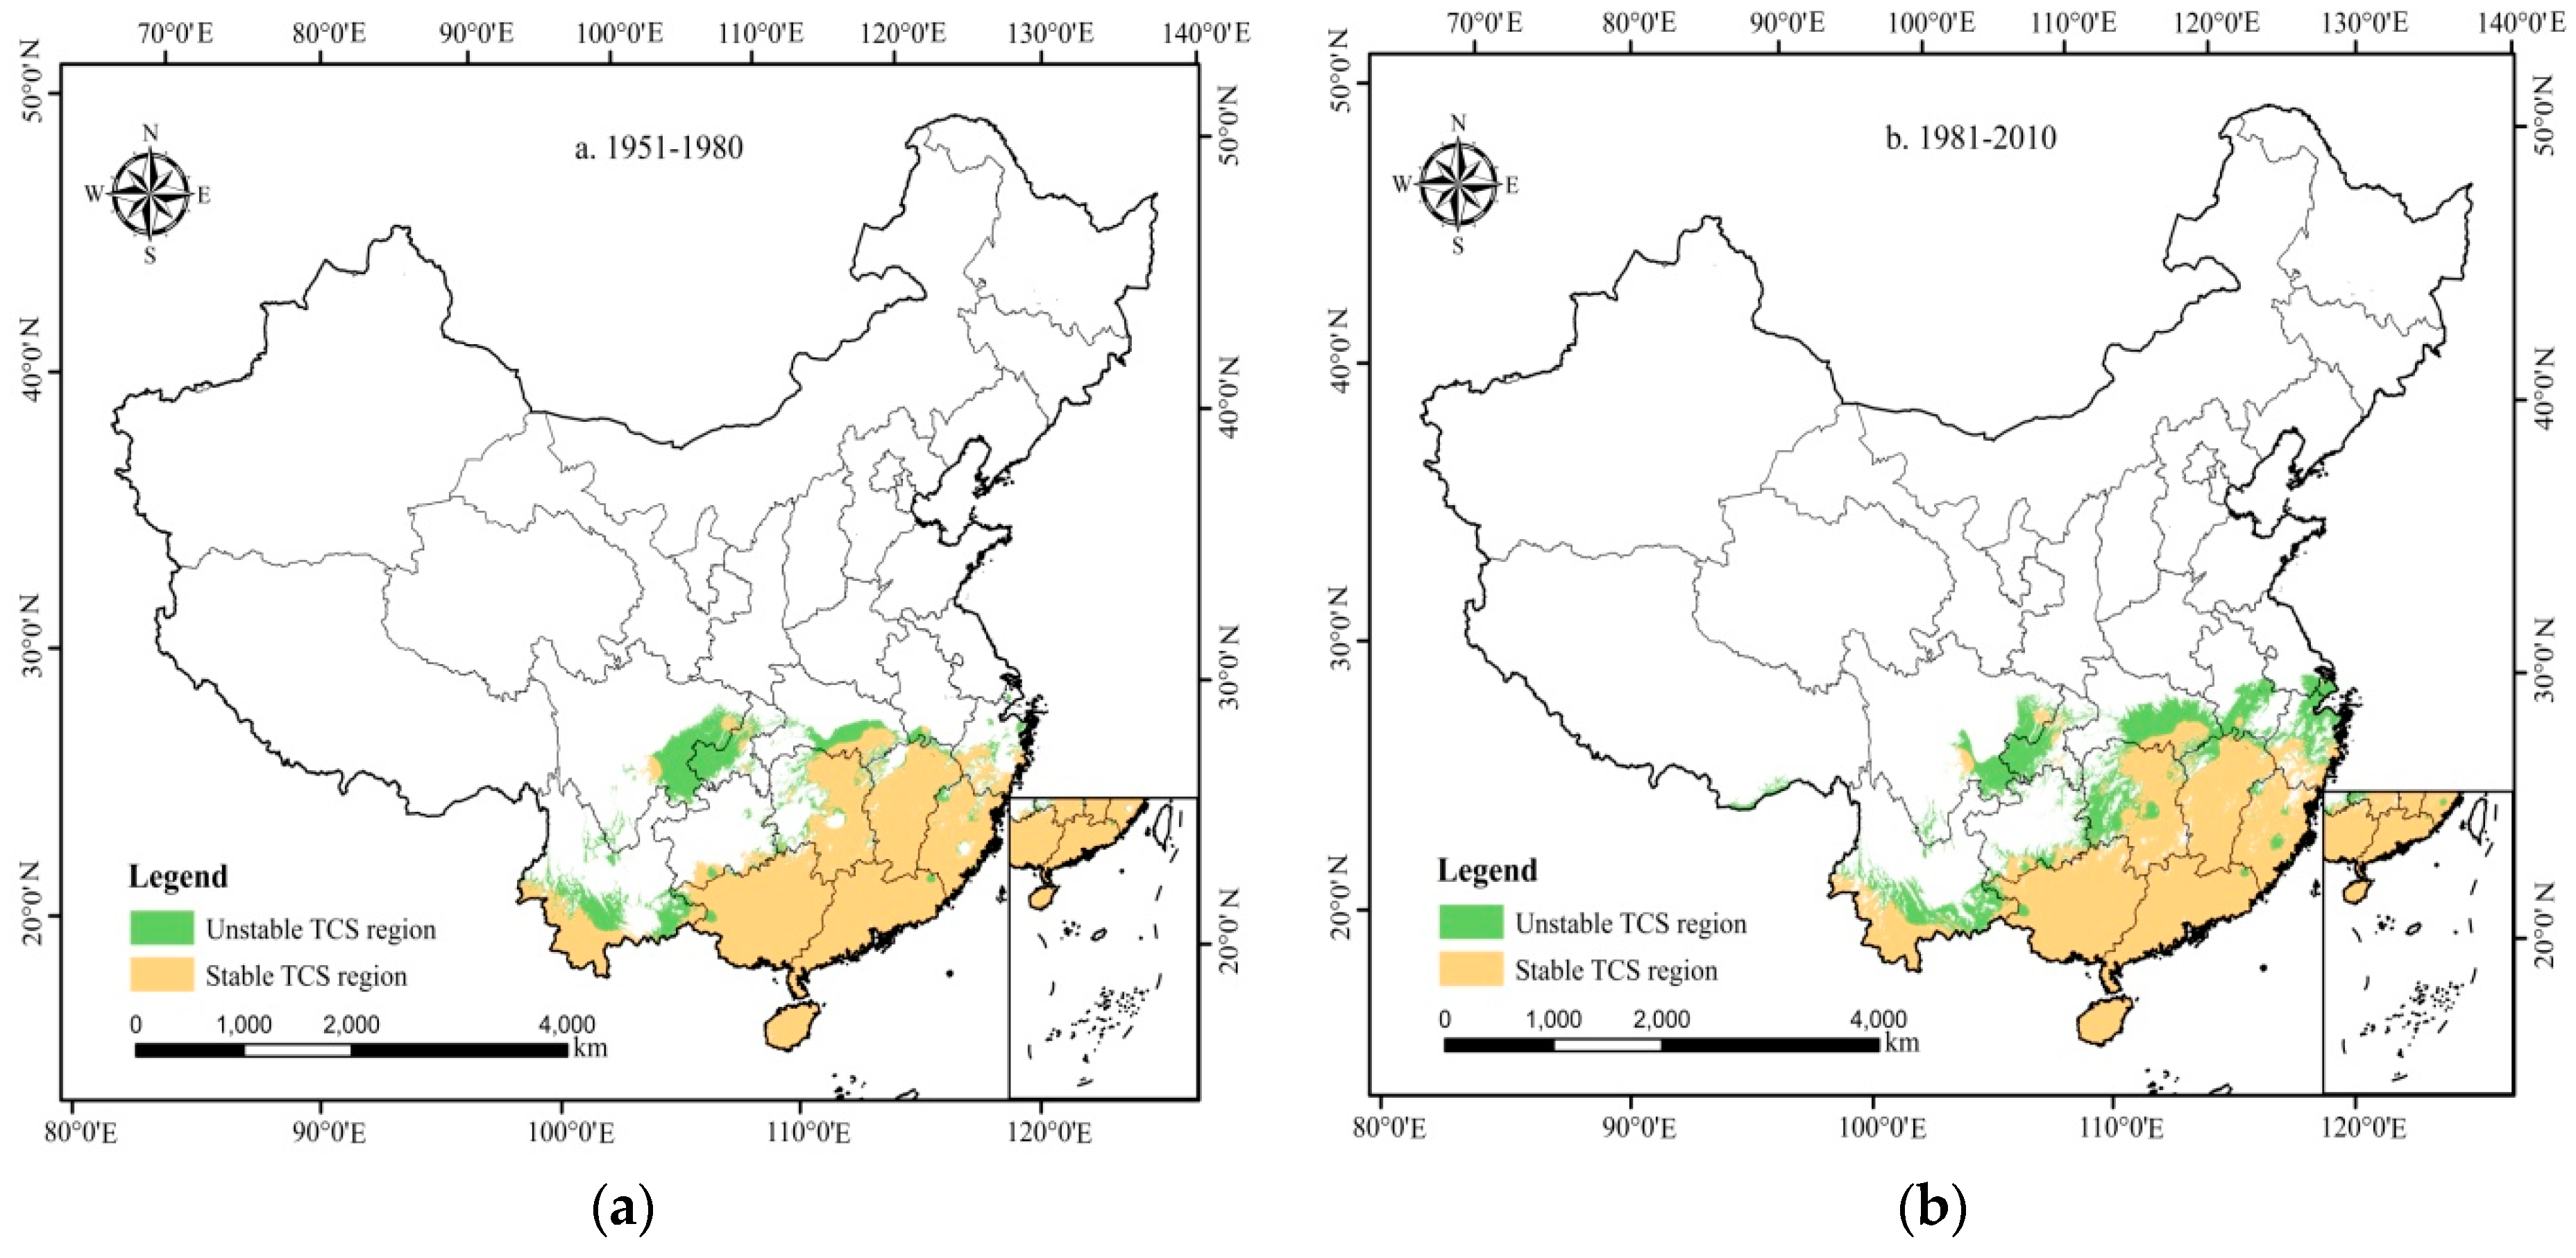
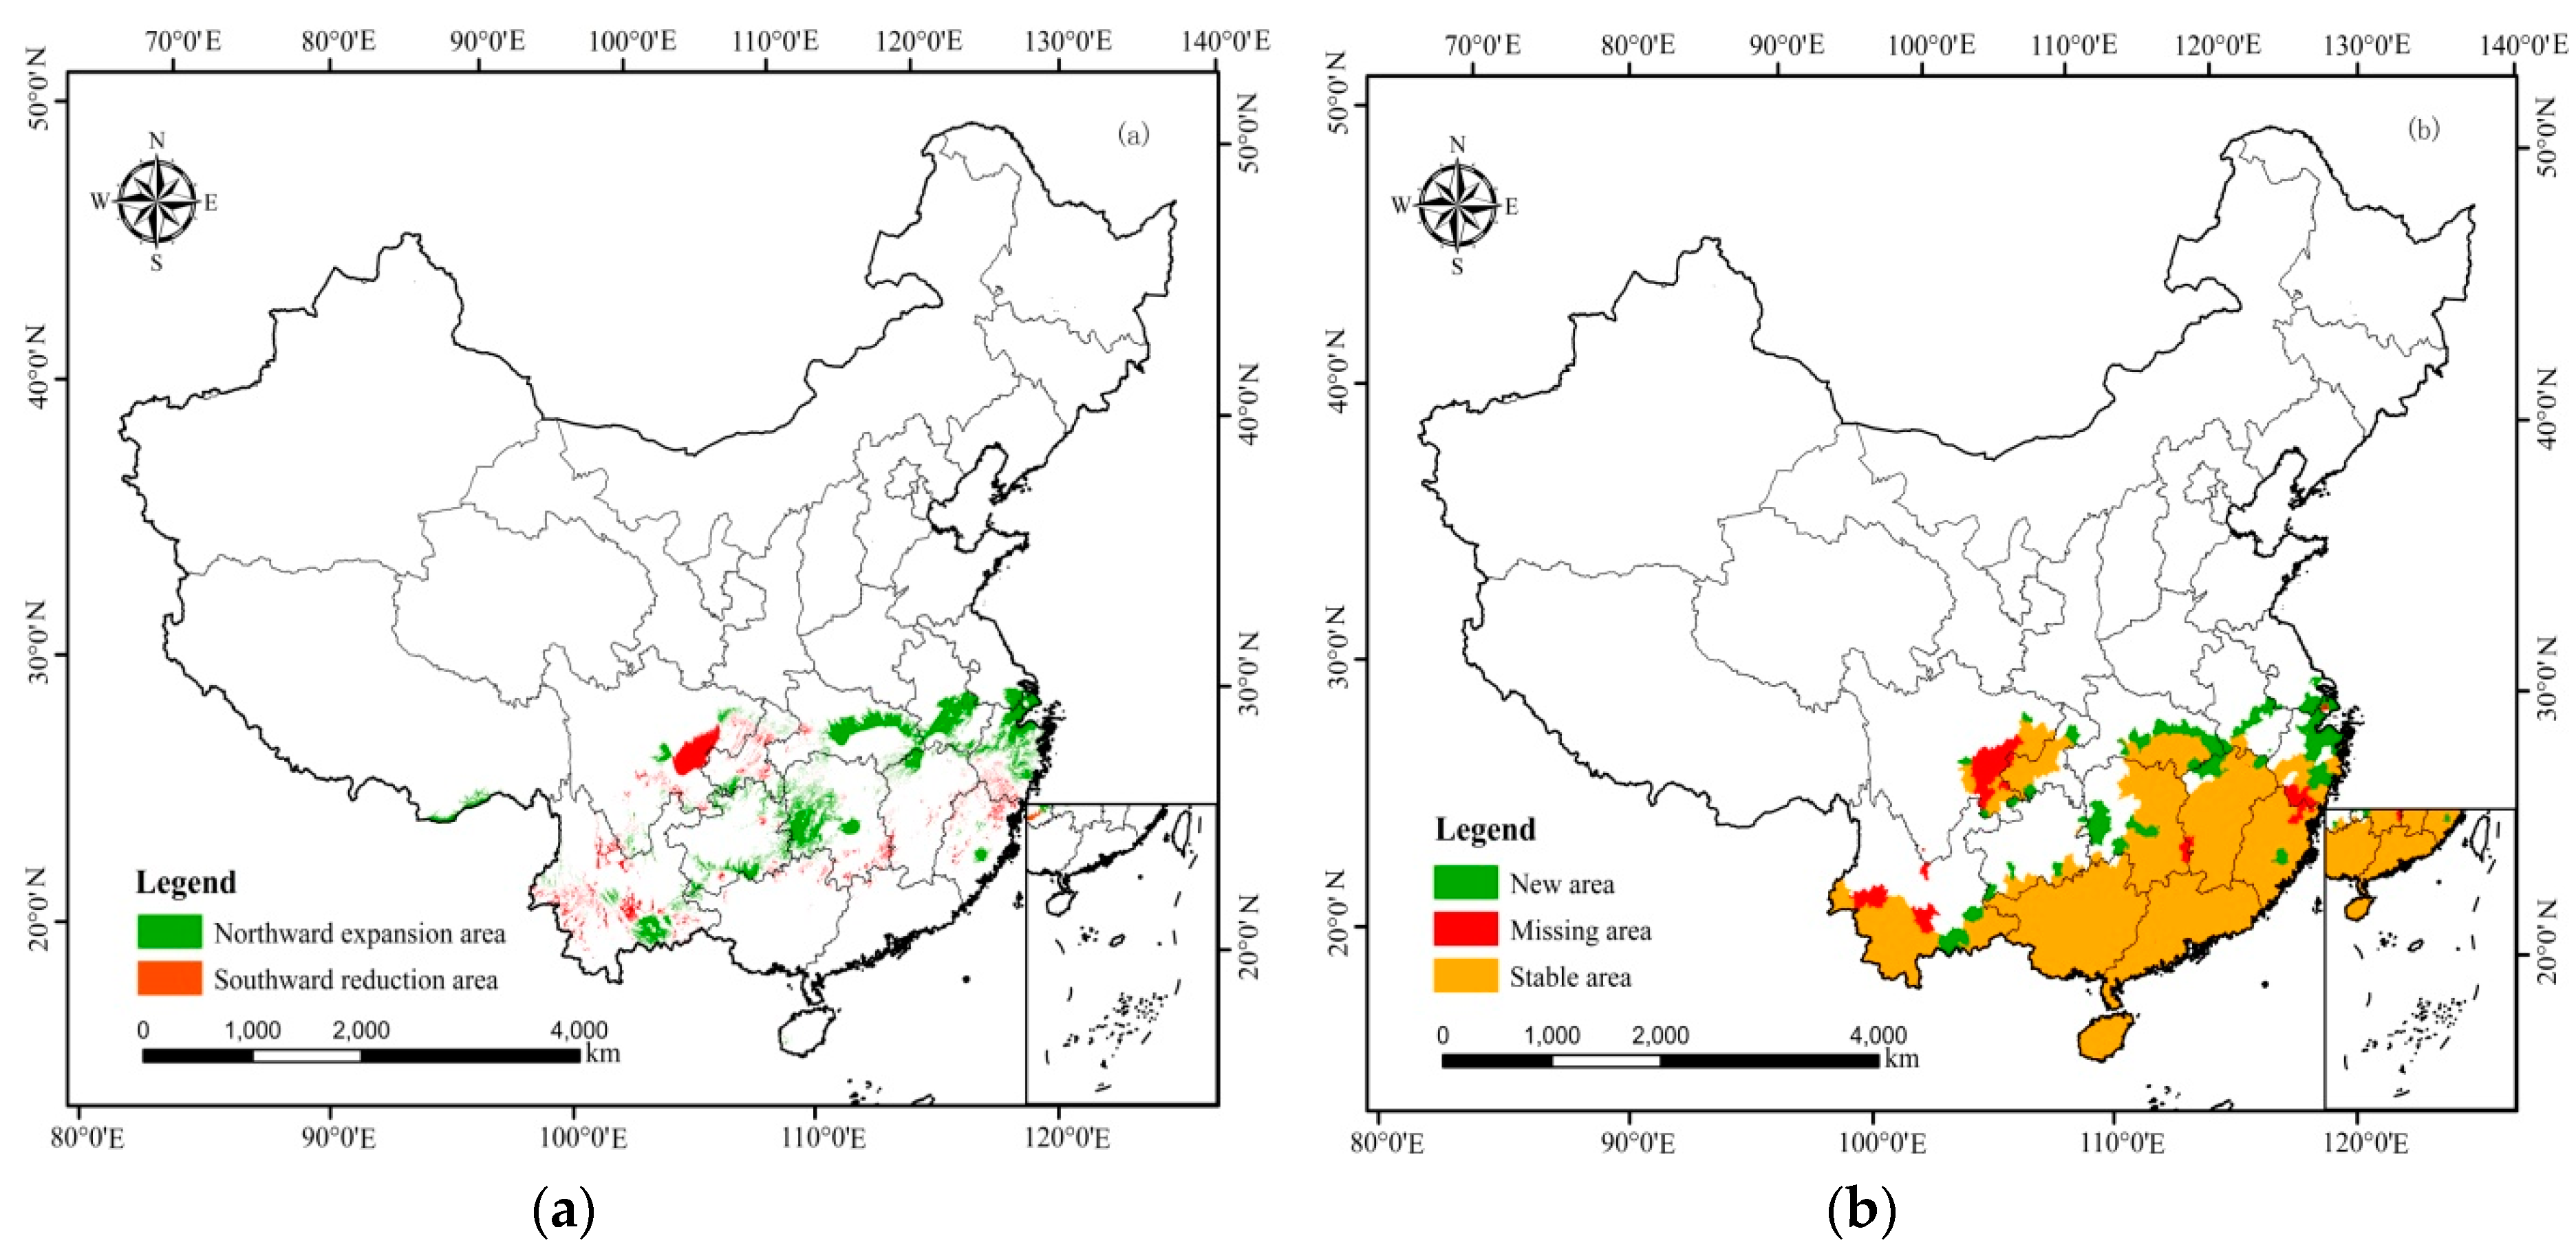
3.2. Response of the RTCS to Climate Change

The spatial distribution of the RTCS was unstable under the impact of inter-annual fluctuation of climatic resources. According to the results of the guarantee rate of 80% for climate resources, the stable area of the RTCS was 94 Mha, including 24.3 Mha of cropland, presenting a good match between climate and cropland. However, the unstable area of the RTCS increased from 27 Mha (Figure 4a) during 1951–80 to 41 Mha during 1981–2010 (Figure 4b), covering 20% and 30% of total areas of the RTCS, respectively. Specifically, 12.2 Mha of cropland in the unstable region were mainly located in the northward expansion and southward reduction areas of the RTCS in the former period, while 16.7 Mha of cropland in the unstable area were mainly located in the northward expansion areas of the RTCS from 1980 to 2010. The northern boundaries of the RTCS moved from the south of Zhejiang to the south of Jiangsu and Anhui, northward approximately 50–100 km in Hubei, and from central to southwest Hunan by 150–200 km; however, the southern boundaries of the RTCS diminished approximately 200 km from the southeast of Sichuan to southwest of Chongqing, from Baoshan City and Yuxi City to Lincang City and Pu’er City in Yunnan with 250 km (Figure 5a).
Comparing the spatial distributions of the RTCS in these two periods, the area of RTCS was 135 Mha, with an increase of 14 Mha due to climate change. The changes were mainly located in the Middle-Lower Yangtze plain, southern Yangtze hill region, Sichuan Basin, and Yunnan-Guizhou Plateau. During the 1951–80 period, the cropland in the RTCS was 34.3 Mha distributed in 725 counties of 14 provinces and cities, namely, Anhui, Chongqing, Fujian, Guangdong, Guangxi, Guizhou, Hainan, Hubei, Hunan, Jiangxi, Yunnan, Sichuan, Shanghai, and Zhejiang. The area then increased to 36.9 Mha, including 817 counties of 15 provinces and cities, with the above 14 provinces (cities) and Jiangsu Province from 1981 to 2010 (Figure 5b). During the past 60 years, there have been 676 counties located in the stable area with abundant water and sufficient average temperature. Between 1981 and 2010, 141 counties were added to the RTCS, and these were mainly located in the Middle-Lower reaches of the Yangtze River. Water and heat resources in this new area of the RTCS presented an increasing trend. For example, ATT0, ATT10, and annual precipitation increased by 5.09%, 7.48%, and 8.79%, respectively. However, 49 counties did not fall into the RTCS category because of decreasing of average temperature and yearly rainfall. The new or missing counties of the RTCS were located in the unstable area of the RTCS. It is noteworthy that there was a small area of RTCS located in Sichuan and Chongqing.

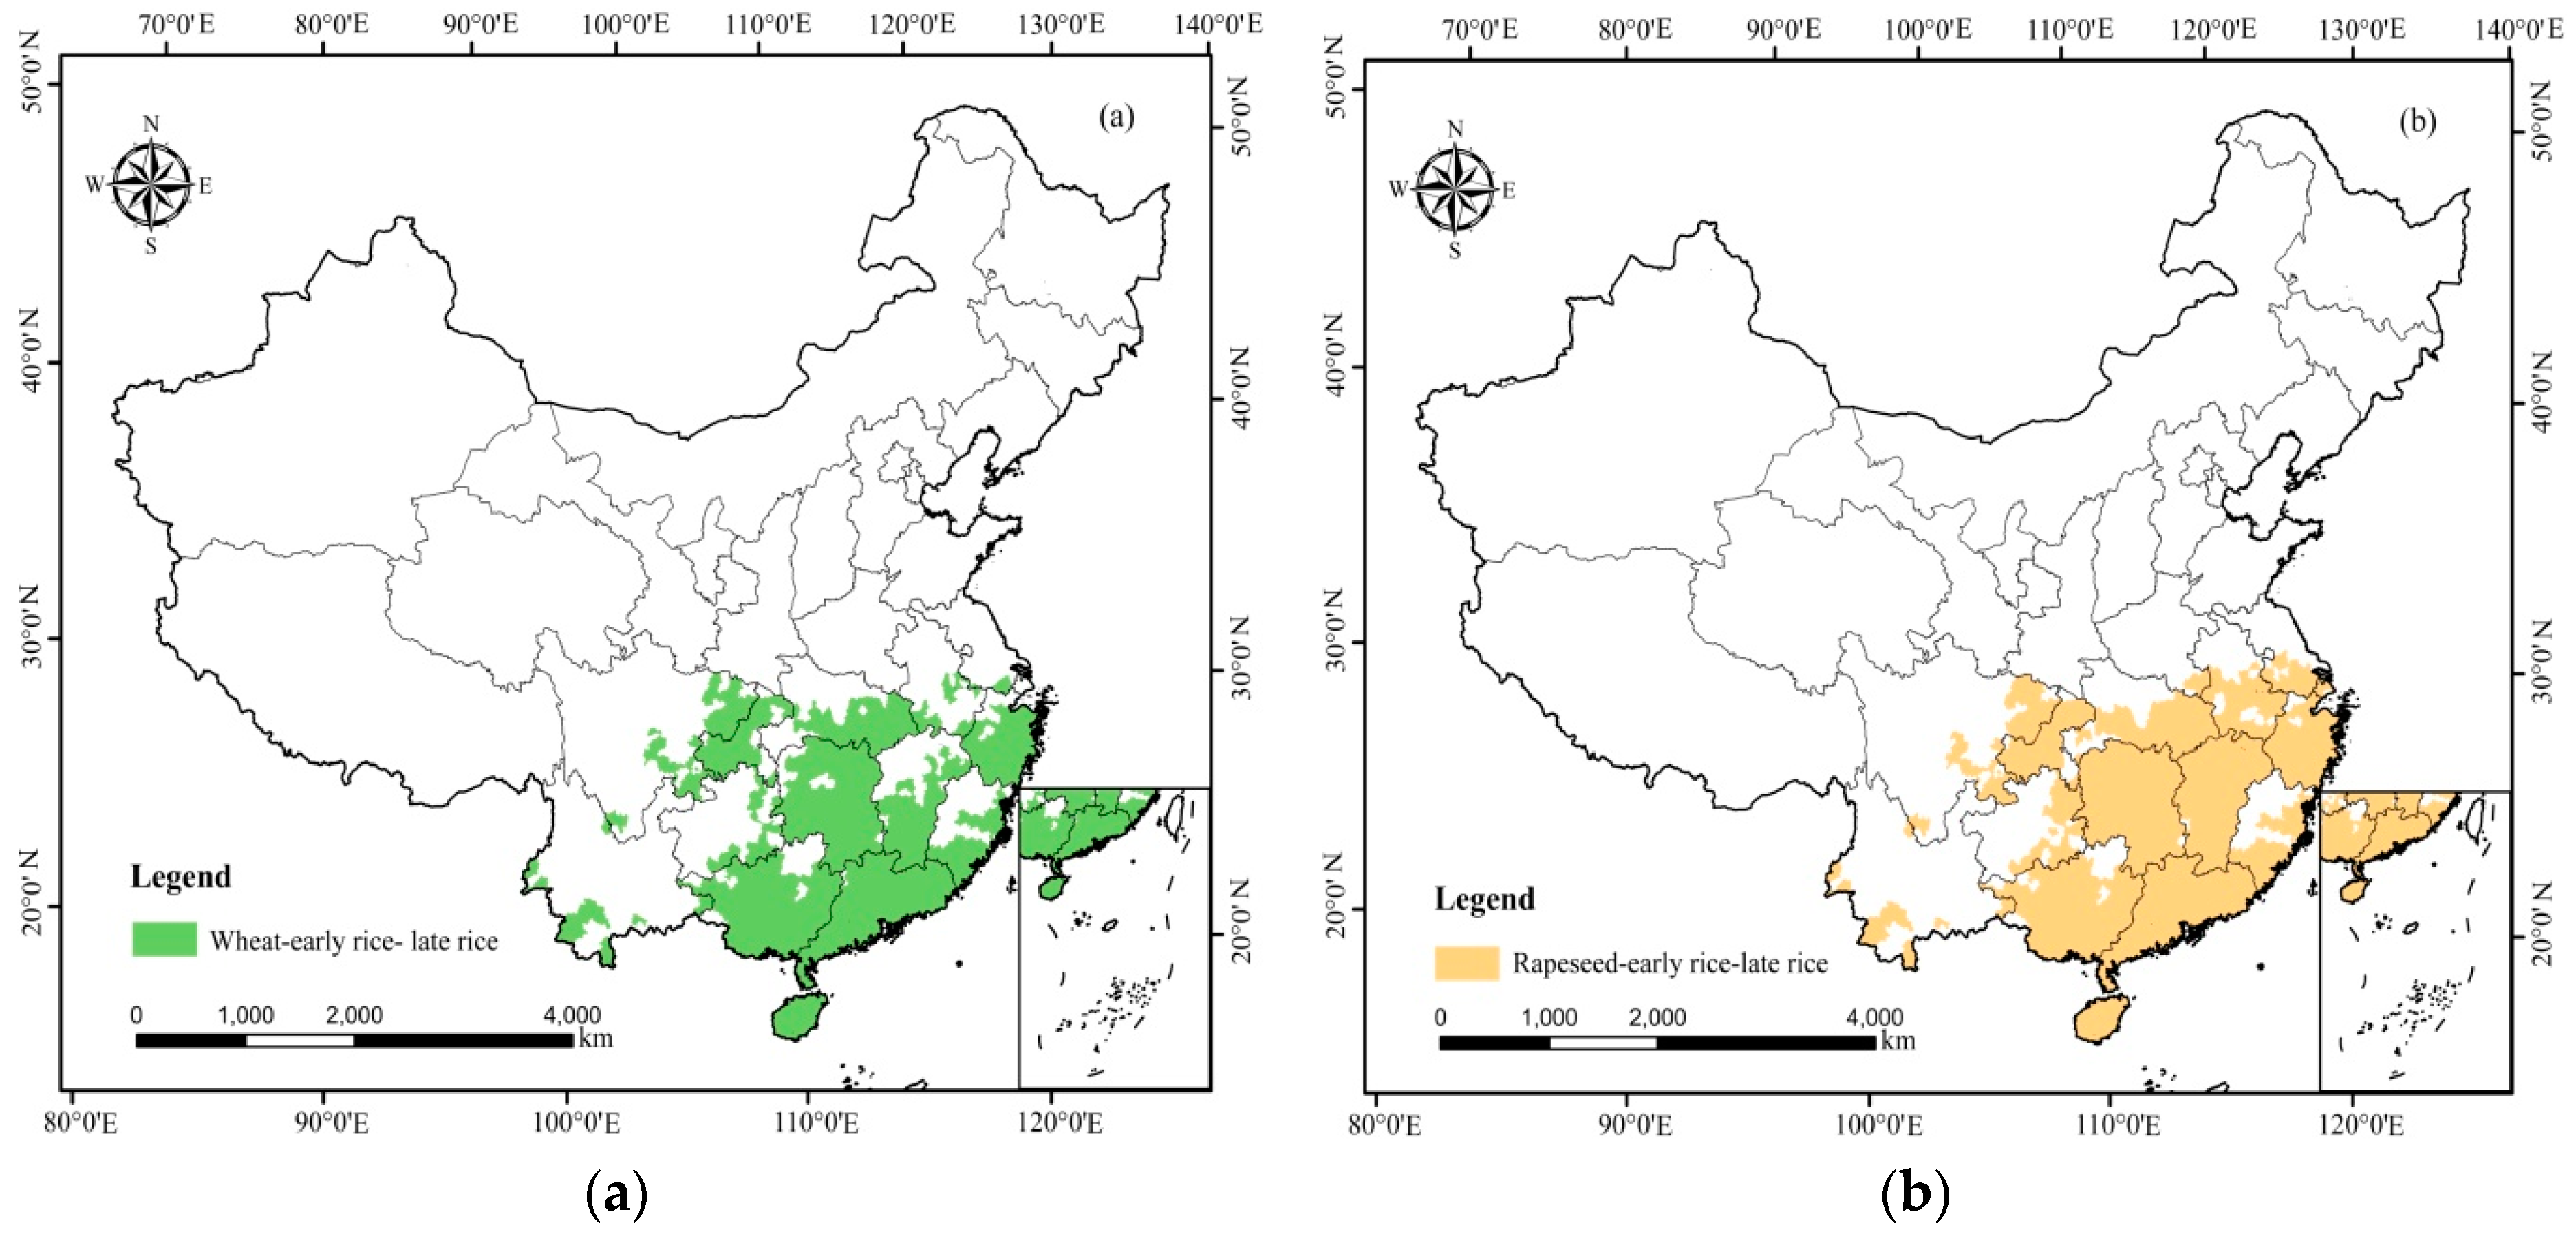
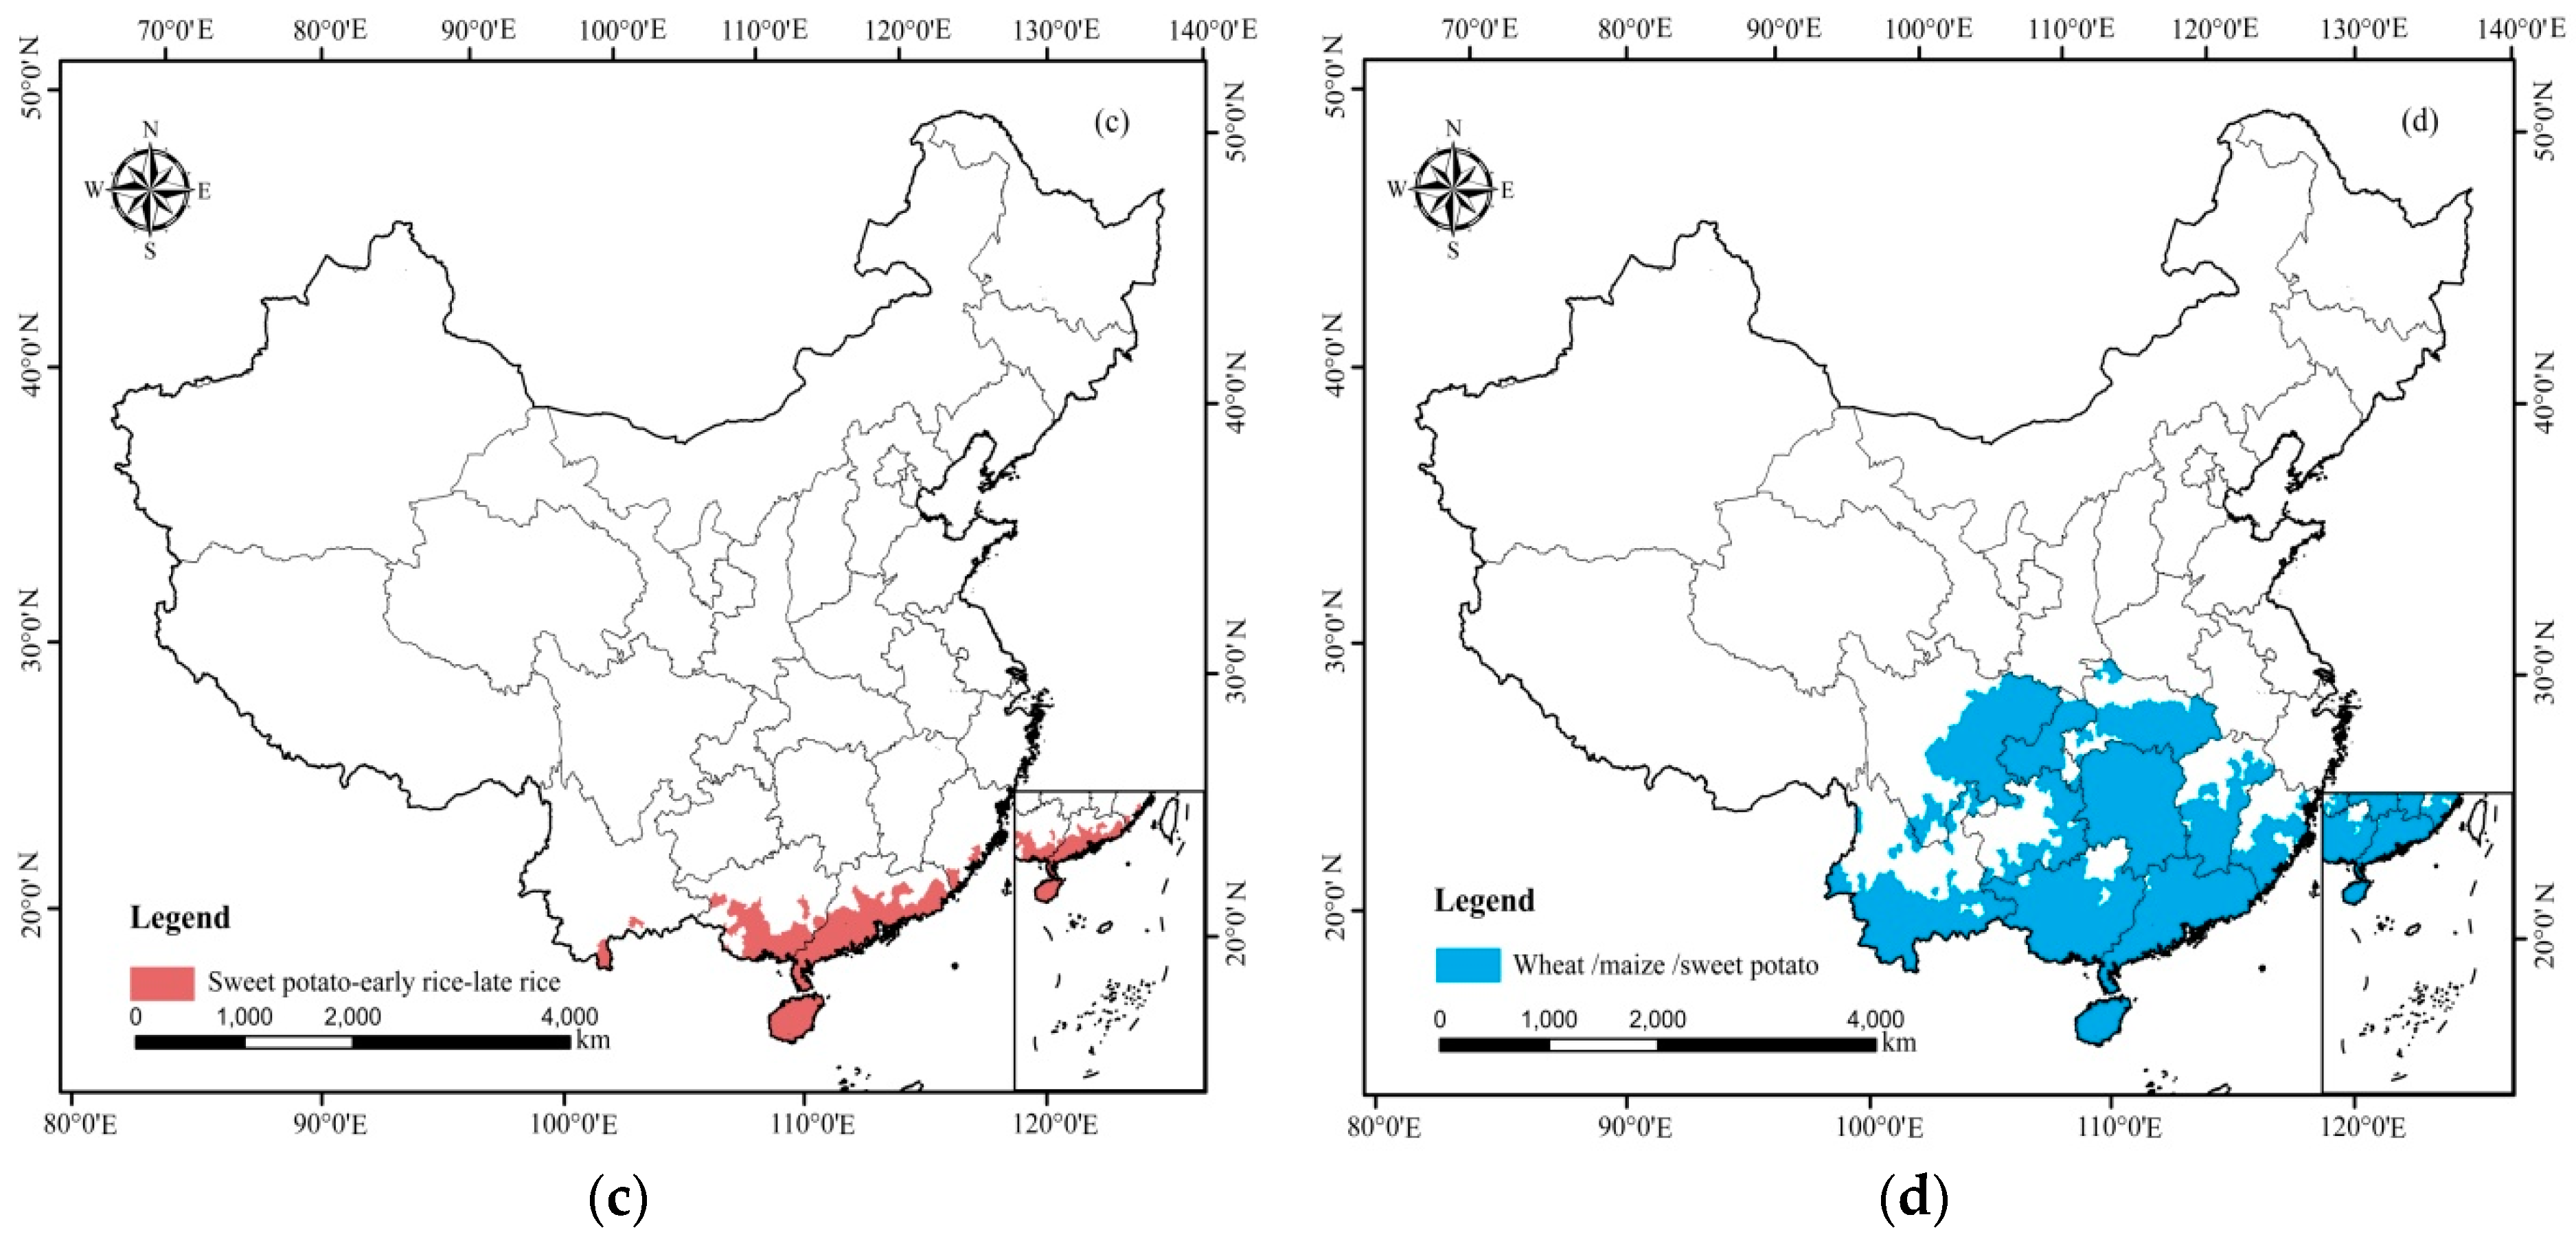
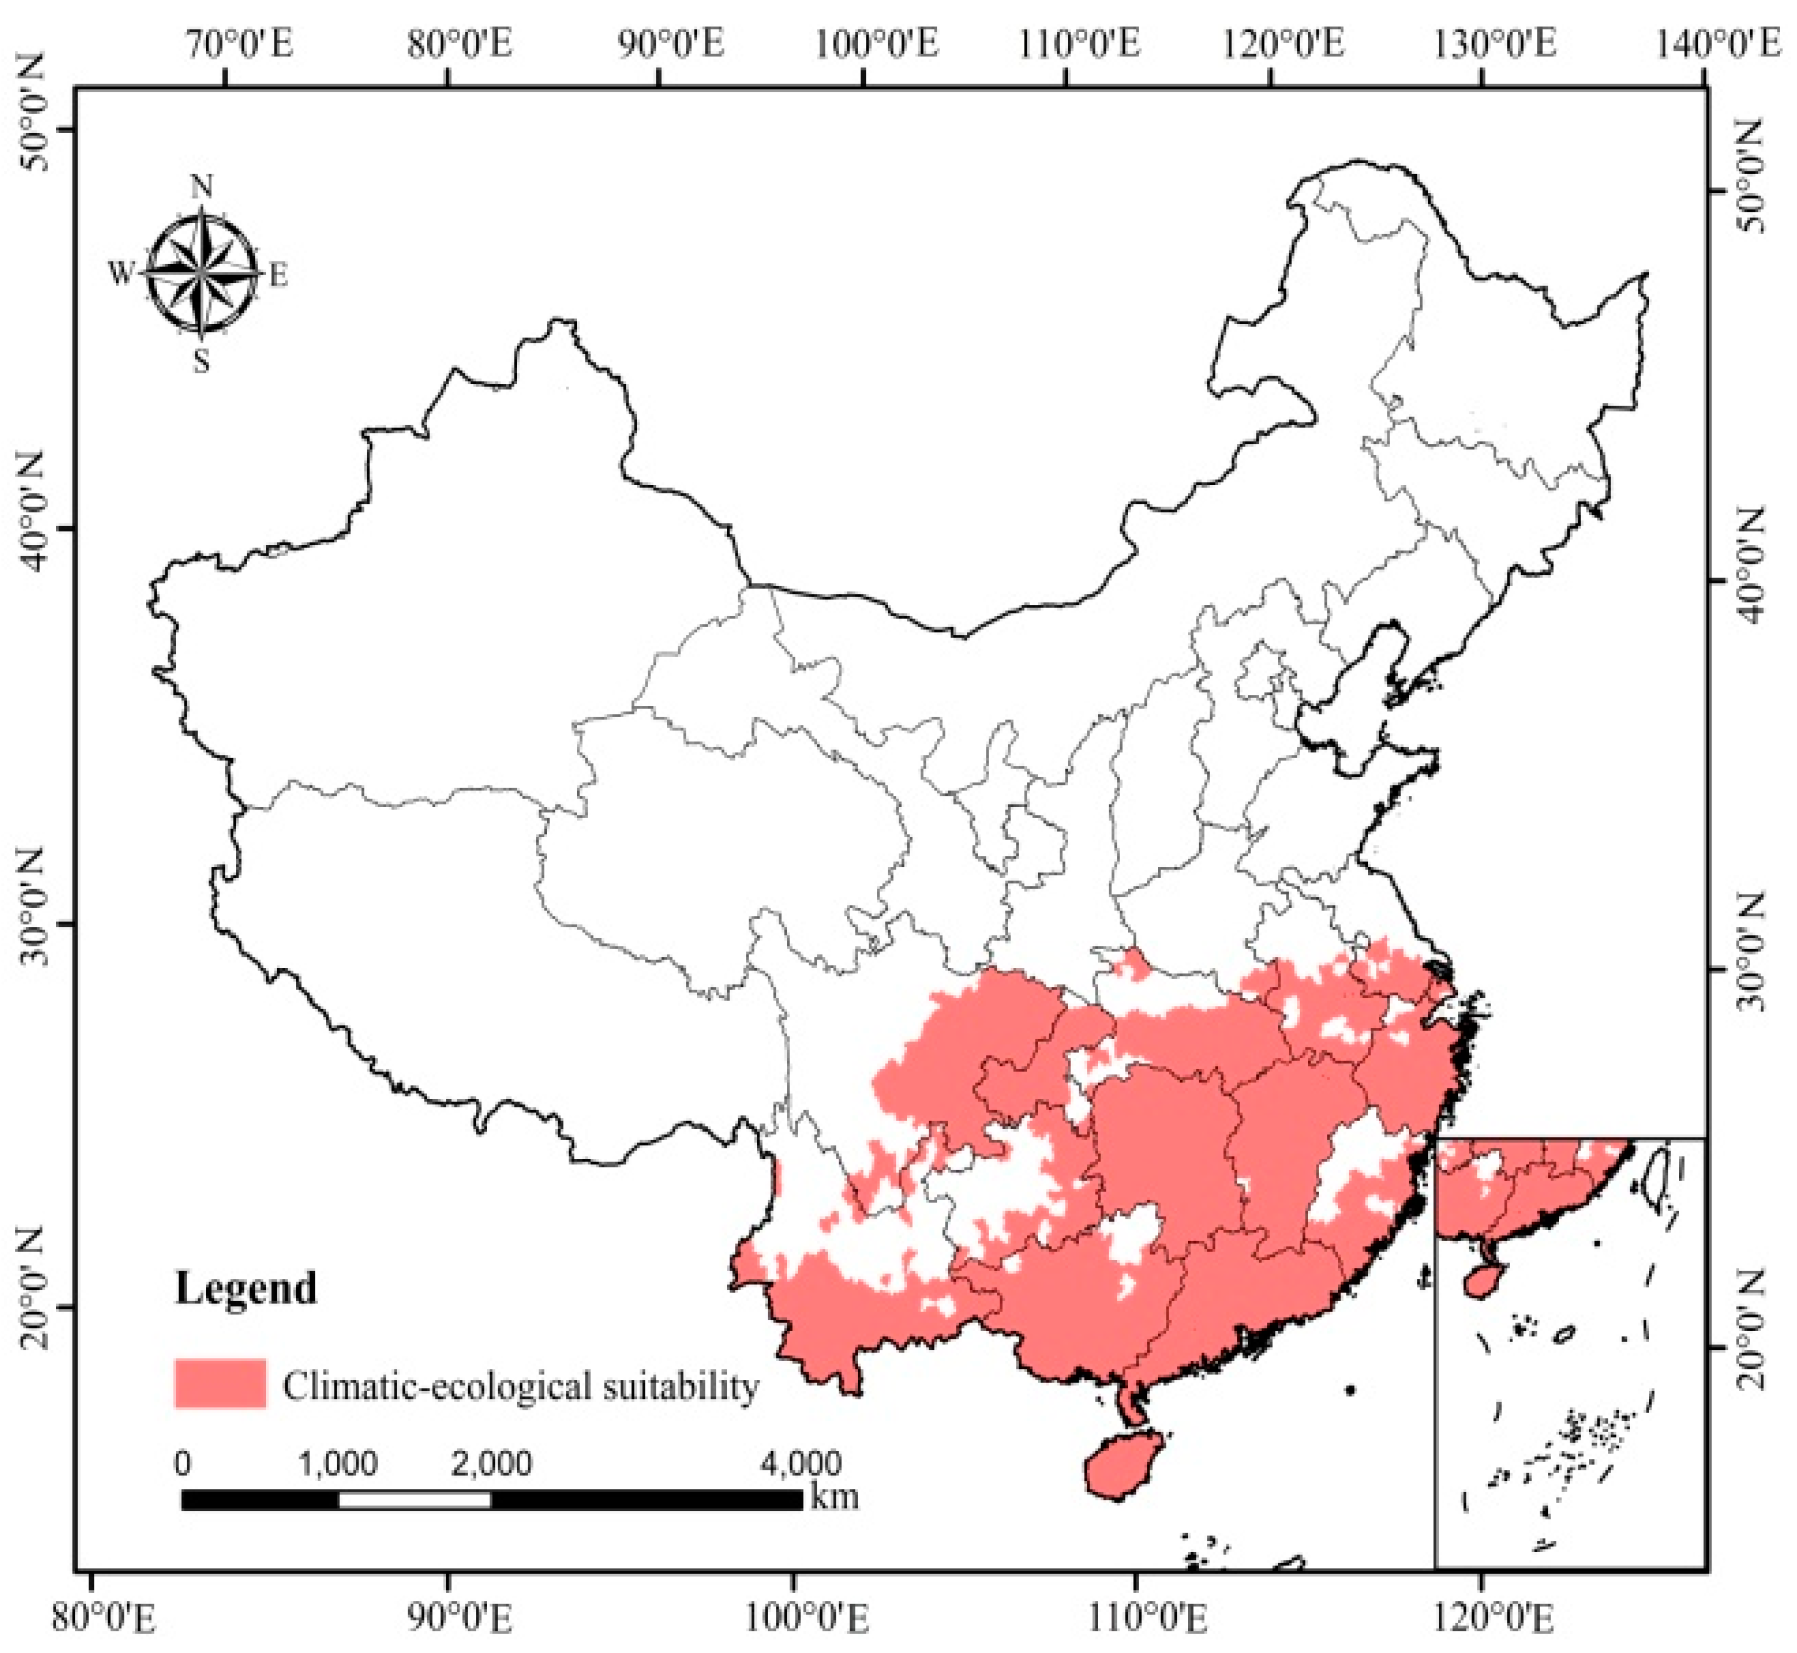
3.3. Distribution of the RTCS Based on Crop Climatic-Ecological Suitability

The climatic-ecological suitability maps of WRR, RRR, SRR, and WMS were obtained for the period 1981 to 2010 (Figure 6). Generally, WRR was a typical three-season crop planting system in paddy fields and had the largest productivity in China. This cropping system was cultivated in 728 counties of 14 provinces and cities (Figure 6a). In this region, AAT0, AAT10, and precipitation were higher than 5700 °C, 5300 °C, and 1000 mm, respectively. Climatic conditions completely met crop requirements for resources throughout the growing period with sufficient amounts of heat and rainfall. The area of cropland suitable for planting WRR was 35.1 Mha, accounting for 20% of the national cropland in 2015. However, the edible quality of winter wheat was not better than that from northern China, so the gap between the realizable and the actual winter wheat planting area has been growing since the 1980s.
As shown in Figure 6b, 907 counties in Hunan, Jiangxi, and other provinces were suited for RRR cultivation. The realizable cropland area of RRR was 43.8 Mha, accounting for 25% of the national cropland. There was also enough heat and rainfall to supply the demands of crops during the growing period, with the AAT0 and AAT10 higher than 5600 °C and 5100 °C, respectively. In addition, rapeseed, as an edible oil crop with shorter growth period, was often grown in winter fallow fields, not only to maximize natural resources but also to increase land use efficiency.
The suitable area for SRR was relatively small and was mainly located in the tropics of China, comprising 159 counties in Guangdong, Guangxi, Hainan, Yunnan, and Fujian Provinces (Figure 6c). The area of cropland suitable for SRR cropping rotation was only 5.9 Mha, accounting for 3.3% of the national cropland. As the daily temperature was always above 10 °C, early rice, late rice, and sweet potato were very suitable for planting. The AAT0 and AAT10 needed to pass 7900 °C and 7000 °C, respectively, to ensure that the thermal demand of the above three warm crops was met.
The WMS system was the main three-season crop cultivation system in dry and hilly areas, with suitable areas located in 805 counties in 11 provinces and cities (Figure 6d). The area of cropland for WMS cultivation was 43.5 Mha, accounting for 24.4% of the national cropland. Compared with rice, the water demand of the crops in WMS was relatively smaller, and thus these crops were planted in dry areas without good irrigation and were mainly reliant on rainfall.
Based on these estimates, the climatic-ecological suitability area of the RTCS in China was obtained for the above four cropping rotations for 1068 counties in the Middle-Lower Yangtze River plain, the southern Yangtze hill region, the Pearl River Delta, Sichuan Basin, and Yunnan-Guizhou Plateau (Figure 7). The climatic-ecological cropland in the area of RTCS was 53.9 Mha, accounting for 30.3% of the national cropland. WRR, RRR, SRR, and WMS were suitable for planting in these counties that benefit from an abundance of natural resources and thus were able to meet the demands of crops during growing periods.

3.4. Verification of the Distribution of RTCS in China

The distribution of the RTCS in China was obtained by synthesizing different distributions of topographic correction, climate conditions, and crop climatic-ecological suitability. The spatial area of the RTCS in China was 135 Mha, with 35.4 Mha of cropland mainly located in 775 counties of the Middle-Lower Yangtze River plain, the southern Yangtze hill region, the Pearl River Delta, Sichuan Basin, and Yunnan-Guizhou Plateau (Figure 8).
As the verification results show (Table 4), Yixiu District is located in Anqing City, Anhui Province. AAT0, AAT10, and annual precipitation are 5902 °C, 5468 °C, and 1417 mm, respectively. Due to the lack of observational information concerning the growth period, this paper referred to the phenology data of crops nearby meteorological observation stations. It is known that the growth period of rapeseed was from the last ten days of October to the first ten days of May; early rice was subsequently transplanted in paddy fields, for which the growth duration was from the first ten days of May to the middle ten days of July. Next, late rice was planted from the last ten days of July to the middle ten days of October. Meanwhile, because of limited observational information for WRR, this paper also referred to the complete observation records of WRR from Yingshan County, where climatic conditions are similar to those of Yixiu District. The growth of winter wheat was usually from the middle ten days of November to the middle ten days of May, followed by early rice from the middle ten days of May to the middle ten days of July; finally, the growing season of late rice was from the last ten days of July to the last ten days of October. Therefore, it is believed that RRR and WRR are suitable for planting. Further, the actual sown areas of winter wheat, rapeseed, early rice, and late rice in the other eight counties of Anqing City in 1990 were 51,600 ha, 68,447 ha, 134,700 ha, and 142,080 ha, respectively. This also verified that RRR and WRR cultivation existed in this area. Similarly, Qiubei County and Junlian County were both suitable for planting WMS. Therefore, the results indicated that 775 counties of the RTCS in China are not only suitable for planting three-season crops, but also are feasible for planting in agricultural production practices.

4. Discussion

4.1. Influences of Climate Change and Terrain on Changes between Potential TCS and RTCS

Climate change has moved the boundary of the RTCS northward by 100–200 km in the Middle-Lower reaches of the Yangtze River and the boundary has diminished southward by approximately 250 km in Yunnan Province. These findings are consistent with the result of Yang et al. [32], who found that the largest spatial displacement of the northern boundary of the three-cropping system was located in Hunan, Hubei, Anhui, Jiangsu and Zhejiang provinces in the Middle-Lower reaches of the Yangtze River between 1981 and 2007. Climate change resulted in an increase of 14 Mha of new RTCS. Compared with two studies [38,46] on the potential TCS in China, the area of RTCS decreased by 16% and 35%, respectively. This difference in results emanates from the fact that previous studies mainly focused on the effect of heat conditions, such as AAT0 or AAT10, while this study focused on the complex influences of terrain, climatic resources, and crop climatic-ecological suitability. It is worth noting that the above analysis of changes to the RTCS was carried out on the basis of climatic conditions. However, the possible adverse effects of extreme weather may be underestimated [65,66,67]. Furthermore, some extreme weather conditions, e.g., heat stress, floods, and severe drought, have recently increased in frequency in Southern China [68], consequently affecting rice yield [69] and food security [70,71,72]. For example, during the rice growing seasons from 1981 to 2007 in the Middle-Lower reaches of the Yangtze River, the sum of average daily temperature (≥10 °C) increased by 12.4 °C, sunshine time was reduced by an average of 8.1%, and total precipitation increased by 1.6%, compared with that of the 1960s–1970s [73]. Therefore, more attention should be paid to the potential risks to grain productivity in agronomic practices of the RTCS caused by the fluctuation of climate resources.
Apart from climate change, terrain plays an important role in defining the distribution of RTCS in China. The relationship between terrain and climate resources is complex and highly variable in space [50]. This relationship affects the redistribution of climate resources and suitable planting areas of crops. Generally, the temperature decreases by approximately 0.6 °C with each 100-m increase in altitude [74]. AAT0 and AAT10 in this study were negatively correlated with elevation with average decreases of 126.6 °C and 134.6 °C with each 100-m increase of elevation during the period of 1980–2010. Precipitation generally increases with elevation, owing to forced uplift and cooling of moisture-bearing winds by terrain barriers [75]. However, this study found that precipitation was negatively correlated with elevation, which means that precipitation decreases with the increase of elevation in Southern China. Therefore, with an increase of altitude in hilly and mountainous areas, the cropping system would change from triple cropping to double cropping due to the limitation of heat resources (i.e., AAT0, and AAT10). For example, plants in the warmer areas reached maturity faster than those at the higher, cooler elevations [76]. Cao et al. [77] propose that latitude and altitude directly affect the temperature change of the wheat growing season and thus indirectly affect the growing period of wheat. In autumn and spring sowing experiments, the amount of wheat from sowing to maturity was significantly positively correlated with latitude and altitude. With the increase in altitude, the maturity period was delayed under the same sowing date. The results show that the area of the RTCS decreased by 19 Mha between 1981 and 2010 under the influence of topographic correction. Therefore, when evaluating the spatial distribution of a cropping system at a large scale, the influence of complex terrain on the redistribution of climatic resources should be considered.

4.2. Understanding the Gap between Actual TCS and RTCS Caused by Socio-Economic Factors

About 35.4 Mha of the RTCS are croplands with exceptional natural resources. Furthermore, the RTCS areas are the most important crop production areas for enhancing cereal productivity, as they promote efficient use of natural resources (i.e., light, heat, and rainfall) [78]. If all RTCS croplands were planted with triple-season crops, the sown area would be 106.2 Mha, accounting for 94% of the national grain sown area in 2015. This means that the RTCS has a great potential to feed the total population, even though it comprises only 20% of the national arable land in China. This result highlights the available opportunities for improving actual cropping systems in the RTCS areas of Southern China. A previous study found that there was a 22% gap between multiple cropping index (MCI) and potential multiple cropping index (PMCI) in China in 2005 [9].
It is difficult to close the gap between the RTCS and actual TCS when farmer preferences, policies, and economic variables counteract each other [79,80]. Some researchers have explored the reasons from the macroscopic scale, and they have focused on the conflict between grain production and economic development, arguing that the development of secondary and tertiary industries, agricultural mechanization, and urbanization cause loss of farmers and arable land occupation [18,81,82,83]. This study has identified the driving factors that caused the gap at the cropping systems levels. First, high cost and low income prevent the gap from being reduced. Based on costs and benefits of agricultural products in China in 2014, it is estimated that the net profit of WRR and RRR in 2014 were $842 USD/ha and $215 USD /ha, respectively. Second, the number of farm workers employed in the RTCS is higher than that in double cropping systems. For example, the number of days that a farmer worked in the fields under WRR and RRR was 256.35 days/ha and 293.1 days/ha, respectively [84]. Therefore, low agricultural economic benefits and large labor input in the TCS caused a large number of farm workers to shift to non-agricultural industries. The result of this trend is that the sown area of crops and cropping intensities gradually declined [85]. Third, the application of agricultural mechanization helps to reduce the number of farm workers [86], but a certain number of laborers are still needed for crop management, especially in the area of terrain that are unsuitable for mechanization. For example, operating heavy machines on wet soil that has low bearing strength is problematic [87]. Much arable land is in mountainous and hilly regions instead of on plains where it is encroached upon by construction that supports economic development [88].
From the above analysis, it is apparent that reducing the gap between the RTCS and the actual sown area faces great challenges. However, wherever natural conditions allow, it is necessary to adopt high intensity cultivation to secure an efficient food supply in China [89,90]. Therefore, the RTCS in Southern China should be the first choice to ensure food security by increasing the efficient use of water, soil, light energy, and other natural resources [47] while reducing the use of inputs and limiting the adverse effects on the environment [26]. In reality, it has not been possible to always fully realize triple cropping rotations in this area due to the above social-economic constraints. However, this study provides some insights for developing a grain production policy. The RTCS will be an important factor in the potential of reserved cultivated land, and it could balance the tradeoffs among resources use, social demands and economic development in Southern China.

5. Conclusions

Exploring RTCS using factors such as terrain, climate resources, and crop climatic-ecological suitability provides reliable results for evaluating cropping systems. In this study, a spatial distribution map of the RTCS in China was obtained based on topographic correction, climatic resources, and crop climatic-ecological suitability. Terrain influenced the spatial distribution of the RTCS, and resulted in the area of RTCS decreasing by 19 Mha. In addition, the new area of the RTCS was increased by 14 Mha in response to climate warming. The boundary of the RTCS moved northward by 100–200 km in the Middle-Lower reaches of the Yangtze River and diminished southward by approximately 250 km in Yunnan Province between 1951 and 2010.
Our study delineates the distribution of the RTCS in China, and thus will be helpful in agricultural management and policy decisions on the implementation of agricultural activities. This study suggests that the RTCS should be promoted as an intensive land use and be practiced by many countries globally. It is a most effective way to enhance food security without expansion of cropland area. Further studies should explore the contribution of grain production in the RTSC area for national food security. The effects on the ecology from adjusting the cultivated land use between Southern China and northern China also need further in-depth study.

Author Contributions

Conceptualization, L.J., and P.A.; Data curation, L.J., X.C., J.N., and C.D.; Formal analysis, L.J.; Funding acquisition, P.A.; Investigation, L.M., and G.Z.; Methodology, L.J.; Project administration, S.S., and P.A.; Resources, J.N., and C.D.; Software, X.C.; Supervision, S.S. and P.A.; Validation, L.J., P.A. and Z.P.; Visualization, L.J. and X.C.; Writing—original draft preparation, L.J.; Writing—review and editing, F.L., Z.P., C.M., S.S. and P.A.

Funding

This research was funded by the National key R & D Program of China (No. 2017YFD0300906) and the Program of Reassessment of Standard Cropping System in China by Ministry of Land and Resources of China (No. 20170203).

Conflicts of Interest

The authors declare no conflict of interest.

References

  1. Guilpart, N.; Grassini, P.; Sadras, V.O.; Timsina, J.; Cassman, K.G. Estimating yield gaps at the cropping system level. Field Crops Res. 2017, 206, 21–32. [Google Scholar] [CrossRef] [PubMed]
  2. Tirlapur, L.N.; Mundinamani, S.M. An economic analysis on land use and cropping pattern in Dharwad district. Int. Res. J. Agric. Econ. Stat. 2015, 6, 176–181. [Google Scholar] [CrossRef]
  3. Struik, P.C.; Kuyper, T.W. Editorial overview: Sustainable intensification to feed the world: Concepts, technologies and trade-offs. Curr. Opin. Environ. Sustain. 2014, 8, VI–VIII. [Google Scholar] [CrossRef]
  4. Smith, P. Delivering food security without increasing pressure on land. Glob. Food Secur. 2013, 2, 18–23. [Google Scholar] [CrossRef]
  5. Francis, C.A. Importance of multiple-species systems. Biological efficiencies in multiple-cropping systems. In Advances in Agronomy; Academic Press: Lincoln, NE, USA, 1989; Volume 42, pp. 1–42. [Google Scholar]
  6. Guo, J.P.; Zhao, J.F.; Xu, Y.H.; Chu, Z.; Mu, J.; Zhao, Q. Effects of adjusting cropping systems on utilization efficiency of climatic resources in Northeast China under future climate scenarios. Phys. Chem. Earth 2015, 87–88, 87–96. [Google Scholar] [CrossRef]
  7. Yan, H.M.; Xiao, X.M.; Huang, H.Q.; Liu, J.Y.; Chen, J.Q.; Bai, X.H. Multiple cropping intensity in China derived from agro-meteorological observations and MODIS data. Chin. Geogr. Sci. 2013, 24, 205–219. [Google Scholar] [CrossRef]
  8. Yu, Q.Y.; Wu, W.B.; You, L.Z.; Zhu, T.J.; van Vliet, J.; Verburg, P.H.; Liu, Z.H.; Li, Z.G.; Yang, P.; Zhou, Q.B.; et al. Harvested area gaps in China. Agric. Syst. 2017, 153, 212–220. [Google Scholar] [CrossRef]
  9. Zuo, L.J.; Wang, X.; Zhang, Z.X.; Zhao, X.L.; Liu, F.; Yi, L.; Liu, B. Developing grain production policy in terms of multiple cropping systems in China. Land Use Policy 2014, 40, 140–146. [Google Scholar] [CrossRef]
  10. Biradar, C.M.; Xiao, X.M. Quantifying the area and spatial distribution of double-and triple-cropping croplands in India with multi-temporal MODIS imagery in 2005. Int. J. Remote Sens. 2011, 32, 367–386. [Google Scholar] [CrossRef]
  11. Panigrahy, S.; Manjunath, K.R.; Ray, S.S. Deriving cropping system performance indices using remote sensing data and GIS. Int. J. Remote Sens. 2005, 26, 2595–2606. [Google Scholar] [CrossRef]
  12. Quilty, J.R.; Mckinley, J.; Pede, V.O.; Buresh, R.J.; Correa, T.Q., Jr.; Sandroa, J.M. Energy efficiency of rice production in farmers’ fields and intensively cropped research fields in the Philippines. Field Crops Res. 2014, 168, 8–18. [Google Scholar] [CrossRef]
  13. Xiao, X.M.; Boles, S.; Liu, J.Y.; Zhuang, D.F.; Frolking, S.; Li, C.S.; Salas, W.; Moore, B. Mapping paddy rice agriculture in southern China using multi-temporal MODIS images. Land Use Policy 2005, 95, 480–492. [Google Scholar] [CrossRef]
  14. Seifert, C.A.; Lobell, D.B. Response of double cropping suitability to climate change in the United States. Environ. Res. Lett. 2015, 10, 024002. [Google Scholar] [CrossRef] [Green Version]
  15. Cohn, A.S.; Van Wey, L.K.; Spera, S.A.; Mustard, J.F. Cropping frequency and area response to climate variability can exceed yield response. Nat. Clim. Chang. 2016, 6, 601–604. [Google Scholar] [CrossRef]
  16. Estel, S.; Kuemmerle, T.; Levers, C.; Baumann, M.; Hostert, P. Mapping cropland use intensity across Europe using MODIS NDVI time series. Environ. Res. Lett. 2016, 11, 024015. [Google Scholar] [CrossRef]
  17. Niedertscheider, M.; Kastner, T.; Fetzel, T.; Haberl, H.; Kroisleitner, C.; Plutzar, C.; Erb, K.H. Mapping and analysing cropland use intensity from a NPP perspective. Environ. Res. Lett. 2016, 11, 014008. [Google Scholar] [CrossRef] [Green Version]
  18. Ray, D.K.; Foley, J.A. Increasing global crop harvest frequency: Recent trends and future directions. Environ. Res. Lett. 2013, 8, 044041. [Google Scholar] [CrossRef]
  19. Zabel, F.; Putzenlechner, B.; Mauser, W. Global agricultural land resources—A high resolution suitability evaluation and its perspectives until 2100 under climate change conditions. PLoS ONE 2014, 9, e107522. [Google Scholar] [CrossRef]
  20. Xiang, M.T.; Yu, Q.Y.; Wu, W.B. From multiple cropping index to multiple cropping frequency: Observing cropland use intensity at a finer scale. Ecol. Indic. 2019, 101, 892–903. [Google Scholar] [CrossRef]
  21. Wu, W.B.; Yu, Q.Y.; You, L.Z.; Chen, K.; Tang, H.J.; Liu, J.G. Global cropping intensity gaps: Increasing food production without cropland expansion. Land Use Policy 2018, 76, 515–525. [Google Scholar] [CrossRef]
  22. Wang, J.Y.; Zhang, Z.W.; Liu, Y.S. Spatial shifts in grain production increases in China and implications for food security. Land Use Policy 2018, 74, 204–213. [Google Scholar] [CrossRef]
  23. Gray, J.; Friedl, M.; Frolking, S.; Ramankutty, N.; Nelson, A.; Guma, M.K. Mapping Asian cropping intensity with MODIS. IEEE J. Sel. Top. Appl. Earth Obs. Remote Sens. 2014, 7, 3373–3379. [Google Scholar] [CrossRef]
  24. Plourde, J.D.; Pijanowski, B.C.; Pekin, B.K. Evidence for increased monoculture cropping in the Central United States. Agric. Ecosyst. Environ. 2013, 165, 50–59. [Google Scholar] [CrossRef]
  25. Beets, W.C. Introduction. In Multiple Cropping and Tropical Farming Systems; Westview Press: Boulder, CO, USA, 1982; pp. 14–26. [Google Scholar]
  26. Gaba, S.; Lescourret, F.; Boudsocq, S.; Enjalbert, J.; Hinsinger, P.; Journet, E.P.; Navas, M.L.; Wery, J.; Louarn, G.; Malézieux, E.; et al. Multiple cropping systems as drivers for providing multiple ecosystem services: From concepts to design. Agron. Sustain. Dev. 2015, 35, 607–623. [Google Scholar] [CrossRef]
  27. Hayami, Y.; Ruttan, V.W. Agricultural Development: An International Perspective; Johns Hopkins University Press: Baltimore, MD, USA, 1985. [Google Scholar]
  28. Turner, B.L.; Doolittle, W.E. The concept and measure of agricultural intensity. Prof. Geogr. 1978, 30, 297–301. [Google Scholar] [CrossRef]
  29. Turner, B.L.; Hanham, R.Q.; Portararo, A.V. Population pressure and agricultural intensity. Ann. Assoc. Am. Geogr. 1977, 67, 384–396. [Google Scholar]
  30. Ye, Q.; Yang, X.G.; Dai, S.W.; Chen, G.S.; Li, Y.; Zhang, C.X. Effects of climate change on suitable rice cropping areas, cropping systems and crop water requirements in southern China. Agric. Water Manag. 2015, 159, 35–44. [Google Scholar] [CrossRef]
  31. Wang, F.T. Impact of climate change on cropping system and its implication for agriculture in China. Acta Meteorol. Sin. 1997, 11, 407–415. [Google Scholar]
  32. Yang, X.G.; Liu, Z.J.; Chen, F. The possible effects of global warming on cropping systems in China I. The possible effects of climatic warming on northern limits of cropping systems and crop yields in China. Sci. Agric. Sin. 2010, 43, 329–336, (In Chinese with English abstract). [Google Scholar]
  33. Li, Y.J.; Wang, C.Y. Impacts of climate change on crop planting structure in China. Adv. Clim. Chang. Res. 2010, 6, 123–129, (In Chinese with English abstract). [Google Scholar]
  34. Ju, H.; Velde, M.; Lin, E.; Xiong, W.; Li, Y.C. The impacts of climate change on agricultural production systems in China. Clim. Chang. 2013, 120, 313–324. [Google Scholar] [CrossRef]
  35. Yang, X.G.; Liu, Z.J.; Chen, F. The possible effect of climate warming on northern limits of cropping system and crop yield in China. Agric. Sci. Chin. 2011, 10, 585–594. [Google Scholar] [CrossRef]
  36. Zhao, J.; Yang, X.G.; Liu, Z.J.; Chen, D.F.; Wang, W.F.; Chen, F. The possible effect of global climate changes on cropping systems boundary in China II. The characteristics of climatic variables and the possible effect on northern limits of cropping systems in South China. Sci. Agric. Sin. 2010, 43, 1860–1867, (In Chinese with English abstract). [Google Scholar]
  37. Li, Y.; Yang, X.G.; Ye, Q.; Chen, F. The possible effects of global warming on cropping systems in China IX. The risks of high and low temperature disasters for single and double rice and its impacts on rice yield in the Middle-Lower Yangtze Plain. Sci. Agric. Sin. 2013, 46, 3997–4006. (In Chinese) [Google Scholar]
  38. Yang, X.G.; Chen, F.; Lin, X.M.; Liu, Z.J.; Zhao, J.; Li, K.N.; Ye, Q.; Li, Y.; Lv, S.; Yang, P.; et al. Potential benefits of climate change for crop productivity in China. Agric. For. Meteorol. 2015, 208, 76–84. [Google Scholar] [CrossRef]
  39. Cao, M.K.; Ma, S.J.; Han, C.R. Potential productivity and human carrying capacity of an agro-ecosystem: An analysis of food production potential of China. Agric. Syst. 1995, 47, 387–414. [Google Scholar] [CrossRef]
  40. Jain, M.; Mondal, P.; Defries, R.S.; Small, C.; Galford, G.L. Mapping cropping intensity of smallholder farms: A comparison of methods using multiple sensors. Remot. Sens. Environ. 2013, 134, 210–223. [Google Scholar] [CrossRef]
  41. Liu, X.H.; Han, X.L. China’s Multi-Cropping; Beijing Agricultural University Press: Beijing, China, 1987. (In Chinese) [Google Scholar]
  42. Duan, H.P. Analysis of the development of Hunan farming system from 1949 to 1998. Crop Plant 2001, 3, 1–4. (In Chinese) [Google Scholar]
  43. Zuo, L.J.; Wang, X.; Liu, F.; Yi, L. Spatial exploration of multiple cropping efficiency in China based on time series remote sensing data and econometric model. J. Integr. Agric. 2013, 12, 903–913. [Google Scholar] [CrossRef]
  44. Liu, L.; Xu, X.L.; Zhuang, D.F.; Chen, X.; Li, S. Changes in the potential multiple cropping system in response to climate change in China from 1960–2010. PLoS ONE 2013, 8, e80990. [Google Scholar] [CrossRef]
  45. Verburg, P.H.; Chen, Y.Q.; Veldkamp, T.A. Spatial explorations of land use change and grain production in China. Agric. Ecosyst. Environ. 2000, 82, 333–354. [Google Scholar] [CrossRef]
  46. Wang, Q.X.; Otsubo, K.; Ichinose, T. Estimation of Potential and Convertible Arable Land in China. 2001. Available online: http://www.researchgate.net/ publication/274296271 (accessed on 11 March 2019).
  47. Fan, J.L.; Wu, B.F. A study on cropping index potential based on GIS. J. Remote Sens. 2004, 8, 637–644. (In Chinese) [Google Scholar]
  48. Sun, Q.L.; Feng, X.F.; Ge, Y.; Li, B.L. Topographical effects of climate data and their impacts on the estimation of net primary productivity in complex terrain: A case study in Wuling mountainous area, China. Ecol. Inform. 2015, 27, 44–54. [Google Scholar] [Green Version]
  49. Bryan, B.A.; Adams, J.M. Three-Dimensional Neurointerpolation of Annual Mean Precipitation and Temperature Surfaces for China. Geogr. Anal. 2002, 34, 93–111. [Google Scholar] [CrossRef] [Green Version]
  50. Daly, C. Guidelines for assessing the suitability of spatial climate data sets. Int. J. Climatol. 2006, 26, 707–721. [Google Scholar] [CrossRef] [Green Version]
  51. Wang, G.Q.; Zhang, B.; Zhang, Y.Z.; Tang, M.; Ma, B. Variation tendency of accumulated temperature in Gansu Province in recent 55 years. Res. Soil Water Conserv. 2016, 23, 193–198, (In Chinese with English abstract). [Google Scholar]
  52. Sun, W.; Zhu, Y.Q.; Huang, S.L.; Guo, C.X. Mapping the mean annual precipitation of China using local interpolation techniques. Theor. Appl. Climatol. 2014, 119, 171–180. [Google Scholar] [CrossRef]
  53. Wang, R.J.; Li, X.B.; Tan, M.H.; Xin, L.J.; Wang, S.; Wang, Y.H.; Jiang, M. Inter-provincial differences in rice multi-cropping changes in double-cropping rice area in China: Evidence from Provinces and Households. Chin. Geogr. Sci. 2019, 29, 127–138. [Google Scholar] [CrossRef]
  54. Gong, Z.P.; Ma, C.M. Farming System; China Hydraulic Press: Beijing, China, 2013. (In Chinese) [Google Scholar]
  55. Fischer, G.; Velthuizen, H.V.; Shah, M.; Nachtergaele, F. Agro-ecological Methodology and Results. In Global Agro-Ecological Assessment for Agriculture in the 21st Century; International Institute for Applied Systems Analysis: Rome, Italy; Food and Agriculture Organization of the United Nations: Laxenburg, Austria, 2002; pp. 6–103. [Google Scholar]
  56. Dong, J.W.; Liu, J.Y.; Tao, F.L.; Xu, X.L.; Wang, J.B. Spatio-temporal changes in annual accumulated temperature in China and the effects on cropping systems. Clim. Res. 2009, 40, 37–48. [Google Scholar] [CrossRef]
  57. Zhang, R.R.; Chen, X.; Wang, H.M.; Cheng, Q.B.; Zhang, Z.C.; Shi, P. Temporal change of spatial heterogeneity and its effect on regional trend of annual precipitation heterogeneity indices. Hydrol. Proc. 2017, 31, 3178–3190. [Google Scholar] [CrossRef]
  58. Xie, P.; Li, H.Q.; Ye, A.Z. A lake eutrophication stochastic assessment method by using empirical frequency curve and its verification. J. Lake Sci. 2004, 16, 371–376, (In Chinese with English abstract). [Google Scholar]
  59. Villarín, M.C. Methodology based on fine spatial scale and preliminary clustering to improve multivariate linear regression analysis of domestic water consumption. Appl. Geogr. 2019, 103, 22–39. [Google Scholar] [CrossRef]
  60. Dai, S.P.; Li, H.L.; Luo, H.X.; Liu, H.Q.; Cao, J.H. Spatial simulation of AAT10 (active accumulated temperature ≥10 °C) based on Multiple Linear Regression Model. Chin. J. Trop. Agric. 2014, 34, 54–59, (In Chinese with English abstract). [Google Scholar]
  61. Samanta, S.; Pal, D.K.; Lohar, D.; Pal, B. Interpolation of climate variables and temperature modeling. Theor. Appl. Climatol. 2012, 107, 35–45. [Google Scholar] [CrossRef]
  62. Zhang, G.L.; Dong, J.W.; Zhou, C.P.; Xu, X.L.; Wang, M.; Ouyang, H.; Xiao, X.M. Increasing cropping intensity in response to climate warming in Tibetan Plateau, China. Field Crops Res. 2013, 142, 36–46. [Google Scholar] [CrossRef]
  63. Li, J. Science of Farming System; Science Press: Beijing, China, 2016. (In Chinese) [Google Scholar]
  64. Wang, B.S. Plant Physiology, 3rd ed.; Science Press: Beijing, China, 2017. (In Chinese) [Google Scholar]
  65. Wei, T.Y.; Glomsrød, S.; Zhang, T.Y. Extreme weather, food security and the capacity to adapt—The case of crops in China. Food Secur. 2015. [Google Scholar] [CrossRef]
  66. Liu, S.L.; Pu, C.; Ren, Y.X.; Zhao, X.L.; Zhao, X.; Chen, F.; Xiao, X.P.; Zhang, H.L. Yield variation of double-rice in response to climate change in Southern China. Eur. J. Agron. 2016, 81, 161–168. [Google Scholar] [CrossRef]
  67. Huang, J.K.; Wang, Y.J.; Wang, J.X. Farmer’s adaptation to extreme weather events through farm management and its Impacts on the Mean and Risk of Rice Yield in China. Am. J. Agric. Econ. 2015, 97, 602–617. [Google Scholar] [CrossRef]
  68. Zhang, T.Y.; Yang, X.G.; Wang, H.S.; Li, Y.; Ye, Q. Climatic and technological ceilings for Chinese rice stagnation based on yield gaps and yield trend pattern analysis. Glob. Chang. Biol. 2014, 20, 1289–1298. [Google Scholar] [CrossRef]
  69. Yang, L.C.; Qin, Z.H.; Tu, L.L. Responses of rice yields in different rice-cropping systems to climate variables in the middle and lower reaches of the Yangtze River, China. Food Secur. 2015, 7, 951–963. [Google Scholar] [CrossRef]
  70. Lesk, C.; Rowhani, P.; Ramankutty, N. Influence of extreme weather disasters on global crop production. Nature 2016, 529, 84–87. [Google Scholar] [CrossRef] [PubMed]
  71. Wassmann, R.; Jagadish, S.V.K.; Sumfleth, K.; Pathak, H.; Howell, G.; Ismail, A.; Serraj, R.; Redona, E.; Singh, R.K.; Heuer, S. Regional vulnerability of climate change impacts on Asian rice production and scope for adaptation. Adv. Agron. 2009, 102, 91–133. [Google Scholar]
  72. Zhang, S.A.; Tao, F.L.; Zhang, Z. Changes in extreme temperatures and their impacts on rice yields in southern China from 1981 to 2009. Field Crops Res. 2016, 189, 43–50. [Google Scholar] [CrossRef] [Green Version]
  73. Li, Y.; Yang, X.G.; Dai, S.W.; Wang, W.F. Spatiotemporal change characteristics of agricultural climate resources in middle and lower reaches of Yangtze River. Chin. J. Appl. Ecol. 2010, 21, 2912–2921, (In Chinese with English abstract). [Google Scholar]
  74. Christian, K. Alpine plant life: Functional plant ecology of high mountain ecosystems. Mt. Res. Dev. 2003, 21. [Google Scholar] [CrossRef]
  75. Barry, R.G.; Chorley, R.J. Atmosphere, Weather and Climate, 5th ed.; Routledge: London, UK, 1987. [Google Scholar]
  76. Dierig, D.A.; Adam, N.R.; Mackey, B.E.; Dahlquist, G.H.; Coffelt, T.A. Temperature and elevation effects on plant growth, development, and seed production of two Lesquerella species. Ind. Crops Prod. 2006, 24, 17–25. [Google Scholar] [CrossRef]
  77. Cao, G.C.; Wu, D.B.; Li, J.X.; Zhang, C.Q.; Zhao, Z. Effect of latitude and altitude on the growth and development of Wheat. South Chin. J. Agric. Sci. 1993, 6, 1–11. (In Chinese) [Google Scholar]
  78. Xu, X.L.; Liu, L. Cropping rotation system data of China. Acta Geogr. Sin. 2014, 69, 144–148, (In Chinese with English abstract). [Google Scholar]
  79. Zhou, D.Y.; An, P.L.; Pan, Z.H.; Zhang, F.R. Arable land use intensity change in China from 1985 to 2005: Evidence from integrated cropping systems and agro economic analysis. J. Agric. Sci. 2012, 150, 179–190. [Google Scholar] [CrossRef]
  80. Grassini, P.; Eskridge, K.M.; Cassman, K.G. Distinguishing between yield advances and yield plateaus in historical crop production trends. Nat. Commun. 2013, 4, 2918. [Google Scholar] [CrossRef]
  81. Iizumi, T.; Ramankutty, N. How do weather and climate influence cropping area and intensity? Glob. Food Secur. 2015, 4, 46–50. [Google Scholar] [CrossRef] [Green Version]
  82. Rode, S. Effects of Urbanisation on Multiple Cropping Patterns in Coastal Districts of India; S. K. Somaiya College: Vidyavihar, India, 2011; pp. 4–15. [Google Scholar]
  83. Zheng, X.Y.; Xu, Z.G.; Ying, R.Y. Regional heterogeneity in the changes of grain production in the context of urbanization and structural adjustment in China. China Soft Sci. 2014, 11, 71–86, (In Chinese with English abstract). [Google Scholar]
  84. The National Development and Reform Commission (NDRC). Compilation of Cost and Income Data of National Agricultural Products; China Statistics Press: Beijing, China, 2015. (In Chinese) [Google Scholar]
  85. Shao, J.A.; Zhang, S.C.; Li, X.B. Farmland marginalization in the mountainous areas: Characteristics, influencing factors and policy implications. Acta Geogr. Sin. 2014, 69, 227–242, (In Chinese with English abstract). [Google Scholar] [CrossRef]
  86. Wang, X.B.; Yamauchi, F.; Huang, J.K.; Rozelle, S. What constrains mechanization in Chinese agriculture? Role of farm size and fragmentation. Chin. Econ. Rev. 2018. [Google Scholar] [CrossRef]
  87. Cooper, G.; McGechan, M.B.; Vinten, A.J.A. The influence of a changed climate on soil workability and available workdays in Scotland. J. Agric. Eng. Res. 1997, 68, 253–269. [Google Scholar] [CrossRef]
  88. Liang, S.M. Probing potentials of multiple cropping index in the selected Provinces in China. Issues Agric. Econ. 2007, 5, 85–90. (In Chinese) [Google Scholar]
  89. Deng, Z.Y.; Zhang, Q.; Pu, J.Y. The impact of climate warming on crop planting and production in northwestern China. Acta Ecol. Sin. 2008, 28, 3760–3768. [Google Scholar]
  90. Yang, H.; Li, X.B. Cultivated land and food supply in China. Land Use Policy 2000, 17, 73–88. [Google Scholar] [CrossRef]
Figure 1. Map location of the study site. The red outline is the distribution of Southern China.
Sustainability 11 01654 g001
Figure 2. Conceptual framework for assessing the spatial distribution of the realizable triple cropping system (RTCS). DEM, AAT0, and AAT10 are the abbreviations of digital elevation model, the annual accumulated temperature above 0 °C, and the annual accumulated temperature above 10 °C.
Sustainability 11 01654 g002
Figure 3. Changes in the spatial distribution map of the RTCS caused by topographic correction.
Sustainability 11 01654 g003
Figure 4. Changes in the spatial distribution maps of the RTCS caused by climate change from 1951 to 2010. (a) Spatial distribution map of stable and unstable RTCS between 1951 and 1980; (b) Spatial distribution map of stable and unstable RTCS between 1981 and 2010.
Sustainability 11 01654 g004
Figure 5. Spatial distribution map of the RTCS under climatic change. (a) Changes of boundary grid map of the RTCS under climate change; (b) Spatial distribution map of the RTCS under climatic change at the county level.
Sustainability 11 01654 g005
Figure 6. Spatial distribution maps of four triple cropping rotations in Southern China based on crop climatic-ecological suitability. (a) Spatial distribution map of winter wheat-early rice-late rice (WRR); (b) Spatial distribution map of rapeseed-early rice-late rice (RRR); (c) Spatial distribution map of sweet potato wheat-early rice-late rice (SRR); (d) Spatial distribution map of winter wheat/spring maize/sweet potato (WMS).
Sustainability 11 01654 g006aSustainability 11 01654 g006b
Figure 7. Spatial distribution map of the RTCS based on crop climatic-ecological suitability.
Sustainability 11 01654 g007
Figure 8. Spatial distribution map of the RTCS based on topographic correction, climate change and crop climatic-ecological suitability.
Sustainability 11 01654 g008
Table 1. Independence, normality, homoscedasticity and non-collinearity of MLR for each period.
Test IndicatorsPeriod of 1950–80Period of 1981–2010
AAT0AAT10PrecipitationAAT0AAT10Precipitation
IndependenceDurbin–Watson1.3841.3081.1651.1100.8630.981
NormalityStandard Deviation0.9980.9980.9920.9990.9990.999
HomoscedasticitySig.0.0000.0000.0000.0000.0000.000
Non-collinearityTolerance0.717 (J) 1, 0.987 (W) 2, 0.725 (H) 30.722 (J), 0.988 (W), 0.730 (H)0.649 (J), 0.972 (W), 0.694 (H)0.545 (J), 0.897 (W), 0.581 (H)0.545 (J), 0.897 (W), 0.581 (H)0.545 (J), 0.897 (W), 0.581 (H)
1,2,3 J, W, H are the abbreviations of longitude, latitude, and altitude.
Table 2. Evaluation thresholds of ecological suitability of each crop.
Crop TypeAAT0 (°C·d)AAT10 (°C·d)Precipitation (mm)Average Temperature During Growth Duration (°C)Temperature Thresholds of Seed Germination (°C)
PT 6MinT 7MaxT 8
Winter wheat1800–26001600–170025–310–531–37
Maize2000–3000500–1000≥1032–358–1040–45
Double rice≥4500>1000≥2030–3710–1240–42
Rapeseed2000–3000 (s) 4
1400–2500 (t) 5
20–253–535–37
Sweet potato2200–40001315–2530
4,5 s. and t. are abbreviations for sowing and transplanting of rapeseed, respectively; 6,7,8 PT, MinT, and MaxT are the abbreviations of optimum temperature, minimum temperature and maximum temperature during the seed germinations, respectively.
Table 3. Multivariate linear regression programming models between 1951 and 2010.
PeriodsIndicesRegression EquationRR2
1951–1980AAT0AAT0 = 12,580.414 − 9.578J *,9 − 181.545W * − 0.771H *0.9240.853
AAT10AAT10 = 123,580.625 − 11.525J * − 180.188W * − 0.835H *0.9160.839
PP = 1444.047 + 12.376J * − 56.199W * − 0.125H *0.9300.863
1981–2010AAT0AAT0 = 15,598.316 − 33.497J * − 178.781W * − 1.266H *0.9770.954
AAT10AAT10 = 15,331.076 − 35.081J * − 177.794W * − 1.346H *0.9560.914
PP = 1291.441 + 16.646J * − 66.165W * − 0.093H *0.8950.801
9 * Significant at the level of P = 0.001.
Table 4. Climatic resources and cropping rotation at three verification points.
Verification PointFeastureClimatic ResourcesGrowth Period of CropsSown Area in 1990 (ha)Cropping Rotations
AAT0AAT10PCropsStart and End Dates (Month/Ten Days)
(°C·d)(°C·d)(mm)
Yixiu DistrictThe lowest AAT0590254681417RapeseedOct./last-May/first 10— 14RRR
Early riceMay/first-Jul./middle
Late riceJul./last-Oct./last
WheatJul./last-Oct./middle 11WRR
Early riceNov./middle-May/middle
Late riceJul./last-Oct./last
Qiubei CountyThe lowest AAT10591354091050WheatNov./first-Apr./first 122166WMS
MaizeApr./middle-Aug./first17,873
Sweet potatoAug./last-Oct./last2646
Junlian CountyThe lowest P599455281027WheatNov./first-May/first 135713WMS
MaizeMay/first-Aug./middle10,240
Sweet potatoAug./middle-Nov./first1140
10 The growth duration of RRR in Yixiu District was obtained by reference to nearby meteorological observation stations (No. 58319 and No. 58417). 11 The growth duration of WRR in Yixiu District was obtained by reference to nearby meteorological observation stations (No. 58402). 12 The growth duration of crops in Qiubei County was obtained by reference to nearby meteorological observation station (No. 59007). 13 The growth duration of crops in Junlian County was obtained by reference to nearby meteorological observation stations (No. 56492 and No. 56493). 14 Due to lack of the actual sown area in Yixiu District, the sown areas of other counties in the same city are used as a substitute. The sown areas of winter wheat, rapeseed, early rice, and late rice in other eight counties in 1990 were 51,600 ha, 68,447 ha, 134,700 ha, and 142,080 ha.

