Article

Contribution and Driving Mechanism of N2O Emission Bursts in a Chinese Vegetable Greenhouse after Manure Application and Irrigation

1
College of Resources and Environmental Sciences, China Agricultural University, Beijing 100193, China
2
State Key Laboratory of Eco-hydraulics in Northwest Arid Region of China, Xi’an University of Technology, No. 5 Jinhuananlu, Xi’an 710048, Shaanxi, China
3
College of Agronomy, Anhui Agricultural University, Hefei 230036, China
4
Department of Soil Quality, Wageningen UR, 6700 AA Wageningen, The Netherlands
*
Author to whom correspondence should be addressed.
Sustainability 2019, 11(6), 1624; https://doi.org/10.3390/su11061624
Submission received: 19 February 2019 / Revised: 7 March 2019 / Accepted: 8 March 2019 / Published: 18 March 2019
(This article belongs to the Section Sustainable Agriculture)

Abstract

:
Solar greenhouse vegetable fields have been found to be hotspots of nitrous oxide (N2O) emissions in China, mainly due to excessive manure application and irrigation. Pulses of N2O emissions have been commonly reported by field monitoring works conducted in greenhouse fields, though their significance regarding total N2O emissions and the driving mechanism behind them remain poorly understood. N2O fluxes were monitored in situ using a static opaque chamber method in a typical greenhouse vegetable field. Then, laboratory incubations were conducted under different soil moisture and manure application gradients to monitor nitrous oxide emissions and related soil properties, using a robotized incubation system. Field monitoring showed that the occurrence of clear N2O emission bursts closely followed fertilization and irrigation events, accounting for 76.7% of the annual N2O efflux. The soil N2O flux increased exponentially with the water-filled pore space (WFPS), causing extremely high N2O emissions when the WFPS was higher than 60%. During the lab incubation, emission bursts led to N2O peaks within 40 h, synchronously changing with the transit soil NO2. An integrated analysis of the variations in the gas emission and soil properties indicated that the denitrification of transit NO2 accumulation was the major explanation for N2O emission bursts in the greenhouse filed. Nitrous oxide emission bursts constituted the major portion of the N2O emissions in the Chinese greenhouse soils. Nitrite (NO2) denitrification triggered by fertilization and irrigation was responsible for these N2O emission pulses. Our results clarified the significance and biogeochemical mechanisms of N2O burst emissions; this knowledge could help us to devise and enact sounder N2O mitigation measures, which would be conducive to sustainable development in vegetable greenhouse fields.

1. Introduction

Nitrous oxide (N2O) is a major greenhouse gas that also plays a primary role in stratospheric ozone depletion [1]. Agricultural soils contribute approximately 50% of the global anthropogenic N2O flux, primarily because of the application of synthetic nitrogen fertilizer and manure [2,3]. More than 30% of global N fertilizers are applied to Chinese agricultural soils, which constitute only approximately 10% of the world’s arable lands [4,5]. A recent estimate showed that Chinese agricultural soils emitted about 1.21 Tg yr−1 N2O-N in 2014, accounting for 31% of global N2O emissions [6]. Therefore, understanding the pattern and underlying mechanisms of N2O emission from agricultural soils is of great importance for estimating a sound N2O emission inventory in China, and for developing scientific mitigation strategies.
In China, solar greenhouses are widely distributed agricultural facilities for vegetable production, where excessive nitrogen fertilizers and irrigation water are commonly used to produce high yields [7]. Annual nitrogen application rates may range from 1000 to 3600 kg N ha−1 in these greenhouses [6,7,8,9,10,11]; chicken manure is the most commonly used fertilizer [12]. In addition, 800 to 1200 mm of water is irrigated per growing season [13], which is substantially is higher than the amount that used in other cropping systems [14]. Extreme N fertilizer application, along with frequent irrigation, has caused large N2O emissions from intensive agriculture [9,15,16], and has hindered the sustainable development of atmospheric environment. Nitrous oxide emitted from greenhouse vegetable soils was estimated at 12.2 Gg N2O-N yr−1, contributing 3.02–3.61% of the total emissions from Chinese croplands [7,17]. Meanwhile, the emission factors (EFs) of N2O in greenhouse soils ranged from approximately 1.1–1.43%, two to seven times higher than the EFs in neighboring cereal cropping systems [18,19,20]. Recent field monitoring has shown that large pulse N2O emissions were commonly observed closely following fertilization and irrigation events [7,15,18,21,22]. Song reported that such N2O emission bursts accounted for more than 50% of the annual N2O emissions from greenhouse soils [22]. Understanding the driving processes of N2O emission bursts is therefore crucial for reducing N2O emissions from Chinese vegetable greenhouses.
Fertilization and irrigation are considered external triggers of N2O emission bursts, but their operating mechanisms are not well understood [10,15]. Recently, transit nitrite accumulations have been proposed as a possible explanation for the explosive N2O emissions during the short period after the application of NH4+-based fertilizers [23,24,25]. Furthermore, a field measurement confirmed that nitrite accumulated to the maximum level within two days after manure application and irrigation [26]. These results imply that the reduction of intermediate nitrite, though nitrifier denitrification or heterotrophic denitrification, may be responsible for the N2O emission bursts. However, synchronous changes in N2O flux and related soil parameters during N2O emission bursts remain absent, preventing clarification of the contribution of nitrite denitrification to the short-term N2O emission pulse. Here, we simultaneously monitored the temporary variations in N2O fluxes and related soil properties in a greenhouse vegetable field and during a short-term laboratory soil incubation. The major objectives of this study were to: (1) quantify the contribution of burst pulses to annual N2O emissions from Chinese greenhouse vegetable fields; (2) analyze the synchronous changes between N2O emissions and the related soil parameters during the key period of N2O emission bursts; and (3) identify the driving process of N2O emission bursts after manure application and irrigation.

2. Materials and Methods

2.1. Experimental Site and Field Treatments

The experiment was conducted in a solar greenhouse at Shouguang vegetable research station (36°51′ N, 118°52′ E), in Shandong Province. This station was established by China Agricultural University in 2008. In the study area, the mean annual air temperature is 12.7 °C and mean annual precipitation is 550 mm. The greenhouse was constructed with thick clay walls and covered with polyethylene plastic film. The soil in the greenhouse is classified as Cambisol [27], with a silty clay texture. The soil pH was 8.02 (2.5:1 water to soil) in the surface layer (0–30 cm depth) when the experiment was initiated in 2008. The organic matter and alkaline N were 14.1 g kg−1 and 174 mg kg−1, respectively. Details of the experimental layouts are provided in the literature (Fan et al., 2014) [28]. Briefly, there were two growing seasons per year with continuous cropping of tomato: the winter-spring (WS) and the autumn-winter (AW) season. The WS season began in early February and ended in the middle of June, while the AW season started in early August and ended the following January. The summer fallow period (F) lasted less than two months. Conventional flooding irrigation with an over fertilization treatment (CFF) was selected in the vegetable greenhouse. The treatment had three replicates, with a plot size of 1.4 m × 10 m. Before tomato planting, chicken manure (215 kg N ha−1) was applied to the soil as a basal fertilizer. A compound fertilizer was also applied as a basal fertilizer at a rate of 339 kg N ha−1 per growing season. Within each season, soluble compound fertilizer was applied through topdressing. The total fertilization rates were 1248 and 740.9 kg N ha−1 for the AW and WS seasons, respectively. The irrigation timing was dependent on the soil water content and climate, with levels of 1519 and 1052 mm for the WS and AW seasons, respectively.

2.2. N2O Flux Measurement

The N2O fluxes were measured in situ from January 2013 to January 2014 using a static opaque chamber method. In each replicate plot, a rectangular stainless-steel frame (covering an area of 1.2 m × 0.6 m) was permanently embedded into the soil to a depth of 10 cm. An opaque chamber with a digital thermometer was mounted onto the frame, and the groove was filled with water to seal the chamber during the gas sampling. Rectangular chambers with three height gradients (i.e., 0.5, 1.0 or 1.5 m) were used during sampling, depending on tomato growth. To measure the N2O fluxes, five gas samples were collected from the chamber headspace, using a 60 mL gas-tight plastic syringe 0, 6, 12, 18, 24, and 30 min after chamber closure. The N2O fluxes were usually measured 2–4 times per week following the irrigation and fertilization events, and all the gas samples were taken between 08:30 and 11:00 local standard time. The nitrous oxide concentration in the gas samples was analyzed within 24 h after sampling using a gas chromatograph equipped with an electron capture detector (Agilent 7890A, Agilent Technologies, Palo Alto, CA, USA).
The N2O fluxes were calculated by using the following equation:
F = M × d c d t × P V A R T
where F is the gas flux (μg m−2 h−1), and M is the molar mass of N2O. The dc/dt variable (in ppbv min−1) represents the change rate of the N2O concentrations inside the chamber during the sampling period, and was calculated as the slope of the regression line between the N2O concentration and time [29]. A and V denote the surface area (in m2) and volume (in L) of the chamber, respectively. P, R and T are the actual atmospheric pressure (in atm), the universal gas constant (i.e., 0.0821 L atm K−1 mol−1) and the mean air temperature (K) inside the chamber during the gas sampling. The seasonal and annual N2O emissions were sequentially accumulated from the fluxes between every two adjacent sampling intervals during the monitoring period.
The soil water-filled pore space (WFPS) was calculated using the gravimetric water content (%), total soil porosity and soil bulk density [30]:
W F P S ( % ) = g r a v i m e t r i c   w a t e r   c o n t e n t   ( % ) t o t a l   s o i l   p o r o s i t y × s o i l   b u l k   d e n s i t y × 100
where total soil porosity = 1-soil bulk density/soil particle density. In this study, the soil particle density was assumed be 2.65 g cm−3 [31].

2.3. Gas Kinetics during the Aerobic Incubations

For further investigation of the effects of soil moisture and manure application on N2O emission bursts, we collected soil samples (0–20 cm) at the end of the field measurement. Fresh soil samples were sieved (2 mm mesh) to remove roots and other debris, and were then stored at 4 °C until use. The major properties of the soil used are summarized in Table 1. The chicken manure had a pH (H2O) of 7.80, a total N of 3.32% and a total C of 36.9%. Six treatments (four replicates for each) were included in the laboratory incubation, considering the manure application rates (i.e., fertilization and nonfertilization) and soil moisture levels (i.e., 65, 75 and 85% of the WFPS). For fertilization treatments, 0.2 g of dried chicken manure (CM) was mixed with the soil (56.44 g dry mass for each replicate). The mixtures were then transferred to 120 mL serum vials. Such a treatment corresponds to a fertilization level of 260 kg N ha−1 (M260), which is close to the fertilization convention of local farmers. For both the fertilization and non-fertilization treatments, different amounts of deionized water were added to each vial to achieve the targeted WFPS levels of 65%, 75% and 85%. Based on Equation (2), the soil WFPS was determined using the calculated values of soil bulk density (1.13 g cm−3) assuming a particle density of 2.65 g cm−3 [31].
The vials were then immediately sealed with a bromobutyl stopper and screw cap (Macherey-Nagel, Germany). All the vials were flushed using an oxygen-helium gas mixture (21% O2, v/v) through 8 vacuuming-replenishing cycles to remove the N2. Finally, the vials were filled into 21% O2 and kept under overpressure for 3 min. The pressure in the headspace was then equilibrated with atmospheric pressure, using a syringe filled with deionized water. All the flushed vials were transferred to a robotized incubation-monitoring system to conduct an aerobic soil incubation for 7 days at 20 °C. To maintain the aerobic conditions, pure O2 (99.99%) was injected into the vials when the O2 concentration in the headspace was less than 10% (v/v) during the incubation period.
The gases (N2O, CO2, and O2) in the vial headspace were continuously monitored using the incubation-monitoring system, at a sampling interval of 8 h. Details of this system have been described in the literature, e.g., Molstad et al., 2007; Qu et al., 2014; Wang et al., 2017 [32,33,34]. Briefly, a gas sample in the headspace gas was automatically sampled and transported by a peristaltic pump (Gilson Model 222, Gilson, France) connected to an Agilent 7890A GC equipped with an electron capture detector and a thermal conductivity detector. The sampling and analysis were controlled by a custom-made Python computer program. To maintain constant pressure inside the vials, an equal volume of ultrapure helium (He, 99.999%) was automatically injected back into the vials after each sampling. The N2O and CO2 production rates were calculated based on their concentration changes in the headspace for each time increment between two the samplings [32]. All the reported measurements and calculations in this study were based on dry soil mass.

2.4. Statistical Analysis

One-way analysis of variance (one-way ANOVA) with a general linear model was used to determine the effect of the chicken manure application and WFPS. Statistical significance was denoted at the level of p < 0.05, unless otherwise noted. The statistical analysis was conducted using the IBM SPSS statistical package (SPSS Inc., New Orchard Road, Armonk, NY, USA). Redundancy analysis (RDA) and correlation analysis were used to investigate the relationships between the soil properties and the gaseous parameters (e.g., N2O, CO2 production rate, etc.). All the figures were made using SigmaPlot 12.5 software (Systat Software Inc., San Jose, CA, USA). The values in the figures and tables are presented in the sequence of the treatment means ± standard error.

3. Results

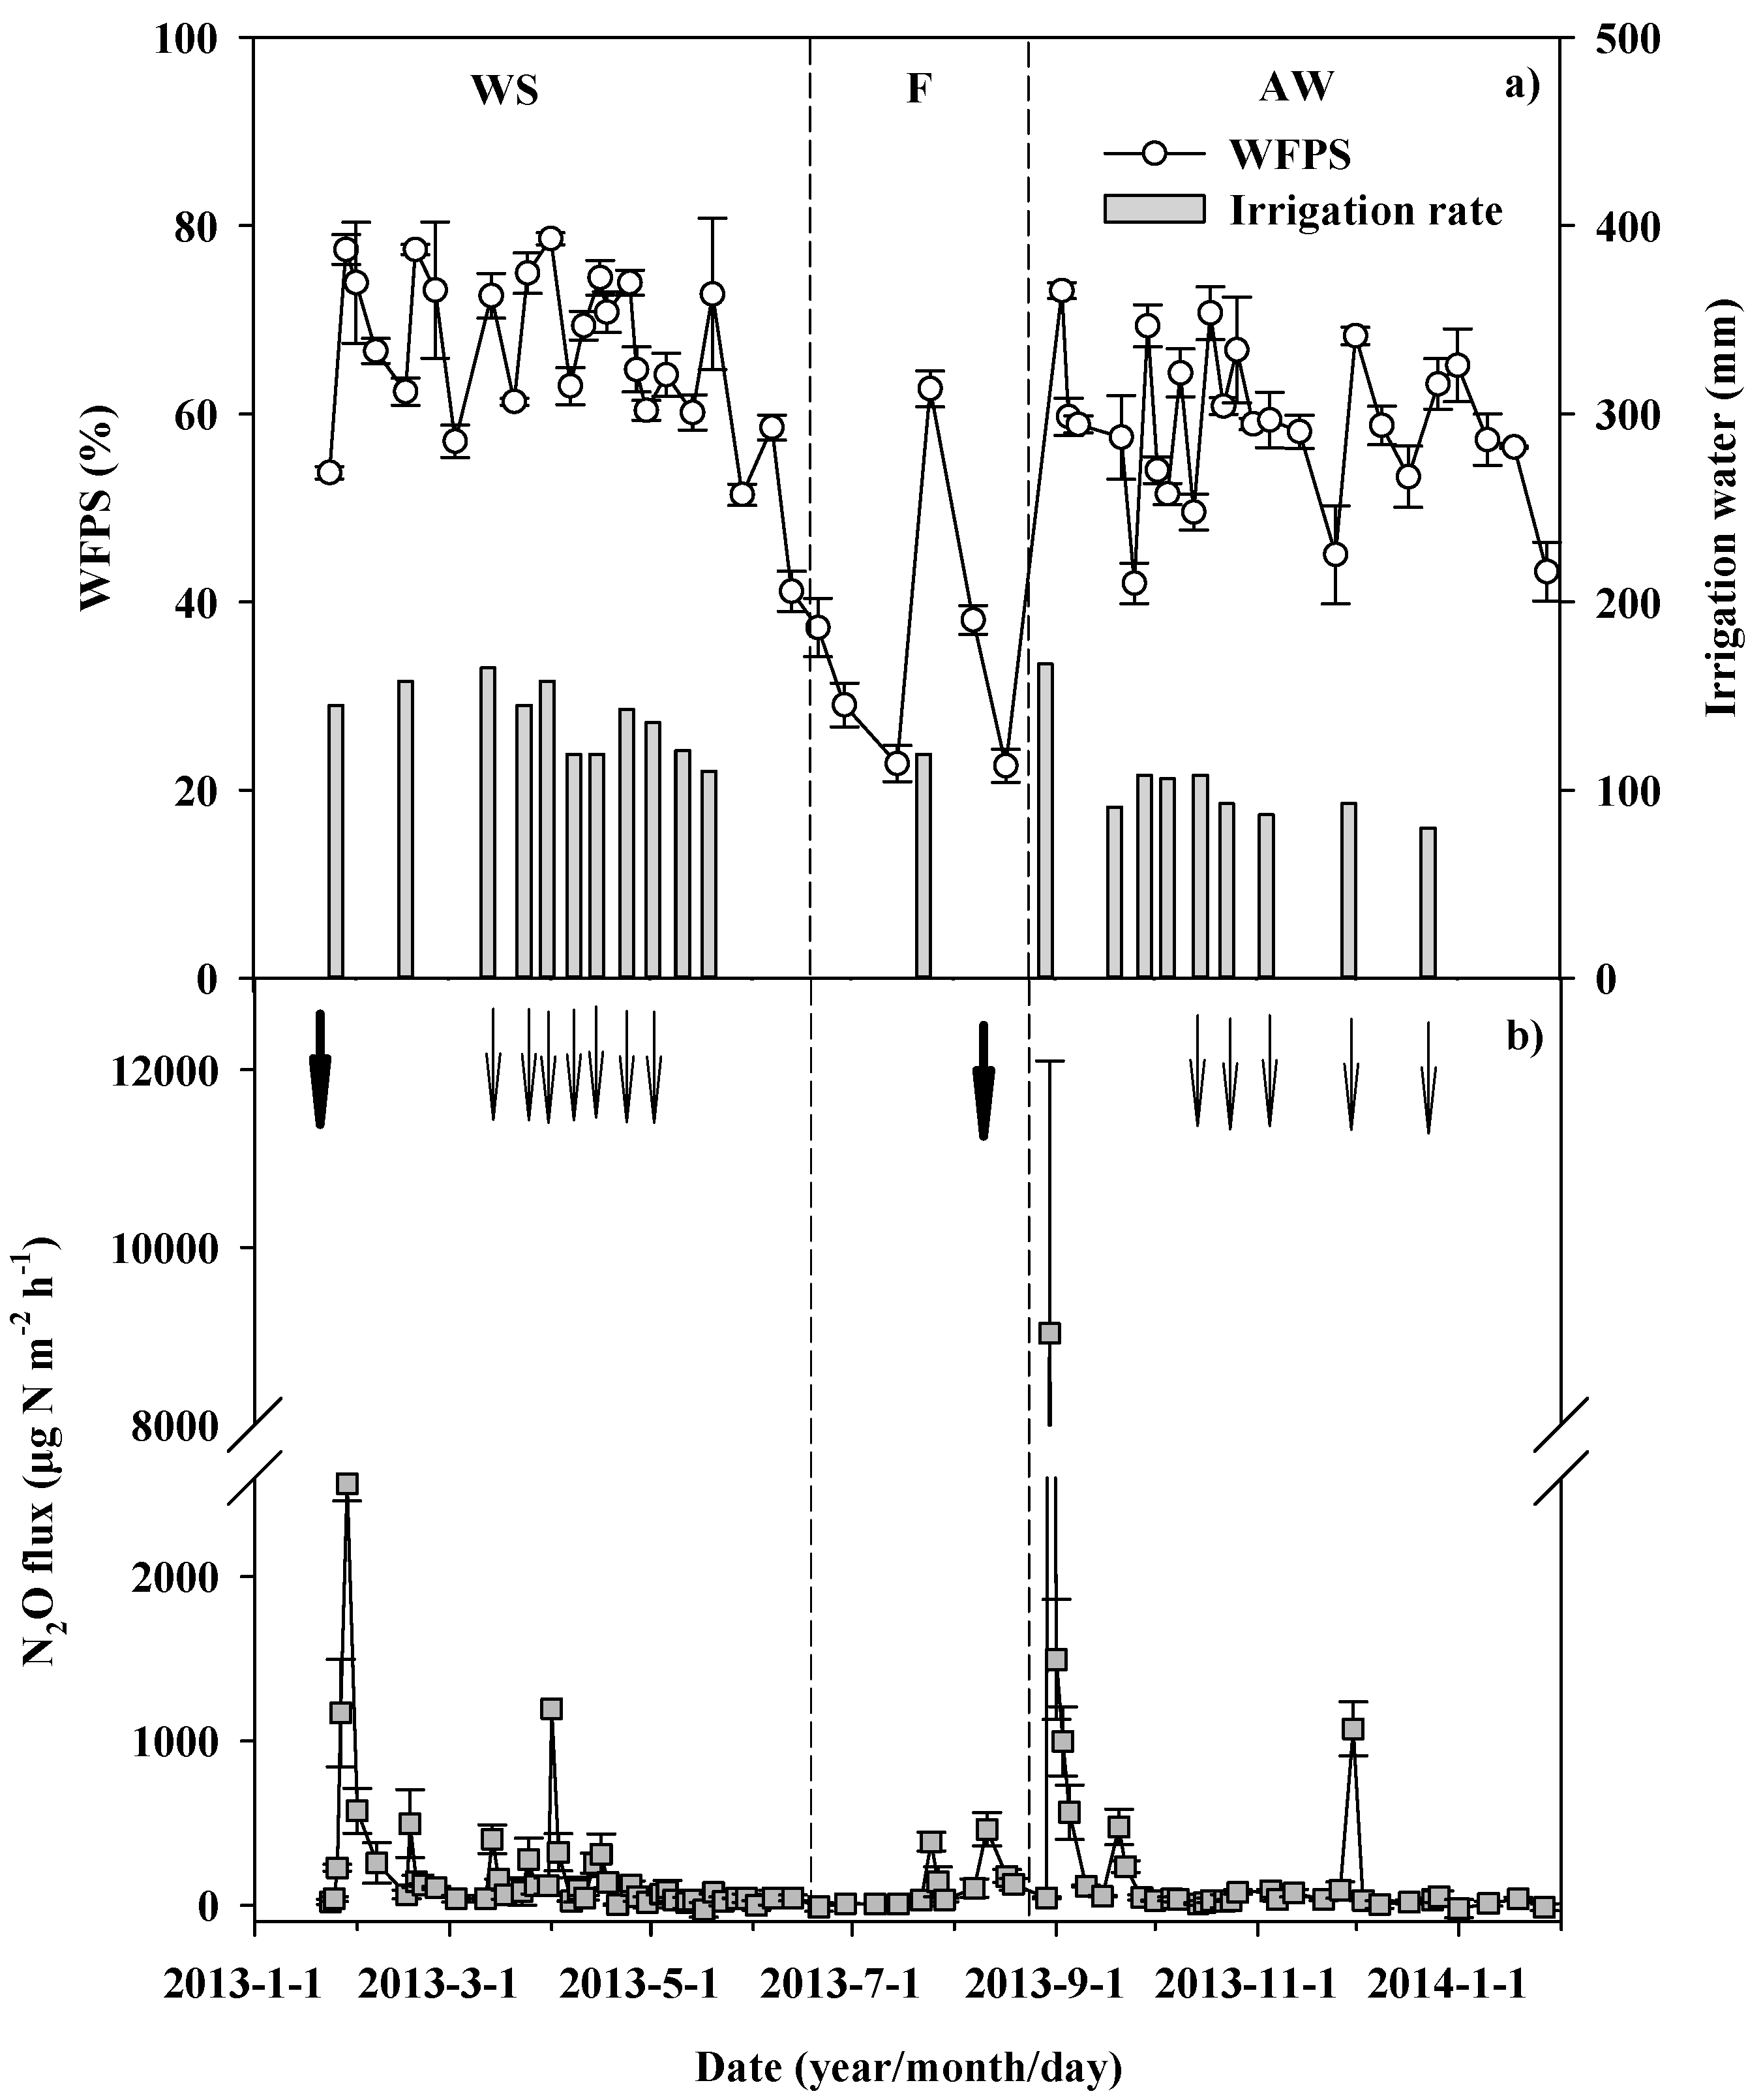
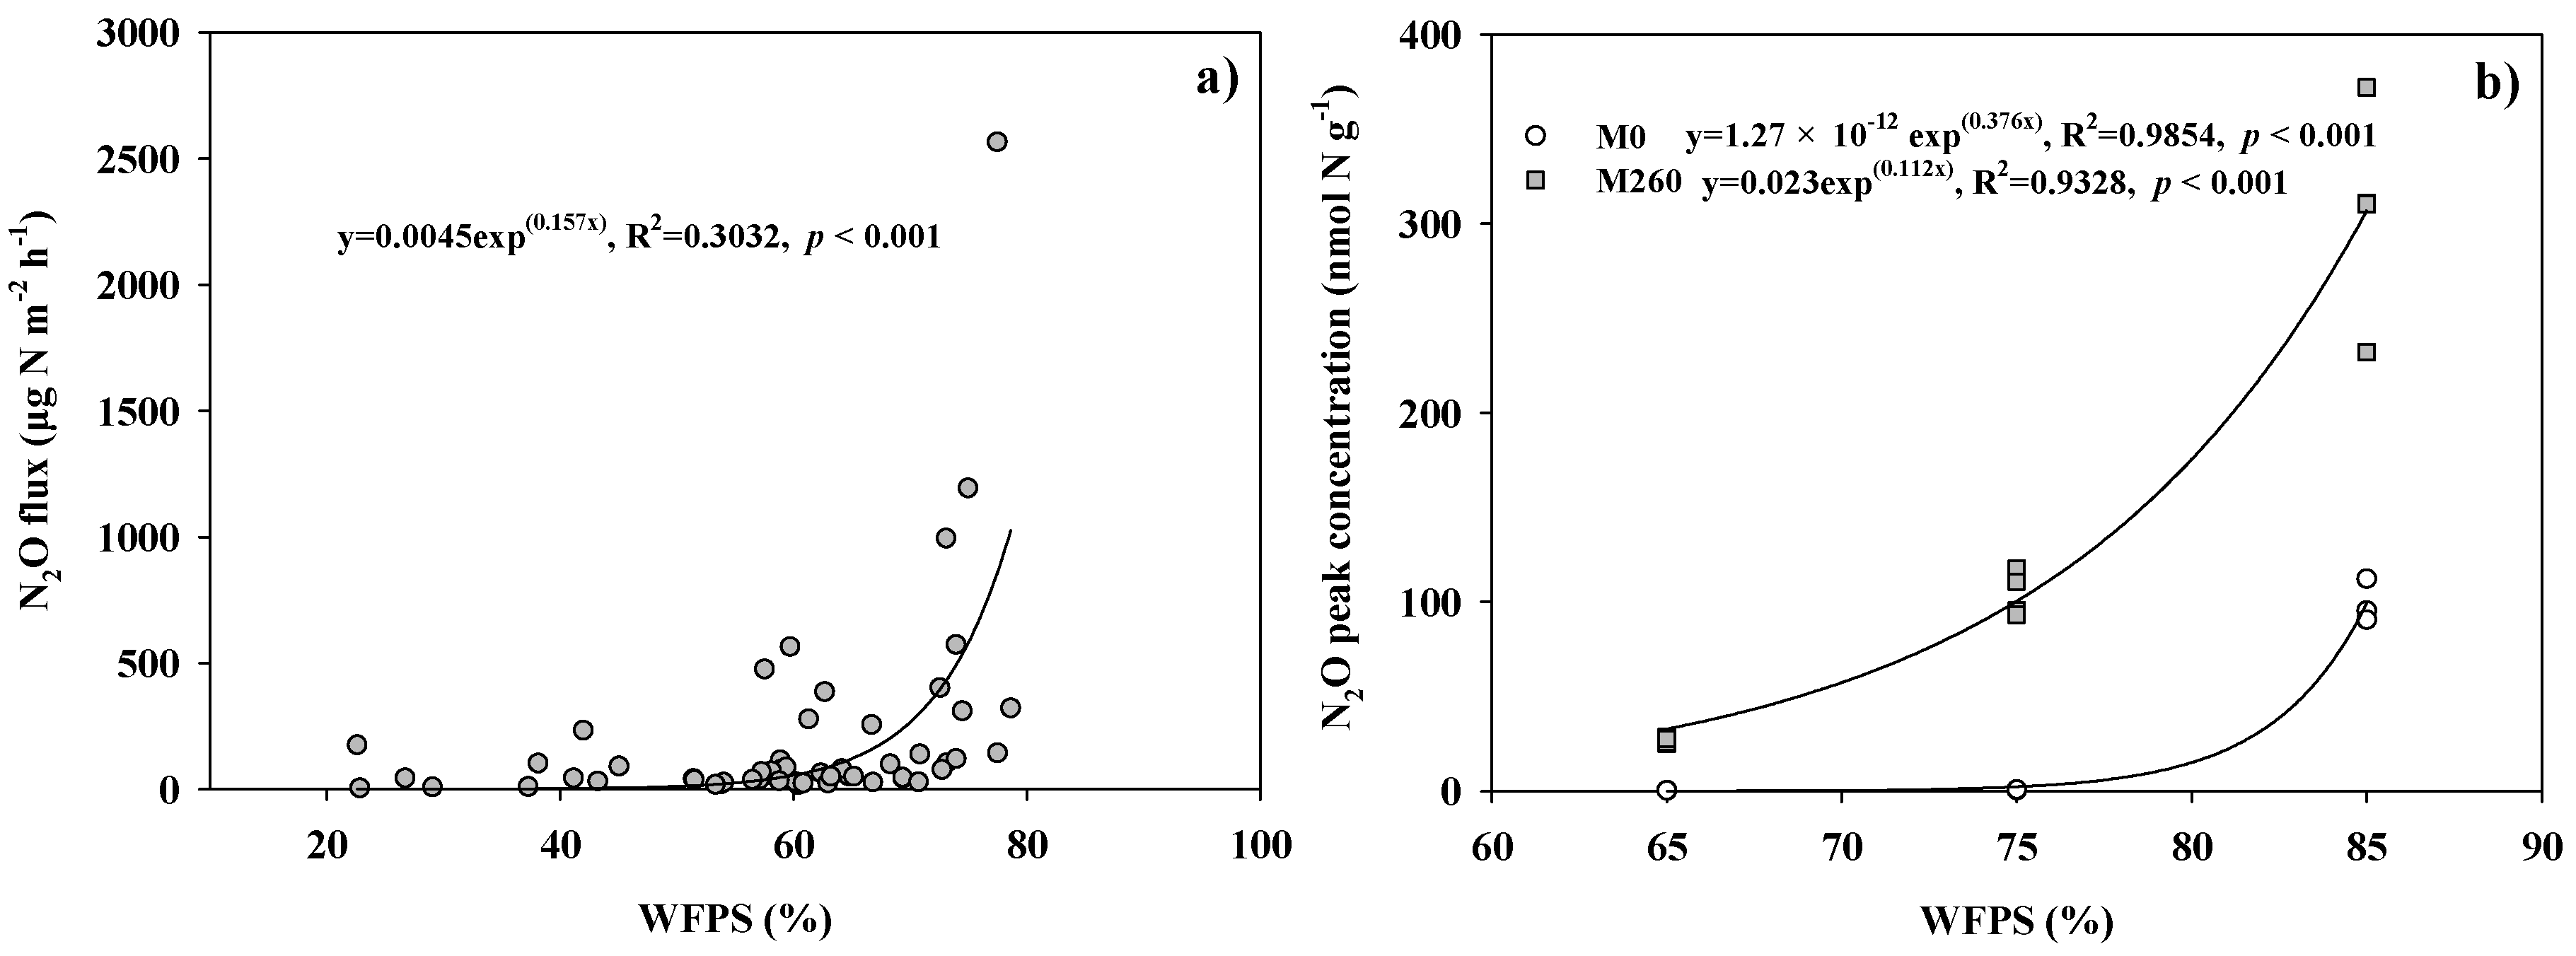
3.1. Soil Moisture and N2O Flux during Field Observation

As shown in Figure 1a, the WFPS varied substantially with the rate and frequency of irrigation, and reached a peak following each irrigation event. The average irrigation rate was higher in the WS season than in the AW season, leading to significantly lower (p < 0.01) WFPS during AW season. The soil WFPS in the AS season fluctuated between 41.1% and 78.6%, with an average of 64.6%. Then, the WFPS declined to a lower level of ca. 30% during the fallow period, except for an irrigation-induced peak. From the beginning of the AW season, frequent irrigation increased the soil moisture to a WFPS range of 42.0–75.8%, with an average value of 60.4%.
The nitrous oxide efflux generally ranged between 2.51 and 9032 μg N m−2 h−1 over the observation period, with exceptions during several emission pulses (Figure 1b). In the WS season, the first emission burst occurred within the first 7 days after the chicken manure application followed by flooding irrigation, and reached a peak flux of 2567 μg N m−2 h−1. The second pulse in the WS season was observed on 17 February 2013, with a maximum flux of 485.7 μg N m−2 h−1. The nitrous oxide efflux reached a peak of 9033 μg N m−2 h−1 on the second day after the first irrigation in the AW season. Then, the efflux remained nearly constant until the second emission burst on 22 September 2013. These results indicate that the soil N2O emission peaks were likely triggered by high loadings of manure and irrigation during the short period. The total N2O emissions were 5.32, 7.36 and 14.1 kg N ha−1, for the AS and AW seasons and the observation year, respectively. The emission bursts accounted for 74.9%, 89.2% and 76.7% of the total N2O emissions during the corresponding periods. Therefore, the manure and irrigation-induced emission bursts were the major contributors to the N2O fluxes from the greenhouse field.

3.2. N2O and Mineral N Concentration during the Aerobic Incubation

The dynamic change in the N2O concentration in the vial headspace is presented in Figure 2a. In the M0 treatments (i.e., without manure addition), the maximum N2O amounts in the headspace were lower than 0.66 nmol N g−1 under the moisture gradients of 65% and 75% WFPS (i.e., 65%-M0 and 75%-M0). The nitrous oxide levels under 85% WFPS (i.e., 85%-M0) were significantly higher than those under 65% and 75% WFPS, with a peak value of 99.4 nmol N g−1 at 72 h after the beginning of the incubation (Figure 2a). This suggests that an increased WFPS significantly promotes the N2O emissions from greenhouse vegetable fields, even without additional N fertilization. Nitrous oxide levels in the M260 treatments were significantly higher (p < 0.05) than those in the M0 treatments under the corresponding soil moisture. Their N2O levels increased with the WFPS, with peak concentrations of 26.6, 104.3 and 306.4 nmol N g−1 soil, under 65%, 75% and 85% WFPS, respectively. Moreover, the N2O emission bursts temporarily lagged with the WFPS decline, reaching the maximum concentrations at 64, 56 and 40 h after the beginning of the incubation. In summary, both the manure application and irrigation contributed to the N2O emission bursts during incubation, which is consistent with the results of the field monitoring.
The soil NH4+ reached the maximum concentration at 16 h after the beginning of the incubation, with an average of 2.76 and 19.5 mg N kg−1, in the M0 and M260 treatments, respectively (Figure 2b). This means that chicken manure contributed significantly to the soil ammonium. Then, the NH4+ level in all the treatments declined gradually throughout the incubation, with a decreasing rate of 3.91 ± 0.17 mg N kg−1 day−1 in the M260 treatment. As shown in Figure 2c, the soil NO2 reached the peak concentrations at 40 h, followed by rapid declines to 0.18 ± 0.07 mg N kg−1. The nitrite concentrations in the M260 treatments were significantly higher than those in the M0 treatments, suggesting that the manure application caused these NO2 accumulations. Moreover, the synchronous changes in the NO2 and N2O concentrations supported the contribution of the NO2 reduction to N2O emission. In contrast, with NH4+ and NO2, NO3 did not show clear changes throughout the incubation (Figure 2d). Furthermore, there was no significant difference in the NO3 concentration between the M0 and M260 treatments. This may be attributed to the high initial NO3 concentration (ca. 43.1 mg N kg−1) and the small contribution from chicken manure.

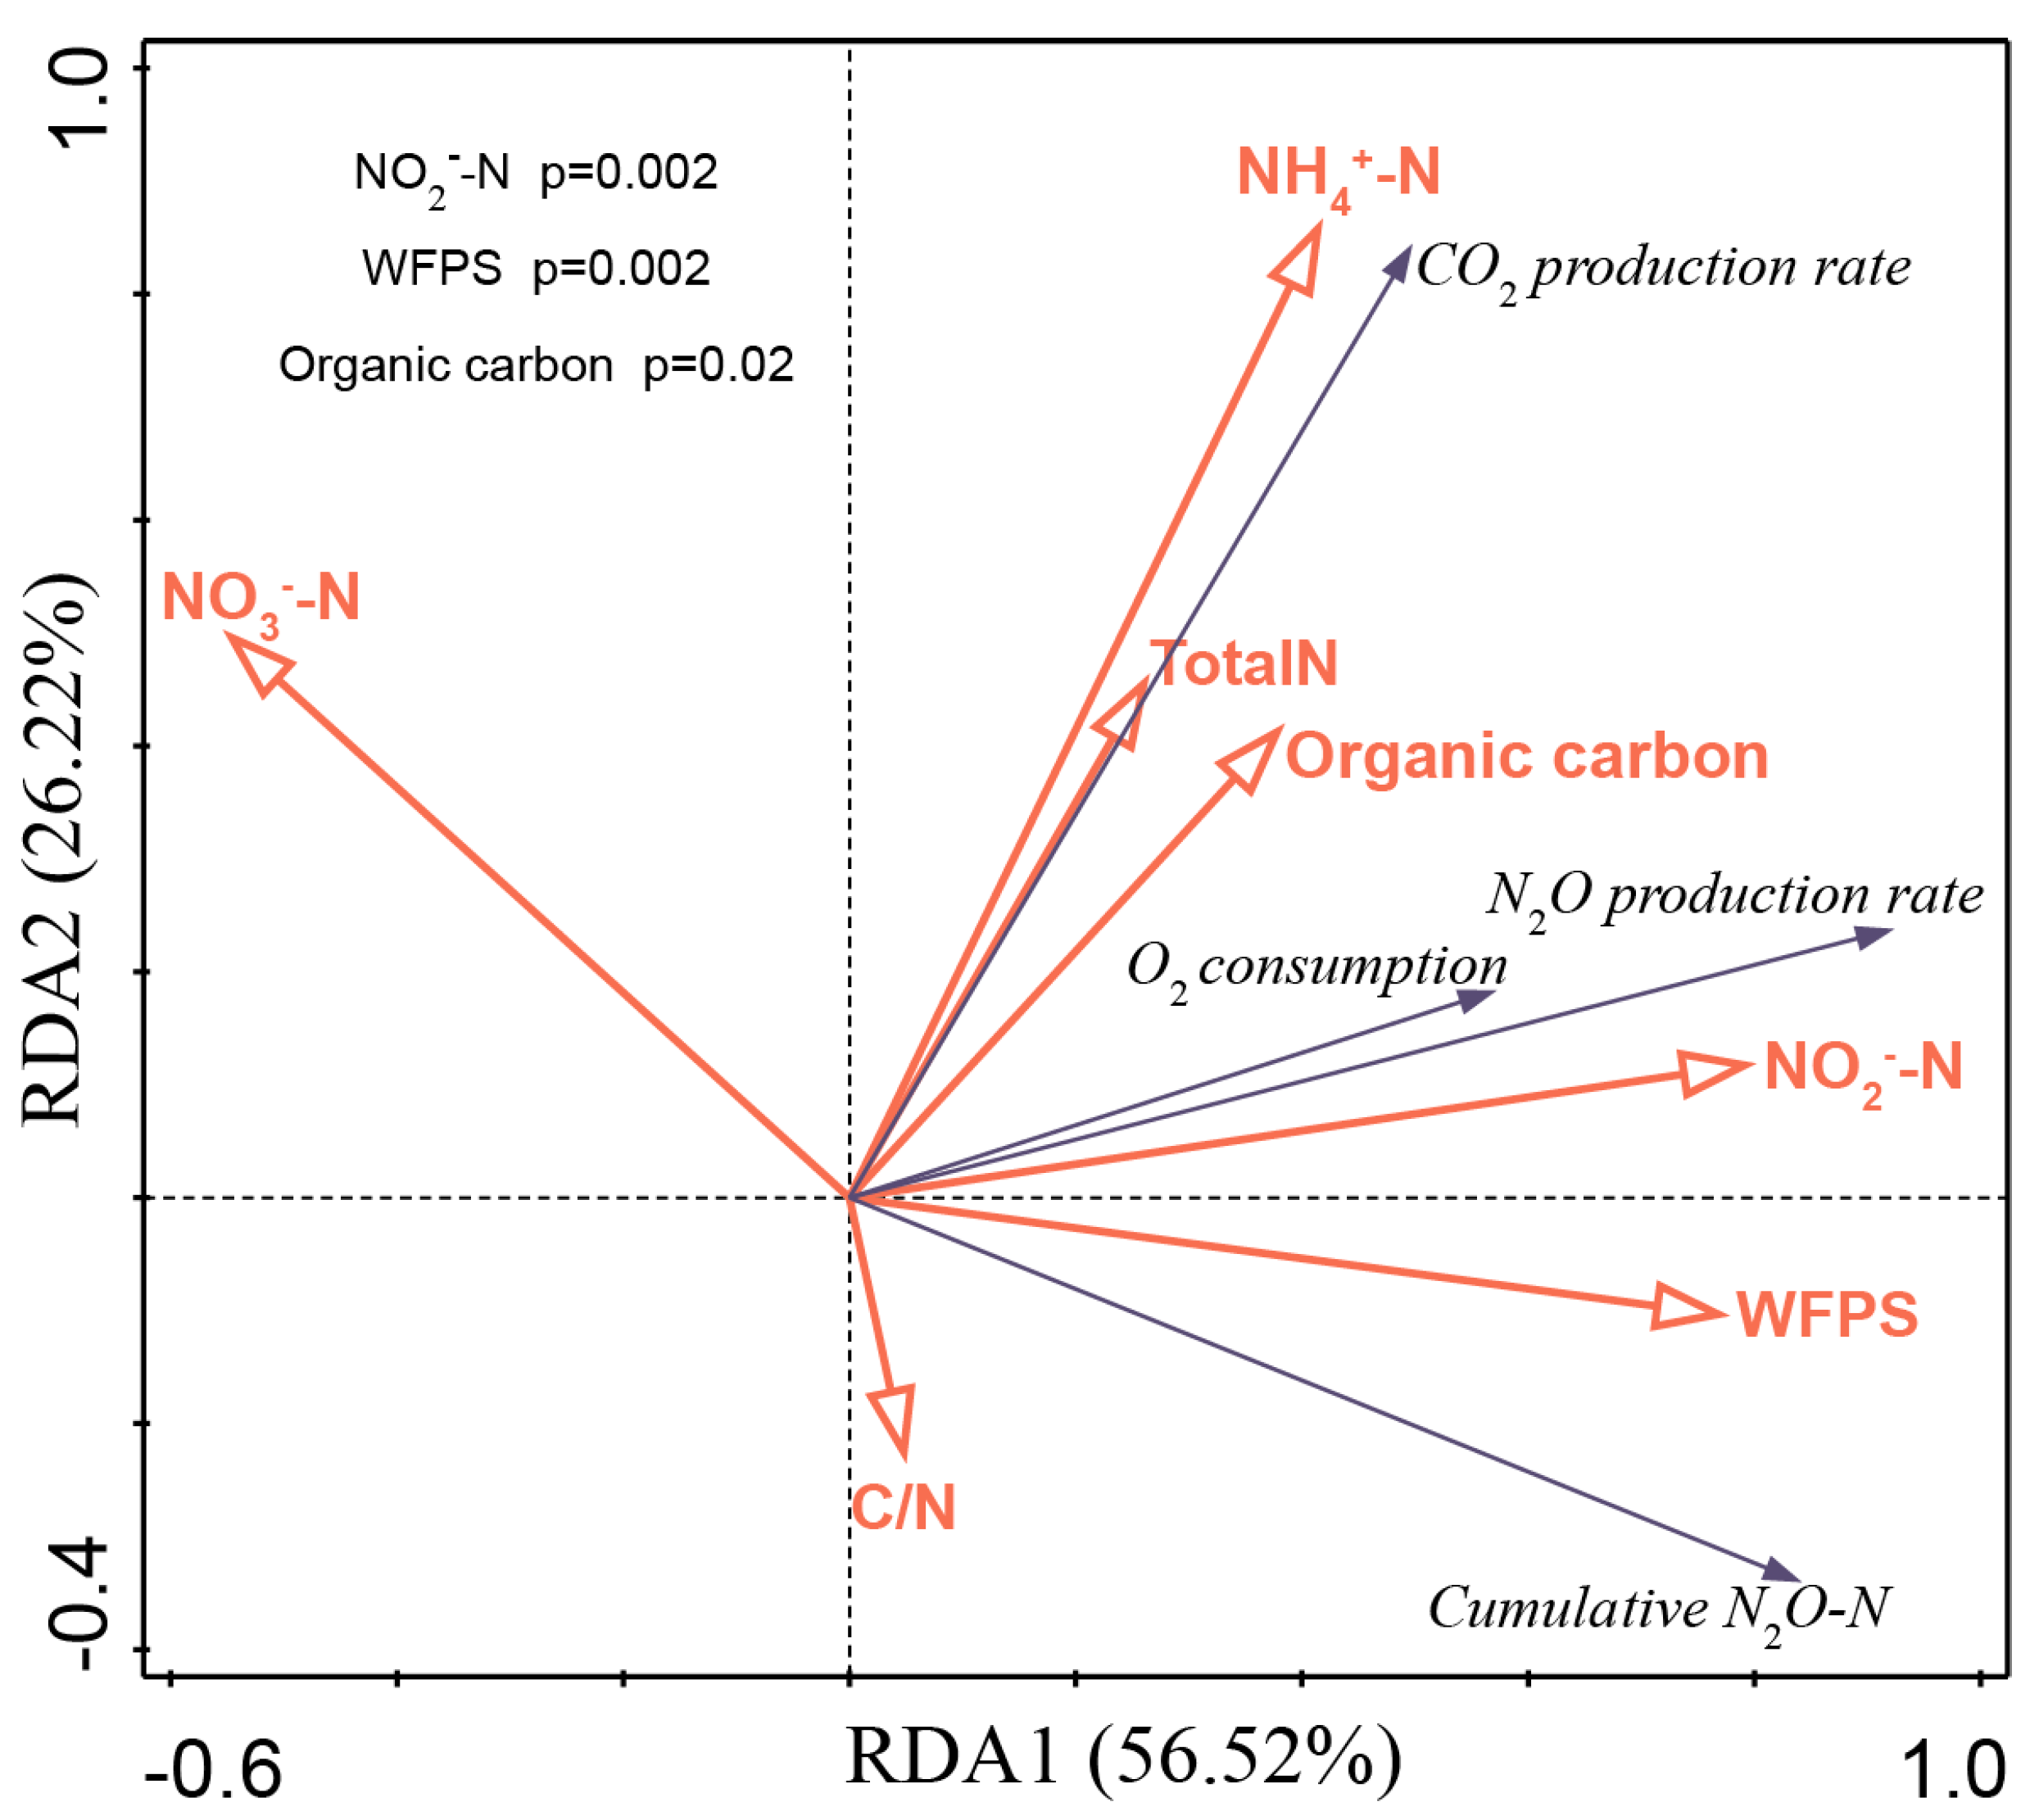
3.3. Integrated Relationships Between the Gas Emissions and the Soil Properties

We used redundancy analysis (RDA) to assess the integrated relationships between the gas emissions and the soil properties (Figure 3). The first two ordination axes explained 82.7% of the variances in the gas emissions (F = 16.7, p = 0.002). The nitrite concentration, WFPS, and soil organic C had strong positive loadings along the first ordination axis (i.e., RDA1), which is interpreted to mainly present the reduction of NO2-N, by organic matter under high WFPS (i.e., denitrification process). RDA1 explained 56.5% of the variation in the gas emissions, meaning that NO2 accumulation and subsequent denitrification were the major contributors to the N2O emission bursts during the incubation. Correlation analysis showed that the soil N2O emissions were significantly (p < 0.01) influenced by NO2-N, soil organic C and WFPS. Furthermore, this deduction was also supported by the results of Monte Carlo permutation tests showing that the variations in the gas emissions were significantly correlated (p < 0.01) with the NO2-N, organic C, and WFPS. Ammonium, organic carbon and total nitrogen positively loaded on the second ordination RDA axis (RDA2), while the C/N ratio was negatively correlated with RDA2. Thus, RDA2 mainly reflects the mineralization of organic nitrogen to NH4+. Meanwhile, the NO3, CO2 production rate and O2 consumption also have positive loadings on RDA2, meaning that it also brings the information of oxidation reactions organic carbon and NH4+. The lower variation (i.e., 26.2% in Figure 3) suggested that these mineralization and oxidation processes were not the major contributors to N2O emissions.

4. Discussion

4.1. Significance of the Bursts in N2O Emissions

Our results clarified the significance of N2O burst emissions in the greenhouse vegetable field, which were driven by extreme manure and water loadings. During the field observation, fifteen N2O bursts lasting 72 days contributed 76.7% to the annual emissions, with an average flux 17.3 times higher than that during the non-burst period (Figure 1b). During the lab incubation, the chicken manure application trigged rapid N2O accumulation, reaching N2O peak concentrations within 40 h after the beginning of the incubation (Figure 2a). Further, ANOVA showed that both the manure application and the WFPS accounted for the N2O bursts in the M260 treatments (Table 2). These findings are comparable with the results of previous studies conducted in intensively-managed Chinese greenhouse vegetable fields. For example, He et al. reported that rapid N2O emissions, within the first 38 days after tomato transplanting, accounted for 57–84% of the seasonal total [15]. Hou et al. observed that pulse emissions, during the period of tomato blooming and fruit setting, accounted for 86.1% of the N2O emissions during whole growth period [35]. Similarly, Xu et al. reported that the majority of N2O emissions (67.4–75.2%) occurred in the first 20 days after manure application and flooding irrigation [36].

4.2. Contribution of Denitrification to the N2O Emission Bursts

An integrated analysis of the results in our incubation showed that NO2, organic carbon and WFPS jointly accelerated the emission of N2O (Figure 3). This is consistent with the denitrification process in reaction stoichiometry, i.e., NO2 reduction to N2O by organic carbon under reducing ambient conditions. In the M260 treatments, the NO2 increased to transitory maximums within 40 h after the beginning of the incubation (Figure 2c). A transient NO2 accumulation (ranging from 1.82 to 13.9 mg NO2-N kg−1) was observed in situ on day 2 after the manure application and irrigation in the greenhouse soils [26]. Similarly, Chen et al. also reported that NO2 accumulated in greenhouse soils under different oxygen concentrations during a laboratory incubation [37]. This could be responsible for the synchronous N2O emission bursts (see Figure 2a), due to the rapid NO2 reduction under circumneutral and alkaline conditions [38]. Another prerequisite of nitrite denitrification is the lower oxidation-reduction potential that can be achieved by irrigation. Conceptually, nitrification is favored within the WFPS range of 30–60%, while WFPSs higher than ca. 60% are more conducive to denitrification processes [39,40,41]. As shown in Figure 4a, the field N2O flux increased substantially when WFPS was higher than 60%. Furthermore, the soil moisture content exponentially increased the N2O bursts in our incubation within the WFPS range of 65–85% (Figure 4b). These results agree with previous studies that attributed irrigation induced N2O pulses to denitrification processes [42,43,44,45,46]. Finally, studies in molecular biology showed that N2O emission bursts after flooding events were observed concurrently with increases in denitrifier activities. Uchida et al. reported that the mRNA levels of the denitrification genes (nirK, nirS, and nosZ) increased within a few hours after water logging, with synchronous increases in N2O emission [47]. Riya et al. observed increases in both nirK mRNA transcription and N2O emission after water flooding [48]. In summary, it is reasonable to argue that the N2O emission bursts observed in our study were mainly due to nitrite denitrification triggered by manure application and flooding irrigation.

4.3. Implications for N2O Mitigation

Our results show that nitrite denitrification triggered by fertilization and irrigation is the process responsible for N2O emission bursts from Chinese greenhouse soils. These findings may help us to develop more effective N2O emission mitigation strategies. First, optimizing the fertilization rate, especially the manure application rate, may be a straightforward measure, by reducing the substrates of the denitrification process. The effectiveness of this option for N2O mitigation has been demonstrated by several field experiments conducted in Chinese vegetable greenhouses [20,49,50]. Second, improvements in irrigation management also showed considerable potential for reducing N2O emissions. A value of 60% WFPS is widely recognized as the threshold of strongly increased N2O emissions from soils [42,45,51,52]. This implies that maintaining soil moisture at a higher level than this critical WFPS level, by adopting reasonable water management strategies may significantly depress denitrification and thus N2O production [53,54,55,56,57,58]. Ye et al. found that drip irrigation decreased N2O emissions by approximately 50% in greenhouse fields [58]. Third, avoiding simultaneous fertilization (e.g., manure-N and/or chemical-N) and irrigation may also be used as a promising strategy for decreasing N2O emission in Chinese greenhouse vegetable fields. Based on our results, this measure could limit nitrite denitrification, and thereby decrease N2O emission bursts.

5. Conclusions

Excessive manure and irrigation loadings caused concurrent N2O emission pulses that contributed 76.7% to the annual N2O emissions in the investigated vegetable greenhouse. The nitrous oxide concentration changed synchronously with the soil NO2 during the experimental incubation and increased exponentially with the soil WFPS under both field and laboratory conditions. The statistical analysis of the gas emission and soil properties indicated that nitrite denitrification under high WFPS was the major driving process for the observed N2O emission bursts. Therefore, significant N2O emission mitigation could be achieved in solar greenhouse vegetable fields through optimized water and N management. In this case, decreasing the manure application rate, drip irrigation and asynchronous manure and water inputs can be used as promising measures to reduce the transit denitrification process, and therefore, N2O emissions. Future studies should focus on screening these measures intended to reduce N2O emissions from greenhouses.

Author Contributions

J.W., J.G. and S.L. (Shan Lin) designed the experiments. W.C., S.L. (Su Liu), Z.Q. and H.S. carried out the experiments and performed the analyses. W.C., J.G., H.S., J.W., Q.W., Q.C. and S.L. (Shan Lin) substantially contributed to interpreting the results and writing the paper.

Funding

National Natural Science Foundation of China: 41230856.

Acknowledgments

This research was financially supported by the National Natural Science Foundation of China (41230856). We would like to thank Lars Molstad for designing and programming our robotized incubation system for analyzing gas emission kinetics.

Conflicts of Interest

The authors declare no conflict of interest.

References

  1. Dickinson, R.E.; Cicerone, R.J. Future global warming from atmospheric trace gases. Nature 1986, 319, 109–115. [Google Scholar] [CrossRef] [Green Version]
  2. Reay, D.S.; Davidson, E.A.; Smith, K.A.; Smith, P.; Melillo, J.M.; Dentener, F.; Crutzen, P.J. Global agriculture and nitrous oxide emissions. Nat. Clim. Chang. 2012, 2, 410–416. [Google Scholar] [CrossRef]
  3. Shcherbak, I.; Millar, N.; Robertson, G.P. Global metaanalysis of the nonlinear response of soil nitrous oxide (N2O) emissions to fertilizer nitrogen. Proc. Natl. Acad. Sci. USA 2014, 111, 9199–9204. [Google Scholar] [CrossRef] [PubMed]
  4. Zhang, W.; Ma, L.; Huang, G.; Wu, L.; Chen, X.; Zhang, F. The Development and Contribution of Nitrogenous Fertilizer in China and Challenges Faced by the Country. Sci. Agric. Sin. 2013, 46, 3161–3171. (In Chinese) [Google Scholar]
  5. Heffer., P.; Prud’homme, M. Global nitrogen fertilizer demand and supply: Trend, current level and outlook. In Proceedings of the International Nitrogen Initiative Conference, Melbourne, Australia, 4–8 December 2016. [Google Scholar]
  6. Food and Agriculture Organization. FAOSTAT Database Collections; FAO: Rome, Italy, 2015; Available online: http://www.apps.fao.org (accessed on 28 February 2018).
  7. Liu, Q.; Qin, Y.; Zou, J.; Guo, Y.; Gao, Z. Annual nitrous oxide emissions from open-air and greenhouse vegetable cropping systems in China. Plant Soil 2013, 370, 223–233. [Google Scholar] [CrossRef]
  8. Zhu, J.; Li, X.; Christie, P.; Li, J. Environmental implications of low nitrogen use efficiency in excessively fertilized hot pepper (Capsicum frutescens L.) cropping systems. Agric. Ecosyst. Environ. 2005, 111, 70–80. [Google Scholar] [CrossRef]
  9. Xiong, Z.; Xie, Y.; Xing, G.; Zhu, Z.; Butenhoff, C. Measurements of nitrous oxide emissions from vegetable production in China. Atmos. Environ. 2006, 40, 2225–2234. [Google Scholar] [CrossRef]
  10. Ju, X.; Kou, C.; Zhang, F.; Christie, P. Nitrogen balance and groundwater nitrate contamination: Comparison among three intensive cropping systems on the North China Plain. Environ. Pollut. 2006, 143, 117–125. [Google Scholar] [CrossRef] [Green Version]
  11. Song, H.; Guo, J.; Ren, T.; Chen, Q.; Li, B.; Wang, J. Increase of soil pH in a solar greenhouse vegetable production system. Soil Sci. Soc. Am. J. 2012, 76, 2074–2082. [Google Scholar] [CrossRef]
  12. Guo, J.H. Inputs of Irrigation Water, Fertilizers, Pesticides and Life Cycle Assessment of Environmental Impacts from Typica Greenhouse Vegetable Production Systems in China. Ph.D. Thesis, China Agricultural University, Beijing, China, 2016. (In Chinese with English Abstract). [Google Scholar]
  13. Sun, Y.; Hu, K.; Zhang, K.; Jiang, L.; Xu, Y. Simulation of nitrogen fate for greenhouse cucumber grown under different water and fertilizer management using the EU-Rotate_N model. Agric. Water Manag. 2012, 112, 21–32. [Google Scholar] [CrossRef]
  14. Huang, J.; Zhang, H.; Tong, W.; Chen, F. The impact of local crops consumption on the water resources in Beijing. J. Clean. Prod. 2012, 21, 45–50. [Google Scholar] [CrossRef]
  15. He, F.; Jiang, R.; Chen, Q.; Zhang, F.; Su, F. Nitrous oxide emissions from an intensively managed greenhouse vegetable cropping system in Northern China. Environ. Pollut. 2009, 157, 1666–1672. [Google Scholar] [CrossRef] [PubMed]
  16. Ju, X.; Xing, G.; Chen, X.; Zhang, S.; Zhang, L.; Liu, X.; Cui, Z.; Yin, B.; Christie, P.; Zhu, Z.; et al. Reducing environmental risk by improving N management in intensive Chinese agricultural systems. Proc. Natl. Acad. Sci. USA 2009, 106, 3041–3046. [Google Scholar] [CrossRef] [Green Version]
  17. Chinese Statistical Bureau. China Statistical Year Book; Chinese Statistical Bureau: Beijing, China, 2012.
  18. Yao, Z.; Liu, C.; Dong, H.; Wang, R.; Zheng, X. Annual nitric and nitrous oxide fluxes from Chinese subtropical plastic greenhouse and conventional vegetable cultivations. Environ. Pollut. 2015, 196, 89–97. [Google Scholar] [CrossRef]
  19. Martins, M.R.; Jantalia, C.P.; Polidoro, J.C.; Batista, J.N.; Alves, B.J.; Boddey, R.M.; Urquiaga, S. Nitrous oxide and ammonia emissions from N fertilization of maize crop under no-till in a Cerrado soil. Soil Tillage Res. 2015, 151, 75–81. [Google Scholar] [CrossRef]
  20. Zhang, Y.; Lin, F.; Jin, Y.; Wang, X.; Liu, S.; Zou, J. Response of nitric and nitrous oxide fluxes to N fertilizer application in greenhouse vegetable cropping systems in southeast China. Sci. Rep. 2016, 6, 20700. [Google Scholar] [CrossRef] [Green Version]
  21. Hosono, T.; Hosoi, N.; Akiyama, H.; Tsuruta, H. Measurements of N2O and NO emissions during tomato cultivation using a flow-through chamber system in a glasshouse. Nutr. Cycl. Agroecosyst. 2006, 75, 115–134. [Google Scholar] [CrossRef]
  22. Song, H. Studies on Denitrification Process and Environmental Implications in Greenhouse Vegetable Cropping Systems. Ph.D. Thesis, China Agricultural University, Beijing, China, 2012. (In Chinese with English Abstract). [Google Scholar]
  23. Maharjan, B.; Venterea, R.T. Nitrite intensity explains N management effects on N2O emissions in maize. Soil Biol. Biochem. 2013, 66, 229–238. [Google Scholar] [CrossRef]
  24. Ma, L.; Shan, J.; Yan, X. Nitrite behavior accounts for the nitrous oxide peaks following fertilization in a fluvo-aquic soil. Biol. Fertil. Soils 2015, 51, 1–10. [Google Scholar]
  25. Venterea, R.T.; Clough, T.J.; Coulter, J.A.; Breuillin-Sessoms, F. Ammonium sorption and ammonia inhibition of nitrite-oxidizing bacteria explain contrasting soil N2O production. Sci. Rep. 2015, 5, 12153. [Google Scholar] [CrossRef]
  26. Ren, S.L. Characteristics of Nitrification and Nitrogen Mineralization in Greenhouse Vegetable Soil. Master’s Thesis, China Agricultural University, Beijing, China, 2012. (In Chinese). [Google Scholar]
  27. FAO/Unesco. Soil Map of the World, Revised Legend; FAO: Rome, Italy, 1988. [Google Scholar]
  28. Fan, Z.; Lin, S.; Zhang, X.; Jiang, Z.; Yang, K.; Jian, D.; Chen, Y.; Li, J.; Chen, Q.; Wang, J. Conventional flooding irrigation causes an overuse of nitrogen fertilizer and low nitrogen use efficiency in intensively used solar greenhouse vegetable production. Agric. Water Manag. 2014, 144, 11–19. [Google Scholar] [CrossRef]
  29. Hutchinson, G.L.; Livingston, G.P. Use of chamber systems to measure trace gas fluxes. In Agricultural Ecosystem Effects on Trace Gases and Global Climate Change; Wiley: Ney York, NY, USA, 1993; pp. 63–78. [Google Scholar]
  30. Ding, W.; Cai, Y.; Cai, Z.; Yagi, K.; Zheng, X. Nitrous oxide emissions from an intensively cultivated maize–wheat rotation soil in the North China Plain. Sci. Total Environ. 2007, 373, 501–511. [Google Scholar] [CrossRef] [PubMed]
  31. Hillel, D. Environmental Soil Physics; Academic Press: San Diego, CA, USA, 1998. [Google Scholar]
  32. Molstad, L.; Dörsch, P.; Bakken, L.R. Robotized incubation system for monitoring gases (O2, NO, N2O, N2) in denitrifying cultures. J. Microbiol. Methods 2007, 71, 202–211. [Google Scholar] [CrossRef] [PubMed]
  33. Qu, Z.; Wang, J.; Almøy, T.; Bakken, L.R. Excessive use of nitrogen in Chinese agriculture results in high N2O/(N2O+ N2) product ratio of denitrification, primarily due to acidification of the soils. Glob. Chang. Biol. 2014, 20, 1685–1698. [Google Scholar] [CrossRef]
  34. Wang, Y.; Cao, W.; Zhang, X.; Guo, J. Abiotic nitrate loss and nitrogenous trace gas emission from Chinese acidic forest soils. Environ. Sci. Pollut. Res. 2017, 24, 22679–22687. [Google Scholar] [CrossRef] [PubMed]
  35. Hou, H.; Chen, H.; Cai, H.; Yang, F.; Li, D.; Wang, F. CO2 and N2O emissions from Lou soils of greenhouse tomato fields under aerated irrigation. Atmos. Environ. 2016, 132, 69–76. [Google Scholar] [CrossRef]
  36. Xu, Y.; Liu, Z.; Wei, J.; Shi, J.; Tan, D.; Wang, M.; Jiang, L. Emission Characteristics of Soil Nitrous Oxide from Typical Greenhouse Vegetable Fields in North China. Agric. Sci. Technol. 2017, 18, 438–442. (In Chinese) [Google Scholar]
  37. Chen, J.; Song, H.; Cao, W.; Wang, Y.; Wang, J. Nitrous Oxide Production in Response to Oxygen in a Solar Greenhouse Vegetable Soil. Environ. Sci. 2018, 30, 3826–3834. (In Chinese) [Google Scholar]
  38. Wang, Y.; Cao, W.; Zhang, X.; Guo, J. Rate of denitrification and stoichiometry of its products in fluvo-aquic Cambisols for sterilized and unsterilized incubations. Eur. J. Soil Sci. 2019. [Google Scholar] [CrossRef]
  39. Dobbie, K.E.; Smith, K.A. Nitrous oxide emission factors for agricultural soils in Great Britain: The impact of soil water-filled pore space and other controlling variables. Glob. Chang. Biol. 2003, 9, 204–218. [Google Scholar] [CrossRef]
  40. Bateman, E.J.; Baggs, E.M. Contributions of nitrification and denitrification to N2O emissions from soil at different water-filled pore space. Biol. Fertil. Soils 2005, 41, 379–388. [Google Scholar] [CrossRef]
  41. Robertson, G.P.; Groffman, P.M. Soil Microbiology, Biochemistry, and Ecology; Paul, E.A., Ed.; Springer: New York, NY, USA, 2007; pp. 341–364. [Google Scholar]
  42. Ruser, R.; Flessa, H.; Russow, R.; Schmidt, G.; Buegger, F.; Munch, J.C. Emission of N2O, N2 and CO2 from soil fertilized with nitrate: Effect of compaction, soil moisture and rewetting. Soil Biol. Biochem. 2006, 38, 263–274. [Google Scholar] [CrossRef]
  43. Meijide, A.; Díez, J.A.; Sánchez-Martín, L.; López-Fernández, S.; Vallejo, A. Nitrogen oxide emissions from an irrigated maize crop amended with treated pig slurries and composts in a Mediterranean climate. Agric. Ecosyst. Environ. 2007, 121, 383–394. [Google Scholar] [CrossRef] [Green Version]
  44. Kennedy, T.; Decock, C.; Six, J. Assessing drivers of N2O production in California tomato cropping systems. Sci. Total Environ. 2013, 465, 36–47. [Google Scholar] [CrossRef] [PubMed]
  45. Harrison-Kirk, T.; Beare, M.H.; Meenken, E.D.; Condron, L.M. Soil organic matter and texture affect responses to dry/wet cycles: Effects on carbon dioxide and nitrous oxide emissions. Soil Biol. Biochem. 2013, 57, 43–55. [Google Scholar] [CrossRef]
  46. Owens, J.; Clough, T.J.; Laubach, J.; Hunt, J.E.; Venterea, R.T. Nitrous oxide fluxes and soil oxygen dynamics of soil treated with cow urine. Soil Sci. Soc. Am. J. 2017, 81, 289–298. [Google Scholar] [CrossRef]
  47. Uchida, Y.; Wang, Y.; Akiyama, H.; Nakajima, Y.; Hayatsu, M. Expression of denitrification genes in response to a waterlogging event in a Fluvisol and its relationship with large nitrous oxide pulses. FEMS Microbiol. Ecol. 2014, 88, 407–423. [Google Scholar] [CrossRef] [Green Version]
  48. Riya, S.; Takeuchi, Y.; Zhou, S.; Terada, A.; Hosomi, M. Nitrous oxide production and mRNA expression analysis of nitrifying and denitrifying bacterial genes under floodwater disappearance and fertilizer application. Environ. Sci. Pollut. Res. 2017, 24, 15852–15859. [Google Scholar] [CrossRef]
  49. Min, J.; Shi, W.; Xing, G.; Powlson, D.; Zhu, Z. Nitrous oxide emissions from vegetables grown in a polytunnel treated with high rates of applied nitrogen fertilizers in Southern China. Soil Use Manag. 2012, 28, 70–77. [Google Scholar] [CrossRef]
  50. Zhang, J.; Li, H.; Wang, Y.; Deng, J.; Wang, L. Multiple-year nitrous oxide emissions from a greenhouse vegetable field in China: Effects of nitrogen management. Sci. Total Environ. 2018, 616, 1139–1148. [Google Scholar] [CrossRef] [PubMed]
  51. Linn, D.M.; Doran, J.W. Effect of water-filled pore space on carbon dioxide and nitrous oxide production in tilled and nontilled soils. Soil Sci. Soc. Am. J. 1984, 48, 1267–1272. [Google Scholar] [CrossRef]
  52. Davidson, E.A. Soil water content and the ratio of nitrous oxide to nitric oxide emitted from soil. In Biogeochemistry of Global Change; Oremland, R.S., Ed.; Springer: New York, NY, USA, 1993; pp. 368–386. [Google Scholar]
  53. Sanchez-Martín, L.; Meijide, A.; Garcia-Torres, L.; Vallejo, A. Combination of drip irrigation and organic fertilizer for mitigating emissions of nitrogen oxides in semiarid climate. Agric. Ecosyst. Environ. 2010, 137, 99–107. [Google Scholar] [CrossRef]
  54. Kennedy, T.L.; Suddick, E.C.; Six, J. Reduced nitrous oxide emissions and increased yields in California tomato cropping systems under drip irrigation and fertigation. Agric. Ecosyst. Environ. 2013, 170, 16–27. [Google Scholar] [CrossRef]
  55. Vallejo, A.; Meijide, A.; Boeckx, P.; Arce, A.; García-torres, L.; Aguado, P.L.; Sanchez-Martín, L. Nitrous oxide and methane emissions from a surface drip-irrigated system combined with fertilizer management. Eur. J. Soil Sci. 2014, 65, 386–395. [Google Scholar] [CrossRef]
  56. Guardia, G.; Cangani, M.T.; Sanz-Cobena, A.; Junior, J.L.; Vallejo, A. Management of pig manure to mitigate NO and yield-scaled N2O emissions in an irrigated Mediterranean crop. Agric. Ecosyst. Environ. 2017, 238, 55–66. [Google Scholar] [CrossRef]
  57. Tian, D.; Zhang, Y.; Mu, Y.; Zhou, Y.; Zhang, C.; Liu, J. The effect of drip irrigation and drip fertigation on N2O and NO emissions, water saving and grain yields in a maize field in the North China Plain. Sci. Total Environ. 2017, 575, 1034–1040. [Google Scholar] [CrossRef] [PubMed]
  58. Ye, X.; Han, B.; Li, W.; Zhang, X.; Zhang, Y.; Lin, X.; Zou, H. Effects of different irrigation methods on nitrous oxide emissions and ammonia oxidizers microorganisms in greenhouse tomato fields. Agric. Water Manag. 2018, 203, 115–123. [Google Scholar] [CrossRef]
Figure 1. Temporary changes in soil water-filled pore space (WFPS) (a) and soil N2O flux (b) in a solar greenhouse during the observation period. Bars in subfigures represent standard errors (n = 3). Downward thick and thin arrows denote basal fertilization and topdressing with flooding irrigation, respectively. WS, F and AS mean winter-spring season, summer fallow and autumn-winter season, respectively.
Sustainability 11 01624 g001
Figure 2. Temporary changes in the concentration of headspace N2O (a), soil NH4+-N (b), NO2-N (c), and NO3-N (d) during the first 7 days of incubation. Bars in subfigures represent error bars (n = 4).
Sustainability 11 01624 g002
Figure 3. Correlation bi-plot of redundancy analysis (RDA) depicting the relationships between the soil properties (independent variables) and gas parameters (dependent variables).
Sustainability 11 01624 g003
Figure 4. Relationships between soil water-filled pore space (WFPS) and field N2O flux (a) and laboratory N2O peak concentration (b).
Sustainability 11 01624 g004
Table 1. Initial soil physical and chemical properties in surface soils (0–20 cm).
TreatmentpH Soil Organic Carbon (g kg−1)Total Nitrogen (g kg−1)Olsen-P (mg kg−1)Exchangeable Potassium (mg kg−1)NH4+-N (mg kg−1)NO3N (mg kg−1)
CFF8.03 ± 0.0311.0 ± 0.241.10 ± 0.06172 ± 3.7496 ± 3.93.54 ± 1.343.1 ± 2.1
pH at 2.5:1 of water: soil (v/w).
Table 2. N2O emission rate over the first 40 h of aerobic incubation, as affected by chicken manure addition with water-filled pore space (WFPS).
Soil MoistureN2O Emission Rate (nmol N g−1 h−1)
M0M260
65% WFPS0.009 ± 0.00 bB0.31 ± 0.11 aB
75% WFPS0.014 ± 0.00 bB2.14 ± 0.57 aAB
85% WFPS1.76 ± 0.47 bA8.46 ± 2.89 aA
ANOVA
Chicken manure (CM)9.35 **
Soil moisture (WFPS)9.35 **
CM × WFPS3.66 *
Uppercase letters indicate significant differences (p < 0.01) in each column and lowercase letters indicate significant differences (p < 0.05) in each row. ** Significant at p < 0.01, * Significant at p < 0.05.

