Capturing Associations and Sustainable Competitiveness of Brands from Social Tags

1
Economics and Management School, Wuhan University, Wuhan 430072, China
2
School of Electronic Commerce, Wuhan Technology and Business University, Wuhan 430065, China
*
Author to whom correspondence should be addressed.
Sustainability 2019, 11(6), 1529; https://doi.org/10.3390/su11061529
Submission received: 14 February 2019
/
Revised: 8 March 2019
/
Accepted: 8 March 2019
/
Published: 13 March 2019
(This article belongs to the Section Economic and Business Aspects of Sustainability)
Abstract
:With the explosion of social media, consumers’ minds have become important assets in brand competitions. Determining a brand’s competitive structure based on consumers’ desires is particularly important to effectively establish a brand and maintain sustainable competitiveness. The traditional methods of determining brand competitiveness are costly and time-consuming. In this study, we propose an efficient, systematical, highly automated, and real-time method to determine brand competitiveness based on consumers’ brand associations with the brand’s social tags. Using a set of 45 brands in the automobile industry and around 50,000 social tags, we compared our brand competitiveness determination method with data provided by Interbrand and directly elicited survey data, finding a significant correlation and a better predictive power in consumers’ perceived brand competitiveness than the traditional method. Our proposed method enables managers to create and maintain sustainable brand advantages in consumers’ minds.
1. Introduction
Developing improvements for capturing a brand’s competitive structure is important for the implementation of many marketing strategies. For example, in brand positioning, competitive advertising, and new product launches, managers want to know how their competitors would respond and how the consumers would be affected by their relevant strategies. This information enables firms to earn business and create sustainable advantages in the competitive market [1,2,3].
With the rapid development of social media, consumers’ minds are important assets in the brand competition process. Consumers and their perceptions have increasingly been relied upon and must be determined to maintain relationships with the brands they favor, such as participating in brand communities, being loyal to brands, and spreading brand information through interpersonal communication or word of mouth, which all affect the development of a brand [4,5]. Thus, developing methods to uncover brand information based on consumers’ preferences is fundamental for firms to obtain a more thorough understanding about their strategic advantages and thus to build a sustainable competitive brand advantage in consumers’ minds.
Traditional methods for scholars and practitioners to understand brand competitive advantage mainly include financially estimating brand value, such as brand equity and brand asset [6,7], and drawing a brand’s association map [8,9] and perception map [10,11]. Organizing consumer reporting and ratings on a given brand’s attributes is almost an inevitable process in those methods, and they mostly rely on surveys, case studies, and personal interviews (John, 2006 #259; Bijmolt, 2012 #257; Zaltman, 1997 #265; Zaltman, 1995 #264; Joiner, 1998 #266;), which are costly and time consuming and may quickly become outdated [11].
The explosion of social media has enabled managers to leverage user generated content (UGC) to uncover consumer opinions on brands. Some scholars use review data, online posts, and social tags to investigate how brands are associated in consumers’ psychological cognition and how brands are perceived and rated with given attributes [12,13,14]. However, most of these methods only identify limited brand associations or attributes. To more comprehensively analyze the brand competitiveness or brand value, a more general and representative set of brand associations (or attributes) and the value of these associations (or attributes) should be considered.
In this paper, we focus on consumers’ brand associations, defined as set of memory notes or users’ imageries, including the brands benefits, attributes, and characteristics, to determine a brand’s relative competitiveness. Brand association can positively affect consumer response (commitment, trust, purchase intention, or recommendation) toward brand strategies and has been used by many studies to describe brand value [8,9,15]. To obtain a more intuitive and a systematic picture of market competitive structure of brands based on consumers, we propose a real-time, effective, automatic, and generalized method to identify the relative brand competitiveness based on consumers’ brand associations. This method not only provides enterprises with a brand associative map in a specific time window, but also helps to systematically and comprehensively determine the relative sustainable competitiveness of the focal brands in consumer groups.
The captured brand competitiveness can be regarded as sustainable in the following aspects. First, as will be mentioned later, a brand with a higher competitiveness value calculated with our method has diversified and unique brand associations in consumers’ memory, which can be important for a brand to adapt to consumers’ changing preferences, thus making it easier for firms to achieve advanced performance. Second, the extent to which association-based brand competitiveness, as a manifestation of brand knowledge deep in consumers’ memory [15,16], is valuable, inimitable, and nonsubstitutional. Such inherently idiosyncratic resources can result in a sustainable competitive advantage that produces sustained superior performance [17,18].
We leveraged UGC data on delicious.com, a well-known social tag platform, which was proven to be less ambiguous and less noisy among the many other forms of UGC (e.g., reviews, microblogs, posts, etc.) to reveal consumers cognitive associations [13,19]. First, to conduct our proposed procedures, we input the brand name and collected the associated social tags iteratively in a given time window. Second, we built a weighted brand–tag association matrix to describe the brands and the tagged-association information, treated as the input, to compute the brand competitiveness score in our final algorithm.
The method we developed is innovative. First, whereas most extant research investigated the brand associative map and brand perception map separately, our method combines these maps. The weighted brand–tag association matrix not only reveals what attributes the brand is associated with in consumers’ minds, but also depicts how consumers value this association. Second, our analysis focuses on the platform delicious.com, which has received limited attention in the marketing literature, but offers advantages in text data analysis. Third, we introduce a systematic and highly automated method to draw the competitive structural market map based on the crowd organization of social media. By providing a brand list as the input, we obtain near real-time estimates of the relevant competitive value of the focal brands and uncover how a certain association contributes to the brand’s competitiveness.
The remainder of the paper is organized as followers. Firstly, we introduce the theoretical background in Section 2. Section 3 explains the construction of the brand–tag association matrix and the algorithm used for calculating the brand competitiveness score. Section 4 validates the method and tests the robustness of the method. Section 5 presents the discussion and conclusions.
2. Theoretical Background
2.1. Identification of Brand Competitiveness with Consumer Brand Association
Our method is based on the theoretical role of brand association in understanding brand competitiveness [8,9]. We argue that effectively identifying the brand association among competitors is helpful for enterprises to understand their relative competitiveness in the market. The strength of brand association, defined as how strong the brand is linked with consumer memory when an association (e.g., car) is mentioned, reflects the brand image that is conceptualized by the comprehensive expression of a series of brand associations in consumers’ memories [16]. Identifying the brand competitive structure is necessary to build an distinguishable brand image from that of the competitors according to brand positioning theory [20,21]. According to the theory of consumer-based brand equity, the linkage of the brand association in consumers’ minds develops the consumer’s brand knowledge [6,16], which helps differentiate consumers’ responses (including perceptions, preferences, and behaviors) to the marketing of the brand, thus reflecting the relative marketing competitiveness of the brand. A favorable consumer perception or preference will lead to more loyal consumers and more repeat purchases, which enhance market performance. Thus, identifying brand association in the competitive market is essential for firms to identify their brand’s competitiveness.
Consumer brand association is a series of memory nodes related to the brand in the minds of consumers [16,22,23,24] and is always used for detecting a brand’s competitive structure by marketing managers. Three dimensions of brand association have been documented by existing studies [16]: (1) Type of the band association, which can be subdivided into three types of associations: brand attributes (e.g., size, color), brand benefits (e.g., interesting, practical), and consumers’ attitudes (e.g. preference, satisfaction). The various types of brand association reflect the consumer’s expression of multidimensional cognition and memory about the brand. (2) The second dimension is strength of the brand association. According to the model of brand association proposed by Anderson et al. [23], brand association has different strengths, referring to the probability that the consumer can associate with the brand when stimulated by a certain memory node, for example the levels or depth of the processing approach [25,26,27]. The stronger the strength of a brand association, the more likely a consumer will make purchase decisions when stimulated by a memory node represented by the brand association. (3) The third dimension is uniqueness of the brand association. Brand associations are different in their degrees of uniqueness. Brand association may or may not be shared by other brands, and it is important to have a unique position in the minds of consumers according to theory of brand positioning [21]. Therefore, possessing a unique and strong brand association is particularly essential for the brand to achieve a competitive advantage.
We propose that the competitive advantage achieved by having a special brand association structure is sustainable. First, Keller [16] stated that the long-term success of all future marketing programs for a brand is greatly affected by the lasting knowledge about the brand that has been established by the firm’s short-term marketing efforts. Hence, association structure—a manifestation of consumers’ brand knowledge deep in memory—will be highly related with long-term marketing performance. Second, a resource-based view treats heterogeneity in the levels, value, imitability, and substitutability of firms’ resources and capabilities as a fundamental reason for interfirm performance variations [18,28,29]. The extent of consumers’ brand associations, as an important component of brand image or brand equity, is itself valuable, imitable, and irreplaceable. Thus, association-based brand competitiveness in a firm’s resources and capabilities can be sustained.
Despite the importance of the brand association in the identification of brand sustainable competitiveness, studies in this area are limited. Prior studies identified brand association mainly include Zaltman’s metaphor elicitation technique (ZMET) [30,31] and brand concept maps (BCMs) [8,15], which need to be conducted through in-depth interviews with consumers and led by participants with professional knowledge in marketing. The traditional methods have several shortcomings: First, the samples are limited and unable to represent the expansive sample in the UGC context. Second, both methods rely on in-depth interviews, which are costly and time-consuming. Thirdly, in these method, limited dimensions in the brand associations can be identified. These factors impede firms’ ability to dynamically identify a brand’s competitive information in the UGC environment.
The growth and proliferation of social media offers a rich data source to marketing managers to obtain a brand’s association network or brand perceptions. For example, text-mining approaches have been used to determine the brand associative network by extracting keywords in user generated content, such as online reviews or posts [12,32]. Other studies used sentiment analysis to classify consumers feelings about brands [33,34]. Nam et al. [13] proposed a brand association method depending on the co-occurrence frequency of brands and tags with social tag data. We argue that there are limitations to these approaches. First, UGC, such as reviews, posts or online forums, contains considerable noise, which is a subjective problem. Users generate content for the purpose of personal image management or information seeking, which affect the objectivity and reliability of the results. Second, the methods are not reliably accurate. Most of these methods leverage Linguistic Inquiry and Word Count (LIWC), the most popular tool used in the keyword analysis process in text-mining. However, the validity of the method requires improvement. The correlation effects of the tool’s output and human judges’ ratings were reported to be 0.45 on average [35]. Third, these methods focus on limited brand associations or brand attributes and fail to report the uniqueness value of the brand associations for a firm’s angle, failing to measure the brands’ relative competitiveness from a comprehensive and systematical perspective.
These challenges and opportunities motivated the research goal of this paper: to develop a generalized and flexible methodology to identify the brand-relevant competitiveness from publicly available secondary UGC data, specifically the social tag platform. In the following sections, we describe the hidden information in a general form of UGC, the brand social tag, and propose new approaches in the next sections.
2.2. Brand Social Tag
To take full advantage of the data in UGC content, we chose the social tag platform as the secondary data source to develop our new method for the following reasons. Firstly, compared with other social media platform, such as Twitter or Facebook, content in social tags are relatively more context-neutral, more related to consumers’ objective perceptions and knowledge about their focal content, and is regarded as an ideal form of UGC reflecting how consumers conceptualize and create associative structures of brands [16]. Secondly, many social media platforms have begun to manage and classify UGC based on social tags, such as hashtags on Twitter, pins on Pinterest, and hotspots on weibo. The prevalence of social tags enables the generalization of our study.
Social tags are one or more descriptions of web resources defined by web users, which help online users categorize and share their favorite Internet resources. Users can store and manage their web content on a social tag platform such as Delicious, Folksonomy, Tumblr, and reddit. Since users can collect and categorize their web content by learning from the tags generated by other users, the behavior of collecting social tags reflects iterated learning and the interacting process of the users.
Brand social tags reflect comprehensive brand associative information. Nam and Kannan [19] mentioned two motivations for users to generate social tags: need for content organization (descriptive classification of the tagged content) and need for social interaction (sharing and exchanging opinions with other users about the content). On social tag platforms, consumers describe, organize, and categorize the content of the website (such as text, pictures, audio, or video). They may categorize content abstractly with high-level attributive words or describe content semantically with more contextual attributive words [36]. As illustrated, people may categorize motor-relative content as “car” or “motor” and may also describe the web content of their interest by “interesting”. Social tag platforms also enable users to interact with each other. Users can follow each other and iterate their knowledge about the web content by interpersonal interaction or social influence. Taken together, brand social tags are content filtered from users’ structural brand memory that can be used to summarize, describe, categorize, and communicate with others, which can be used to capture the comprehensive and objective associations of brands of online users.
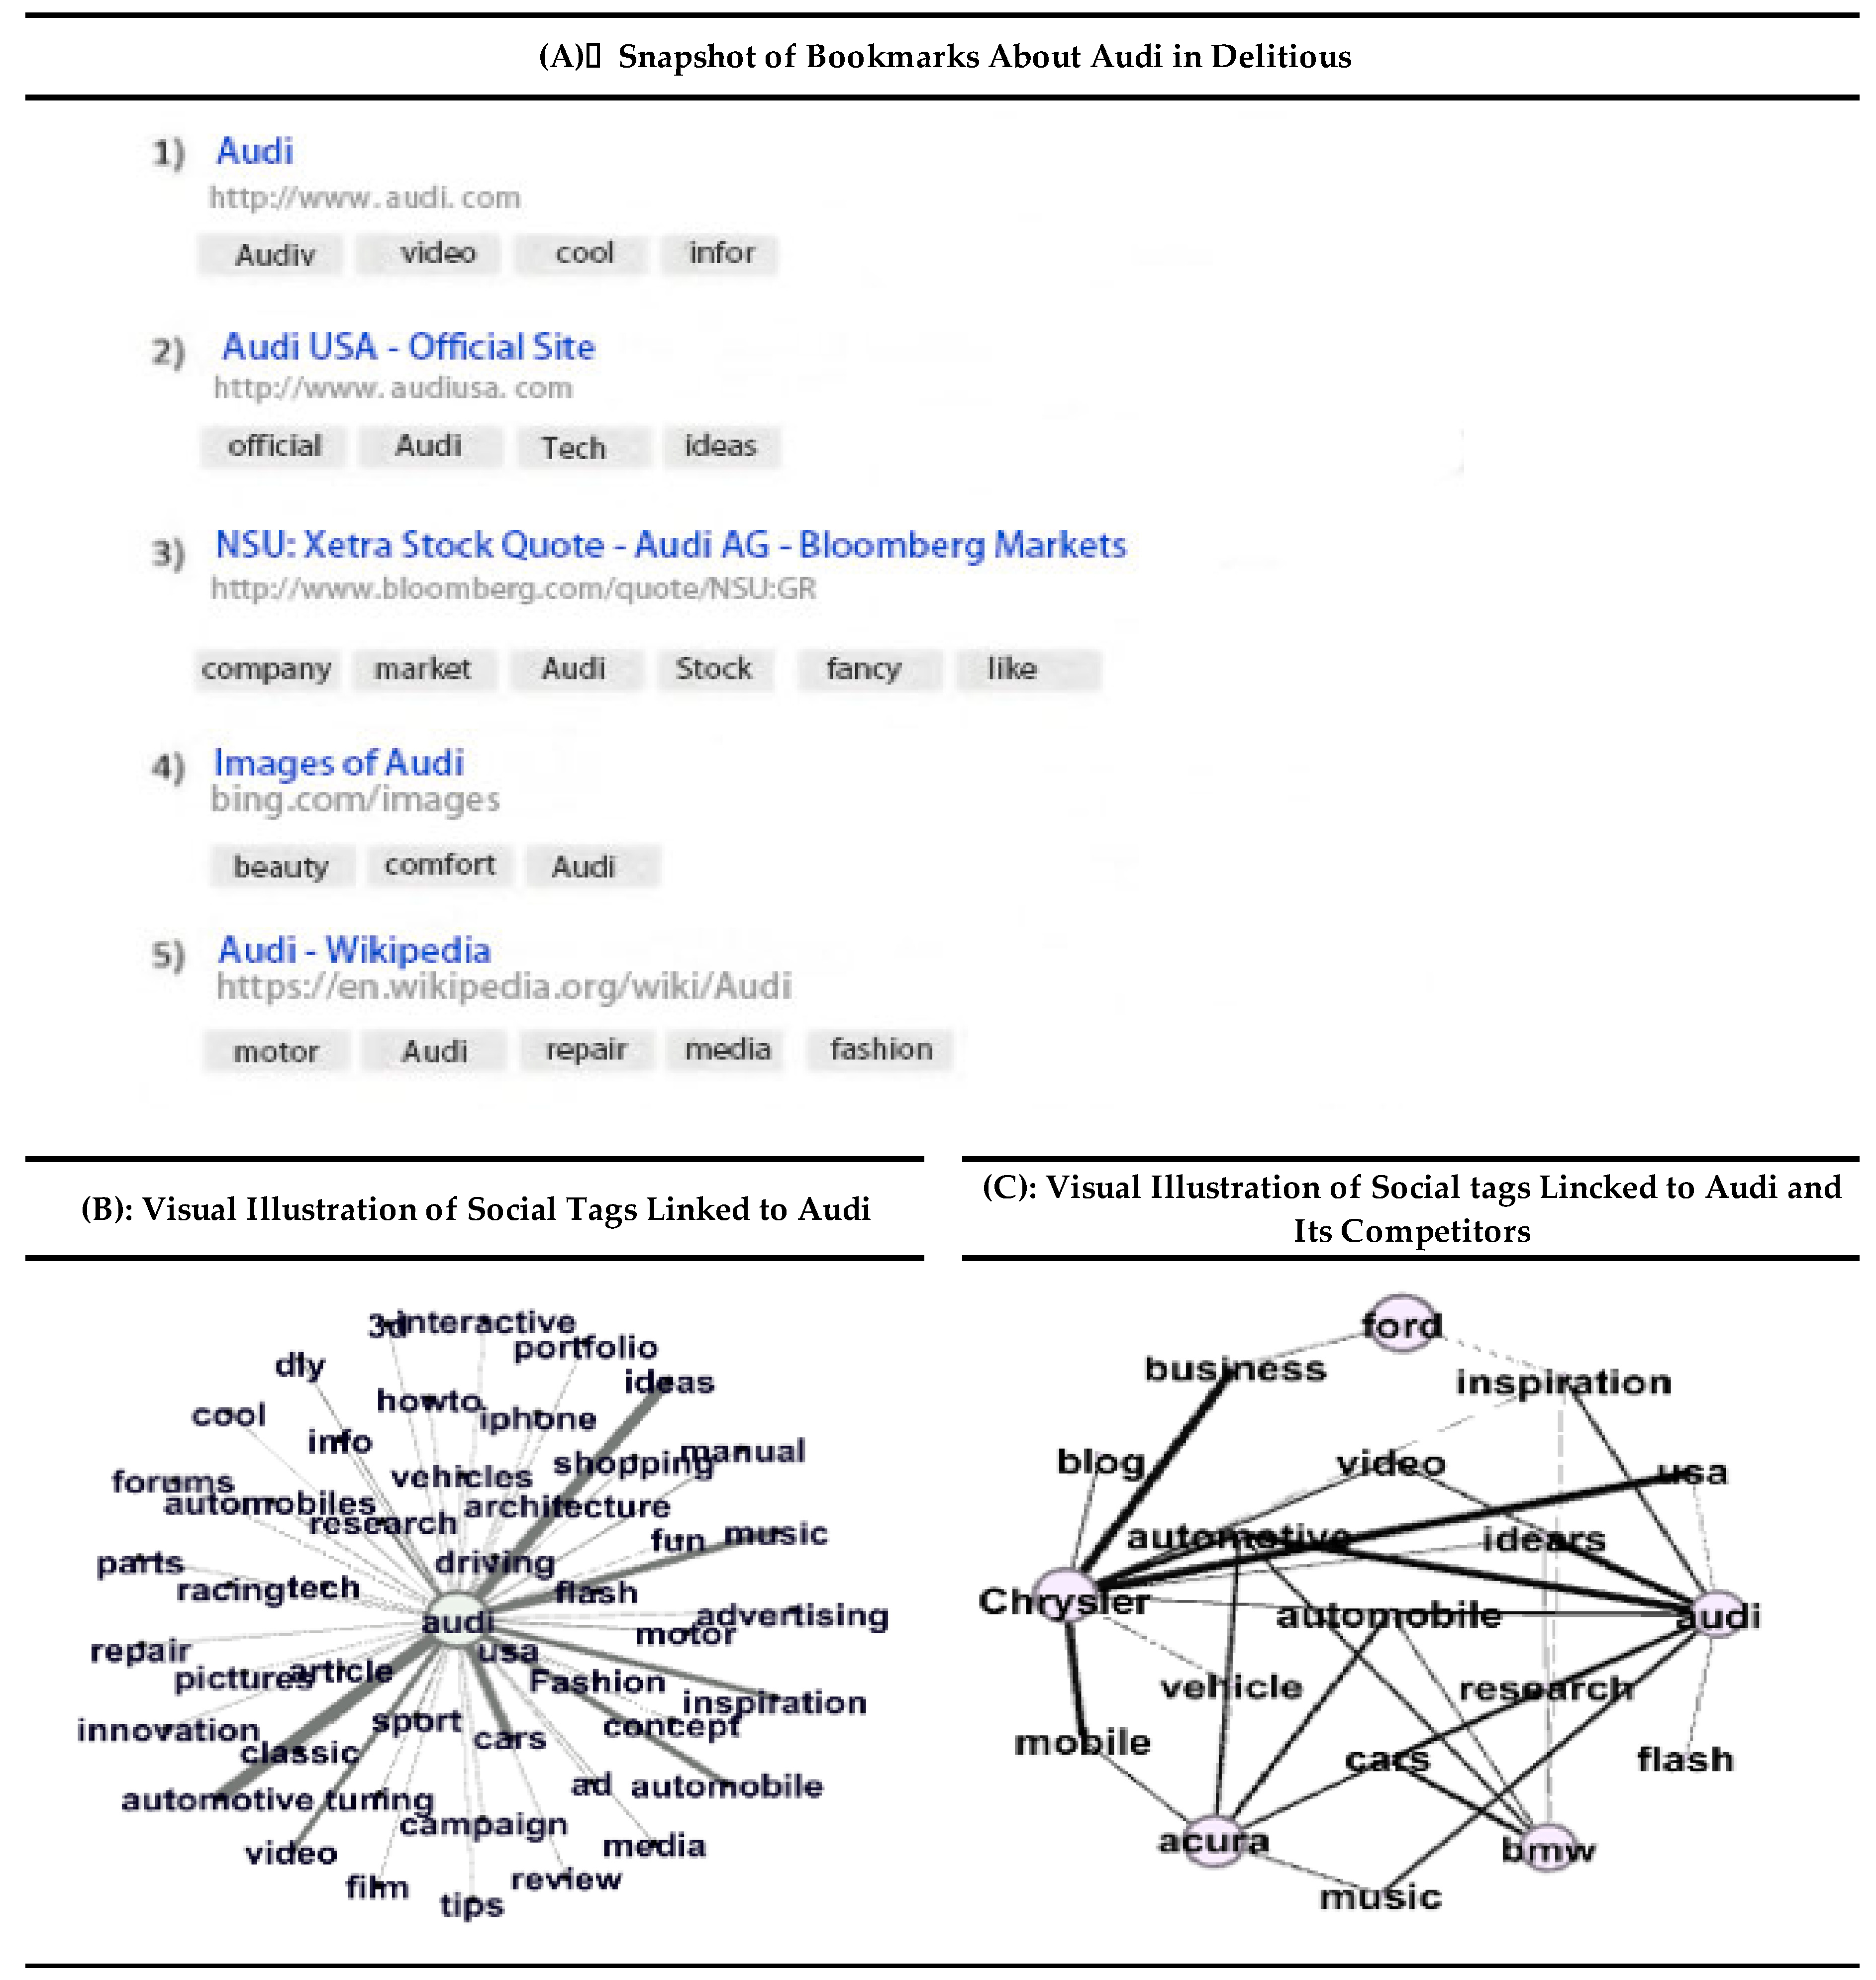
The brand social tags on Delicious can reveal consumers’ brand association networks. Figure 1A shows an example of bookmarks associated with “Audi” created on Delicious. Each bookmark represents a specific user’s cognition and interpretation about the web content related to the brand name “Audi”. Users categorize and describe the web content in the collected bookmarks with the most related words or phrases that can be retrieved from their content-associated memory. For example, Bookmark 4 shows that the web content “image of Audi” is tagged by keywords such as “beauty”, “comfort”, and “Audi”. These tags capture all the consumers’ brand memory notes associated with “Audi”, from which we can obtain brand association network of Audi as depicted in Figure 1B.
Brand social tags can also be used to depict the competitive market structure among brands, as illustrated in Figure 1C, which shows the interrelationship of the social tags among brands. The shade of the links represents the strength of the relationship of the brand and tag according to the co-occurrence of the brand and tag in the users’ bookmarks; the darker the shade, the more likely the tagged brand to be linked with the tag in users’ bookmarks in the time window.
We argue that a brand’s social tag can further reflect the uniqueness value of brand associations [16] at the group level, which is important for understanding the competitiveness of the brand. Some tagged associations are shared with almost all brands from the least competitive brand to the most competitive brand, such as “car” and “motor” (Figure 1C), whereas some tags are associated with only a few brands, such as “inspiration” and “enjoyment”. Being linked with these tags requires brands to be more specialized or more competitive in some aspects. Thus, the uniqueness value of the brand associations explains not only how these associations are shared by its competitors but also the potential competitiveness of the company. Hence, managers must understand the associations between uniqueness value in capturing the relative competitiveness.
Given the valuable information in the brand social tag, we were motivated to find a flexible method to capture brands’ competitive information hidden in the social tags. We next explain the implementation of our proposed method in detail.
3. Brand Competitive Structure Mining Methodology
Given the list of brands, our goal was to develop an automated method to discover the competitive structure of the focal brands according to a comprehensive understanding about the brands’ association maps. We then accordingly assigned a score to each brand, where a high score indicates a more competitive brand.
The overall process of capturing the association-based brand competitiveness is as follows (Figure 2). First, given a focal brands list, we collected the brand social tag dataset in the given time window, then we retrieved the most relevant associations on the basis of the occurrence frequency of these social tags. Third, we built the brand–tag association matrix, a weighted binary matrix describing the customers’ brand associations containing the strength and the uniqueness information of the associations. Finally, we computed the competitiveness of the brands with the matrix.
3.1. Step 1: Selecting Exemplary Brands and Collecting Social Tags
The final goal of our approach was to capture the competitive structure based on consumers’ brand associations. The approach required a set of brands belonging to a certain industry. We chose a single, major industry of great economic importance—the automobile industry—as an example. Cars are high-involvement products in terms of interest, risk, and utilitarian and hedonic value [37]. Additionally, the automobile industry has occupied more than 3% of the U.S. gross domestic product which has attracted the interest of scholars from multiple disciplines (such as economics, management and marketing) [38,39].
According to Stahl et al.’s work [7], we selected 45 car brands which constitute more than 97% of all automobile sales in the U.S. market as our input brand set provided by Edmunds, an American automobile information website. By setting the time window as 2014 to 2015, we used the delicious Application Program Interface [40] to collect social tags linked with the brands in the chosen time window. We iterated through the list of 45 brands (we list all the car brands in Table 1) and obtained 50,045 different tags in total.
We next cleaned the data of the tags, including transforming all tags, to lowercase, removing meaningless stop words in tags and lemmatizing words in the tags. We finally produced a dataset of 47,870 tags for the 45 brands. Figure 3A shows the distribution of the tags in the automobile industry, which presents a typical power-law distribution. The tags most frequently generated by users were the ubiquitous tags such as cars, auto, and vehicle.
3.2. Step 2: Selecting the Brand Associations
In order to gain a holistic understanding of the brand association of all the brands in the brand list, we needed to retrieve the brand association list that is most frequently mentioned by the users. For the purpose of illustration, we selected the 1000 associations that were tagged most frequently in our dataset of brand social tags. The density distribution of the selected associations is shown in Figure 3B. In the selected association list, the ten most frequently mentioned associations are “cars”, “car”, “porn”, “auto”, “automotive”, “design”, “bmw”, “toyota”, “parts”, and “video”. A bar chart of the ten associations is given in Figure 3C.
Accordingly, we built a dataset with the following information: (1) whether the brand in the brand list is tagged by any of the 1000 associations, and the frequency of these associations for the brand; and (2) the uniqueness of the associations in the list, i.e., how many brands in the brand list are tagged with a specific association in the association list. To capture and describe the information contained in the brand social tags, we next built the brand–tag association matrix given the dataset.
3.3. Step 3: Construction of Weighted Brand–Tag Association Matrix: Matrix M′
We constructed the brand–tag association matrix in two steps. First, we elicited the brand associations and depicted them with a binary matrix M to describe whether the brand and the tagged association are related. After, we computed the strength of the association and multiplied it with the matrix M, and thus obtained the weighted brand–tag association matrix .
3.3.1. Association Elicitation
First, it was important to know whether the brand and the tag are related. One of the purposes of previous studies mapping the brand association was to determine the association of the brand in customers’ minds [15,16,20]. This step involves determining the owner–member relationship with two sets of entities, i.e., whether a brand has an association or whether a brand and an association are linked in consumers’ minds. Motivated by the same logic in Balassa’s RCA (Revealed Comparative Advantage) algorithm in computing the international trading relationship between the countries and products [41]. To define a suitable metric to compare the associations between different brands, considering the difference in varieties and total tags, we defined the elements in M determined by in Equation (2), which is the fraction of the co-occurrence frequency of brands and with respect the co-occurrence frequency of and all the tags in the bookmarks. This quantity is then divided by the fraction of the total occurrence frequency of tag with respect to the overall occurrence of tags in the bookmarks. In order to define the relative competitiveness of different brands, we considered (elements in matrix M) = 1, if and zero otherwise.
The elements in the matrix can be expressed as follows:
where
where denotes the co-occurrence of tag and brand in the bookmarks in time window t, T is the set of all tags, and B indicates the set of all brands. Elements in matrix M are 0 or 1, where indicates brand is associated with tag in consumers’ minds. Thus, the ith row in matrix M [] represents the consumers’ brand associative map of brand i. The ith column of matrix , represents how tag i is associated with the 45 brands.
3.3.2. Strength of Associations
For the strength of the association between brand and tag , similar to Nam et al. [16], we used the standardization of the number of co-occurrences of the brand and the tag , measured by the cosine distance between brands and tags, which has also been used to capture the similarity between two tags in delicious [42].
where is the number of bookmarks linked to tag in time window t and indicates volume of bookmarks linked to brand in time window t.
3.3.3. The Weighted Brand–Tag Association Matrix
We specify the weighted brand–tag association matrix M′ as the multiplication of the brand tag association relationship and the brand tag association strength:
where elements in the matrix represent not only whether a tag is associated with the brand, but also the strength of the association. Note, there are other methods available to estimate the strength of associations. For example, we also used the co-occurrence of the brands and the tags as proxies of the brand associative strength and used the results in our algorithm to calculate the relative brand competitiveness. The results were found to be similar.
3.4. Visualization
The construction of the weighted brand–tag association matrix is a primary step to create a holistic understanding about how the associations are related and shared within these brands before eliciting the brand competitiveness information. The visualization of the brands and brand associations provides managers with direct explanations about how their brands are associated with certain tags compared to their competitors.
With the weighted brand association matrix M’, we drew the competitive structure of the 45 brands among the 1000-brand association. Choosing two tagged associations: “art” and “social” as an example, we drew the two-dimensional (2D) competitive structure for these two associations in Figure 4A. Values in the horizontal and vertical axes denote the association strength of the brand and “social” and “art”, respectively. Similarly, Figure 4B depicts the three-dimensional (3D) competing structure by adding “engineering” to the association set.
3.5. Step 4: Capturing the Competitive Brand Structure
As previously mentioned, possessing a unique and strong brand association is particularly essential for the brand to achieve a competitive advantage [8,9,16,21]. With this idea, we conjecture that a competitive brand should be linked with more valuable and unique associations in consumers’ minds. We used the initial idea of assigning a score to the competitiveness of a brand to calculate the weighted sum of the value of the brand associations for the brand. The values of the brand associations indicate how the brand association contributes to the competitiveness of the brand in consumers’ minds. Intuitively, we reordered the rows and columns of matrix M by the total number of tags associated with each brand, = , and the total number of brands associated with each tag, = , where is the volume of tags associated with brand and is the volume of brands associated with the tag . and are the degree of and , respectively. A larger implies a diverse interpretation of brand j with more diverse associations in time window t. A larger indicates a less unique tag i associated with numerous brands in time window t. As shown in Figure 5A, the matrix M creates a triangular structure that is significantly different from that in the case of a random binary matrix by reordering the rows and columns following the same procedure (Figure 5B).
The triangular feature describes the dynamic evolution of a brand in consumers’ minds. As depicted, some brands are linked with a variety of associations (diversified brands), while some are linked to only a few (poorly diversified brand). This suggests that the more competitive brands are more diversified and can capture consumers with multiple brand associations. As such, the brand can adapt to the changing consumer environment and survive the fierce competitive market. This is similar to the evolution of biological systems, i.e., the more complex and diverse the biological system, the more effectively it uses external resources to adapt to the changes in the external environment [43,44].
The brand associations also differ in their contribution to brand competitiveness; some associations are only linked with a few diversified brands (unique tags), which are generally more exclusive associations (e.g., inspiration and design). Brands with such associations are characterized by a high level of research and development (R&D) activity and more internal and external resources, such as human and financial resources, which are strongly related to the potential competitiveness of the company. Some associations were related to many brands (poorly unique tags), which were more likely to be general or ubiquitous associations (e.g., car, automobile). Brands with those associations may not necessarily be equipped with high levels of technology or specialization (poorly competitive brand). This implies that being linked with a poorly competitive brand may be an indication of an association with low uniqueness. As depicted in Figure 5A, the value of a brand association is bounded by the least diversified brand among all the brands to which it is linked.
Accordingly, we infer that the value of a brand association is determined by two factors: the uniqueness of the association (the number of brands linked with the association) and the least competitive brand linked with the association. The competitiveness of a brand is determined by the weighted sum of the values of the brand associations. Accordingly, we introduced an iterated algorithm to calculate the uniqueness value of the associations and the brand competitiveness linked with these association , where is determined by the weighted sum of the associations value, and is determined by the uniqueness of the association and bounded by the competitiveness of the least diversified brand (Figure 5A). The relationship between brands and associations is defined in Equation (5) and it obtains a clear ranking of brands and associations as a fix-point property and in the given time window.
where the is the competitiveness of brand b, is the value of the association t by normalization, n is the iteration times, and is the brand association strength in matrix M’. The algorithm is unique and robust when the solution is proven to be independent of the initial value according to Tacchella et al. [37].
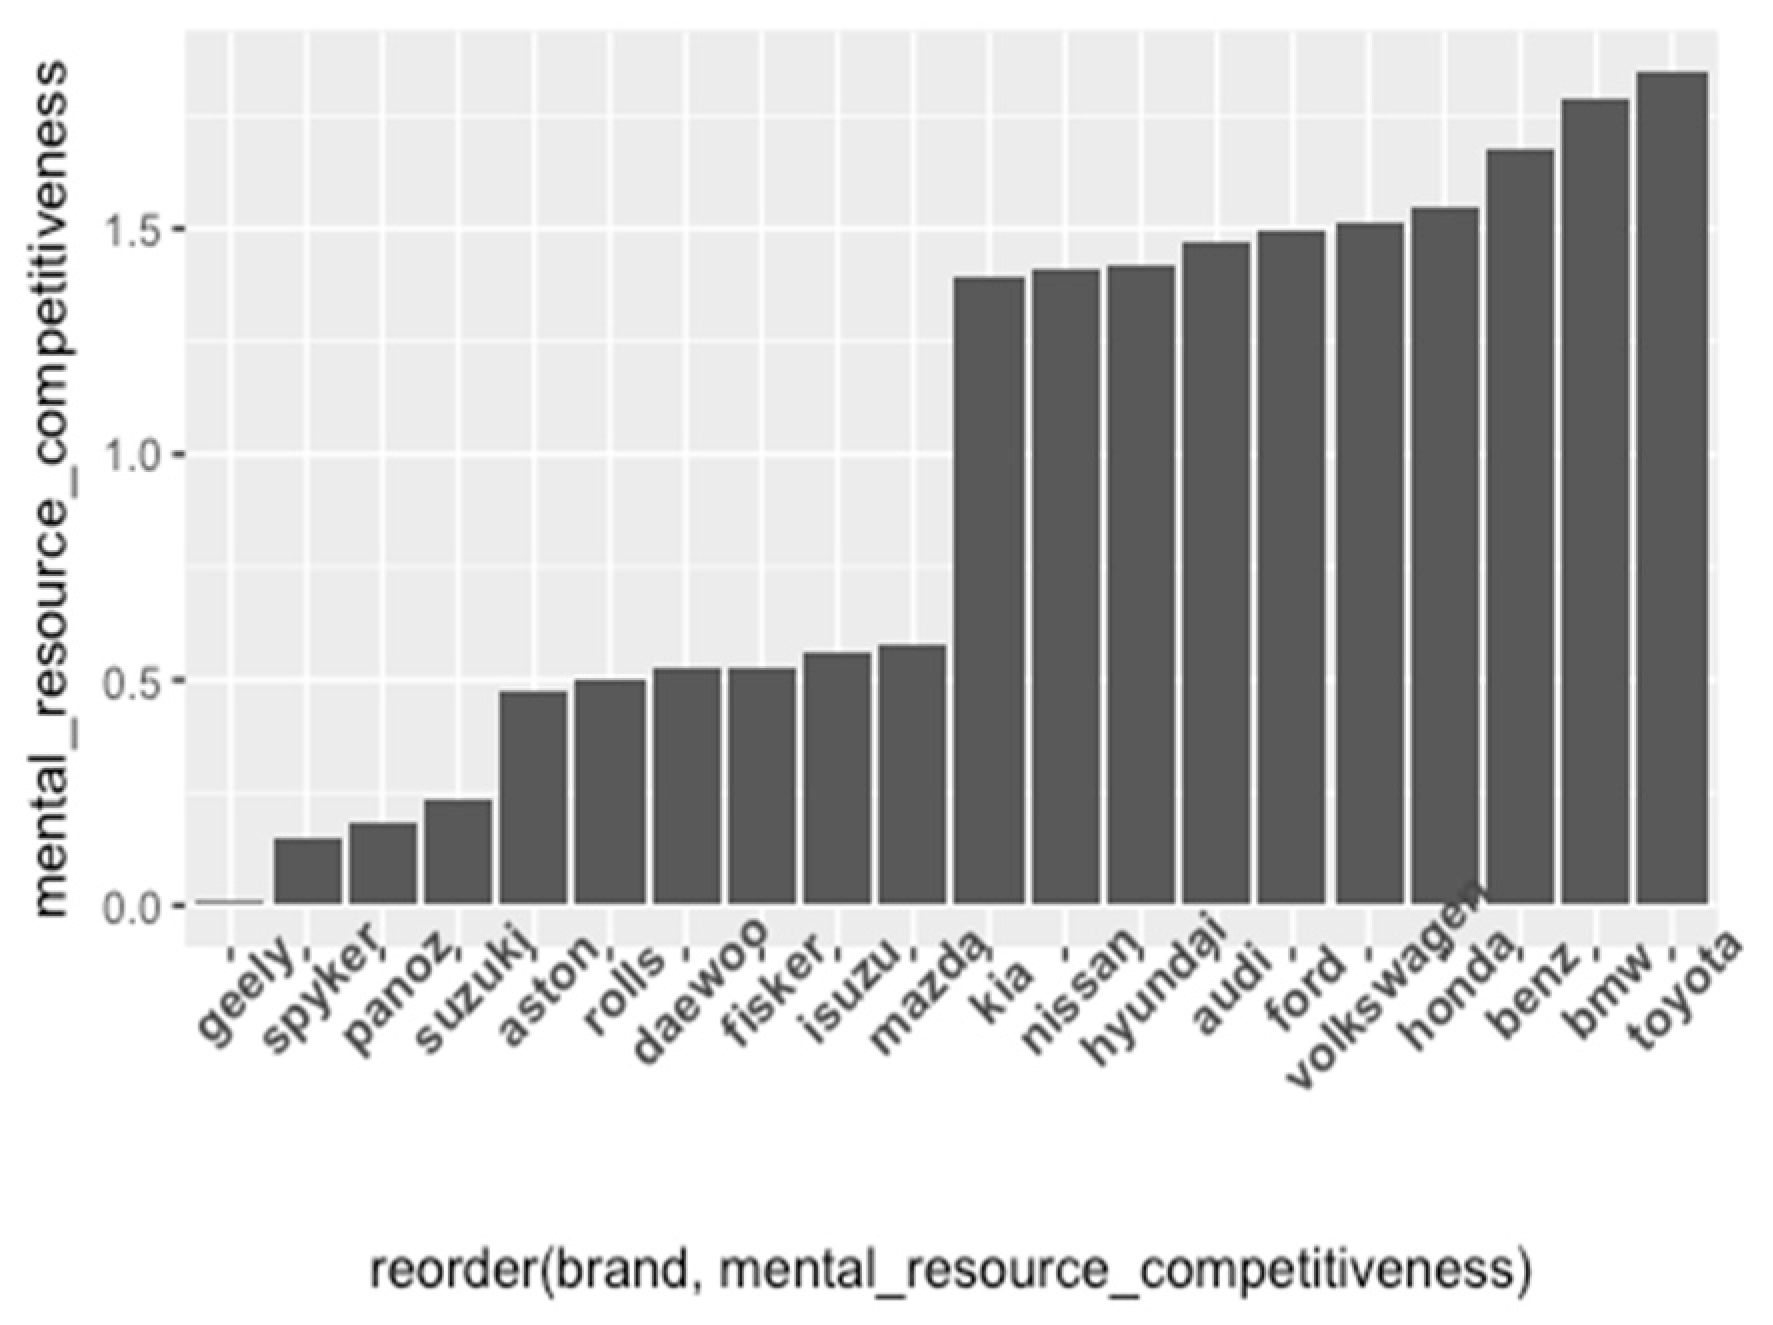
By setting the initial value as , we can automatically obtain the ranking of the brand-association-based competitiveness and assign a score to each brand. Figure 5D depicts the result of the algorithm iteration process, which shows that a stable resolution is reached within about 10 iterations. Figure 6 shows the first and last 10 brands among the 45 brands based on our procedure. We found that, according to our method, “Toyota” is the most competitive brand based on consumers; brand associations and “geely” is ranked the last among the 45 automobile brands.
We reordered the rows and columns of matrix M by decreasing } and increasing (Figure 5C), and found that the triangular structure is even more pronounced than after reordering the rows and column of matrix in terms of the brand and the association degree.
4. Validation and Robustness Check
4.1. Validations
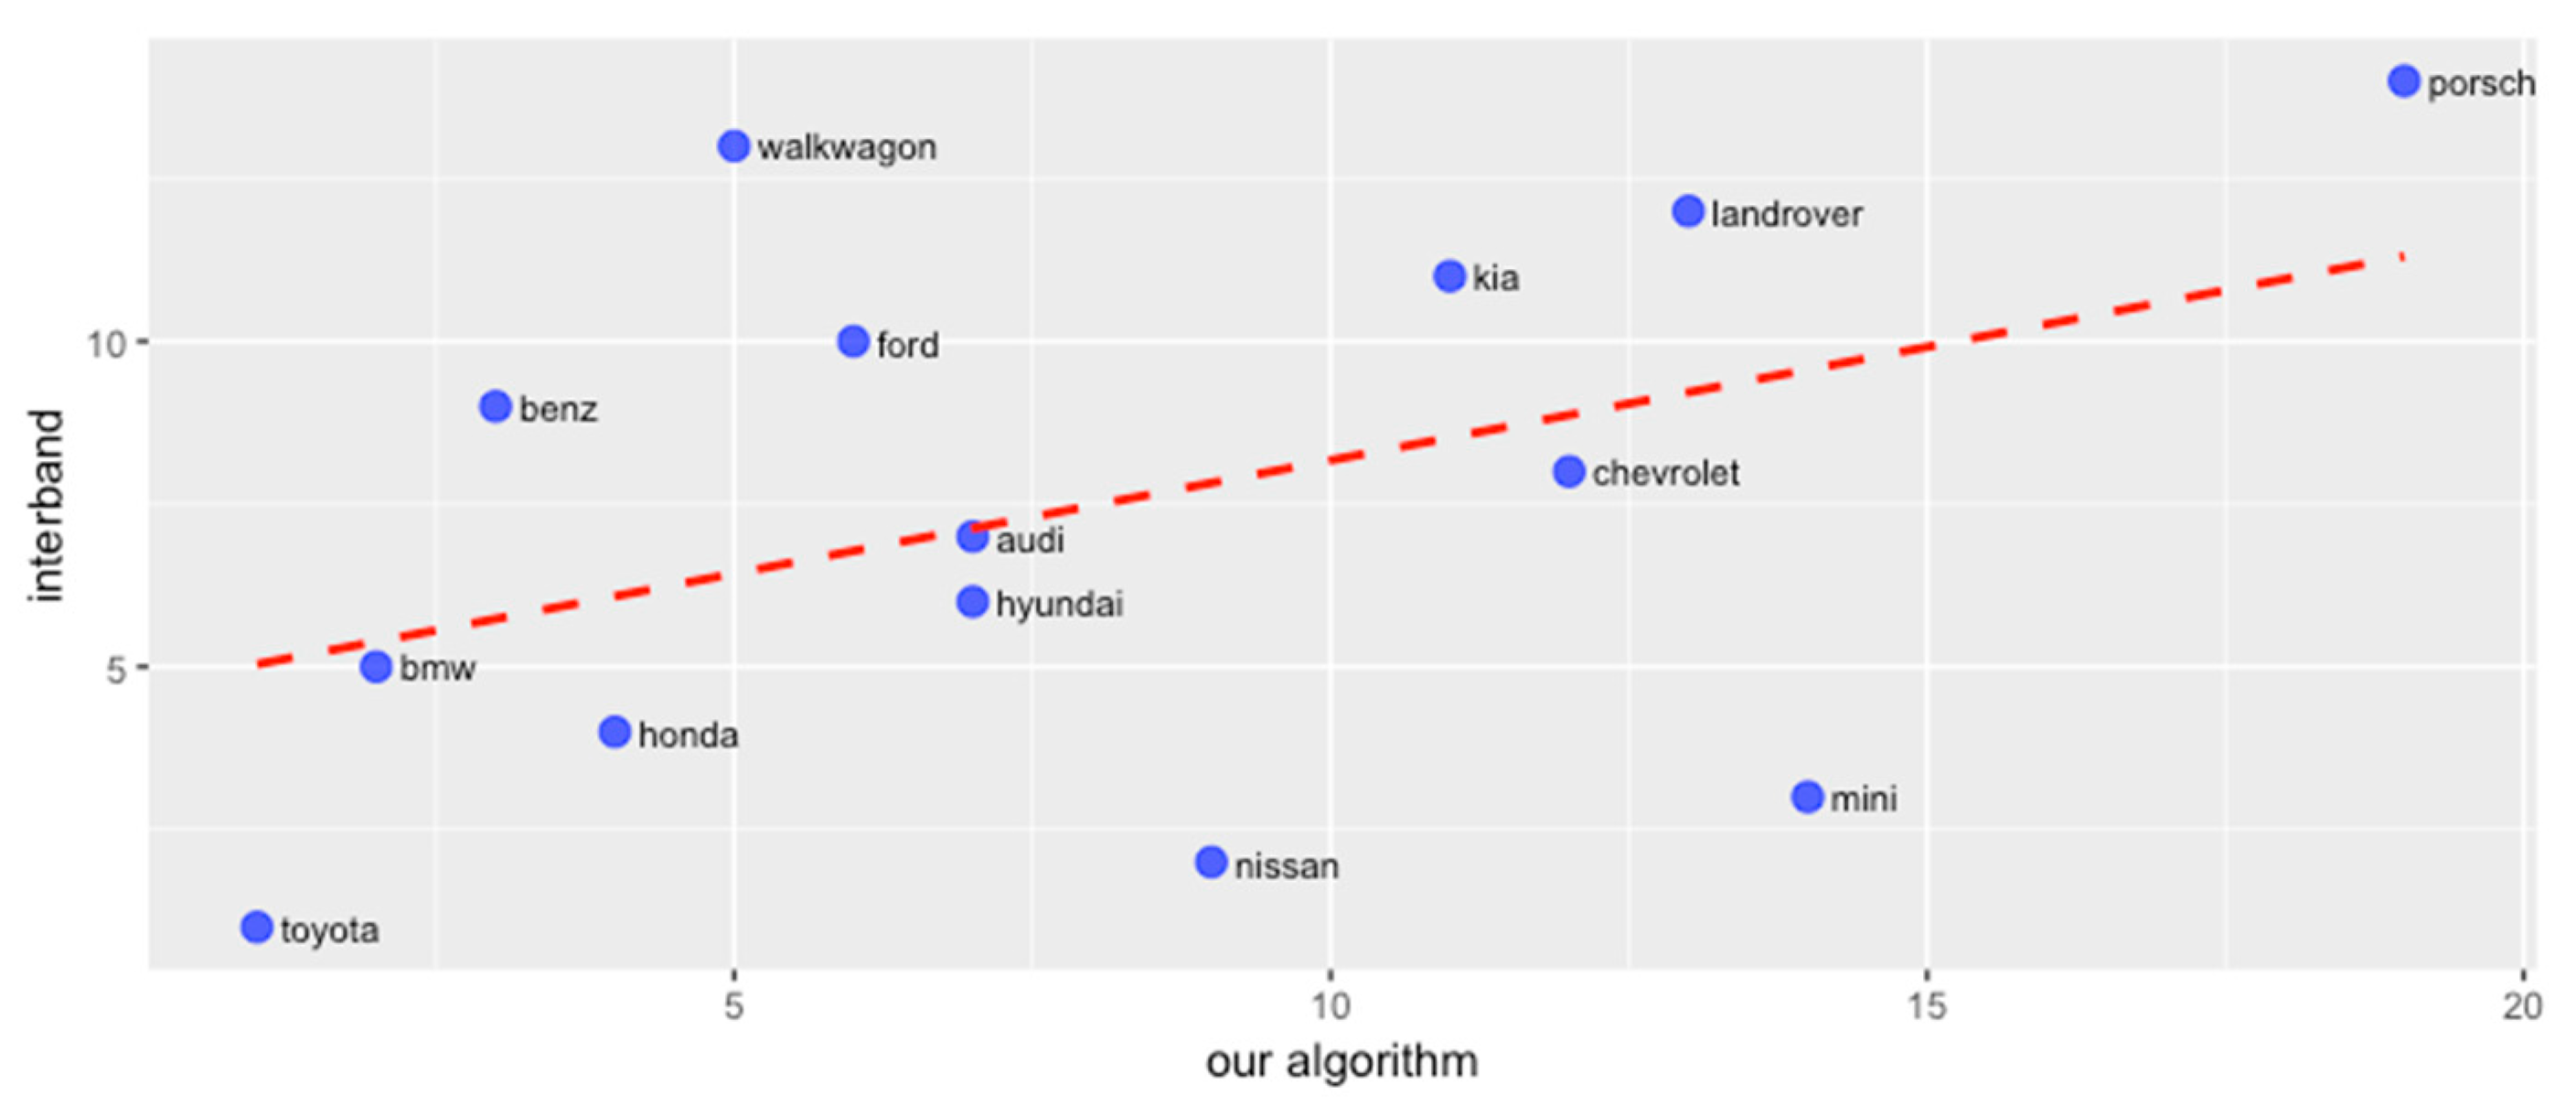
To test the validity of our method, we first compared brand rankings according to our algorithm with the ranking provided by Interbrand in the same year. We chose Interbrand since the Interbrand ranking has been used as a quantitative metric of brand value (or brand equity) according to the brand’s future financial returns [45,46], which reveal the long-term marketing successes of the brand [47]. As previously mentioned, sustainable brand competitiveness is related with the long-term marketing success or performance of the brand. We generally hypothesized that a brand with a high competitiveness value would be related to a higher ranking on Interbrand. Thus, we compared brand rankings by the obtained brand competitiveness values to those on Interbrand, in order to have a preliminary look at the validity of the proposed method.
We filtered out all the car brands from our brands list that were listed in the top 100 brands on Interbrand in 2015. In total, there were 14 car brands for the observation: “Toyota”, “Nissan”, “Mini Cooper”, “Honda”, “BMW”, “Hyundai”, “Audi”, “Chevrolet”, “Benz”, “Ford”, “Kia”, “Land rover”, “Volkswagen”, and “Porsche”. We compared the rank of these brands with the ranking of brands calculated by our algorithm. We found the brand rank computed by our algorithm was significantly positively correlated with the ranking provided by Interbrand ( = 0.61, t = 5.55, p < 0.01). As shown in Figure 7, the positive relationship reflects that our method may be used to capture a brand’s sustainable competitive information.
Next, to check the predictive validity of our method, we further directly elicited survey ratings on consumers’ perceived competitiveness of the 45 car brands. We verified the predictive effect of the product score obtained by our procedure in estimating consumers’ ratings on products’ competitiveness. We compared the forecasting effect of our method with brand equity, which is regarded as being highly related to brand competitiveness and is measured by the Young & Rubicam Brand Asset Valuator (Y&R BAV) model [7,48,49,50,51].
4.1.1. Participants
The survey data were collected through the platform Decipher, Inc. with 1800 (no less than 35 users per brand) representative participants of the U.S. populations, during October to December 2015. We used 1710 participants (male: 55.8%, average age = 30.63 years) who have completed the online survey for the analysis.
4.1.2. Measurement
No mature brand competitiveness scale is available; we measured competitiveness with 10 items (α = 0.85, a is the Cronbach’s alpha value). We asked participants to rate the item “I feel the brand is competitive” (1 = disagree strongly, 7 = agree strongly) and fill in Aaker’s [46] brand competence scale including nine additional items: “I feel the brand is technical”, “I feel the brand is successful”, “I feel the brand is reliable”, “I feel the brand is secure”, “ I feel the brand is intelligent”, “I feel the brand is corporate”, “I feel the brand is a leader”, “I feel the brand is confident”, and “I feel the brand is working hard”. All of these items are measured on a 7-point scale.
We measured brand equity with our survey since it has long been conceptualized as an important indicator of brand competitiveness in marketing research [6,16,49,51]. Brand equity was measured based on the four pillars of the Y&R BAV model [7,48,50], which has been labeled “the most ambitious effort to measure brand equity across products” [49]. These measures include differentiation (α = 0.90), relevance (α = 0.87), esteem (α = 0.93), and knowledge (α = 0.95) about the brand, following the study by Mizik and Jacobson [50]. We also included some other brand traits as control variables, such as brand newness and brand complexity, since product newness and product usage complexity may be potential factors that affect consumer brand or product perceptions [52,53]. Brand newness is defined as the time interval (in years) between the U.S. national commercial launch of the first brand of this product type to the brand’s commercial launch. Complexity (α = 0.91) was measured by 5 items according to Speier and Venkatesh [54], including “Getting used to (BRAND) requires a major learning effort”, “Getting used to (BRAND) takes a long time before one can fully understand the advantages”, “The product concept of (BRAND) is difficult to evaluate and understand”, “Overall, I believe that using (BRAND) is easy”, and “Using (BRAND) requires a lot of mental effort”. All items are scored on a 7-point scale. We also measured the usage of a brand by the percentage of respondents who stated that they use the brand occasionally or often. We also recorded consumer age in the survey. Table 2 provides the descriptive analysis and correlation analysis of the main variables.
4.1.3. Analysis and Results.
To check the predictive effectiveness of our method, we first regressed the perceived brand competitiveness with the brand equity (calculated using the four pillars in Y&R BAV) and other control variables to create model 1. Second, we included the brands’ competitive score obtained with our procedure in the regression model (model 2). The results are presented in Table 3.
We found that brand equity (0.09, p < 0.01) and the participants’ perceived complexity of product (0.28, p < 0.05) can positively affect participants’ perceived brand competitiveness. Importantly, when the brands’ competitiveness scores were added, the R2 value increased significantly from 0.50 to 0.71 (∆R2 = 0.21, p < 0.05), which means the goodness of fit in estimating consumers’ perceived brand competitiveness increased by adding the association-based competitiveness score. Additionally, by checking the estimating quality of the models with and without the brands competitive score, according to the Akaike Information Criterion(AIC) and Bayesian Information Criterion [55,56,57], we find both AIC and BIC value decreased in model 2, indicating model 2 is a better model for estimating consumers’ perceived brand competitiveness. Note, the average variance inflation factors were 2.25 and 2.62 (which are smaller than 10) in models 1 and 2, respectively, which means that the multicollinear problem does not exist here.
By examining the coefficients, we found that the predictive effect of the brand competitiveness score (0.47, p < 0.05) measured by our algorithm was almost four times of that of brand equity (0.11, p < 0.01). This validates that our method provides a good estimation of customers; perceived brand competitiveness.
4.2. Robustness
In the above analysis, we investigated the competitive structure of the 45 brands with the 1000 most popular tagged associations based on occurrence frequency. We expected that the selection of associations may affect the result of the brand’s relevant competitiveness. To investigate this, we randomly chose 500 tags from the 1000 tags. With the survey data, we compared the predictive effect of our method with the brand equity to estimate the consumers’ perceived brand competitiveness, and found a similar result as previously reported in Table 1. Again, when the brands’ competitive scores were added in model 2, the R2 value increased significantly from 0.50 to 0.69. And both AIC and BIC value decreased in model 2. The results are presented in Table 4 (variance inflation factors of the variables are all smaller than 10).
5. Discussion and Conclusions
With the development of social media, identifying brand competitive structures remains challenging. On the basis of the real-time, openness, relevance, and noiselessness of social tags, we introduced an efficient, low-cost, and real-time method of mining a brands’ competitive structure based on consumers’ brand associations. We validated our estimation against the data published by Interbrand and survey data collected in the same time window with 45 brands and 1000 tagged associations. With a correlation effect of 0.61 (brand rank of our procedure and Interbrand), and a better predictive effect than the well-known brand value model Y&R BAV in estimating the consumer-reported brand competitiveness, the results indicate that our method provides a reliable estimation of consumer association-specific brand competitiveness.
To the best of our knowledge, previous work mainly focused on how to use associative mapping and perceptual mapping to descriptively analyze brands [10,11,15]. Our proposed procedure is the first attempt to determine brand competitive structure based on the brand associations, and our method is innovative. First, through the construction of the weighted brand–tag association matrix, our procedure not only provides a holistic map of brand associations but also presents how consumers value each association for a given brand in group level according to our final algorithm.
Second, our method is among the first to determine the sustainable competitiveness of a brand based on the value of the brand’s associations. While previous literature has mainly discovered a brand’s competitive structure through consumers’ perceptions on limited attributes or associations [8,9,11,15], or with the brand value model given the financial outcomes [7,48,50], our method identifies the sustainable brand competitiveness based on a systematic and comprehensive understanding of the valuable, imitable, and irreplaceable brand associations. Furthermore, the triangular structure of the brand–tag association matrix indicates that the obtained brand competitiveness is sustainable, since it captures the evolutionary process of a competitive brand deep in consumers’ minds. This suggests that diverse and valuable associations will facilitate firms’ adaptation to the dynamic and changing market and achieve good long-term performance.
Third, we focused our analysis on the social tag platform Delicious. Though it is not used as frequently as other social media platforms, it is used by many social media platforms and is thus leveraged by firms for brand image and positioning marketing. Given the low-noise, cognitive, interactive, and individual-level characteristics of the text data in Delicious, our method used to estimate the brand competitive structure was proven to be reliable and robust.
The proposed method can be applied in many ways. Most directly, a brand’s competitive structure determined using our method can help managers to detect their close competitors and create their marketing strategies accordingly. Also, our method enables firms to discover their sustainable competitiveness based on consumers’ brand associations. Such an ability to learn and use consumers’ brand knowledge will guide firms towards long-term success [17].
The method can also be used in other common marketing tasks, for example, by reducing the need to comprehensively determine the competitiveness of the brand, the method can enable managers to effectively produce the brand associative and perceptional maps, with a focus on their chosen associations or attributes in the collected tag set. Marketing managers can also use our method to detect valuable associations contributing to a competitive brand in a given time window, and create their brand association and image strategy accordingly.
This study has several limitations that provide worthwhile avenues for further research. First, our research only examined social tags in the context of the automobile industry, albeit an industry of great importance in global economics, with products that highly engage consumers. Brands in other industries need to be further studied to improve the external validity of this procedure. In particular, other fields, such as different products, differ in regard to usage, price levels, and benefits which could lead to different effects. Second, the social tag data we used were generated entirely by users. Additional work could add more nuanced approaches, for example, in order to obtain a more representative set of brand associations and enable firms to have a more general understanding of the value of brand associations in regard to different benefits or attributes (e.g., hedonic benefits vs. utilitarian benefits). Text analysis could also be done to elicit and categorize the tagged brand associations. Third, we only explored the diversity and value of brand associations to determine the brand competitiveness. We encourage future researchers to develop this work further, for example, social network analysis could be implemented to establish a deeper understanding of how the brand association structure can determine sustainable brand competitiveness.
Overall, we hope that our work can provide a useful tool for marketing scholars and practitioners in brand analyses. We hope to have provided improvements in our understanding of brand competitive structure based on consumers’ minds at the group level, and we think that our method can be used as a tool for marketing research to help analyze social media data that affect brand value and to help practitioners to better leverage social media platforms to conduct brand investigations and formulate strategies.
Author Contributions
Conceptualization, Methodology, Software, Validation, Formal Analysis, Investigation, Resources, Data Curation, Visualization, Writing–Original Draft Preparation, X.G.; Writing–Review & Editing, Y.Z.; Supervision, Y.Z., R.A., R.G.
Funding
This research was funded by National Natural Science Foundation of China (Grant NO. 91746206), Supported by National Natural Science Foundation of China (Grant NO. 71672132), and MOE (Ministry of Education in China) Project of Humanities and Social Sciences (Project No. 18YJA630064).
Conflicts of Interest
The authors declare no conflict of interest.
References
- Ta, F. Industrial recruitment and economic development: A comparative analysis of competing south-eastern cities using perceptual mapping. J. Nonprofit Public Sect. Mark. 2004, 19, 460–468. [Google Scholar]
- Netzer, O.; Feldman, R.; Fresko, M.; Goldenberg, J. Mine Your Own Business: Market-Structure Surveillance Through Text Mining. Mark. Sci. 2012, 31, 521–543. [Google Scholar] [CrossRef]
- Ringel, D.M.; Skiera, B. Visualizing Asymmetric Competition Among More Than 1000 Products Using Big Search Data. Mark. Sci. 2016, 35, 511–534. [Google Scholar] [CrossRef]
- Colicev, A.; O’Connor, P.; Vinzi, V.E. Is Investing in Social Media Really Worth It? How Brand Actions and User Actions Influence Brand Value. Serv. Sci. 2016, 8, 152–168. [Google Scholar] [CrossRef]
- Sogari, G.; Pucci, T.; Aquilani, B.; Zanni, L. Millennial Generation and Environmental Sustainability: The Role of Social Media in the Consumer Purchasing Behavior for Wine. Sustainability 2017, 9, 1911. [Google Scholar] [CrossRef]
- Netemeyer, R.G.; Krishnan, B.; Pullig, C.; Wang, G.; Yagci, M.; Dean, D.; Ricks, J.; Ferdinand, W. Developing and validating measures of facets of customer-based brand equity. J. Bus. Res. 2004, 57, 209–224. [Google Scholar] [CrossRef]
- Stahl, H.M.; Lehmann, D.; Neslin, S. The impact of brand equity on customer acquisition, retention, and profit margin. J. Mark. 2012, 76, 44–63. [Google Scholar] [CrossRef]
- John, D.R.; Monga, A.B. Brand Concept Maps: A Methodology for Identifying Brand Association Networks. J. Mark. Res. 2006, 43, 549–563. [Google Scholar] [CrossRef]
- Till, B.D.; Daniel, B.; Brian, W. Strategic brand association maps: Developing brand insight. J. Prod. Brand Manag. 2011, 20, 92–100. [Google Scholar] [CrossRef]
- Bijmolt, T.H.A.; van de Velden, M. Multiattribute perceptual mapping with idiosyncratic brand and attribute sets. Mark. Lett. 2012, 23, 585–601. [Google Scholar] [CrossRef] [Green Version]
- Culotta, A.; Cutler, J. Mining Brand Perceptions from Twitter Social Network. Mark. Sci. 2016, 35, 343–362. [Google Scholar] [CrossRef]
- Tirunillai, S.; Tellis, G.J. Mining Marketing Meaning from Online Chatter: Strategic Brand Analysis of Big Data Using Latent Dirichlet Allocation. J. Mark. Res. 2014, 51, 463–479. [Google Scholar] [CrossRef]
- Nam, H.; Joshi, Y.V.; Kannan, P.K. Harvesting Brand Information from Social Tags. J. Mark. 2017, 81, 88–108. [Google Scholar] [CrossRef]
- Min, H.; Yun, J. Analyzing dynamic change in customer requirements: An approach using review-based Kano analysis. Sustainability 2018, 10, 746. [Google Scholar] [CrossRef]
- Joiner, C. Concept Mapping in Marketing: A Research Tool for Uncovering Consumers’ Knowledge Structure Associations. Adv. Consum. Res. 1998, 25, 311–322. [Google Scholar]
- Keller, K.L. Conceptualizing, Measuring, and Managing Customer-Based Brand Equity. J. Mark. 1993, 57, 1–22. [Google Scholar] [CrossRef]
- Hunt, S.D. The Strategic Imperative and Sustainable Competitive Advantage: Public Policy Implications of Resource-Advantage Theory. J. Acad. Mark. Sci. 1999, 27, 144–159. [Google Scholar] [CrossRef]
- Barney, J.; Wright, M.; Ketchen, D. The resource-based view of the firm: Ten years after 1991. J. Manag. 2001, 27, 625–641. [Google Scholar] [CrossRef]
- Nam, H.; Kannan, P.K. The Informational Value of Social Tagging Networks. J. Mark. 2014, 78, 21–40. [Google Scholar] [CrossRef]
- Raaijmakers, J.G.W.; Shiffrin, R.M. Search of Associative Memory. Psychol. Rev. 1981, 88, 93–134. [Google Scholar] [CrossRef]
- Ries, A.; Trout, J. Positioning: The Battle for Your Mind; McGraw-Hill: New York, NY, USA, 2001; ISBN 0-07-137358-6. [Google Scholar]
- Collins, A.M.; Loftus, E.F. A Spreading Activation Theory of Semantic Processing. Psychol. Rev. 1975, 82, 407–428. [Google Scholar] [CrossRef]
- Anderson, J.R. The Architecture of Cognition; Harvard University Press: Cambridge, MA, USA, 1983. [Google Scholar]
- Wyer, R.S.; Srull, T.K. Person Memory and Judgment. Psychol. Rev. 1989, 96, 58–83. [Google Scholar]
- Craik, F.I.M.; Lockhart, R.S. Levels of Processing: A Framework for Memory Research. J. Verbal Learn. Verbal Behav. 1972, 11, 671–684. [Google Scholar] [CrossRef]
- Craik, F.I.M.; Tulving, E. Depth of Processing and the Retention of Words in Episodic Memory. J. Exp. Psychol. 1975, 104, 268–294. [Google Scholar] [CrossRef]
- Lockhart, R.S.; Craik, F.I.M.; Jacoby, L. Depth of Processing, Recognition and Recall. In Recall and Recognition; Brown, J., Ed.; John Wiley & Sons, Inc.: New York, NY, USA, 1976. [Google Scholar]
- Wernerfelt, B.A. A Resource-Based View of the Firm. Strateg. Manag. J. 1984, 21, 981–996. [Google Scholar] [CrossRef]
- Zaltman, G.; Coulter, R.H. Seeing the Voice of the Customer: Metaphor-Based Advertising Research. J. Advert. Res. 1995, 35, 35–51. [Google Scholar]
- Zaltman, G. Rethinking Market Research: Putting People Back In. J. Mark. Res. 1997, 35, 424–437. [Google Scholar] [CrossRef]
- Amit, R.; Shoemaker, P.J.H. Strategic Assets and Organizational Rents. Strateg. Manag. J. 1993, 14, 33–46. [Google Scholar] [CrossRef]
- Lee, T.Y.; Bradlow, E.T. Automated Marketing Research Using Online Customer Reviews. J. Mark. Res. 2011, 48, 881–894. [Google Scholar] [CrossRef]
- Sonnier, G.; McAlister, L.; Rutz, O. A dynamic model of the effect of online communications on firm sales. Mark. Sci. 2011, 30, 702–716. [Google Scholar] [CrossRef]
- Ludwig, S.; de Ruyter, K.; Friedman, M.; Brüggen, E.; Wetzels, M.; Pfann, G. More than words: The influence of affective content and linguistic style matches in online reviews on conversion rates. J. Mark. 2013, 77, 87–103. [Google Scholar] [CrossRef]
- Pennebaker, J.; Chung, C.; Ireland, M.; Gonzales, A.; Booth, R. The Development and Psychometric Properties of LIWC 2007; LIWC.Net: Austin, TX, USA, 2007. [Google Scholar]
- Strohmaier, M.; Koörner, C.; Kern, K. Why Do Users Tag? Detecting Users’ Motivation for Tagging in Social Tagging Systems; Association for the Advancement of Artificial Intelligence: Palo Alto, CA, USA, 2010; pp. 339–342. [Google Scholar]
- Lapersonne, E.L.; Laurent, G.; Le Gpff, J.-J. Consideration Sets of Size One: An Empirical Investigation of Automobile Purchases. Int. J. Res. Mark. 1995, 12, 55–66. [Google Scholar] [CrossRef]
- Lever, W.F. Mobile Industry and Levels of Integration in Subregional Economic Structures. Reg. Stud. 2007, 9, 265–278. [Google Scholar] [CrossRef]
- Zhao, Y.; Parente, R.C. Modularization and Complexity in Automobile Industry; Academy of Management Proceedings: Altanta, GA, USA, 2017; Volume 1, p. 16940. [Google Scholar]
- Katz, M.L.; Shapiro, C. Network externalities, competition, and compatibility. Am. Econ. Rev. 1985, 75, 424–440. [Google Scholar]
- Balassa, B. Trade Liberalization and ‘Revealed’ Comparative Advantage; Manchester School: Manchester, UK, 1965; Volume 33. [Google Scholar]
- Robu, V.; Halpin, H.; Shepherd, H. Emergence of Consensus and Shared Vocabularies in Collaborative Tagging Systems. ACM Trans. Web 2009, 3, 14. [Google Scholar] [CrossRef]
- Hinegardner, R.; Engelberg, J. Biological complexity. J. Theor. Biol. 1983, 104, 7–20. [Google Scholar] [CrossRef]
- Adami, C.; Ofria, C.; Collier, T.C. Evolution of biological complexity. Proc. Natl. Acad. Sci. USA 2000, 97, 4463–4468. [Google Scholar] [CrossRef] [Green Version]
- Chu, S.; Keh, H.T. Brand value creation: Analysis of the Interbrand-Business Week brand value rankings. Mark. Lett. 2006, 17, 323–331. [Google Scholar] [CrossRef]
- Johansson, J.K.; Dimofte, C.V.; Mazvancheryl, S.K. The performance of global brands in the 2008 financial crisis: A test of two brand value measures. Soc. Sci. Electron. Publ. 2012, 29, 235–2345. [Google Scholar] [CrossRef]
- Morbi, A. The Five Factors of Growth: Measures of a Breakthrough Brand; Interbrand: Brisbane, Australia, 2019. [Google Scholar]
- Fudge, A. Brand Energy: A Compass for Navigating Troubled Waters. In Proceedings of the Marketing Science Institute Conference on Connecting with Customers in a Complex World, Chicago, IL, USA, 3–4 November 2005. [Google Scholar]
- Aaker, D.A. Measuring Brand Equity Across Products and Markets. Calif. Manag. Rev. 1996, 38, 102–120. [Google Scholar] [CrossRef]
- Mizik, N.; Jacobson, R. The Financial Value Impact of Perceptual Brand Attributes. J. Mark. Res. 2008, 45, 15–32. [Google Scholar] [CrossRef]
- Shelby, D.H. The ethics of branding, customer-brand relationships, brand-equity strategy, and branding as a societal institution. J. Bus. Res. 2019, 95, 408–416. [Google Scholar]
- Stremersch, S.; Dellaert, B.G.C. Marketing Mass-Customized Products: Striking a Balance between Utility and Complexity. J. Mark. Res. 2005, 42, 219–227. [Google Scholar]
- Slater, S.F.; Mohr, J.J.; Sengupta, S. Radical Product Innovation Capability: Literature Reviews, Synthesis, and Illustrative Research Propositions. J. Prod. Innov. Manag. 2014, 31, 552–556. [Google Scholar] [CrossRef]
- Speier, C.; Vebjatesh, V. The hidden minefields in the adoption of sales force automation technologies. J. Mark. 2002, 66, 98–111. [Google Scholar] [CrossRef]
- Akaike, H. Information theory and an extention of the maximum likelihood principle. In Proceedings of the International Symposium on Information Theory, Tsahkadsor, Armenia, 2–8 September 1971; Amaos Academiai Kiado: Budapest, Hungary, 1973; Volume 2, pp. 267–281. [Google Scholar]
- Akaike, H. A new look at the statistical model identification. IEEE Trans. Autom. Control 1974, 19, 716–723. [Google Scholar] [CrossRef]
- Schwarz, G.E. Estimating the dimension of a model. Ann. Stat. 1978, 6, 461–464. [Google Scholar] [CrossRef]
Figure 1.
Illustration of bookmarks and social tags in Delicious with input of “Audi”. (A) illustrates the snapshot of bookmarks about “Audi” in Delicious. (B) shows the visual illustration of social tags linked to “Audi”. And (C) presents the visual illustration of social tags linked to “Audi” and its competitors including “Bmw”, “Ford”, “Chryster”, and “acura”.

Figure 2.
Overall procedure process.

Figure 3.
Density distribution of social tags for automobile brands. (A): Density distribution of the overall social tags (or associations); (B): Density distribution of the selected social tags (or associations); (C) Bar chart of the ten most frequently tagged associations in the selected social tags.


Figure 4.
Visualization of the brand association competitive structure: (A) the two-dimensional (2D) competitive structure of the 45 brands with respect to the two tagged associations “art” and “social”; (B) the three-dimensional (3D) competitive structure of the 45 brands with respect to the three tagged associations: “art”, “social”, and “engineering”.

Figure 5.
(A) Graphical representation of matrix M after reordering columns and rows by decreasing and . (B) Graphical representation of a random binary matrix after reordering columns and rows by decreasing and . (C) Graphical representation of matrix M after reordering columns and rows by decreasing brand competitiveness and association uniqueness value . (D) Mathematical process of the brand competitiveness in the algorithm iteration.

Figure 6.
Bar chart of association-based competitiveness of the last and top ten brands.

Figure 7.
Comparison of automobile brand rankings of our algorithm and those provided by Interbrand.
Figure 7.
Comparison of automobile brand rankings of our algorithm and those provided by Interbrand.


Table 1.
List of the automobile brands.
| Car Brands in the Study | ||||
|---|---|---|---|---|
| Corvette | Lamborghini | Ford | Honda | Harley Davidson |
| Toyota | Benz/Mercedes Benz | Jeep | Volvo | Nissan |
| Firestone | ExxonMobil | Buick | Jiffy Lube | Lincoln |
| Pep Boys | Ferrari | Audi | Infiniti | Pontiac |
| Land Rover/Range Rover | Mitsubishi | Mini/Mini Cooper | Saab | Yamaha |
| BMW | Lexus | Volkswagen | Subaru | Hyundai |
| Good Year Tires | Jaguar | Cadillac | Mazda | Kia |
| Porsche | GMC | Chrysler | Mercury | Suzuki |
| Chevrolet | Autozone | Dodge | Acura | GM |
Table 2.
Correlation analysis.
| Variables | Mean | S.D | 1 | 2 | 3 | 4 | 5 | 6 | 7 |
|---|---|---|---|---|---|---|---|---|---|
| Perceived competitivity | 3.5505 | 0.2893 | 1 | ||||||
| Brand equity | 2.9643 | 2.0874 | 0.6252 * | 1 | |||||
| Product complexity | 1.8938 | 0.3310 | 0.1397 | −0.2286 | 1 | ||||
| Usage | 6.4044 | 8.4325 | 0.1442 | 0.3806 | −0.4322 * | 1 | |||
| Age | 30.6306 | 11.8288 | 0.3080 | 0.5008 * | −0.2548 | 0.2574 | 1 | ||
| Brand Newness | 43.8926 | 34.2965 | −0.1344 | −0.3522 | −0.1833 | −0.2665 | 0.8303 * | 1 | |
| Our algorithm | 0.6289 | 0.1764 | 0.2348 | 0.0643 | −0.1221 | −0.0331 | 0.1926 | 0.2165 | 1 |
Note: * indicates p-value < 0.05.
Table 3.
Comparison of modelling effectiveness.
| Independent Variables | Dependent Variables | |||
|---|---|---|---|---|
| Perceived Product Competitiveness | ||||
| Model 1 | Model 2 | |||
| Coefficient | p-Value | Coefficient | p-Value | |
| Intercept | 2.43 *** | 0.00 | 1.75 *** | 0.00 |
| (0.32) | (0.40) | |||
| Brand equity(asset) | 0.09 *** | 0.00 | 0.11 *** | 0.00 |
| (0.02) | (0.02) | |||
| Product complexity | 0.28 ** | 0.03 | 0.38* | 0.02 |
| (0.13) | (0.15) | |||
| Usage | 0.01 | 0.83 | −0.02 | 0.08 |
| (0.05) | (0.01) | |||
| Age | 0.03 | 0.16 | 0.01 * | 0.02 |
| (0.02) | 0.00 | |||
| Brand Newness | 0.03 | 0.12 | 0.04 | 0.09 |
| (0.02) | (0.02) | |||
| Our_algorithm | 0.00 | 0.47 * | 0.03 | |
| (0.20) | ||||
| R_square | 0.50 | 0.71 | ||
| AIC | −2.34 | −10.10 | ||
| BIC | 8.22 | −0.29 | ||
Note: Numbers in parentheses are standard errors. * p < 0.05, ** p < 0.01, *** p < 0.001.
Table 4.
Comparison of modelling effectiveness.
| Independent Variables | Dependent Variables | |||
|---|---|---|---|---|
| Perceived Product Competitiveness | ||||
| Model 1 | Model 2 | |||
| Coefficient | p-Value | Coefficient | p-Value | |
| Intercept | 2.43 *** | 0.00 | 1.93 *** | 0.00 |
| (0.32) | (0.53) | |||
| Brand equity(asset) | 0.09 *** | 0.00 | 0.13 *** | 0.00 |
| (0.02) | (0.02) | |||
| Product complexity | 0.28 ** | 0.03 | 0.35 * | 0.05 |
| (0.13) | (0.23) | |||
| Usage | 0.01 | 0.83 | −0.02 | 0.13 |
| (0.05) | (0.03) | |||
| Age | 0.03 | 0.16 | 0.02 * | 0.05 |
| (0.02) | 0.00 | |||
| Brand Newness | 0.03 | 0.12 | 0.03 | 0.11 |
| (0.02) | (0.03) | |||
| Our_algorithm | 0.00 | 0.41 * | 0.04 | |
| (0.30) | ||||
| R_square | 0.50 | 0.69 | ||
| AIC | −2.34 | −9.02 | ||
| BIC | 8.22 | −0.25 | ||
Note: Numbers in parentheses are standard errors. * p < 0.05, ** p < 0.01, *** p < 0.001.
© 2019 by the authors. Licensee MDPI, Basel, Switzerland. This article is an open access article distributed under the terms and conditions of the Creative Commons Attribution (CC BY) license (http://creativecommons.org/licenses/by/4.0/).
Share and Cite
MDPI and ACS Style
Gong, X.; Zhu, Y.; Ali, R.; Guo, R. Capturing Associations and Sustainable Competitiveness of Brands from Social Tags. Sustainability 2019, 11, 1529. https://doi.org/10.3390/su11061529
AMA Style
Gong X, Zhu Y, Ali R, Guo R. Capturing Associations and Sustainable Competitiveness of Brands from Social Tags. Sustainability. 2019; 11(6):1529. https://doi.org/10.3390/su11061529
Chicago/Turabian StyleGong, Xuan, Yunchan Zhu, Rizwan Ali, and Ruijin Guo. 2019. "Capturing Associations and Sustainable Competitiveness of Brands from Social Tags" Sustainability 11, no. 6: 1529. https://doi.org/10.3390/su11061529
Note that from the first issue of 2016, this journal uses article numbers instead of page numbers. See further details here.