A Regional Sustainable Intensive Land Use Evaluation Based on Ecological Constraints: A Case Study in Jinan City


1
School of Information Engineering, China University of Geosciences, Beijing 100083, China
2
School of Economic and Management, China University of Geosciences, Beijing 100083, China
3
Polytechnic Center for Territory Spatial Big-Data, MNR of China, Beijing 100036, China
*
Authors to whom correspondence should be addressed.
Sustainability 2019, 11(5), 1434; https://doi.org/10.3390/su11051434
Submission received: 17 January 2019
/
Revised: 27 February 2019
/
Accepted: 3 March 2019
/
Published: 8 March 2019
Abstract
:Intensive development is a sign of human social progress, and moderate intensification is a continuously pursued goal. However, how to conduct a moderately intensive land use evaluation remains a challenge. To solve this problem, this research proposes the concept of sustainable intensification variable and develops a sustainable intensification variable model to determine the appropriate interval of regional intensive land use and evaluate the intensification of land use. The evaluation method of the sustainable intensification variable model is based on the principle and method of the intensification variable, and the regional sustainable development evaluation factors in the model are revised based on rational land use and ecological constraints. To verify the rationality of the model and systematically evaluate the intensification of land use in the city of Jinan, this method was tested using land use data and social economic data on Jinan from 2001, 2011, and 2015. The results show that the model has a high accuracy in judging the moderately intensive interval of regional land use and evaluating intensive land use, and has important reference value for regional sustainable development decision-making.
1. Introduction
With the rapid development of the social economy, urbanization has become an inevitable trend of future human development. During this process, the effects of planning lag and blind construction have caused cities to pay a heavy resource and environmental cost in development, and city problems have become increasingly prominent. The path to sustainable development is a concrete response to the uncoordinated problem of city social economic development with environmental protection; thus, it is the best choice for the future development of cities. A widely recognized concept of sustainable development was proposed by the World Commission on Environment and Development (WECD), which provided the following authoritative definition: “Sustainable development is a development that can meet the needs of the present without jeopardizing the ability of future generations to meet their needs [1].” In 1987, the committee provided a comprehensive and detailed explanation of sustainable development for the first time in the report “Our Common Future”. The discussion regarding environmental and developmental issues was widely recognized by the international community. The core of sustainable development is development, which includes not only reaching the goal of economic development, but also promoting the social system’s continuous progress and improving the population’s quality, as well as protecting the natural resources and environment on which human beings depend. Sustainable development is a systematic science with complex structures. Therefore, theories and practices of sustainable development can be studied from different dimensions, perspectives, levels, and scales. From the aspect of subject field, integrating multidisciplinary methods, such as economics, sociology, and environmental science, can help to research sustainable development. From the aspect of contributing factors, paying more attention to the economic and social causes of sustainable development helps to research sustainable development. From the aspect of research objects, studying natural, social, and economic composite systems at the global, national, regional, and small- and medium- scales can also help with research. From the aspect of mechanisms, studying the requirements of sustainable development for technology, systems, and culture helps with research. From the aspect of theoretical systems and practical research, constructing the theoretical system of sustainable development, combined with different regions for analysis, evaluation, and suggestion [1,2,3] also helps a lot. Integrating the concept and connotation of sustainable development and defining the meaning of regional sustainable development: the regional sustainable development refers to the coordinated and sustained development of the regional society, economy, and environment; that is, on a certain temporal and spatial scale with the ecologically sustainable population, high-quality labor, high-quality economic growth, an advanced industrial structure, comprehensive economic benefits, and an environmental quality that is pollution free or less polluting, to achieve the integration of regional development benefits to promote urbanization and meet the needs of inter-generational regional development [4]. Scholars worldwide have conducted qualitative and quantitative research and evaluations of sustainable development from the perspectives of exploring the measures and approaches to achieve sustainable development [5,6,7], establishing an evaluation index system of sustainable development and formulating comprehensive evaluation indicators [8,9,10].
City land, which is a basic element of city social production and consumption, is not only a direct carrier of city populations and various social and economic activities, but also an indispensable resource for city social and economic activities. The sustainable use of city land directly affects the realization of regional sustainable use goals and sustainable development in regional areas [11].
The fundamental method used for the sustainable use of city land is to achieve an intensive use of city land. In regional sustainable development, the intensive use of land is a useful attempt to solve the outstanding problem of demand for resources during the process of regional development from the perspective of land [12]. Practice has proven that adjusting the city land use mode and increasing the element investment level of the unit land area can improve the level of city intensive land use, which solves the problem of land waste to some extent and resolves the contradiction between city development and cultivated land protection [13]. However, over- emphasis on intensive use will lead to regional congestion and ecological imbalance [14]. Therefore, exploring the reasonable input range of the capital and labor elements of intensive land use has important practical significance for effectively protecting cultivated land, alleviating the current tension of land-use development in the region, and subsequently forming a city land use system with a reasonable structure, complementary functions, and the optimum comprehensive benefits.
Researchers have conducted a series of studies to investigate the connotations, influencing factors, index systems, and evaluation methods for the intensive use of regional land resources. Among them studies, various statistical analysis and spatial analysis methods have been applied in the field of intensive land use evaluation, such as the construction of an index system evaluation method [15], a model establishment method [16,17,18], a comprehensive evaluation method [19,20], and a temporal and spatial difference method [21,22,23]. The current evaluation index system of intensive land use is mostly constructed based on the definition of intensive use. After the index system construction, weight determination is critical for evaluation. The determination method involves a principal component analysis method [24,25,26,27,28], the entropy method [29,30], and an analytic hierarchy process method [31,32]. Because of the subjectivity of the index selection and the complexity of the determination of ideal value, the evaluation of intensive land use in empirical analysis is not comprehensive. Due to the rapid development of information technology, technologies such as remote sensing (RS) and geographic information systems (GISs) have been gradually applied to the land evaluation process and helped establish a series of related models, including a comprehensive evaluation of intensive land use [33,34,35]. Among these models, in the evaluation of city land intensive use, evaluation models based on multi-region, multi-type, and multi-level (MR-MT-ML) method [36], multi-objective programming model [37], the neural network model [38,39,40], spatial panel ordering-response probability models [41], and cloud models [42] are used in intensive land use evaluation studies in different countries and regions. In addition, the global urban footprint (GUF) model, the sequential slack-based measure (SSBM) model [43], the land transformation model (LTM), and the IMAGE1 model are used in research investigating intensive land use evaluation, and technological innovation provides new support for the development of land evaluation. The comprehensive evaluation method includes the fuzzy comprehensive evaluation method [44], and the space-time difference assessment method [45,46,47,48] based on the geographic information system or remote sensing technology are also applied to the study of intensive land use evaluation with the maturity of technology. Existing index system construction methods used in studies exploring city intensive land use can effectively quantify the indicators and comprehensively reflect the overall land utilization. However, due to subjectivity in the selection in indicators and the complexity of determining the ideal value, the evaluation of intensive land use in empirical analysis is not comprehensive or objective enough. Building a model can quantitatively analyze the intensive utilization of city land and its driving factors to a certain extent. However, due to limitations in technical means and data acquisition, it is difficult to quantify the social factors that have an important impact on intensive land use, thus affecting the accuracy of quantitative analysis of intensive land use evaluation models.
Various methods used for the evaluation of intensive land use have advantages and disadvantages, which are evaluated separately for one or several aspects of intensive land use. Current research exploring the evaluation of intensive regional land use has produced a series of research results, but most scholars focus only on the overall and comprehensive research of land resources and do not provide a comprehensive consideration of regional healthy and rational development. However, the analysis of the quality, intensity, and substitution among socio-economic activities and intensive land utilization are insufficient, and the comprehensive consideration of regional health and rational and sustainable development under intensive land utilization is lacking, ignoring the negative impacts of capital and labor factor over-investment on land use, and therefore, the many negative impacts on regional sustainable development. To determine the reasonable interval of the intensive use of regional land resource, this research introduces the concept of sustainable development to correct for the intensification variable [49] and analyze the level of regional intensive land use. Intensification variable uses simple mathematical functions to simulate complex social and economic activities. Studying the characteristics of various functions helps to achieve the purpose of understanding the laws of social and economic activities, and the internal mechanism between social economic activities and intensive land utilization is determined. Therefore, the intrinsic mechanism between social economic activities and the intensive land use degree is deeply studied, which can reflect the intensive status of land use in a region to a certain extent. The regional sustainable development of intensification variable is corrected, then the reasonable element input range of intensive land use under the current scientific and technological level are analyzed, and the impact of future social and economic activities on sustainable intensive land use are predicted. Based on the principle of balancing social benefits, ecological benefits, and economic benefits, the improvements to the intensive city land use policy system will be proposed to overcome the shortcomings of existing research. The ecological carrying capacity evaluation index of land resources [50] and the rationality evaluation index of land use were selected as the determined indicators for judging the sustainability of natural resources in the study area. Based on relevant studies, the quantitative evaluation model of sustainable intensive regional land, which is based on intensification variable theory, uses regional sustainable development theory as a revision to establish the model. By evaluating the sustainable intensive land use of Jinan City, Shandong Province, and the 10 districts (counties) under the jurisdiction of Jinan City, the two dimensions of time and space are evaluated to determine the appropriate intensive use of land and judge the current level of intensive land use in the study area. We aim to explore a regional quantitative evaluation method for intensive land use and provide a reference for promoting the moderate and intensive use of regional land.
2. Materials and Methods
2.1. Introduction to the Study Area, Data Resources, and Processing
Located in the central part of Shandong Province, Jinan City is known as the “Quan City” because of its many springs. Jinan is the provincial capital of Shandong Province. It has jurisdiction over eight districts and two counties. The total administrative area is approximately 8177.21 square kilometers. At the end of 2015, the resident population was approximately 7.06 million. The Capital Economic Circle is located in the north, and the Yangtze River Delta Economic Circle located in the south, so Jinan is an important intersection between the Bohai Rim Economic Zone and the Beijing-Shanghai Economic Axis, and is one of the central cities in the Bohai region and the middle and lower reaches of the Yellow River. The unique geographical location of Jinan accelerates its economic development and urbanization process, while the special terrain of Jinan, which lies across the Yellow River to the north and depends on Mount Tai to the south, results in the limited development and utilization of some land resources in the administrative area, which has intensified the contradiction of land utilization in the development of Jinan City. The provision of policy recommendations for local governments based on the evaluation results could benefit the future development in Jinan City. Jinan City has jurisdiction over eight districts and two counties, namely, Lixia district, Shizhong district, Huaiyin district, Tianqiao district, Licheng district, Changqing district, Pingyin county, Jiyang county, and Zhangqiu district. The social and economic development of the different districts and counties, the types and structures of land resources are quite different. Jinan City and the eight districts and two counties under its jurisdiction are selected to be research areas to analyze the sustainable intensive land use of different economic types and at different economic development stages.
The data involved in this study include: population, economy, consumption, science, technology, land use data, and vector diagram of administrative division. The socio-economic data involved in this manuscript mainly come from the authoritative data officially released by Shandong Province and Jinan City (one year behind the actual data). The land use data mainly comes from the authoritative data released by the land administration department (for the current year data). Among those used by the institute are population, economic, consumption, scientific, and technological data from 2000, 2010, and 2015, which are derived from the Jinan Statistical Yearbook (published in 2001, 2011, and 2016) [51,52,53]. The land use data are derived from the database, which was published by the Jinan Municipal Planning and Land Resources Management Committee, and the vector diagram of the administrative divisions is derived from the Jinan City Land Use Master Plan (2006–2020) 1:100,000 land use planning database, which was published by the Jinan Municipal Planning and Land Resources Management Committee. Among them, the land use type data selected the data of Jinan City in 2000, 2010, and 2015.
This paper uses the ArcGIS10.0 platform to integrate data regarding the social economy, scientific, and technological progress and land use attributes to form a system of five indicators, namely land suitability, land resource ecological carrying capacity, labor input, capital investment, and scientific and technological progress intensity in Jinan City in 2000, 2010, and 2015, establishing an evaluation database of sustainable intensive regional land. Because the classification of land data changed in 2007, land survey data obtained prior to 2007 need to be reclassified according to the second investigation of land use classification standards. This reclassification can be used to reduce the data errors produced by different classification standards.
2.2. Research Approaches
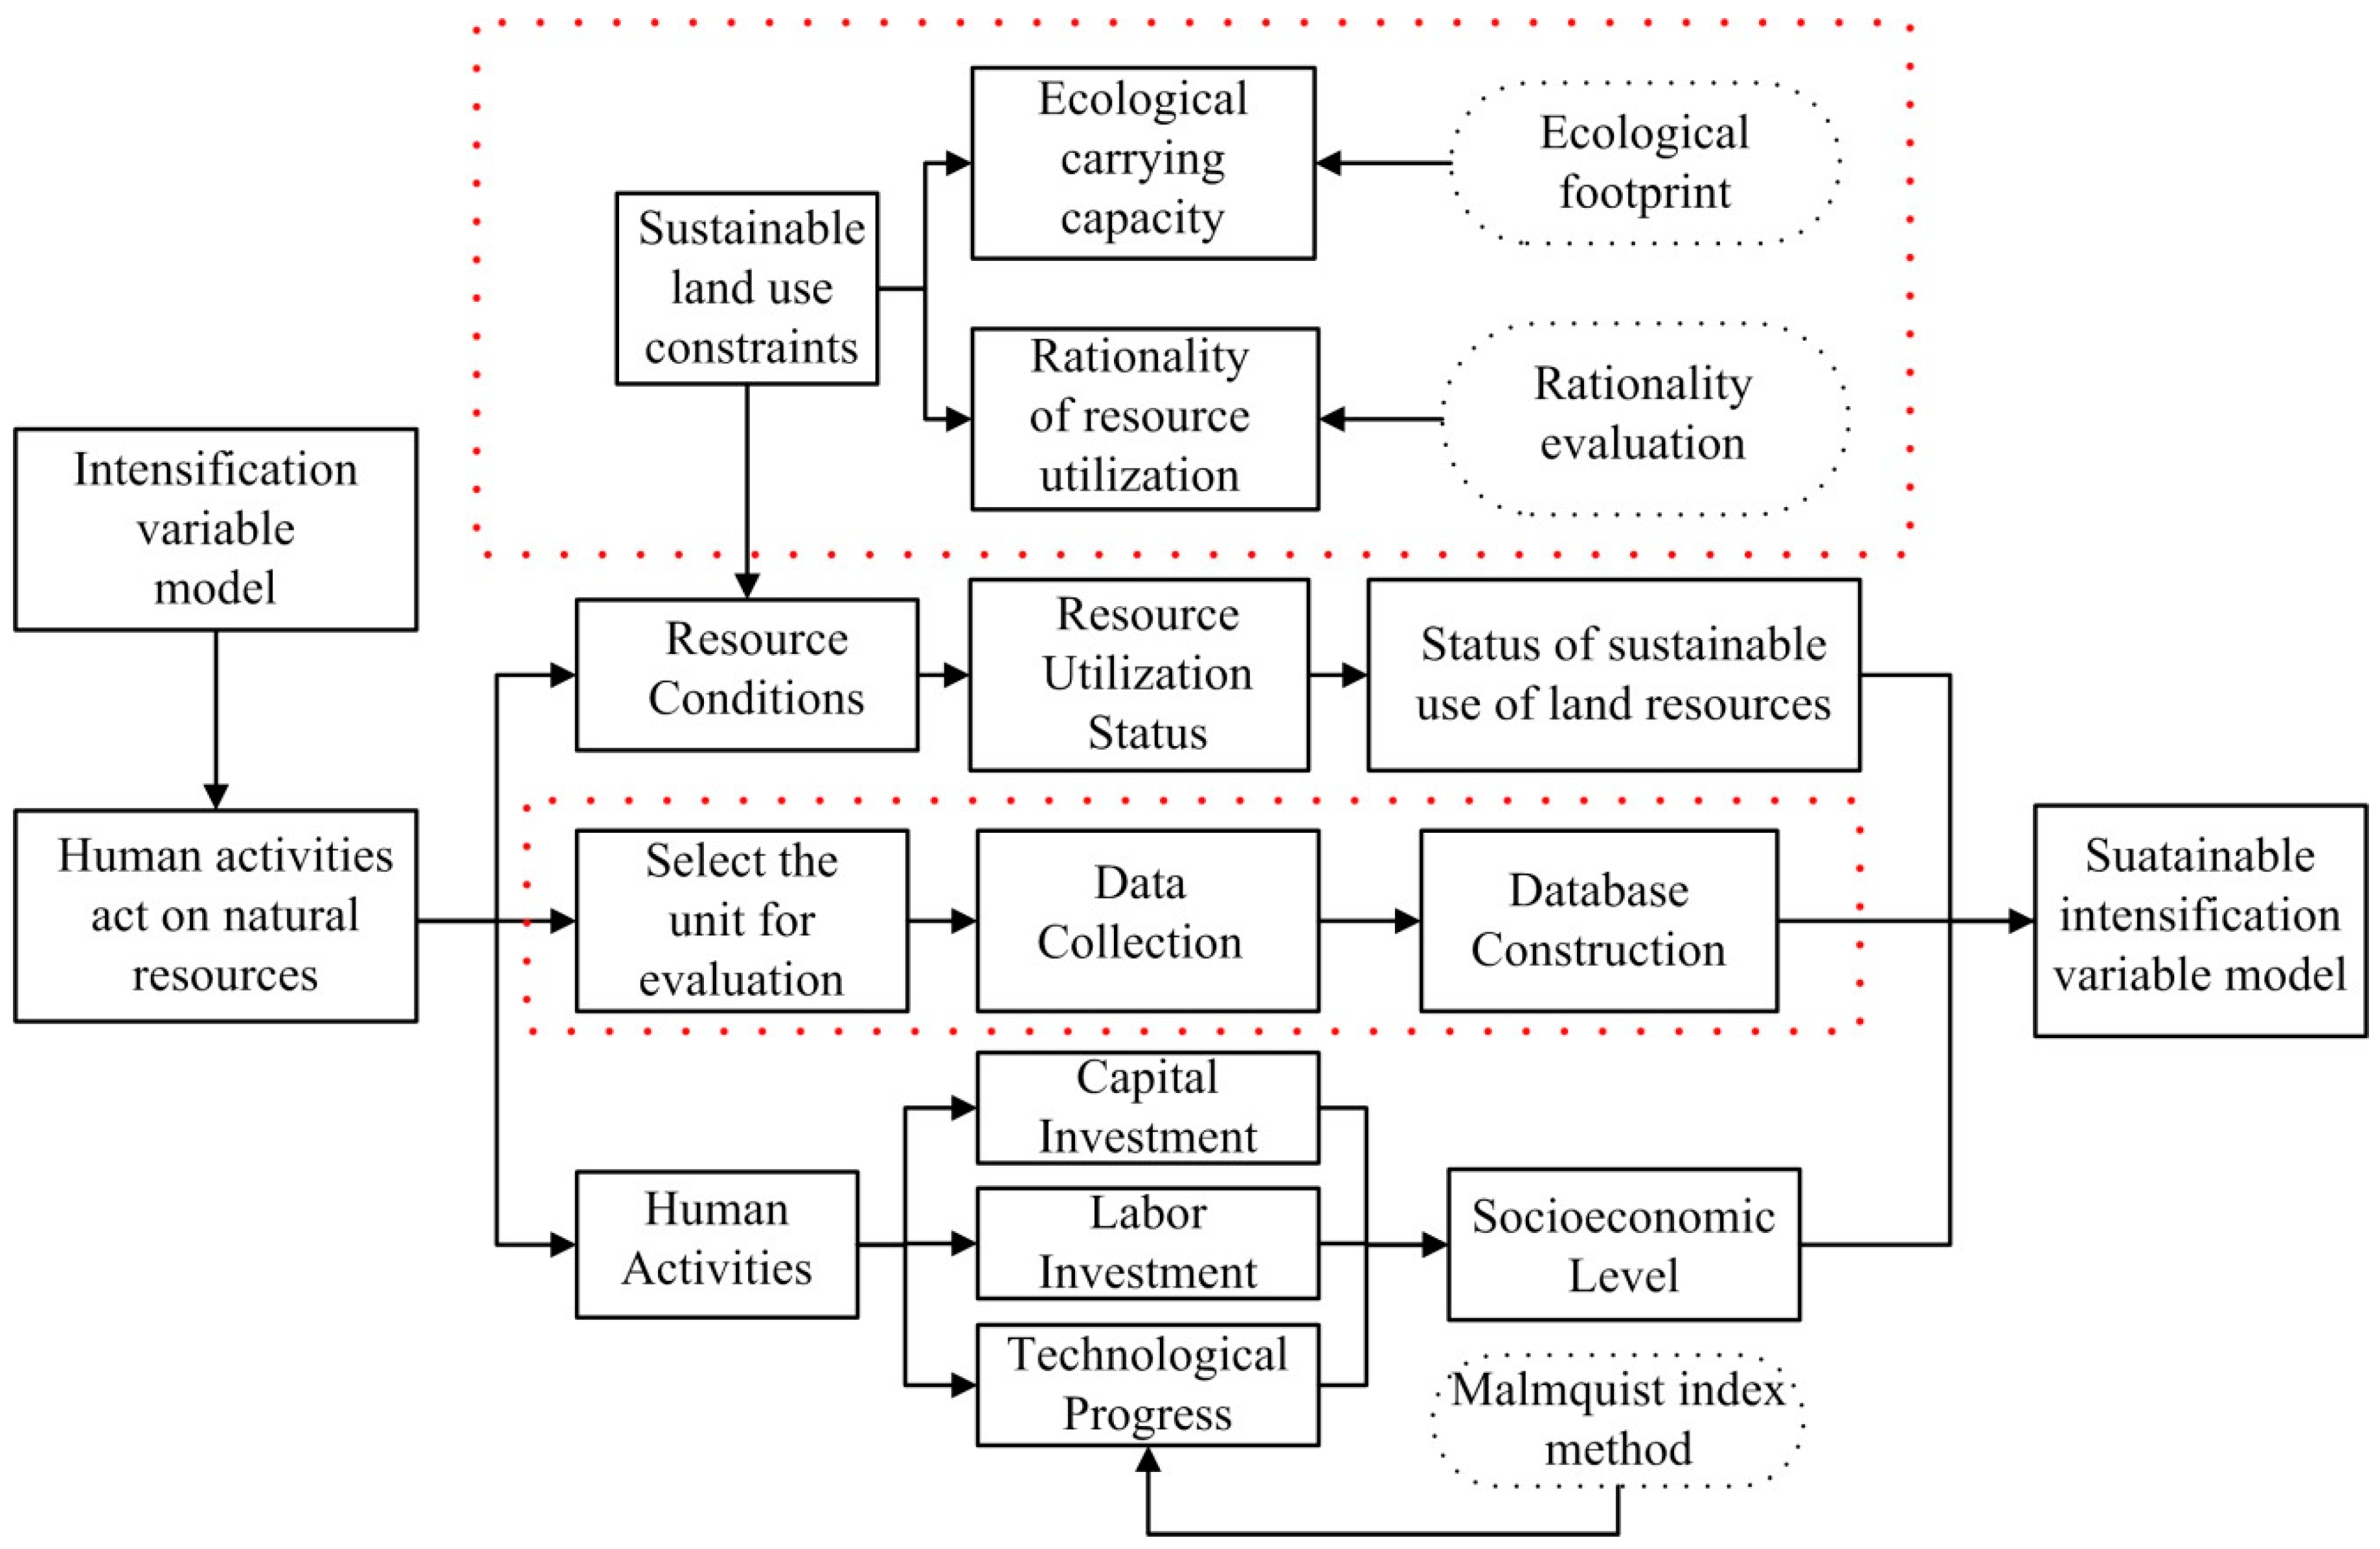
Based on the principle and method of the intensification variable, this research corrects the intensification variable with the evaluation factors of city sustainable development. The intensification variable is determined by human activities acting on natural resources. This method effectively researches the effect of factor input on the intensive use of land resources, but does not consider the sustainable use of land resources. Therefore, a sustainable land use constraint is adopted to modify the resource conditions in this manuscript. Through the sustainable correction of intensification variable, the sustainable intensification variable model can analyze the reasonable element input range of intensive land use under sustainable development conditions. The sustainable intensification variable model is mainly made up of three parts: the human activities, the resource conditions, and the sustainable land use constraints that modify the resource conditions. Human activities are divided into labor investment, capital investment, and the intensity of scientific and technological progress, in which the intensity of scientific and technological progress is calculated by the “Malmquist index” method. The constraints factors of sustainable land use are calculated by the two indexes of land structure evaluation and land resource ecological carrying capacity, and the weight of the two indices are determined by the entropy method. The land structure evaluation index is determined by the rationality of land utilization, and the land resource ecological carrying capacity index is calculated by the ecological footprint method.
After determining the research method, this paper selects Jinan City as the evaluation unit, collects the data of the study area, builds the database, and forms a sustainable intensive variable model (details shown in Figure 1).
2.3. Intensification Variable
An intensification variable is defined as a variable through which human activities increase the value, benefit, or carrying capacity of natural resources. This variable is expressed in terms of the value, benefit, or carrying capacity of the unit’s natural resources [49]. According to this definition, the intensification variable can reflect the degree of the intensification of natural resource utilization in a certain area to a certain extent. Since the basis of intensification variable is that human activities affect natural resources, it is possible to define intensification variable as a function of human activities and natural resources, and this function can be expressed as follows [49]:
where I represents the intensification variable, R represents the natural resource condition, and H represents the human activity.
I = f(R,H)
The use of the specific indicators of capital investment, labor input, comprehensive scientific and technological progress, and management optimization can increase the value, benefits, and carrying capacity of natural resources to express the human activity in an intensification variable and obtain the following basic model of intensification variable theory [49]:
where I represents the intensification variable; R the natural resource condition; L the labor input; K the capital input, α and β the elasticity coefficient of labor and capital input, respectively; T the technological factor; M management optimization; t the year; and δ the error term.
2.4. Sustainable Intensification Variables
The intensification variable defines human activities acting on natural resources to increase the benefits of those resources. Here, the use of land resources is mainly discussed. To maintain the sustainable development of the region during the intensive use of land resources, this research modifies the intensification variable with sustainable land use, and evaluates the sustainable utilization pattern of land resources through the two indicators of rationality of resource utilization and ecological carrying capacity. Rationality of land utilization means that the current utilization of land resources is in line with the appropriate quality of land resources. The rationality of land utilization in this research is determined by comparing the current use of land resources with the land use plan developed by the government. The ecological carrying capacity is determined using the assessment method of the ecological footprint. The ecological carrying capacity of land refers to the number of people who can be supported by various bio-productive lands in the region under a certain level of consumption [50]. Accordingly, this research selects the indicator of ecologically sustainable population to express the ecological carrying capacity of the region. The ecologically sustainable population—that is, the number of populations that can be supported by various bio-productive lands in the region—can be measured using the ecological footprint model. Resource rationality and ecological carrying capacity can measure the impact of human activities on the sustainable use of land resources and distinguish the reasonable interval of land resource utilization— that is, the reasonable input range of labor and capital for land resources under certain scientific and technological levels to determine the reasonable range of intensive land for regional sustainable development. Due to their special natural endowment, it is difficult to change the usage of land resources once they are developed and utilized. Therefore, if the rationality of land utilization is zero—that is, when the current land use type does not match the planned use, the more additional inputs added to the land—the more difficult it is to change the land use type. Thus, the intensive utilization of land resources at this time is set to zero, and we can obtain a sustainable intensification variable model as follows:
where I represents the intensification variable; P represents the rationality parameter of the land resource utilization under the natural resource condition; C represents the parameter of the land’s ecological carrying capacity under the natural resource condition; w and z are the weight of the natural resource parameters; L is the labor input; K is the capital investment; α and β represent the elastic coefficients of labor and capital input, respectively; T represents the technological factor; t represents the year; and δ represents the error term.
2.5. Ecological Carrying Capacity Calculation
In 1992, the Canadian ecologist William Rees proposed the concept of the “ecological footprint” for the first time. The ecological footprint of population is the total area of the bio-production land and the amount of water needed to produce the resources consumed by these populations and to absorb the waste generated by the population [54]; this concept was subsequently refined by Wackernagel et al. as an ecological footprint model [55]. In 1999, Xu Zhongmin and Zhang Zhiqiang introduced the ecological footprint model to China [56]. The ecological footprint model consists of the following two parts: the per capita ecological footprint and the total ecological supply. The specific steps performed to calculate the population ecological carrying capacity of the region using the ecological footprint model are as follows: (1) Calculate the ecological productive area required by the per-regional person, that is, the per capita ecological footprint; (2) calculate the total ecological productive area that can be provided by the regional land resource, that is, the total ecological supply; (3) divide the total ecological supply by the per capita ecological footprint and derive the regional ecologically sustainable population [57].
2.6. Main Parameter Calculation Methods
2.6.1. Resource Condition Parameter Weight Estimation
The calculation of the index weight is an important part of land resource evaluation. Whether the evaluation result is correct is directly determined by the rationality of the index weight. At present, there are many methods for determining the weights of indicators in China. This research chooses the entropy method to calculate the weights of the indicators in the comprehensive evaluation system of land resources in Jinan City. The concept of entropy is derived from information theory and is used to express the disorder degree of the system. Generally, the greater the change in the index value of an indicator in the evaluation system, the smaller the information entropy, so the larger the amount of information provided by the index, the greater the weight of the index; conversely, the smaller the change of index value, the smaller the index weight [58].
2.6.2. Estimation of the Elasticity Coefficient of Scientific and Technological Progress
In economics, the purpose of scientific and technological progress is to achieve a higher output with the same input; that is, to obtain the same output with less input or input combinations [59]. The level of science and technology can determine the path of economic growth at a specific stage of development, and therefore, plays a major role in the process of social development. The intensity of scientific and technological progress is the improvement of science and technology in a certain period of time, and plays an important role in economic growth. The intensity of scientific and technological progress represents a change in the efficiency of science and technology, usually calculated by using the Malmquist index. The Malmquist index method was proposed by Sten Malmquist [60] in 1953. After improvement by Fare et al. [61], this method was decomposed into pure technical efficiency changes, scale efficiency changes, and technological progress changes. The resulting calculation equation of the Malmquist index is as follows:
where ΔP is the pure technical efficiency change, ΔS is the scale efficiency change, and ΔT is the technological progress change.
2.6.3. Estimation of the Elasticity Coefficient of Labor and Capital Investment
Based on the collected data from the study area, the regression relationship between the intensification variable and other variables is calculated by the established model using the method of mathematical statistics. Let = T and ignore the error term. Using the regional GDP (Gross Domestic Product) of the unit land resource in the study area as the intensification variable, the natural logarithm is considered on both sides [49], yielding the following:
Then, the growth equation of the model can be obtained as follows:
In this formula, ∆I/I is the intensification variable growth rate; ∆R/R is the rate of change in the resource conditions relative to scientific and technological progress; ∆K/K is the capital investment growth rate; ∆L/L is the labor input growth rate; and ∆T/T is the rate of scientific and technological progress. Here,
where L and K represent X1 and X2 in the regression analysis, respectively, and the constant term is zero. At this point, the elastic coefficients α and β of capital input and labor input can be obtained through a regression analysis, and the corresponding intensification variable function is obtained.
3. Results and Discussion
3.1. The Evaluation Results of the Land’s Ecological Carrying Capacity
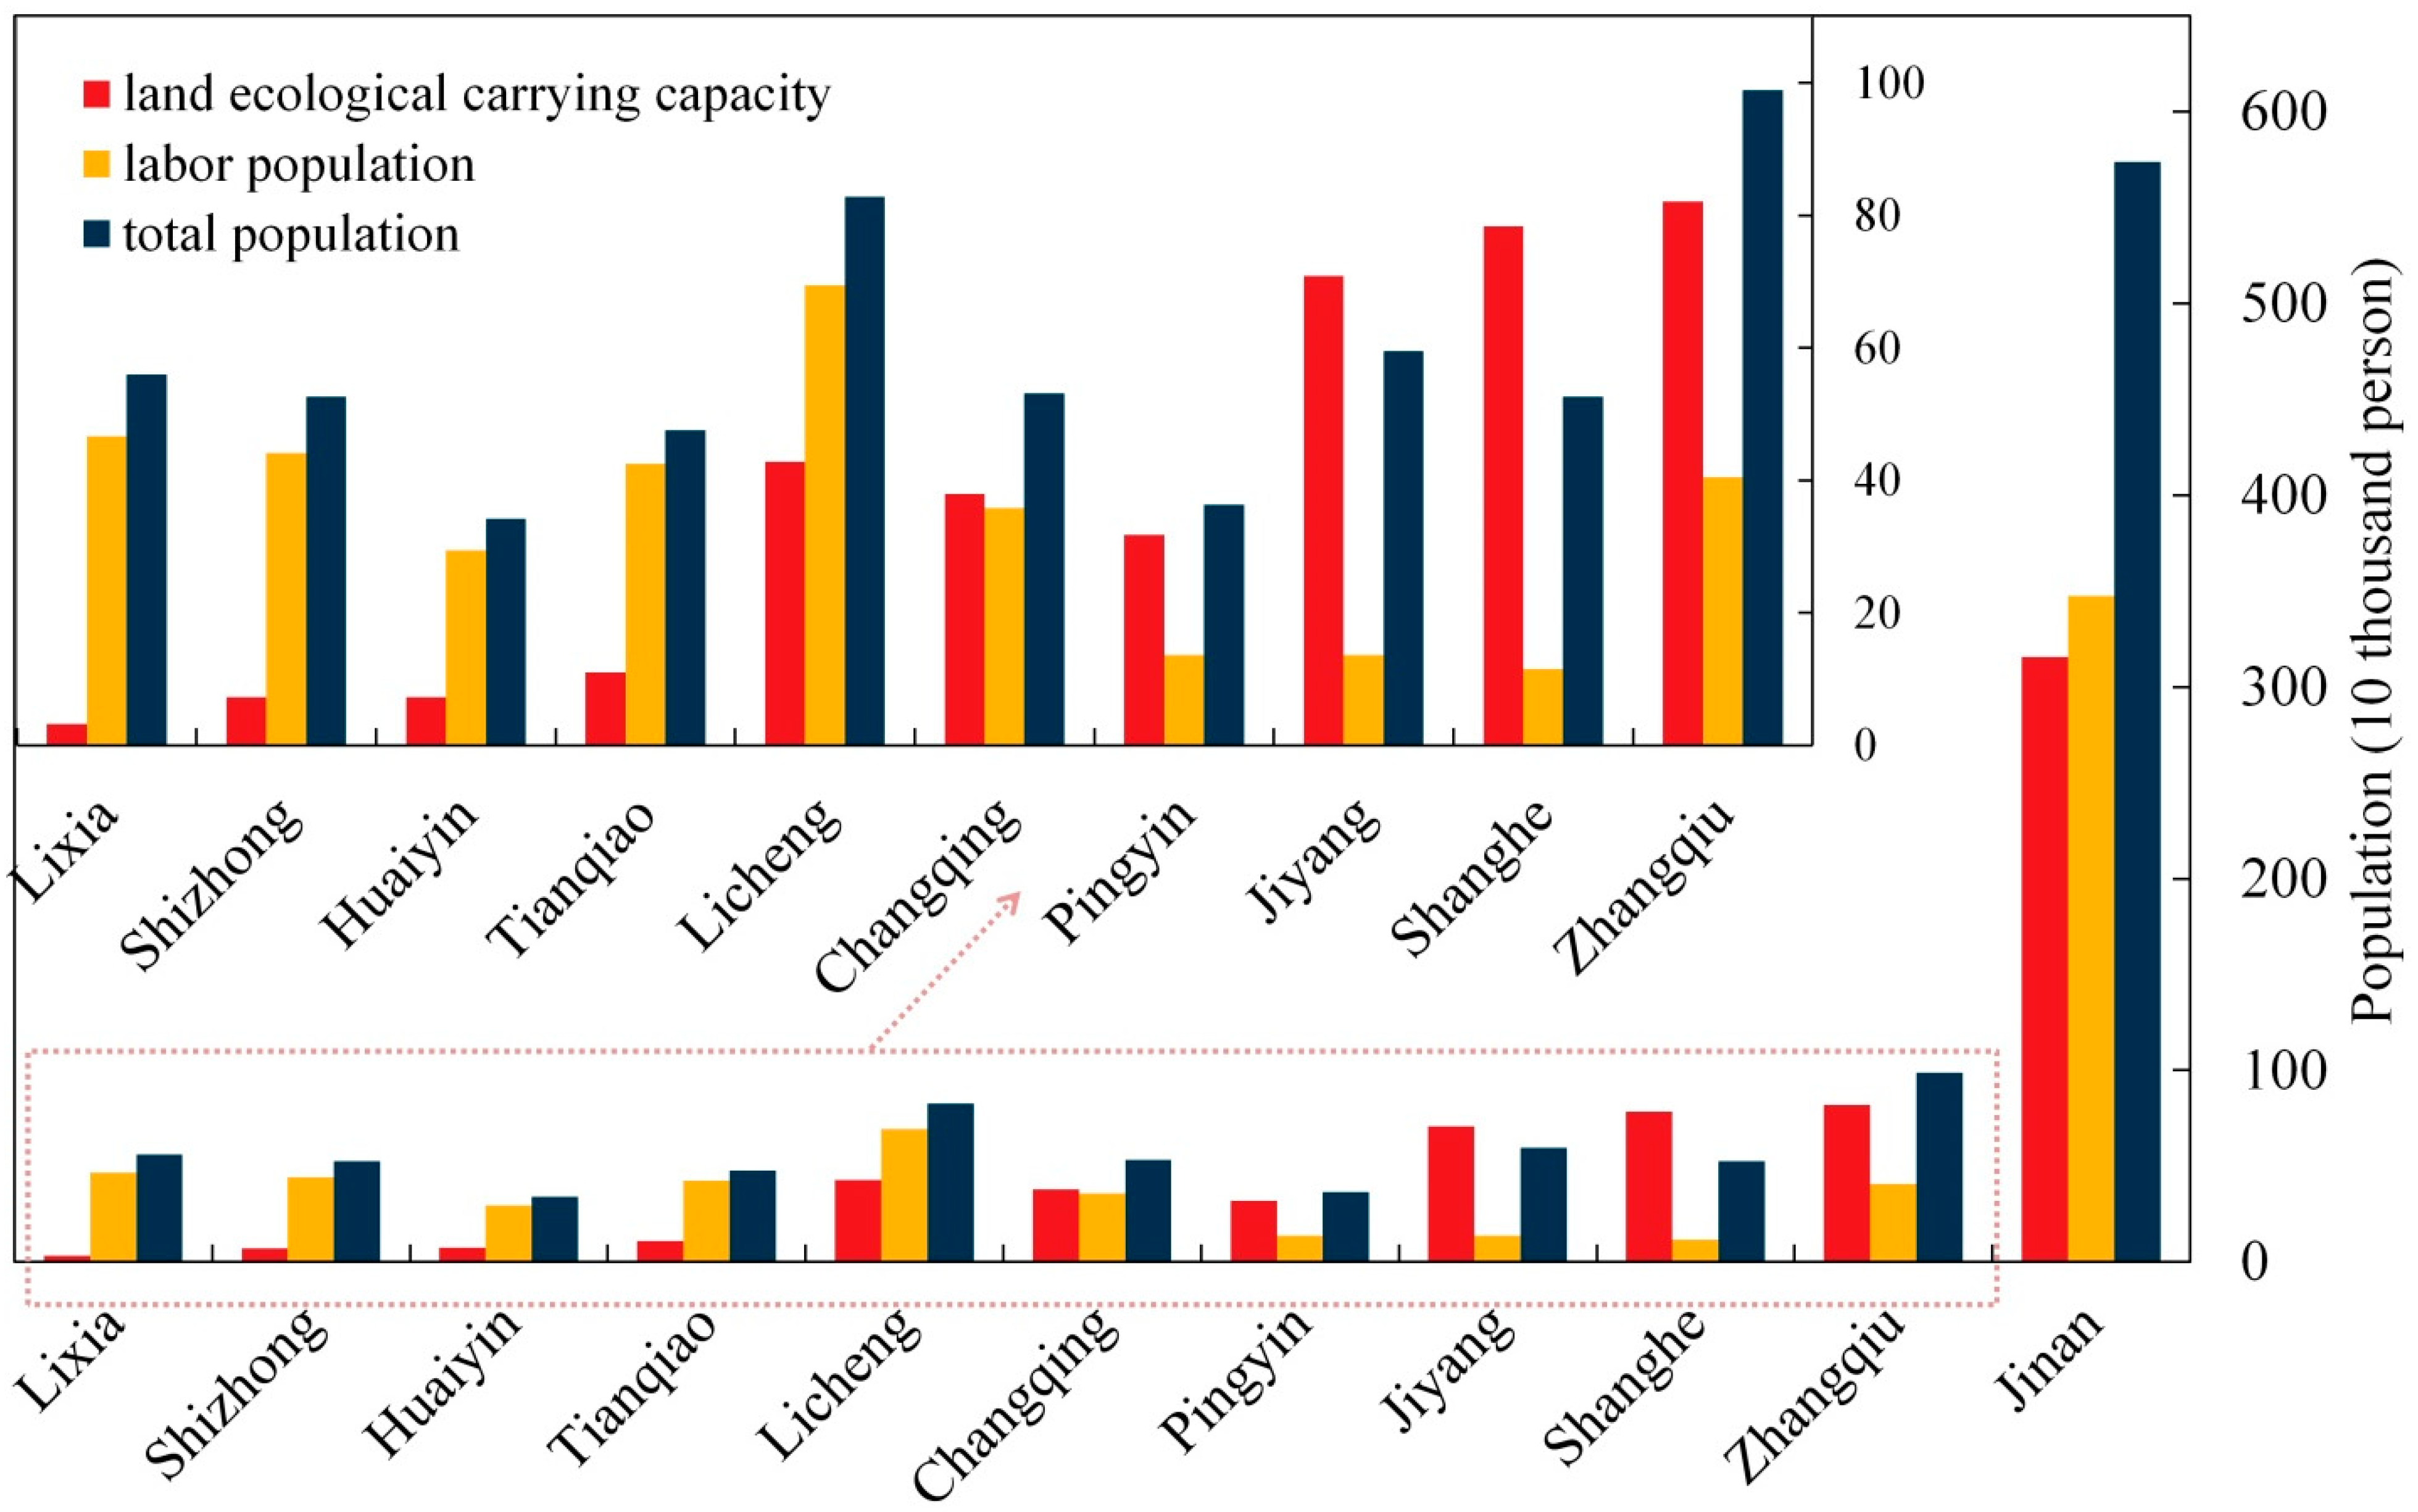
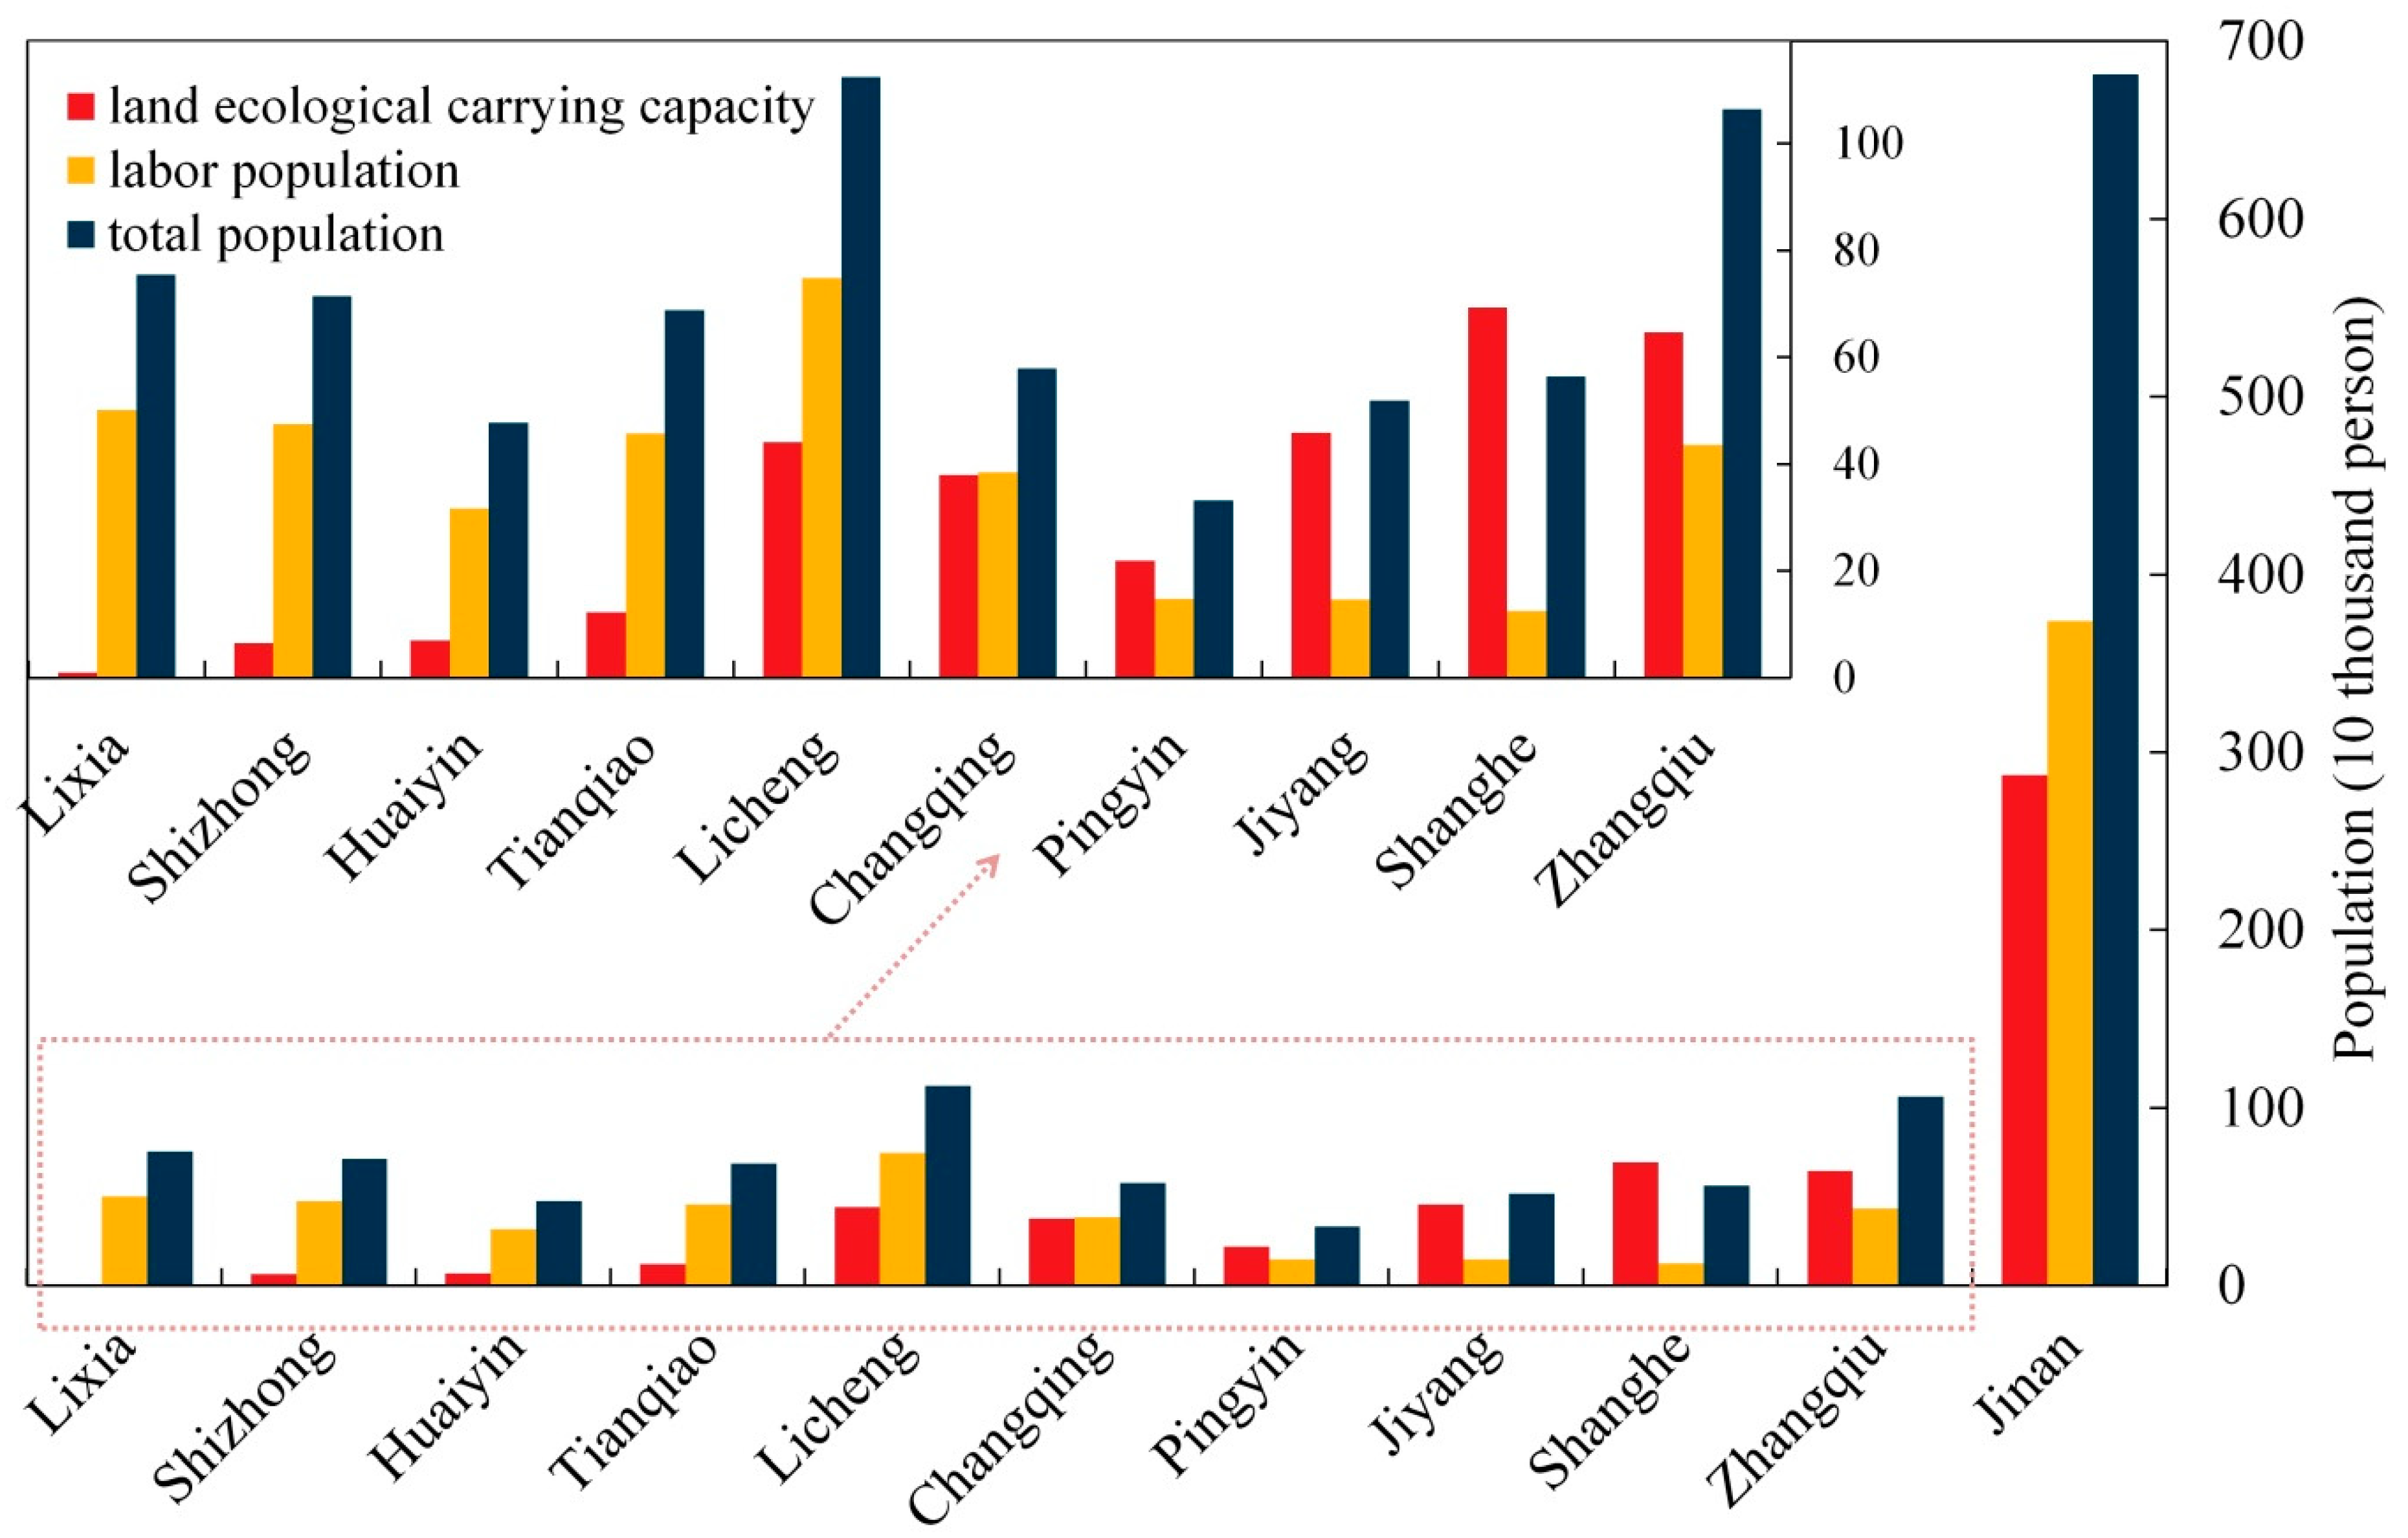
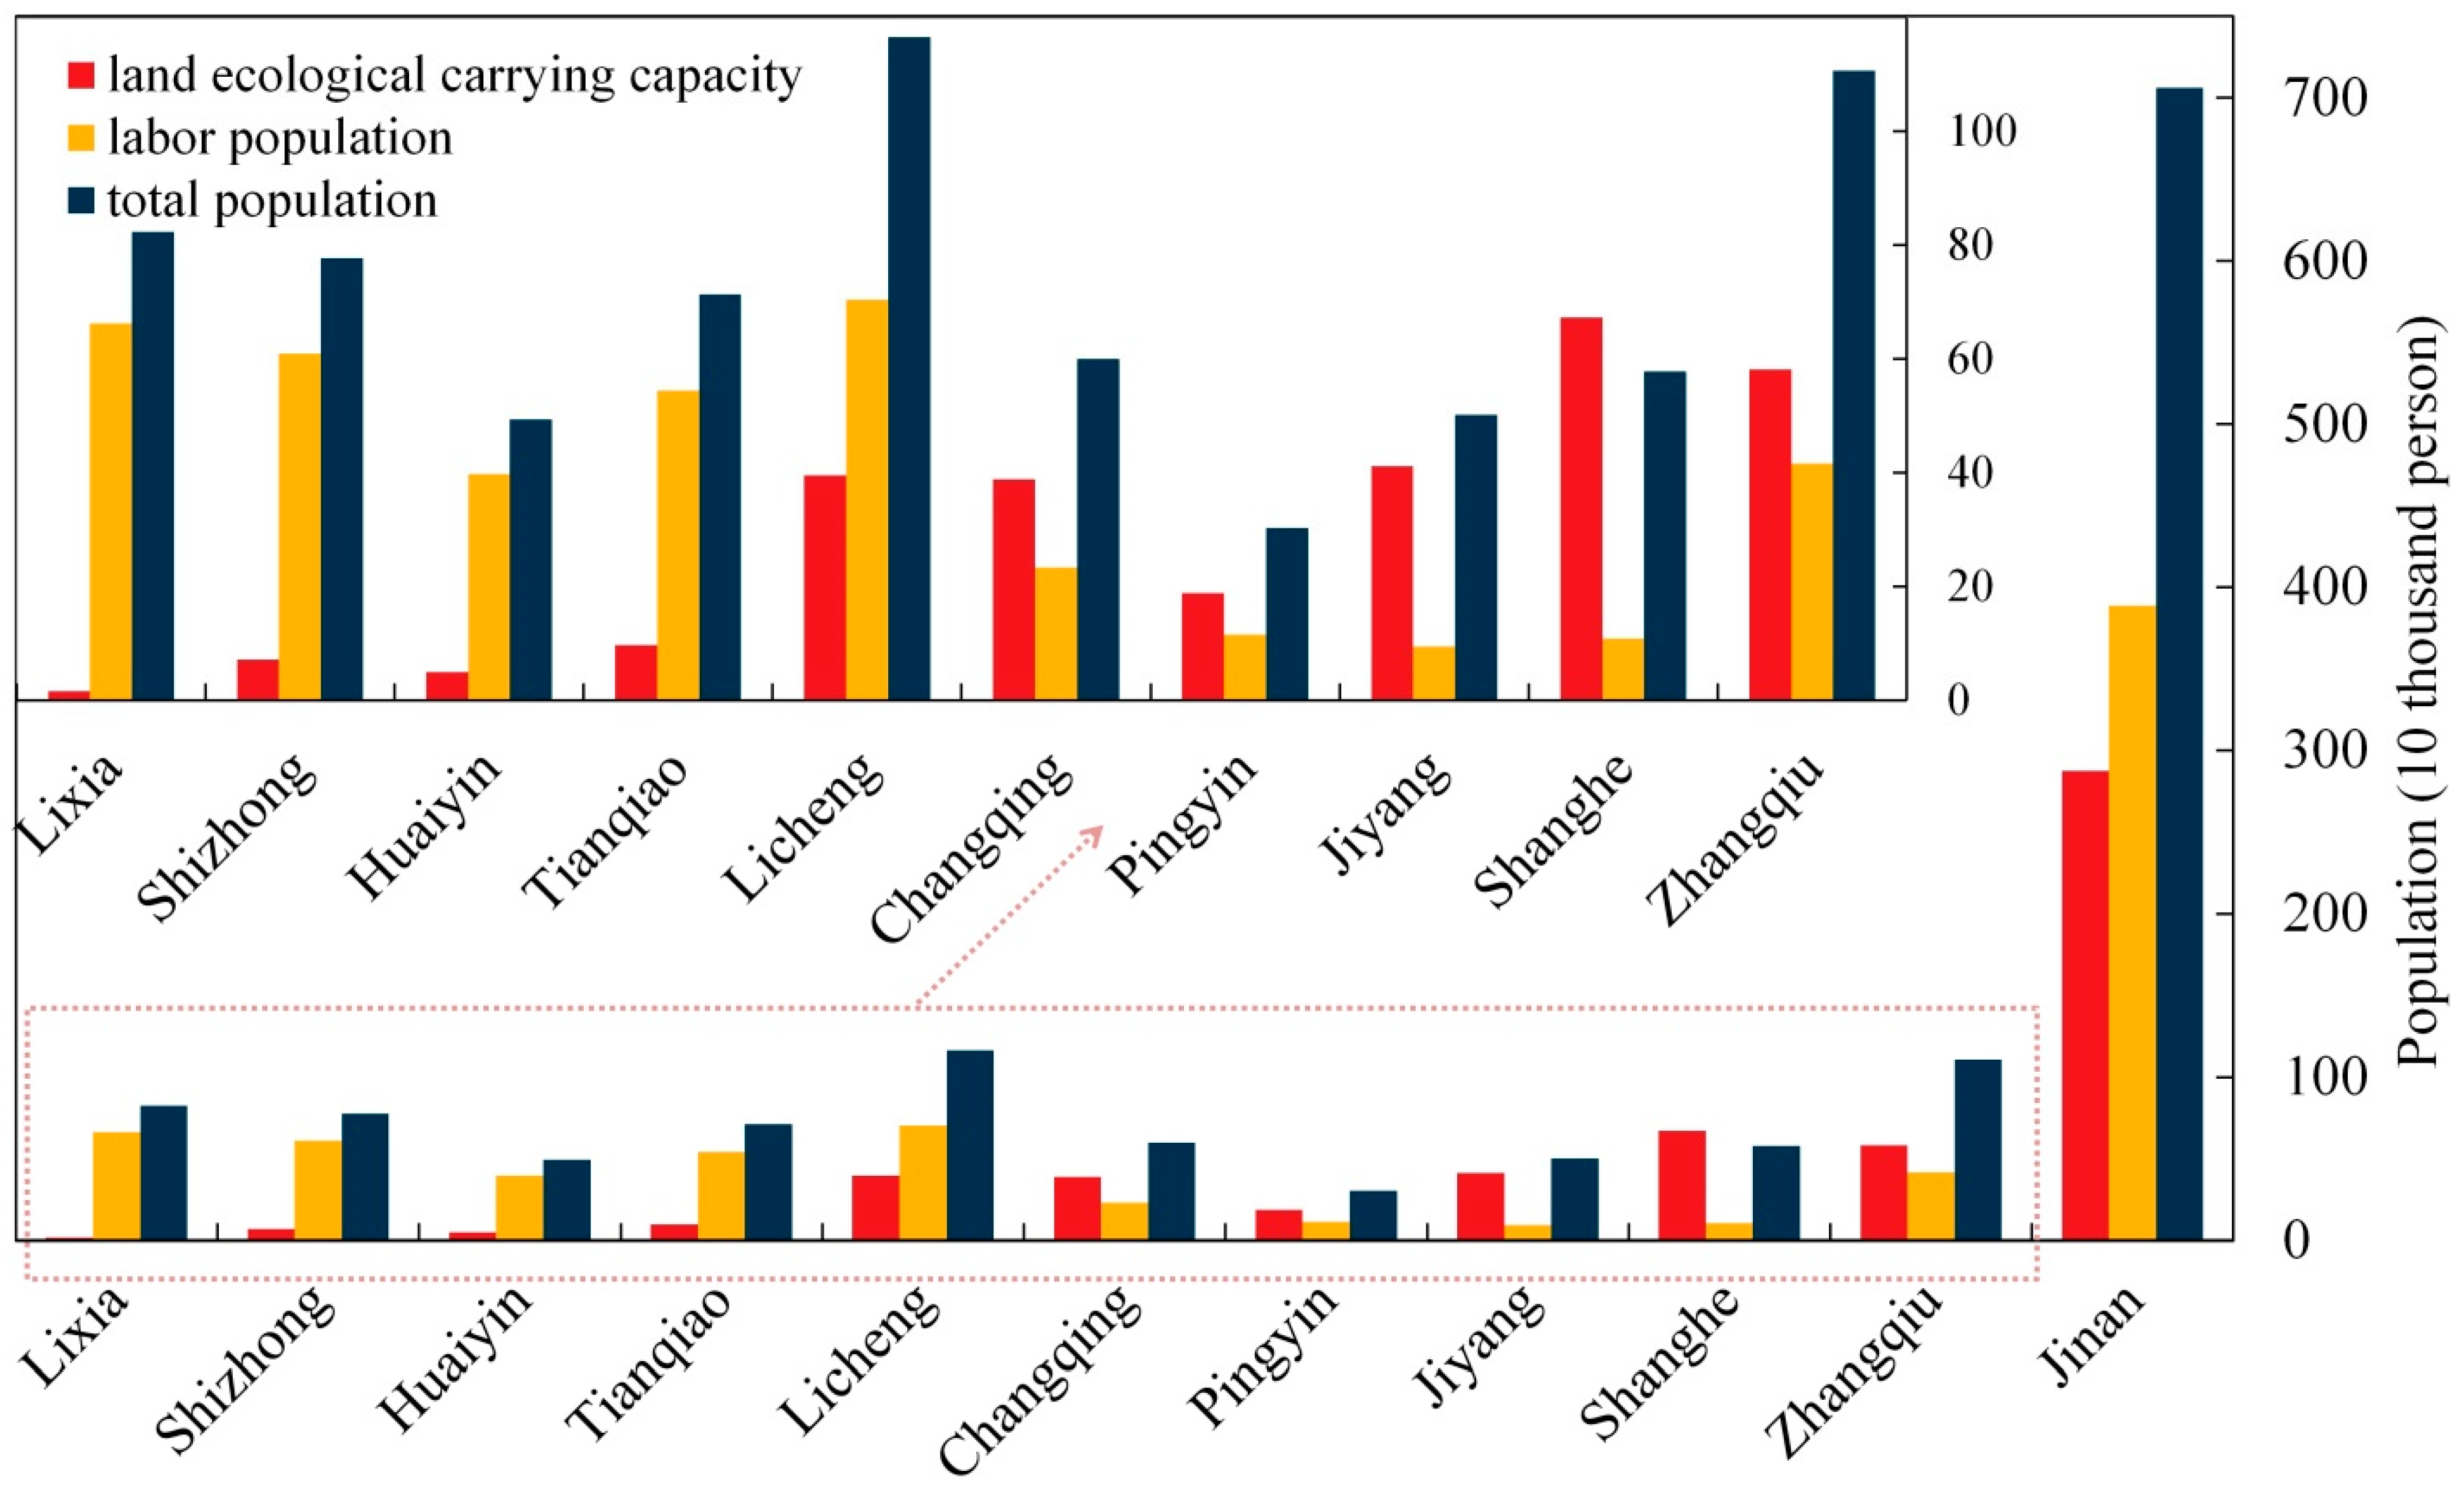
Through the calculation method described above, the social and economic development data of Jinan City and the 10 districts (counties) under its jurisdiction are selected to calculate the per capita ecological footprint and ecological carrying capacity of the study area, respectively. Since this manuscript considers the geographical area with administrative boundaries as the research area, and the research goal is to achieve regional sustainable intensive land use, the assumption of the local ecosystem independence is assumed, which is convenient for the consistency of spatial dimensions of regional sustainable research and intensive land use studies. Therefore, the ecological carrying capacity of the land in the study area, in the selected years 2000, 2010, and 2015, can be obtained. The results are shown in Figure 2, Figure 3 and Figure 4.
According to the calculation results of the ecological carrying capacity of Jinan City and its districts and counties, the overall ecological carrying capacity of the study area is poor, and the ecologically appropriate population shows a trend of first decreasing and then increasing during the research period. Furthermore, the ecological carrying deficit is more serious, especially in 2010 and 2015. The overall ecological carrying capacity deficit of Jinan City exceeded the number of the ecologically sustainable population, showing serious overload. Among the results, the ecological carrying capacity of Shanghe is the best among the 10 districts (counties). During the three research periods, the ecological carrying capacity is greater than the actual resident population. Jiyang ranks second after Shanghe; in 2000, the ecological carrying capacity is higher than the number of permanent residents during the same period, and the most serious ecological carrying capacity deficit is observed in Lixia and Shizhong. The deficit of the land’s ecological carrying capacity is gradually intensified during the three research periods, and the ecological carrying deficit of the other districts and counties also shows a gradual increase.
Comparing with the evaluations of Jinan’s ecological footprint and carrying capacity from 2000 to 2010 performed by Liu Jinhua [62], Yin Xuntao [63], and other scholars, and referring to the level of social and economic development in Jinan City, the evaluation results and trends in Jinan’s ecological carrying capacity are generally reasonable and effective. In future land use processes, we should pay attention to improving the ecological carrying capacity of land use, formulate corresponding land use policies, and protect the ecological environment of Jinan City.
3.2. The Evaluation Results of Land Resource Suitability
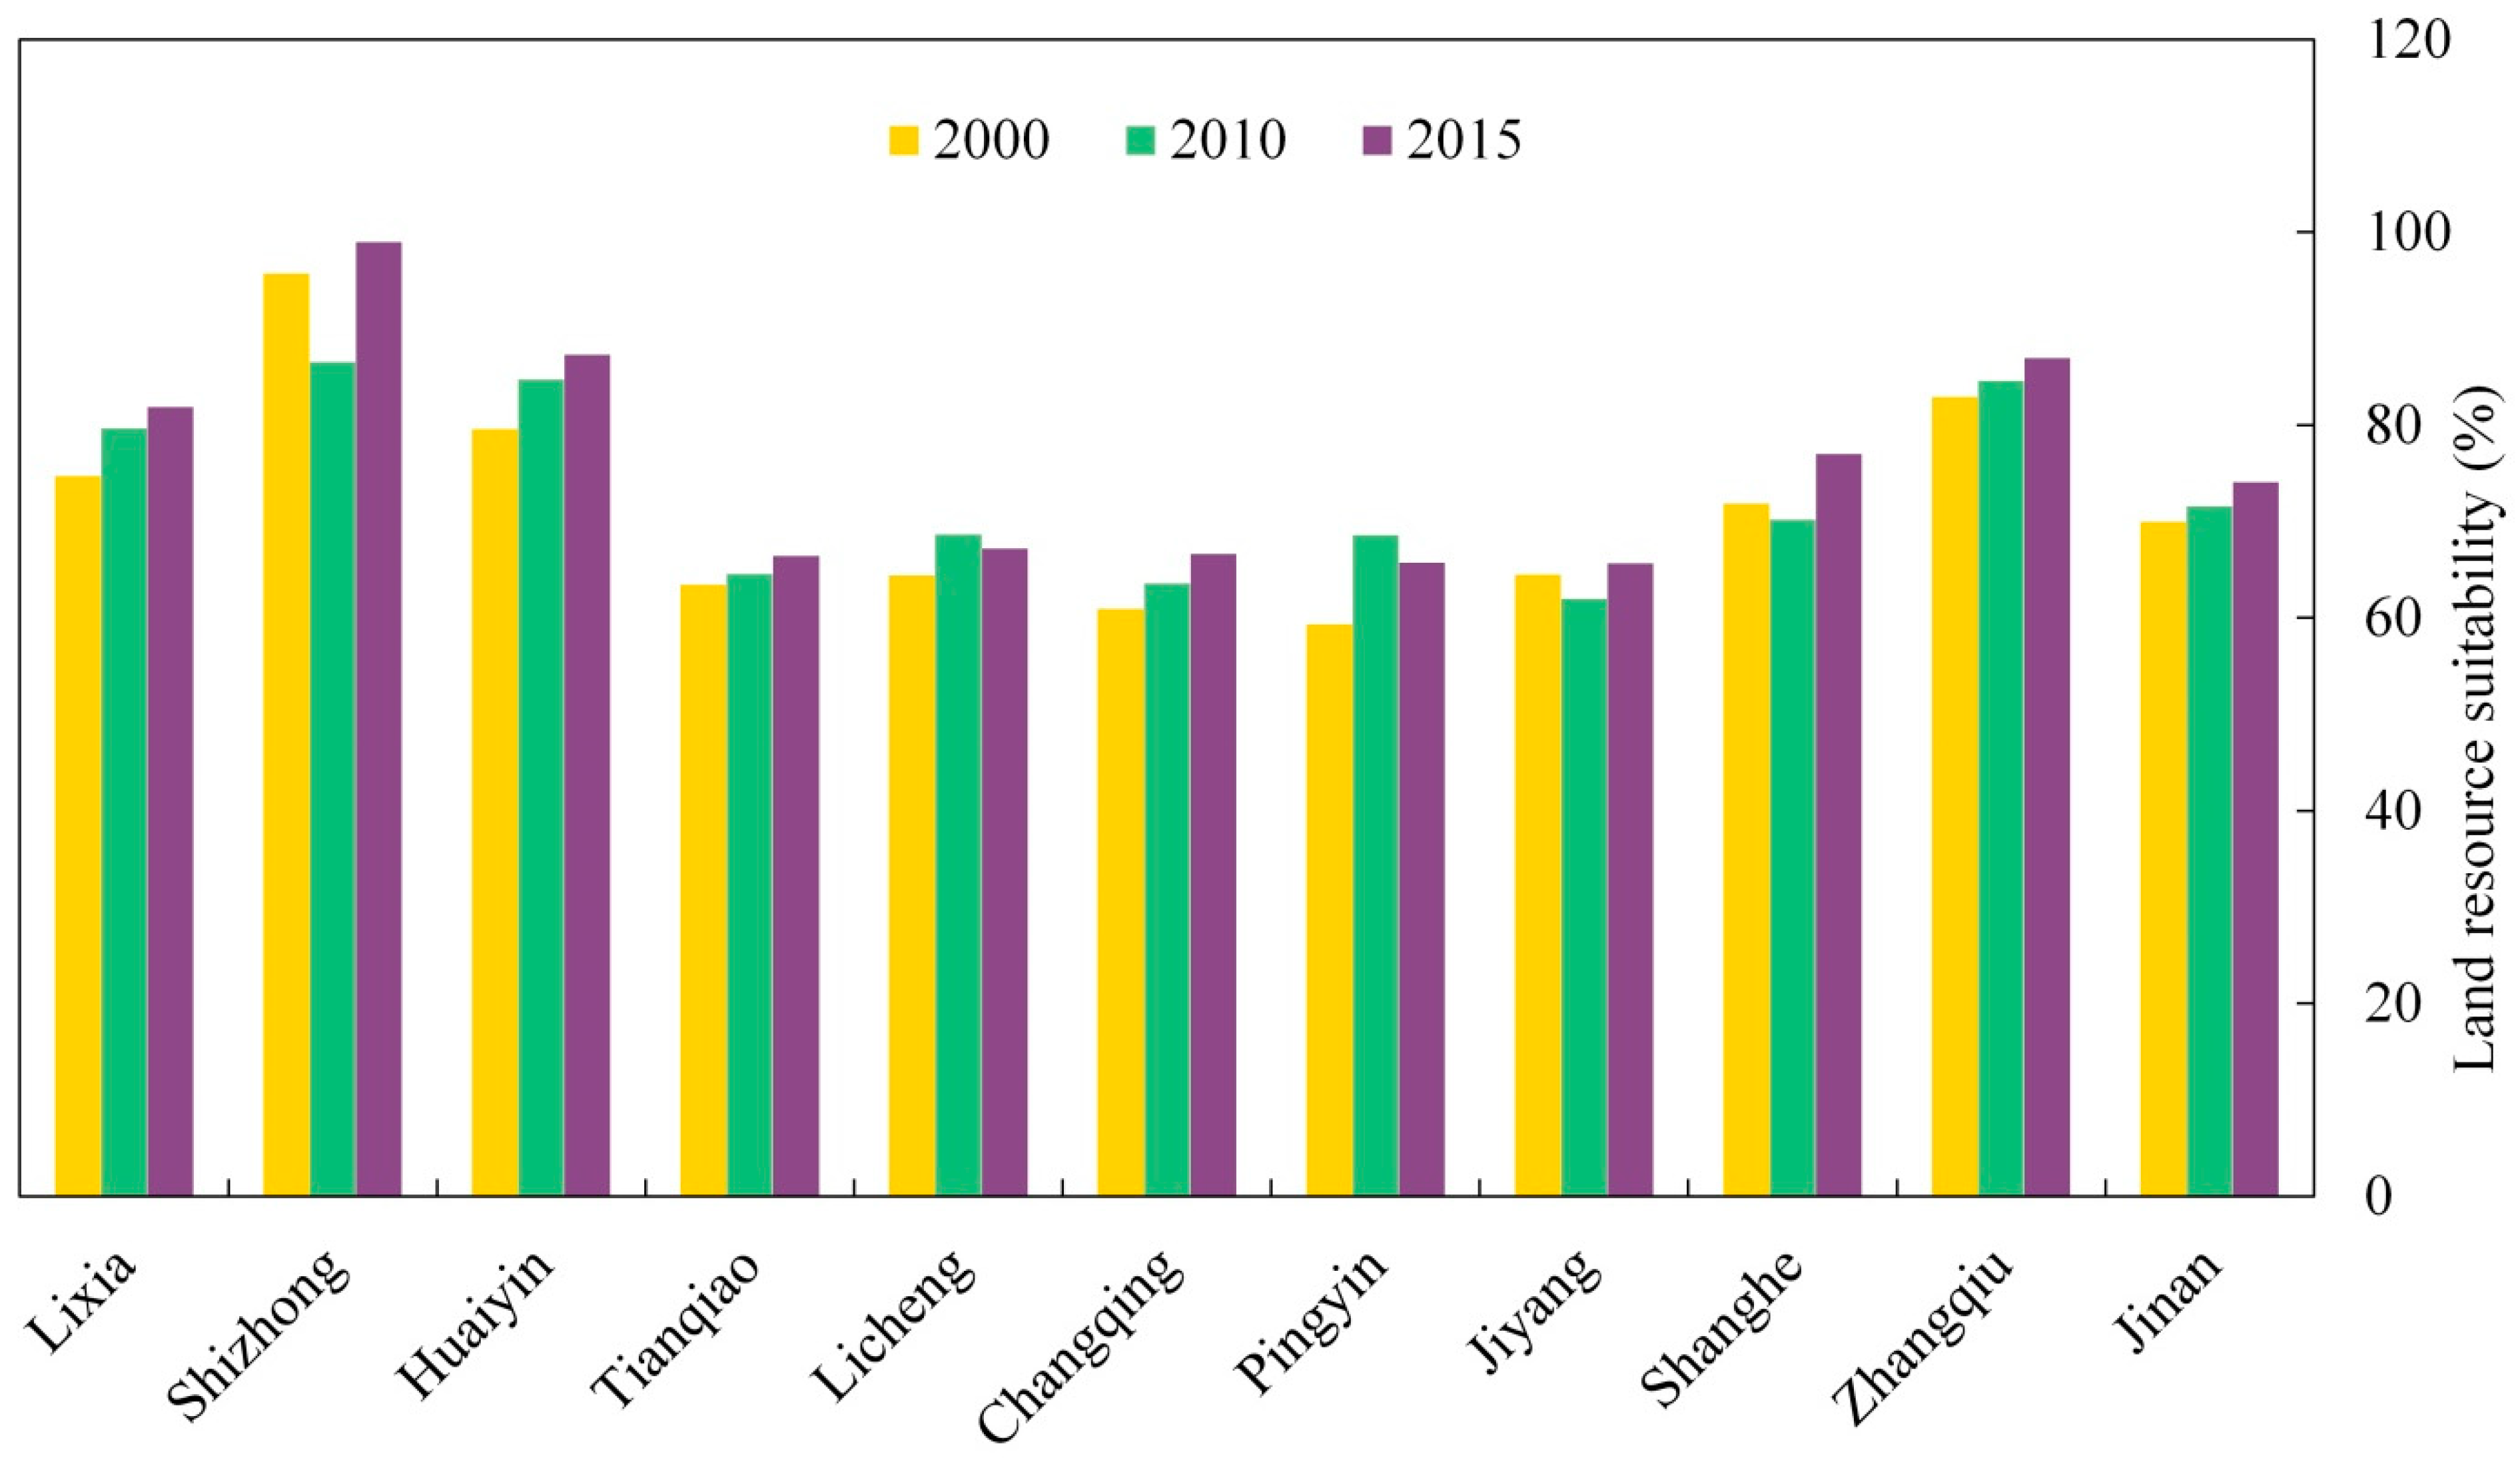
This research evaluates the suitability of land resources by comparing the land use status with the land use in the land plan formulated by the government. The evaluation results are shown in Figure 5.
According to the evaluation results, the consistent area between land utility and land planning of Jinan and its districts and counties gradually increased from 2000 to 2015, while the land suitability of Shizhong, Jiyang, and Shanghe in 2000 and 2010 decreased slightly. Between 2010 and 2015, the land suitability of Pingyin and Licheng slightly decreased. In general, from 2000 to 2015, the land use in Jinan City remained close to the utilization plan formulated by the government. In future land use processes, the land should be developed and utilized in strict accordance with the overall land use plan formulated by the government to allow the quantity and structure of land use to develop in a more rational direction.
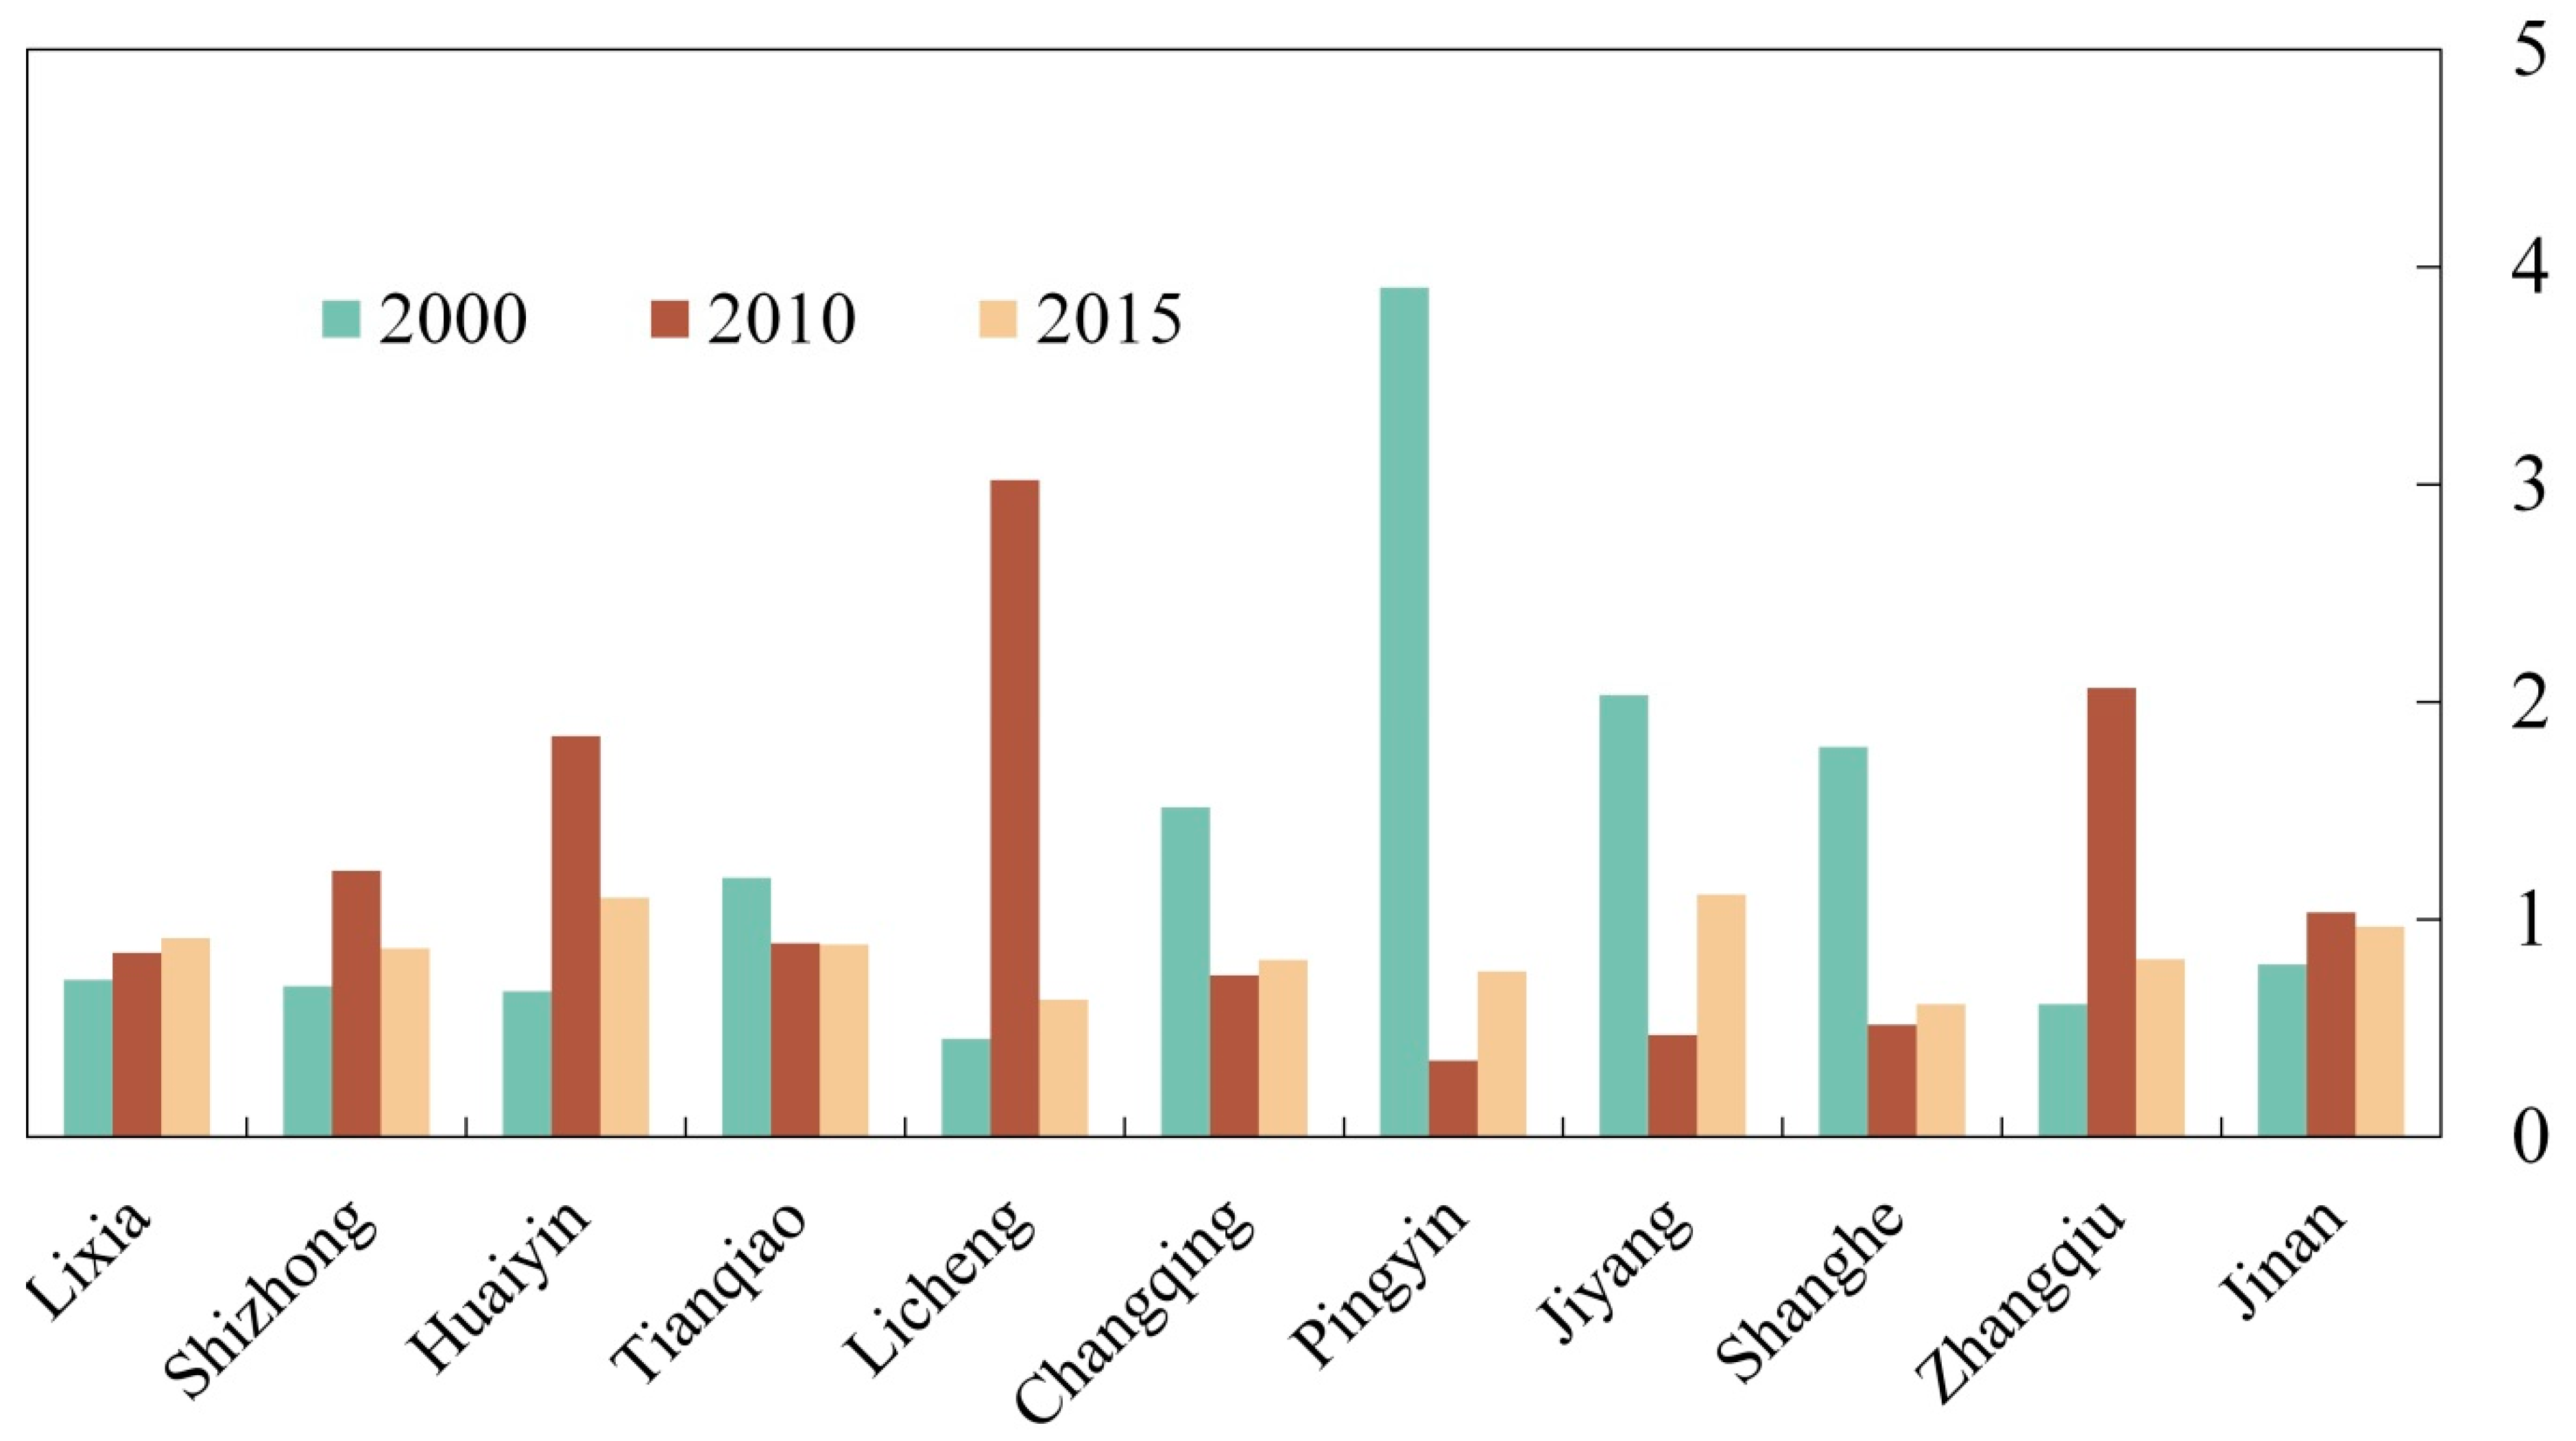
3.3. The Estimation Results of Scientific and Technological Progress Intensity
The intensity of scientific and technological progress refers to the improvements of productivity efficiency in science and technology during a certain period, and plays an important role in the economic development of a society. The estimated results of the scientific and technological progress rate of Jinan City and its districts and counties in 2000, 2010, and 2015 are shown in Figure 6.
3.4. The Analysis Results of the Sustainable Intensification Variable
3.4.1. The Rationality Analysis of the Sustainable Intensification Variable Model
After the elasticity coefficient of capital and labor input in the model is obtained by fitting and the calculation results of each module are summarized, the sustainable intensification variable function model of the study area can be integrated. By comparing the analysis results of the sustainable intensification variable model with the simulation results of a traditional model, the rationality of sustainable intensification variable model can be determined.
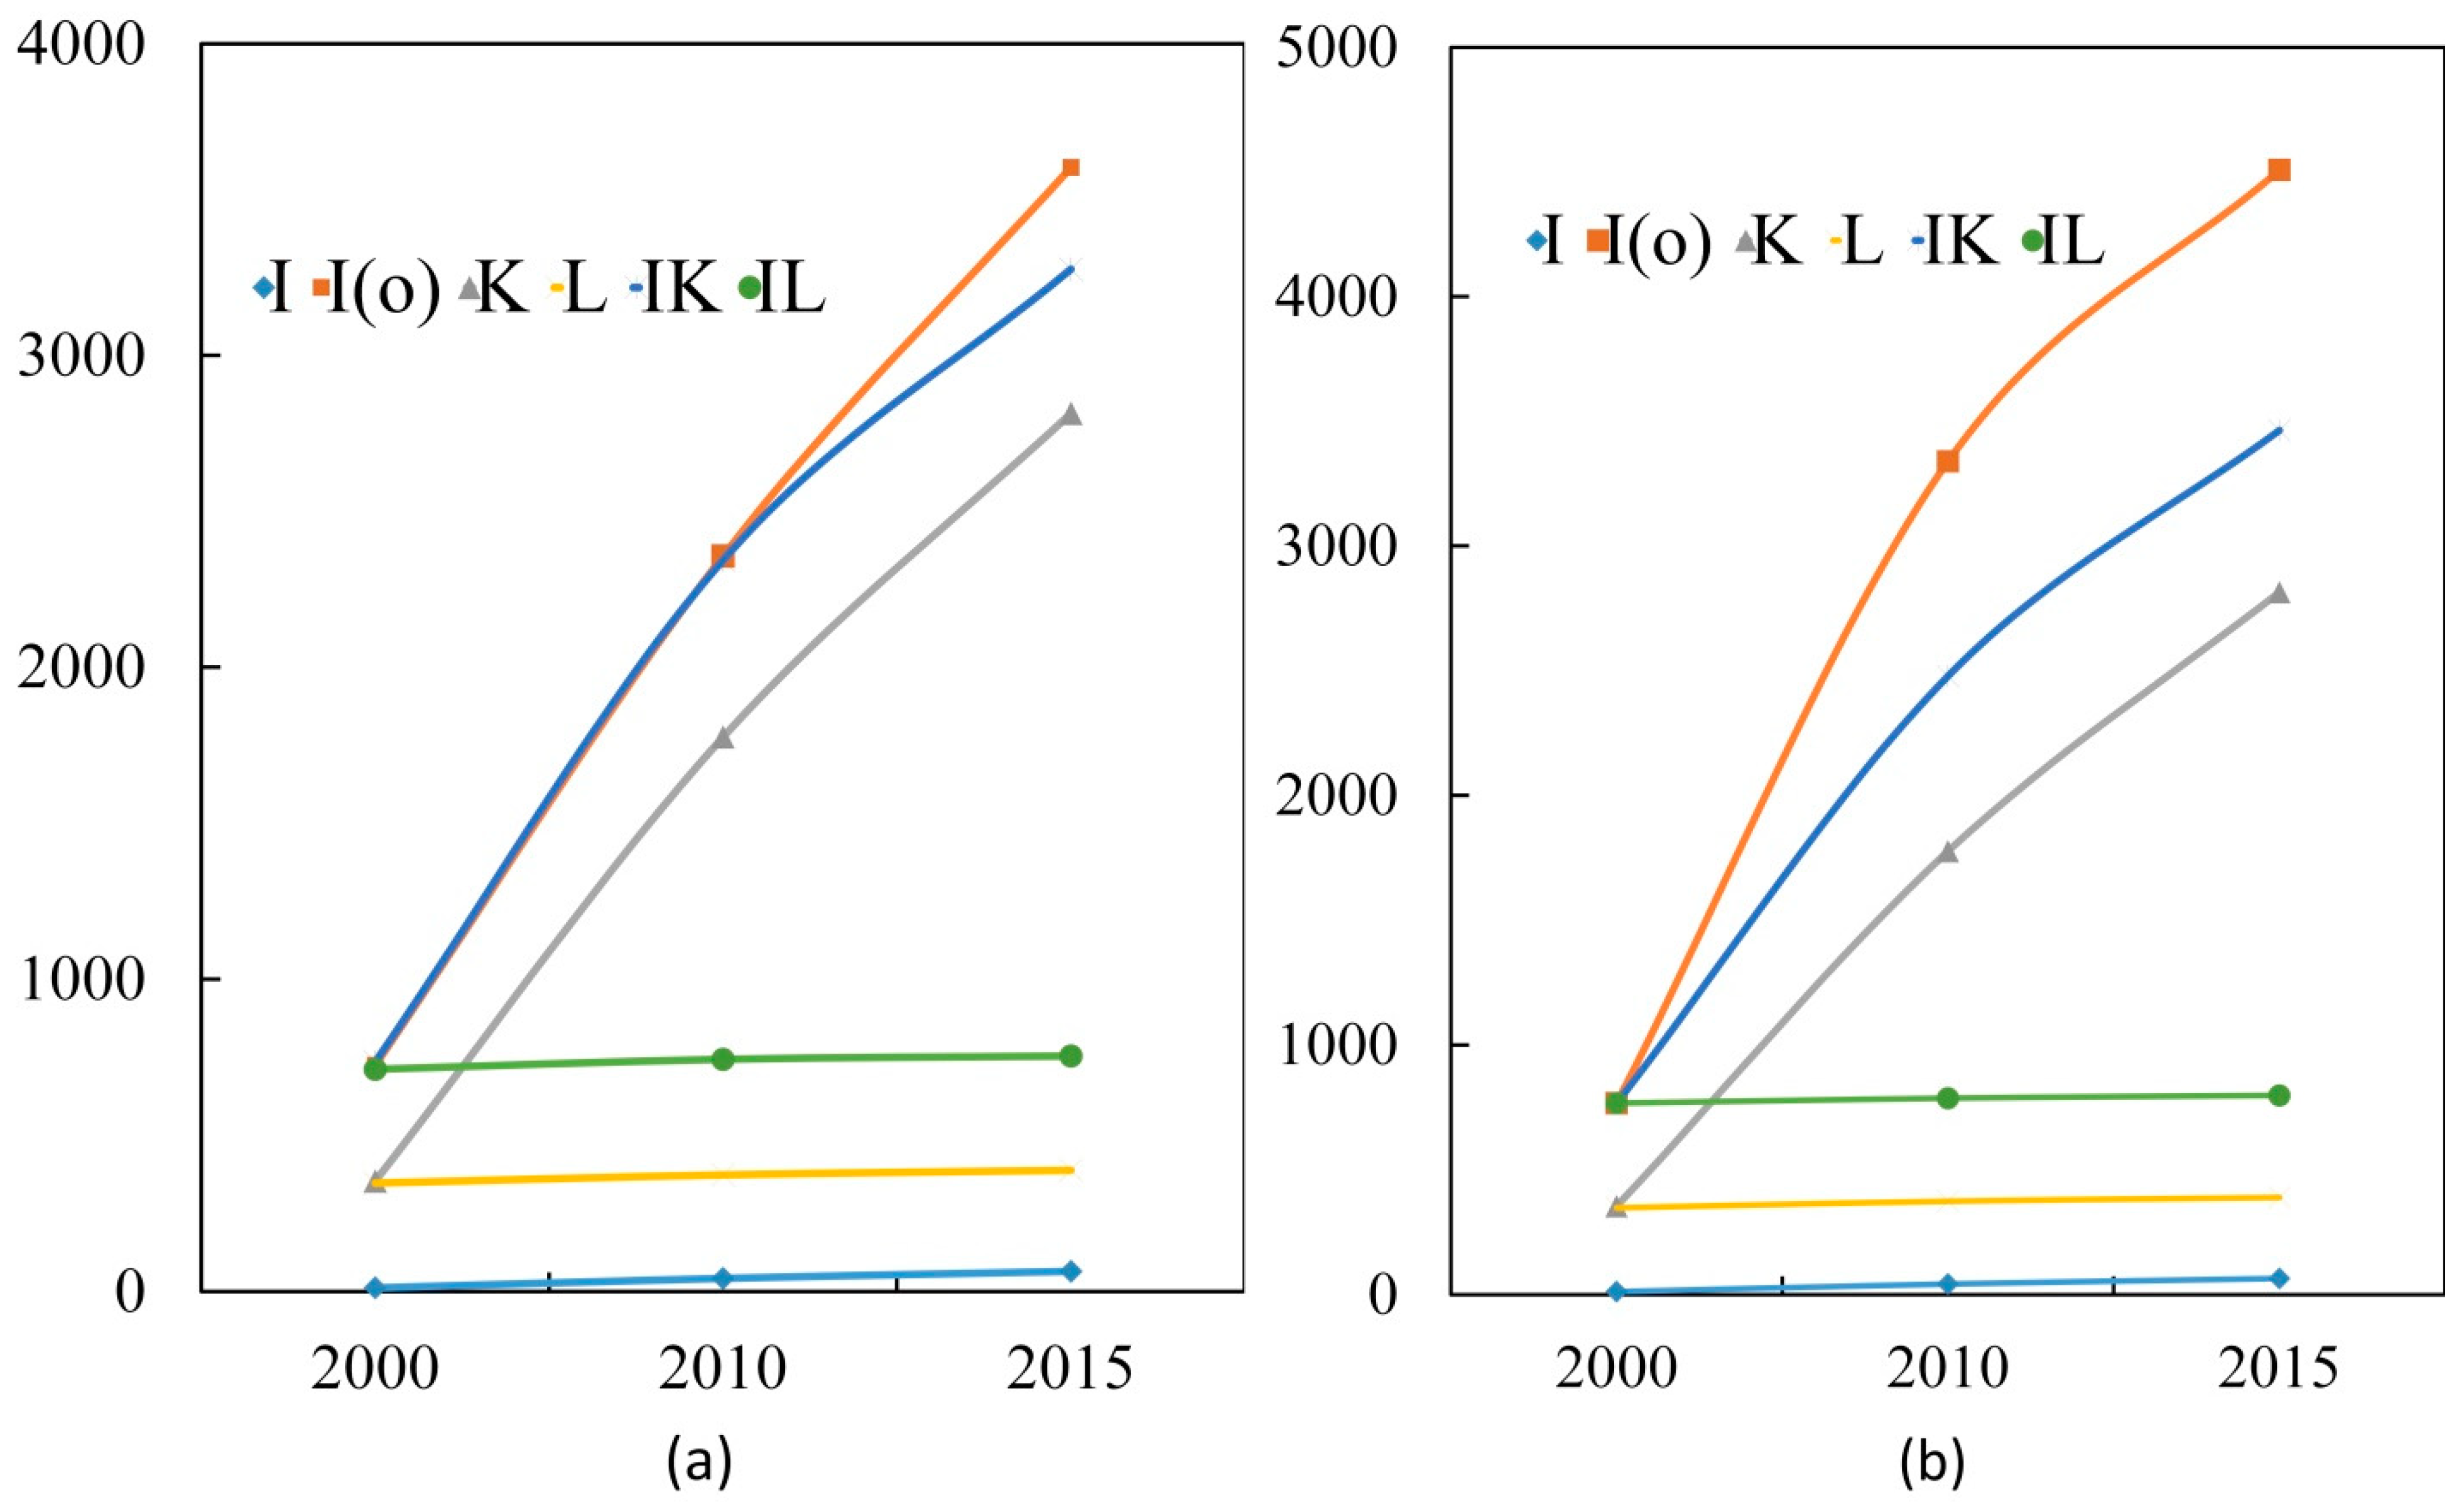
During a certain period, the land resource input and technological development level of the region are certain. In the intensification variable model, the capital and labor input per unit area are the main factors determining the degree of land use intensification. Therefore, through the obtained functional model, two revisions to the intensification variable of the land resources in the study area are considered to study the effects of each input element on intensive land use. “Intensification variable” is expressed here by the gross national product value per unit of land resources; the gross national product of unit land resource output indicates the response of each element to the land resource input. One revision is to determine the change in the output of the per unit land resource (IK) when the capital input is increased, only when the other input levels are constant. The other revision is to determine the change in output per unit of land resources (IL), only when the labor input is increased for land resources, while the other inputs remain constant. By combining the change curves of the intensification variable I, the intensification variable I (fitting) obtained by the fitting function, the capital input K, the labor input L, and the development of, and change in, the corrected output IK and IL for the unit land resource in 2000–2015, these are shown in one chart to display the relationship among these factors. This research takes Jinan City as an example for analysis, as shown in Figure 7.
As shown in the figure, each variable curve has a consistent trend. When the input of capital or labor factors increases, the output of unit land resources increases accordingly. By comparing the evaluation results of the intensification variable model and the sustainable intensification variable model, the intensification variable results of the land resource utilization in Jinan City analyzed by the intensification variable model are higher than those obtained by the sustainable intensification variable model. The results of the intensification variable simulated by the sustainable intensification variable model I (fitting) and the results of the output changes of the unit land resources (IK), while increasing only capital investment in land resources, are basically consistent. The result I (fitting) of the intensification variable simulated by the intensification variable model is much larger than the result of the change in the output of the unit land resource when the capital input is increased only for the land resources. This result shows that in the sustainable intensification variable model, the relationship between the intensification variable of land resources and the capital investment in the region is much greater than the intensification variable’s relationship with labor input. Compared with the results of Guo Chen [64] and Zhang Benli [65], and other evaluations of the intensive use of land resources in Jinan, this finding is consistent with the law of land use and economic growth in Jinan City, highlighting that the sustainable intensification variable model can more accurately simulate the intensive use of land resources.
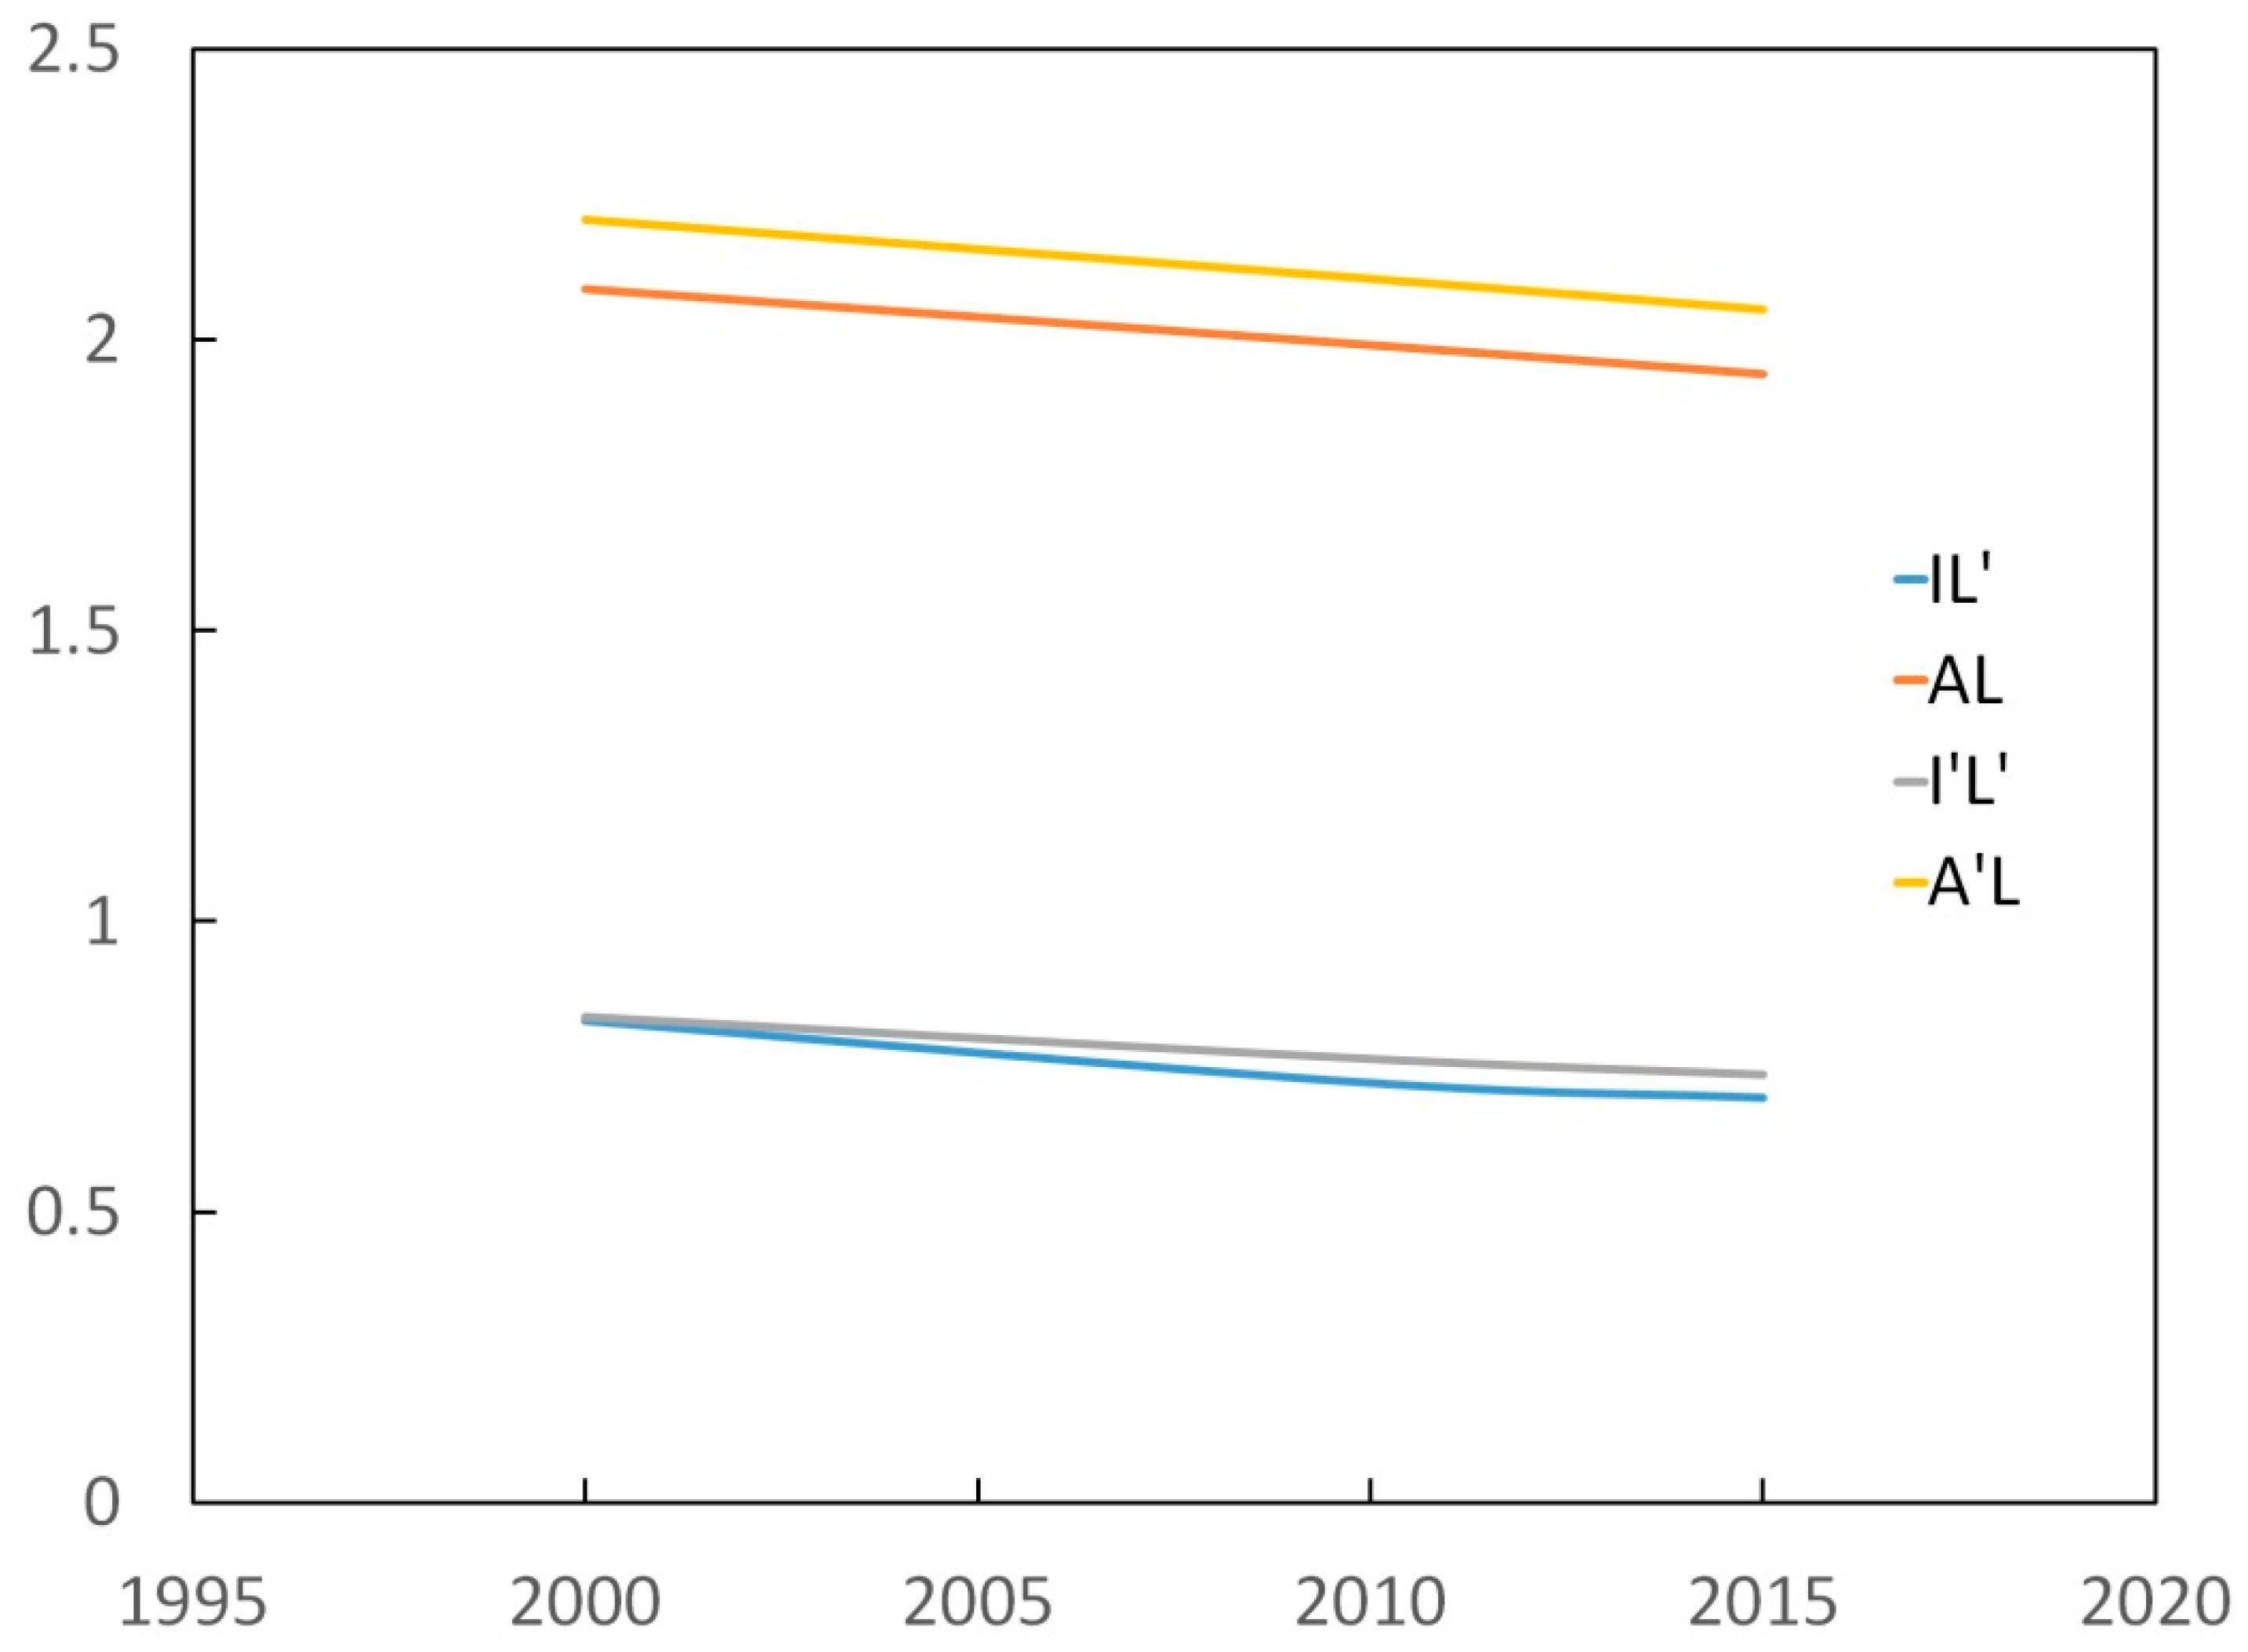
The marginal production and average production of Jinan labor force input from the evaluation of the ecological footprint correction and the intensification variable model without ecological footprint correction is as follows: IL’(the marginal production of labor input from the evaluation of the intensification variable model), AL(the average production of labor input from the evaluation of the intensification variable model), I’L’(the marginal production of labor input from the evaluation of the sustainable intensification variable model), and A’L(the average production of labor input from the evaluation of the sustainable intensification variable model). The evolution curves of IL’, AL, I’L’, and A’L from 2000 to 2015 are summarized in the chart shown in Figure 8 to display the relationship among them. This article takes Jinan as an example for analysis.
The results show that the upper limit of the reasonable input of labor factors in Jinan City without the ecological footprint correction is higher than the upper limit of the reasonable input of labor factors determined by the model of sustainable intensification. Compared with the ecological carrying capacity of land resources in Jinan City, the reasonable input limit of the labor factor calculated by the intensification variable model exceeds the ecological carrying capacity of land resources in Jinan City, and the investment towards this standard could have a negative impact on the sustainable development of Jinan city. Combining the status quo of intensive land use and the status of land resource ecological carrying capacity in Jinan City, the sustainable intensification variable model is shown to determine the rational input interval of labor factors, which is conducive to guiding Jinan’s development policy in the future.
3.4.2. Analysis of the Results of the Factor Input Calculation
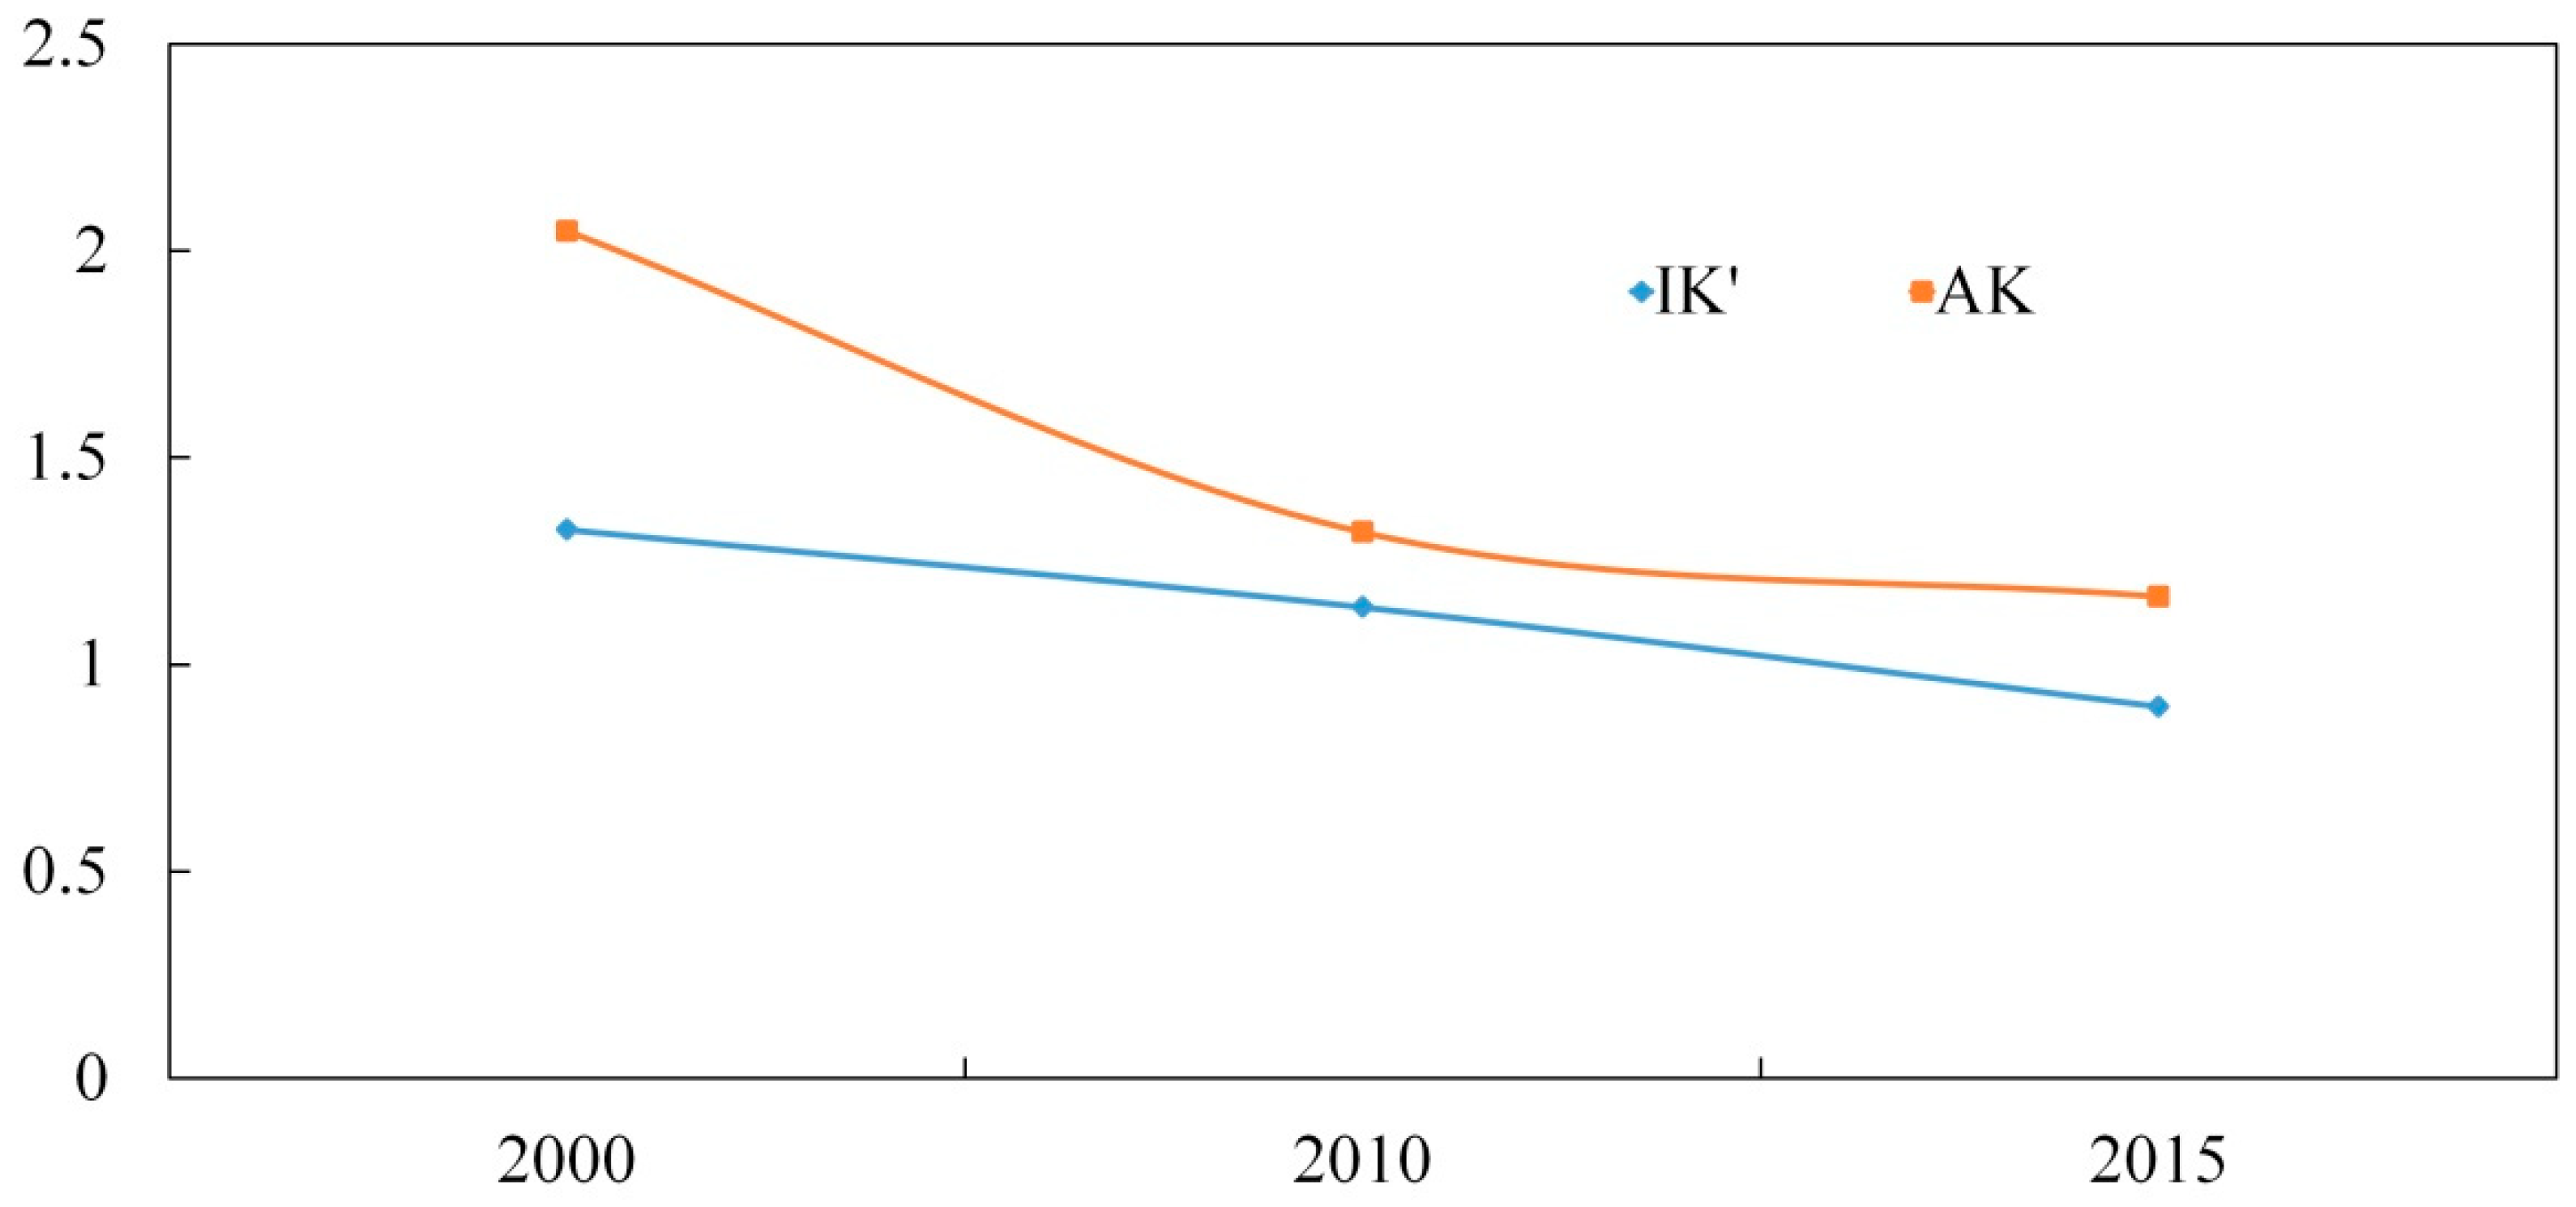
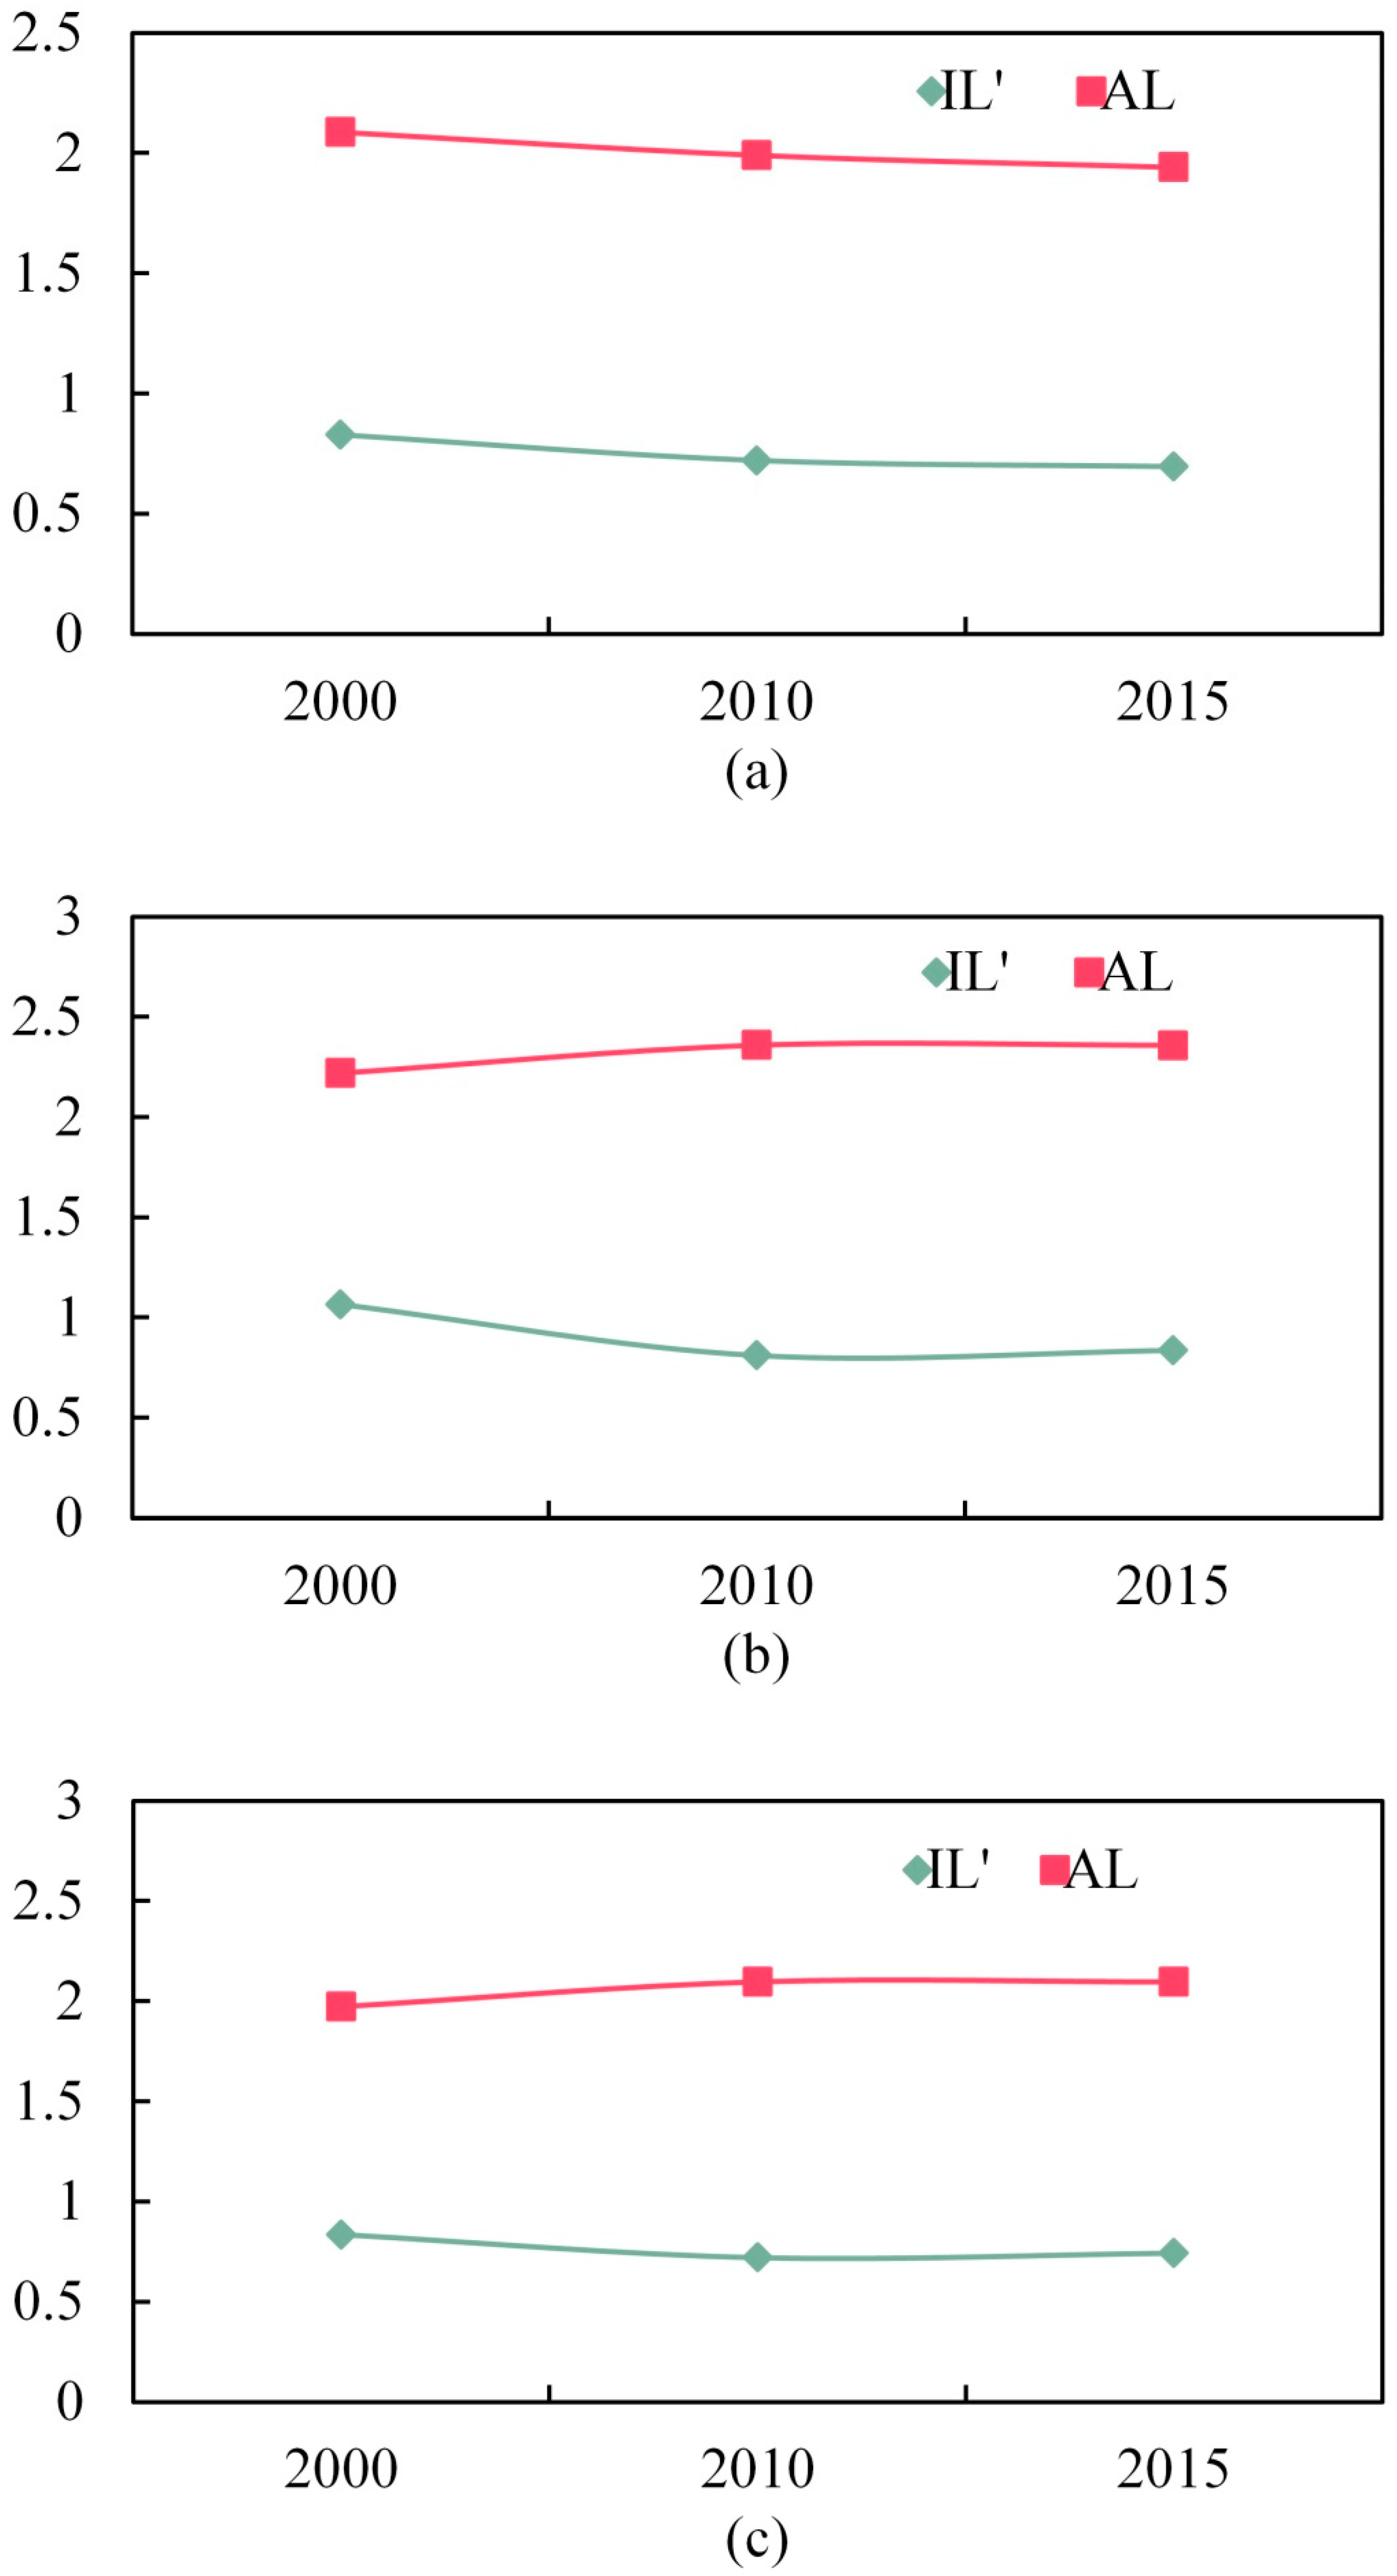
To meet the level of capital and labor input necessary for the moderately intensive use of land resources, it is necessary to compare the marginal output of a single input with the average output during the same period and determine its development stage to assess it. The marginal and average production of capital and labor inputs, respectively, are calculated while the other inputs remain constant: IK’, IL’, AK, and AL. In terms of labor input, this research separately considers the actual labor input of Jinan City, the appropriate population of the land’s ecology in Jinan City as the labor input, and the upper limit of land resources; that is, 120% of the moderate number of people on the land is used as the labor input during the study period. The results in the three cases of land resource intensification are discussed to better analyze the impact of labor input in Jinan City on regional sustainable development and intensive land use. Taking Jinan City as an example, the first case represents an analysis of the investment in capital. The results are shown in Figure 9.
The analysis results show that the marginal production and average output of capital investment decrease as capital investment in Jinan City and the districts and counties under its jurisdiction increases during the period from 2000 to 2015. However, the marginal production is greater than zero, indicating that these areas are at the stage of intensive capital investment.
The analysis results based on the actual labor investment in Jinan are shown in Figure 10a. The marginal production and average output of labor investment in Jinan City, Lixia, Shizhong, Huaiyin, Tianqiao, Licheng, and Changqing decrease with the increase in labor input, indicating that these areas are at the stage of excessive intensification of labor. The remaining districts and counties increased as the labor input increased.
The analysis results based on the appropriate population of the land’s ecology in Jinan City as the labor input are shown in Figure 10b. The marginal production and average output of labor in Lixia, Shizhong, Huaiyin, and Tianqiao increase as the labor input increases, indicating that these areas are at the stage of low labor intensification. The remaining districts and counties decreased as the labor input increased.
The analysis results based on the maximum capacity of land resources—that is, 120% of the ecologically sustainable population of the land’s ecology in Jinan City—as the labor input are shown in Figure 10c. The situation of the upper limit population of the land’s resource carrying capacity as the labor input in Jinan City is basically the same as the actual investment in Jinan City. The marginal production and average output of labor in Lixia, Shizhong, Huaiyin, and Tianqiao increase as the labor input increases, indicating that they are at the stage of excessive labor intensification. The remaining districts and counties decreased as the labor input increased. These results are basically consistent with the research results of the number of people who can be carried by the land resource of the districts and counties as the labor input.
3.4.3. Analysis of the Reasonable Interval of Factor Inputs
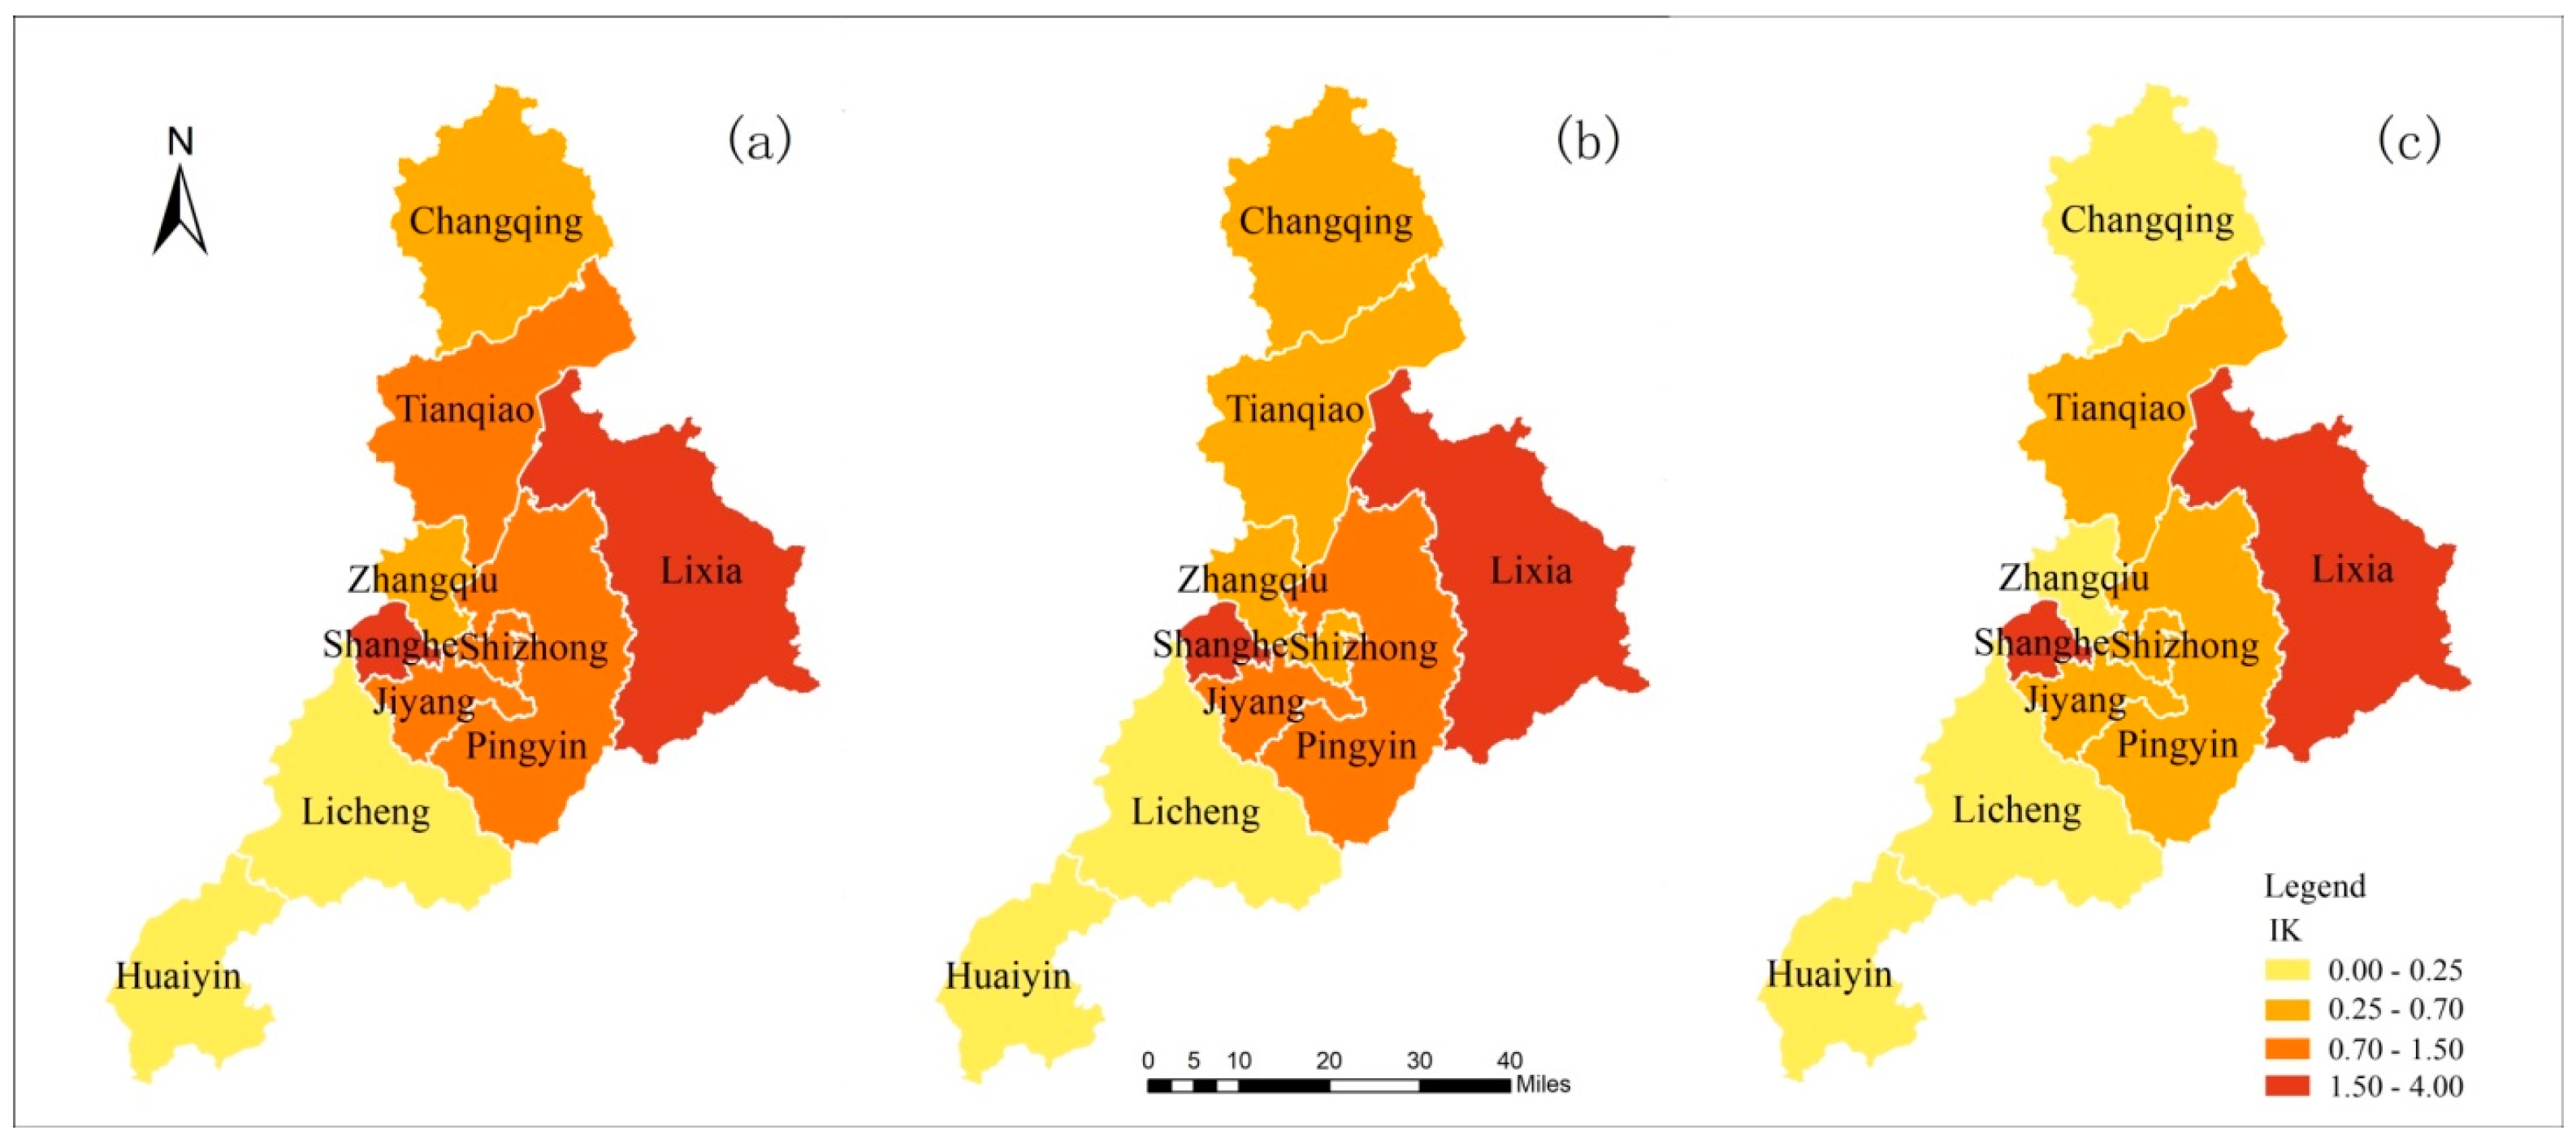
According to the development conditions of the five stages in intensification variable theory, by studying the change trends in the marginal production and average output of the single inputs of capital and labor, while maintaining the other variables, such as science and technology input constant, the position of production development is delineated. Combined with the marginal production value (as shown in Figure 11), this analysis determines the level of intensification of land use development in Jinan City and its districts and counties, and assesses the current reasonable range of capital and labor input for intensive land use.
The results show that in the case of capital investment as a single factor, the intensification level of Huaiyin, Tianqiao, Licheng, Changqing, and Zhangqiu was at the stage of moderate intensification at the beginning of the study and that the intensive degree improved during the later period. Among these areas, Huaying, Licheng, and Zhangqiu have the least output of marginal capital, suggesting that capital investment is at an excessive intensification stage in these regions. The intensification levels of Lixia, Shizhong, and Jiyang were at the stage of low intensification at the beginning of the study and reached the stage of moderate intensification during the later period. With the passage of time, the intensification level of Jinan City progressed from the stage of moderate intensification to the stage of intensive utilization.
In the case of the single input of actual labor, the marginal production and average output of the labor input in Jinan City, Lixia, Shizhong, Huaiyin, Tianqiao, and Licheng decrease as the labor input increases. In the case of the ecologically sustainable population as a single input of labor, in addition to Lixia, Shizhong, Huaiyin, Tianqiao, Licheng, and Jinan City, the marginal production and average output of labor input decrease as the labor input increases. In the case of the upper limit population of the land resource carrying capacity as the labor input, the results are consistent with the analysis results of the situation with the population of the carrying capacity of land resources as the single input of labor. However, due to the uneven distribution of labor and land resources in all districts and counties under Jinan City, according to the analysis results, the reasonable input range of the labor force in each district and county is the range that falls between the number of people who can be carried in each region and the actual labor force.
Through the comparative analysis of the situation of the upper limit population of the land resource carrying capacity as the labor input and the situation of the actual labor input in Jinan City and the districts and counties under its jurisdiction, the current labor input is basically the same with the upper limit population of the land’s resource carrying capacity as the labor input, and in these two cases, the marginal output of the labor input is greater than zero; that is, the current labor input in Jinan is in a reasonable and intensive investment range. The actual labor input of Changqing, Pingyin, Jiyang, Shanghe, and Zhangqiu is less than the population of the carrying capacity of land resources. Therefore, it can be judged that in Jinan City and the districts and counties under its jurisdiction, the labor input of Huaiyin, Tianqiao, and Licheng is at an excessively intensive use stage, and the labor input of the remaining districts and counties is at a low intensive utilization stage.
4. Conclusions
Based on intensification variable theory, this research considers Jinan City in Shandong Province as the research object, and constructs a sustainable intensification variable-based model of land resources, simulating and analyzing the land use situation in Jinan City and the 10 districts (counties) under its jurisdiction. The major conclusions are as follows:
(1) This research constructs a sustainable intensification variable model of land use by studying the concept of intensification variables and estimates the situation of land use by determining the appropriate interval of intensive land use and the intensive utilization degree of land resources. This research focuses on the limitations of the ecological carrying capacity of regional land resources and the role of additional factor inputs under the current state of scientific and technological development. The role of additional factor inputs in intensive land utilization has been judged, and the reasonable input range of each factor under the conditions of sustainable intensive use of land resources has been determined. Combined with the input level of each factor in the study area, the sustainable intensive use level of land resources in the study area has been judged. The sustainable intensification variable model can evaluate the situation of the intensive use of regional land resources, which can then guide the rational use of land resources in the future. According to the construction process of the sustainable intensification variable model, each module of the intensification variable model can be changed and combined flexibly according to the actual situation of the study area and the differences in the available data. Furthermore, the calculation results of each module can be analyzed as a single analysis result, and related modules can be analyzed in an integrated manner to provide data and paths for different studies.
(2) Using land resource data, regional economic data, regional population data, and other relevant data from Jinan City and its districts and counties to test the rationality of the sustainable intensification variable model, this evaluation method can be used to obtain the elasticity coefficient of the capital and labor input in Jinan City and its districts and counties, drawing the intensification variable curves, the marginal production curves, and the average production curve of capital and labor input as single factors of the unit resource. In the case of other inputs, such as technology and science, these curves remain unchanged. Combined with the actual situation of the study area, the intensification variable curve is analyzed to determine the interval of moderately intensive use and the intensive development stage of regional land. The results of this study can provide policy recommendations to local governments to manage the process of regional urbanization development. It is recommended to guide the rational use of land resources in Jinan City in the future.
(3) In this research, the parameters of regional sustainable development are added to the intensification variable model to revise the model, and the problem of the sustainable intensive land use evaluation and the determination of the rational interval of factors for land input are partially solved. However, the sustainable development variable adopts the ecological carrying capacity of land resources as the correction coefficient. In the evaluation process of regional sustainable development, the limitation of this research is that the sustainable development variable adopts the ecological carrying capacity of land resources as the correction coefficient. In the evaluation process of regional sustainable development, only the index of land resource ecological carrying capacity is imperfect. It is impossible to accurately simulate the consumption, storage, and conversion of materials and energy in the process of urban development. The introduction of urban metabolism theory provides new ideas for solving urban sustainable development problems, helps to open urban black boxes, explores the internal mobility process, and provides a research basis for solving key problems of urban sustainable development [66,67]. In future studies, the urban metabolism can be used as a variable for the evaluation of sustainable urban development, improving the accuracy of simulation results. Moreover, the modules used to form the model in this study use a large amount of data, and the traditional calculation means can cause a large workload and error. In future research, the comprehensive evaluation of regional sustainable development based on intensification variables can be taken as the research focus. Through the research on high-performance computing [68], the intelligent calculation of parameter optimization and parallelization is conducive to the long-term calculation of the sustainable intensive land use in the study area, and at the same time facilitates the research in other areas.
Author Contributions
Q.Q. developed the original idea. All authors designed this study. Q.Q. collected and analyzed the data. Q.Q. established the model and wrote the first paper. H.L. and X.Z. revised the paper. All authors read and approved the final manuscript. H.L. provided project funding support.
Funding
This study was supported by The National Natural Science Foundation of China (grant no.71673256).
Acknowledgments
We are particularly grateful to the academic editors and all reviewers for their critical comments or suggestions, which have had a significant impact on improving the quality of this manuscript.
Conflicts of Interest
The authors declare no conflict of interest.
References
- WCED. Our Comnon Future; Oxford University Press: Oxford, UK, 1987.
- NICN; UNEP; WWF. Caring for the Earth—A Strategy Sustainable Living; Taylor and Francis: Gland, Switzerland, 1991.
- Yang, D.G.; Niu, W.Y. Approach to sustainable development theory for the broken amendment. Ecol. Econ. 2001, 1, 7–9. [Google Scholar]
- Zheng, X.Q. Optimize the Allocation of Intensive Use Evaluation of Urban Land-Theory, Methods, Techniques, Empirical; Science Press: Beijing, China, 2004. [Google Scholar]
- Wiggering, H.; Dalchow, C.; Glemnitz, M. Indicators for multifunctionak land use-linking socio-economic requirments with landscape potentials. Ecol. Indic. 2006, 1, 38–49. [Google Scholar]
- Joshi, K.K.; Kono, T. Optimization of floor area ratio regulation in a growing city. Reg. Sci. Urban Econ. 2009, 39, 502–511. [Google Scholar] [CrossRef]
- Kono, T.; Kaneko, T. Necessity of minimum floor area ratio regulation: A second-best policy. Ann. Reg. Sci. 2008, 8, 1–17. [Google Scholar] [CrossRef]
- Bai, X.M.; Shi, P.J.; Liu, Y.S. Society: Realizing China’s urban dream. Nature 2014, 509, 158–160. [Google Scholar] [CrossRef] [PubMed]
- Wu, J.G. Landscape ecology, cross-disciplinarity, and sustainability science. Landsc. Ecol. 2006, 21, 1–4. [Google Scholar] [CrossRef]
- Kates, R.W. What kind of a science is sustainability science? Proc. Natl. Acad. Sci. USA 2011, 108, 19449–19450. [Google Scholar] [CrossRef] [Green Version]
- Kates, R.W.; Parris, T.M. Long-term trends and a sustainability transition. Proc. Natl. Acad. Sci. USA 2003, 100, 8062–8067. [Google Scholar] [CrossRef] [Green Version]
- Vierikko, K.; Pellikka, J.; Hanski, I.K.; Myllyviita, T.; Niemelä, J.; Vehkamäki, S.; Lindén, H. Indicators of sustainable forestry: The association between wildlife species and forest structure in Finland. Ecol. Indic. 2010, 10, 361–369. [Google Scholar] [CrossRef]
- Kerka, G.V.; Manuel, A.R. A comprehensive index for a sustainable society: The SSI-the Sustainable Society Index. Ecol. Econ. 2008, 66, 228–242. [Google Scholar] [CrossRef]
- Eugenio, F.B.; Carlos, O.R.; Enrique, C.T. Green accounting and sustainability of the Peruvian metal mining sector. Resour. Policy 2010, 35, 156–167. [Google Scholar]
- Wu, Y.Z.; Wu, C.F.; Luo, W.B. Research on the influencing factors and the effects on urban land economic density based on the genomics perspective. China Land Sci. 2013, 27, 26–33. [Google Scholar] [CrossRef] [PubMed]
- Zhu, Y.Z.; Cao, Y. Assessment of urban land intensive use based on PSR model: A case study of Guangdong province. Econ. Geogr. 2011, 31, 1375–1380. [Google Scholar]
- Duvarci, Y.; Yigitcanlar, T. Integrated modeling approach for the transportation disadvantaged. J. Urban Plan. Dev. 2007, 133, 188–200. [Google Scholar] [CrossRef]
- Wang, B.; Zheng, J.X. Research on the evaluation of land intensive utilization in megalopolis of China. J. Univ. Sci. Technol. Beijing (Soc. Sci. Ed.) 2006, 22, 24–28. [Google Scholar]
- Lau, S.S.Y.; Giridharan, R.; Ganesan, S. Multiple and intensive land use: Case studies in Hong Kong. Habitat Int. 2004, 3, 527–546. [Google Scholar] [CrossRef]
- Wang, Y.H. Study on the intensive use of urban land-A case study of hill area in the middle of Sichuan province. Energy Procedia 2011, 5, 85–89. [Google Scholar]
- Kuemmerle, T.; Erb, K.; Meyfroidt, P.; Müller, D.; Verburg, P.H.; Estel, S.; Haberl, H.; Hostert, P.; Jepsen, M.R.; Kastner, T.; et al. Challenges and opportunities in mapping land use intensity globally. Curr. Opin. Environ. Sustain. 2013, 5, 484–493. [Google Scholar] [CrossRef] [PubMed] [Green Version]
- Levers, C.; Butsic, V.; Verburg, P. Drivers of changes in agricultural intensity in Europe. Land Use Policy 2016, 58, 380–393. [Google Scholar] [CrossRef]
- Temme, A.J.A.M.; Verburg, P.H. Mapping and modeling of changes in agricultural intensity in Europe. Agric. Ecosyst. Environ. 2011, 140, 46–56. [Google Scholar] [CrossRef]
- Chen, B.M.; Zhang, F.R. Theory and methodology for sustainable land use indicator system in China. J. Nat. Resour. 2007, 16, 197–203. [Google Scholar]
- Cai, Y.L.; Li, J. Measurement of land use sustainability: A comprehensive method representing processes. Acta Geogr. Sin. 2003, 52, 305–313. [Google Scholar]
- Cao, Y.G.; Yuan, C.; Zhou, W.; Wang, J.; Qian, M.J. Appraisal of construction land intensive use based on principle component analysis in China. Ecol. Environ. Sci. 2008, 17, 1657–1661. [Google Scholar]
- Deng, J.S.; Wang, K.; Deng, Y.H.; Qi, G.J. PCA-based land-use change detection and analysis using multitemporal and multisensor satellite data. Int. J. Remote Sens. 2008, 29, 4823–4838. [Google Scholar] [CrossRef]
- Giorgio, G.A.; Ragosta, M.; Telesca, V. Application of a multivariate statistical index on series of weather measurements at local scale. Measurement 2017, 112, 61–66. [Google Scholar] [CrossRef]
- Zhao, L.; Zhu, Y.M.; Fu, M.C. Comparative study on intensive use of rural residential land based on principal component analysis and entropy method. Trans. Chin. Soc. Agric. Eng. 2012, 28, 235–242. [Google Scholar]
- Li, J.G.; Zhang, X.J.; Gao, Y.M.; Zang, J.M. Dynamic analysis and evaluation on the degree of urban land intensive use based on improved entropy model: A case of Guangzhou city. Areal Res. Dev. 2012, 31, 118–123. [Google Scholar]
- William, A. The African Husbandman; Oliver and Boyd: Edinburg, TX, USA, 1965. [Google Scholar]
- Wu, J.; Deng, X.H.; Liu, P.H. Study on land intensive evaluation of urban construction based on AHP. J. Shandong Agric. Univ. (Nat. Sci. Ed.) 2018, 49, 828–831. [Google Scholar]
- Li, K.Q.; Chen, Y.R. Evaluation on the intensity of urban land use based on low-carbon concept: A case study of Nanjing City. China Land Sci. 2013, 27, 61–66. [Google Scholar]
- Wu, S.; Jiang, Q.G. Evaluation of intensive land use in the small city based on RS and GIS. China Popul. Resour. Environ. 2015, 25, 53–57. [Google Scholar]
- Davidson, D.A.; Theocharopoulos, S.P.; Bloksma, R.J. A land evaluation project in Greece using GIS and based on Boolean and fuzzy set methodologies. Int. J. Geogr. Inf. Syst. 1994, 8, 369–384. [Google Scholar] [CrossRef]
- Luo, H.C.; Li, X.M.; Zheng, S.J.; Li, M.; Song, L.-L. Study on synthesis evaluation of intensive land use and growth pattern transformation of towns. J. Comput. 2012, 7, 1959–1966. [Google Scholar] [CrossRef]
- Yang, J.; Jin, G.; Huang, X.J.J.; Chen, K.; Meng, H. How to Measure Urban Land Use Intensity? A Perspective of Multi-Objective Decision in Wuhan Urban Agglomeration, China. Sustainability 2018, 10, 3874. [Google Scholar] [CrossRef]
- Taleai, M.; Sharifi, A.; Sliuzas, R. Evaluating the compatibility of multi-functional and intensive urban land uses. Int. J. Appl. Earth Obs. Geoinf. 2007, 9, 375–391. [Google Scholar] [CrossRef]
- Wang, F.; Antipova, A.; Porta, S. Street centrality and land use intensity in Baton Rouge, Louisiana. J. Transp. Geogr. 2011, 19, 285–293. [Google Scholar] [CrossRef] [Green Version]
- Li, G.D.; Fang, C.L.; Pang, B. Quantitative measuring and influencing mechanism of urban and rural land intensive use in China. J. Geogr. Sci. 2014, 24, 858–874. [Google Scholar] [CrossRef]
- Ferdous, N.; Bhat, R.C. A spatial panel ordered-response model with application to the analysis of urban land-use development intensity patterns. J. Geogr. Syst. 2013, 15, 1–29. [Google Scholar] [CrossRef]
- Wang, M.S.; Zhu, M. Evaluating intensive land use situation of development zone based on cloud models. Trans. Chin. Soc. Agric. Eng. 2012, 28, 247–252. [Google Scholar]
- Choi, Y.G.; Wang, N. The Economic Effciency of Urban Land Use with a Sequential Slack-Based Model in Korea. Sustainability 2017, 1, 79. [Google Scholar] [CrossRef]
- Cui, J.M.; Ji, W.G. AHP-based fuzzy comprehensive evaluating for land intensive use level. Res. Soil Water Conserv. 2011, 18, 122–125. [Google Scholar]
- Huang, J.N.; Lu, X.X.; Jefferey, M.; Sellers, A. global comparative analysis of urban form: Applying spatial metrics and remote sensing. Landsc. Urban Plan. 2007, 82, 184–197. [Google Scholar] [CrossRef]
- Tim, V.D.V.; Wolfgang, J.; Frank, C. Mapping form and function in urban areas: An approach based on urban metrics and continuous impervious surface data. Landsc. Urban Plan. 2011, 102, 143–155. [Google Scholar]
- Di, X.H.; Hou, X.Y.; Wang, Y.D.; Wu, L. Spatial-temporal characteristics of land use intensity of coastal zone in China during 2000–2010. Chin. Geogr. Sci. 2015, 25, 51–61. [Google Scholar] [CrossRef]
- Gong, J.Z.; Chen, W.L.; Liu, Y.S. The intensity change of urban development land: Implications for the city master plan of Guangzhou, China. Land Use Policy 2014, 40, 91–100. [Google Scholar] [CrossRef]
- Zheng, X.Q. Intensive variables and measurement of intensive land use-the fifth in the series of the basic theory of economical and intensive land use. Nat. Resour. Econ. China 2014, 27, 10–14. [Google Scholar]
- Peng, X.Z.; Liu, Y.H. Ecological footprint and regional eco-optimum population: Take China’s Western Provinces as an example. Mark. Demogr. Anal. 2004, 10, 9–15. [Google Scholar]
- Statistics Bureau of Jinan City. Jinan Statistical Yearbook 2000; China Statistics Press: Jinan, China, 2001.
- Statistics Bureau of Jinan City. Jinan Statistical Yearbook 2010; China Statistics Press: Jinan, China, 2011.
- Statistics Bureau of Jinan City. Jinan Statistical Yearbook 2015; China Statistics Press: Jinan, China, 2016.
- Rees, W.E. Ecological footprints and appropriated carrying capacity: What urban economic leaves out. Environ. Urban. 1992, 4, 121–130. [Google Scholar] [CrossRef]
- Wackernagel, M.; Onisti, L.; Bello, P.; Linares, A.C.; Falfán, I.S.L.; García, J.M.; Guerrero, A.I.S.; Guerrero, M.G.S. National natural capital accounting with the ecological footprint concept. Ecol. Econ. 1999, 29, 375–390. [Google Scholar] [CrossRef]
- Xu, Z.M.; Zhang, Z.Q. The calculation and analysis of ecological footprints of Gansu province. Acta Geogr. Sin. 2000, 55, 607–616. [Google Scholar]
- Liang, B. Assessment of Sustainable Development in Central Region Based on Ecological Footprint Model. Master’s Thesis, Hefei University of Technology, Hefei, China, 2013. [Google Scholar]
- Mon, D.L.; Cheng, C.H.; Lin, J.C. Evaluating weapon system using fuzzy analytic hierarchy process based on entropy weight. Fuzzy Sets Syst. 1994, 62, 127–134. [Google Scholar] [CrossRef]
- Peng, H.; Zhang, S.R. Economic interpretation of the progress of science and technology. Sci. Technol. Ind. 2011, 11, 143–150. [Google Scholar]
- Luis, O. Parametric decomposition of a generalized Malmquist productivity index. J. Product. Anal. 2002, 18, 5–22. [Google Scholar]
- Rolf, F.; Shawna, G.; Mary, N.; Zhang, Z.Y. Productivity growth, technical progress, and efficiency changes in industrialized countries. Am. Econ. Rev. 1994, 1, 66–83. [Google Scholar]
- Liu, J.H. Study on Low-Carbon Land Use Based on Improved Ecological Footprint Model—A Case Study of Jinan City. Ph.D. Thesis, China University of Geosciences, Beijing, China, 2013. [Google Scholar]
- Yin, X.T. The Sustainable Development of Jinan City Based on Ecology. Master’s Thesis, Shangdong University, Jinan, China, 2014. [Google Scholar]
- Guo, C.; Liu, Q. Analysis on intensive utilization of land resources in the process of urbanization—Taking Jinan city in Shandong province as an example. Shandong Land Resour. 2017, 33, 93–96. [Google Scholar]
- Zhang, B.L. Evaluation and Optimization of Land Intensive Utilization in Jinan City. Master’s Thesis, Shangdong University, Jinan, China, 2012. [Google Scholar]
- Lu, Y.; Chen, S. A review on urban metabolism: Connotation and methodology. Acta Ecol. Sin. 2015, 35, 2438–2451. [Google Scholar]
- Huang, Q.; Zheng, X.Q.; Hu, Y.C. Analysis of land-use emergy indicators based on urban metabolism: A case study for Beijing. Sustainability 2015, 7, 7473–7491. [Google Scholar] [CrossRef]
- Zheng, M.; Tang, W.; Zhao, X. Hyperparameter optimization of neural network-driven spatial models accelerated using cyber-enabled high-performance computing. Int. J. Geogr. Inf. Sci. 2019, 2, 314–345. [Google Scholar] [CrossRef]
Figure 1.
The sustainable intensification variable model framework used in this paper.

Figure 2.
The ecological carrying capacity of land in Jinan in 2000.

Figure 3.
The ecological carrying capacity of land in Jinan in 2010.

Figure 4.
The ecological carrying capacity of land in Jinan in 2015.

Figure 5.
Comparison of land use status and land use planning in Jinan.

Figure 6.
The strength estimation results of science and technology progress in Jinan.

Figure 7.
(a) Development figure of land Sustainable intensification variables in Jinan from 2000 to 2015. (b) Development figure of land intensified variables in Jinan from 2000 to 2015.
Figure 7.
(a) Development figure of land Sustainable intensification variables in Jinan from 2000 to 2015. (b) Development figure of land intensified variables in Jinan from 2000 to 2015.

Figure 8.
The impact of the revision of ecological footprint on the marginal output and average output of labor factors in intensive land use from 2000 to 2015.
Figure 8.
The impact of the revision of ecological footprint on the marginal output and average output of labor factors in intensive land use from 2000 to 2015.

Figure 9.
Marginal output and average output of Jinan City under the status of capital single input from 2000 to 2015.
Figure 9.
Marginal output and average output of Jinan City under the status of capital single input from 2000 to 2015.

Figure 10.
(a) Marginal output and average output of Jinan City under the status of labor single input from 2000 to 2015; (b) marginal output and average output of Jinan City under the status of land ecologically appropriate population as labor single input from 2000 to 2015; (c) marginal output and average output of Jinan City under the status of the maximum capacity of land resource as labor single input from 2000 to 2015.

Figure 11.
Marginal output of capital single input in Jinan from 2000 to 2015.

© 2019 by the authors. Licensee MDPI, Basel, Switzerland. This article is an open access article distributed under the terms and conditions of the Creative Commons Attribution (CC BY) license (http://creativecommons.org/licenses/by/4.0/).
Share and Cite
MDPI and ACS Style
Qian, Q.; Liu, H.; Zheng, X. A Regional Sustainable Intensive Land Use Evaluation Based on Ecological Constraints: A Case Study in Jinan City. Sustainability 2019, 11, 1434. https://doi.org/10.3390/su11051434
AMA Style
Qian Q, Liu H, Zheng X. A Regional Sustainable Intensive Land Use Evaluation Based on Ecological Constraints: A Case Study in Jinan City. Sustainability. 2019; 11(5):1434. https://doi.org/10.3390/su11051434
Chicago/Turabian StyleQian, Qian, Haiyan Liu, and Xinqi Zheng. 2019. "A Regional Sustainable Intensive Land Use Evaluation Based on Ecological Constraints: A Case Study in Jinan City" Sustainability 11, no. 5: 1434. https://doi.org/10.3390/su11051434
Note that from the first issue of 2016, this journal uses article numbers instead of page numbers. See further details here.