Cyclists’ Multiple Environmental Urban Exposures—Comparing Subjective and Objective Measurements


1
Department of Urban and Environmental Sociology, Helmholtz Centre for Environmental Research—UFZ, 04318 Leipzig, Germany
2
Department of Urban Development and Mobility, Luxembourg Institute of Socio-Economic Research (LISER), 4366 Esch-sur-Alzette, Luxembourg
3
Faculty of Physics and Earth Sciences, Institute for Geography, University of Leipzig, 04103 Leipzig, Germany
*
Author to whom correspondence should be addressed.
Sustainability 2019, 11(5), 1412; https://doi.org/10.3390/su11051412
Submission received: 6 February 2019
/
Revised: 27 February 2019
/
Accepted: 2 March 2019
/
Published: 6 March 2019
(This article belongs to the Special Issue Application of Low-cost Sensors for Environmental Exposure Assessment and Mitigation)
Abstract
:Citizens in urban areas are exposed to multiple environmental stressors like noise, heat, and air pollution, with impact on human health. There is a great deal of evidence that connects human health, objective environmental exposure, and place of residence. However, little is known about subjective and objective multiple personal exposures while being mobile. To address this research gap, this paper presents results from a mixed-methods exploratory study with cyclists in the City of Leipzig, Germany. In the summer of 2017, cyclists (n = 66) wore a unique combination of sensors that measured particle number counts (PNC), noise, humidity, temperature, geolocation, and the subjective perception of each exposure on everyday routes for one week (n = 730). A smartphone application was developed to question participants about their perception of subjective exposure. The data were analyzed with three aims: (i) to compare the multiple exposure profiles of the cyclists, (ii) to contrast the objective data and subjective individual perception, and (iii) to examine the role of route decision-making and awareness of health impacts for healthier route choices. The results indicate distinct differences between the exposure profiles of cyclists. Over 80% of the cyclists underestimated their exposure to noise and air pollution. Except for heat, no significant associations between the objective and subjective data were found. This reveals an exposure awareness gap that needs to be considered in urban health planning and risk communication. It is argued that knowledge about health impacts and route characteristics plays a crucial role in decision-making about route choices. The paper concludes with suggestions to harness smart sensing for exposure mitigation and research in health geography.
1. Introduction
Active mobility is crucial to promote physical activity and healthy lifestyles in urban environments [1]. Accordingly, cycling is seen as an important part of urban mobility and is next to walking promoted in many cities as a healthy, fast, and sustainable way of travelling short distances [2]. At the same time, cyclists are prone to several environmental pressures associated with negative health effects [3,4]. The stressors heat, environmental noise, and air pollution are expected to rise in frequency and intensity as a consequence of a parallel increase in car and truck traffic, urbanization, and related urban heat island effects [5,6]. Evidence from several health studies highlights the impact of these stressors on mortality and morbidity [7,8,9]. Even though there is no direct link between personal exposure and health outcomes, it has clearly been proven that multiple environmental stressors are significantly associated with health effects and the well-being of citizens when controlling for socio-economic factors [10]. Diseases caused by air pollution, for example, were responsible for around 9 million premature deaths in 2015, and the health effects of pollution are still underestimated in calculations of the global burden of disease [11].
Measuring the multifactorial exposure on the individual level is a major methodological challenge, because cyclists are constantly on the move for everyday activities. Personal exposure assessments that follow a dynamic mobile approach are still underrepresented in exposure and health research [12]. Dynamic assessments should complement static approaches to measure exposure (e.g., based on neighborhood or administrative boundaries), as the latter do not represent the true individual area of exposures [13,14]. Recent exposure studies also emphasize the importance of microenvironments along the daily routes of citizens [15,16,17]. The exposure of cyclists is of special interest because their exposure levels can change rather easily by adapting everyday routes [18,19]. Studies in the past already compared the exposures of cyclists with those using other transport modes (e.g., car, bus, walking) but did not measure multiple stressors simultaneously [20,21].
However, besides the importance of assessing objective exposures on the move, a more comprehensive understanding of personal exposure is needed with citizens participation [22]. Therefore, subjective perceptions of exposure and health impact awareness as well as the reasons behind decision-making about certain routes should also be included in the analysis. These help to understand how aware people are about their exposure impact and to what extent this may influence their travel behavior.
Research on risk or exposure perception and its influence on protection or mitigation behavior has a long tradition in environmental research and human geography, especially in the context of event-based natural disasters (e.g., floods, earthquakes, heatwaves). Many studies have reported the importance of the coping capacity and ability of people to use skills and resources to manage adverse conditions or risks [23]. A main finding is that the coping capacity requires continual awareness. Therefore, it is surprising that, so far, exposure research in relation to environmental stressors has tended to neglect individual perceptions and largely focused on objective data, even though Bikerstaff and Walker already emphasized in 2001 the need to consider the public perception of environmental exposure (to air pollution) and its relation to the localized context [24].
Some studies investigated subjective exposure but simply related to single factors based on fixed-site data, modelled data, or questionnaire surveys [25,26,27,28]. Only one study assessed exposure perception to multiple stressors but it used a fixed-site questionnaire survey [29].
A main reason for the lack of research on perception in the domain of mobile assessments is that, in the past, methods in exposure science have been too limited to capture subjective opinions or active user feedback while mobile. Some studies used travel diaries to recall opinions about cycling behavior, but the data were only recorded at the end of the day and could contain erroneous information due to biased memories [30].
In this context, smartphone sensing methods (SSMs) and low-cost sensors prove to be a reliable and smart solution for scientific data collection in further exposure research [31,32]. In connection with low-cost sensing technologies for environmental monitoring, it is possible to investigate micro-level exposures at short time-intervals [33]. The most important advantage of SSMs is the option for coincident collection of objective and subjective data in place and time using geolocation and display prompts [34]. The study at hand applied a unique collection of wearables to investigate the dynamic personal exposure to multifactorial stressors with three main aims: (i) to compare multiple exposure profiles of urban cyclists, (ii) to contrast the objective and subjective individual perceptions of exposures, and (iii) to examine the roles of decision-making about routes and health impact awareness for healthier route choices.
2. Materials and Methods
2.1. Study Design
A mixed-methods approach was chosen using mobile objective measurements, a smartphone app-based subjective questionnaire, and a pre-study printed questionnaire. The mobile device selection was based on an earlier sensor comparison where wearables for multifactorial exposure sensing were evaluated in terms of data accuracy and ease of use (see reference [35] for all technical specifications including calibration and sensitivity analysis). Furthermore, we applied a self-designed smartphone application to measure ambient noise, geolocation, light level, and subjective opinions [34]. For ambient heat and humidity, an external sensor connected to the smartphone was used. The aim was to capture exposures and subjective experience along the everyday routes of cyclists. The exploratory study was approved by the local ethics committee of the Leipzig University (No. 191/17-ek), and all volunteers signed a written informed consent for us to record sensitive GPS travel data. Participation exclusion criteria were: smoker, age < 18 years, residency outside the City of Leipzig, commuters by car or public transport, and mean everyday cycling < 30 min.
The call for participation was sent via email distributors of local organizations and published in the press. Interested people could register on a website. A total of 100 registrations were received, of which 80 matched the inclusion criteria. Finally, we selected a group of 66 cyclists, who wore the sensors on their everyday routes for one week. The data were collected between June and September 2017 in the City of Leipzig. Since 11 sets of sensors were available, 6 weeks of measurement campaigns were carried out. The participants filled in a paper-based questionnaire before the start of the study, answering questions about their cycling behavior, health impact awareness, and socio-economic facts. The questionnaire design (Figure S1) was developed based on existing European travel surveys and the protection motivation theory [36]. During the study, the sensors were worn on all everyday cycling routes (Monday–Friday, no holidays, no rain), measuring continuously and passively the objective data, and after each trip, cyclists actively answered questions on the smartphone screen about their mean exposure perception towards noise, particle number counts (PNC), and heat, as well as detours and reasons for the trip (Figure S2).
2.2. Technical Setup
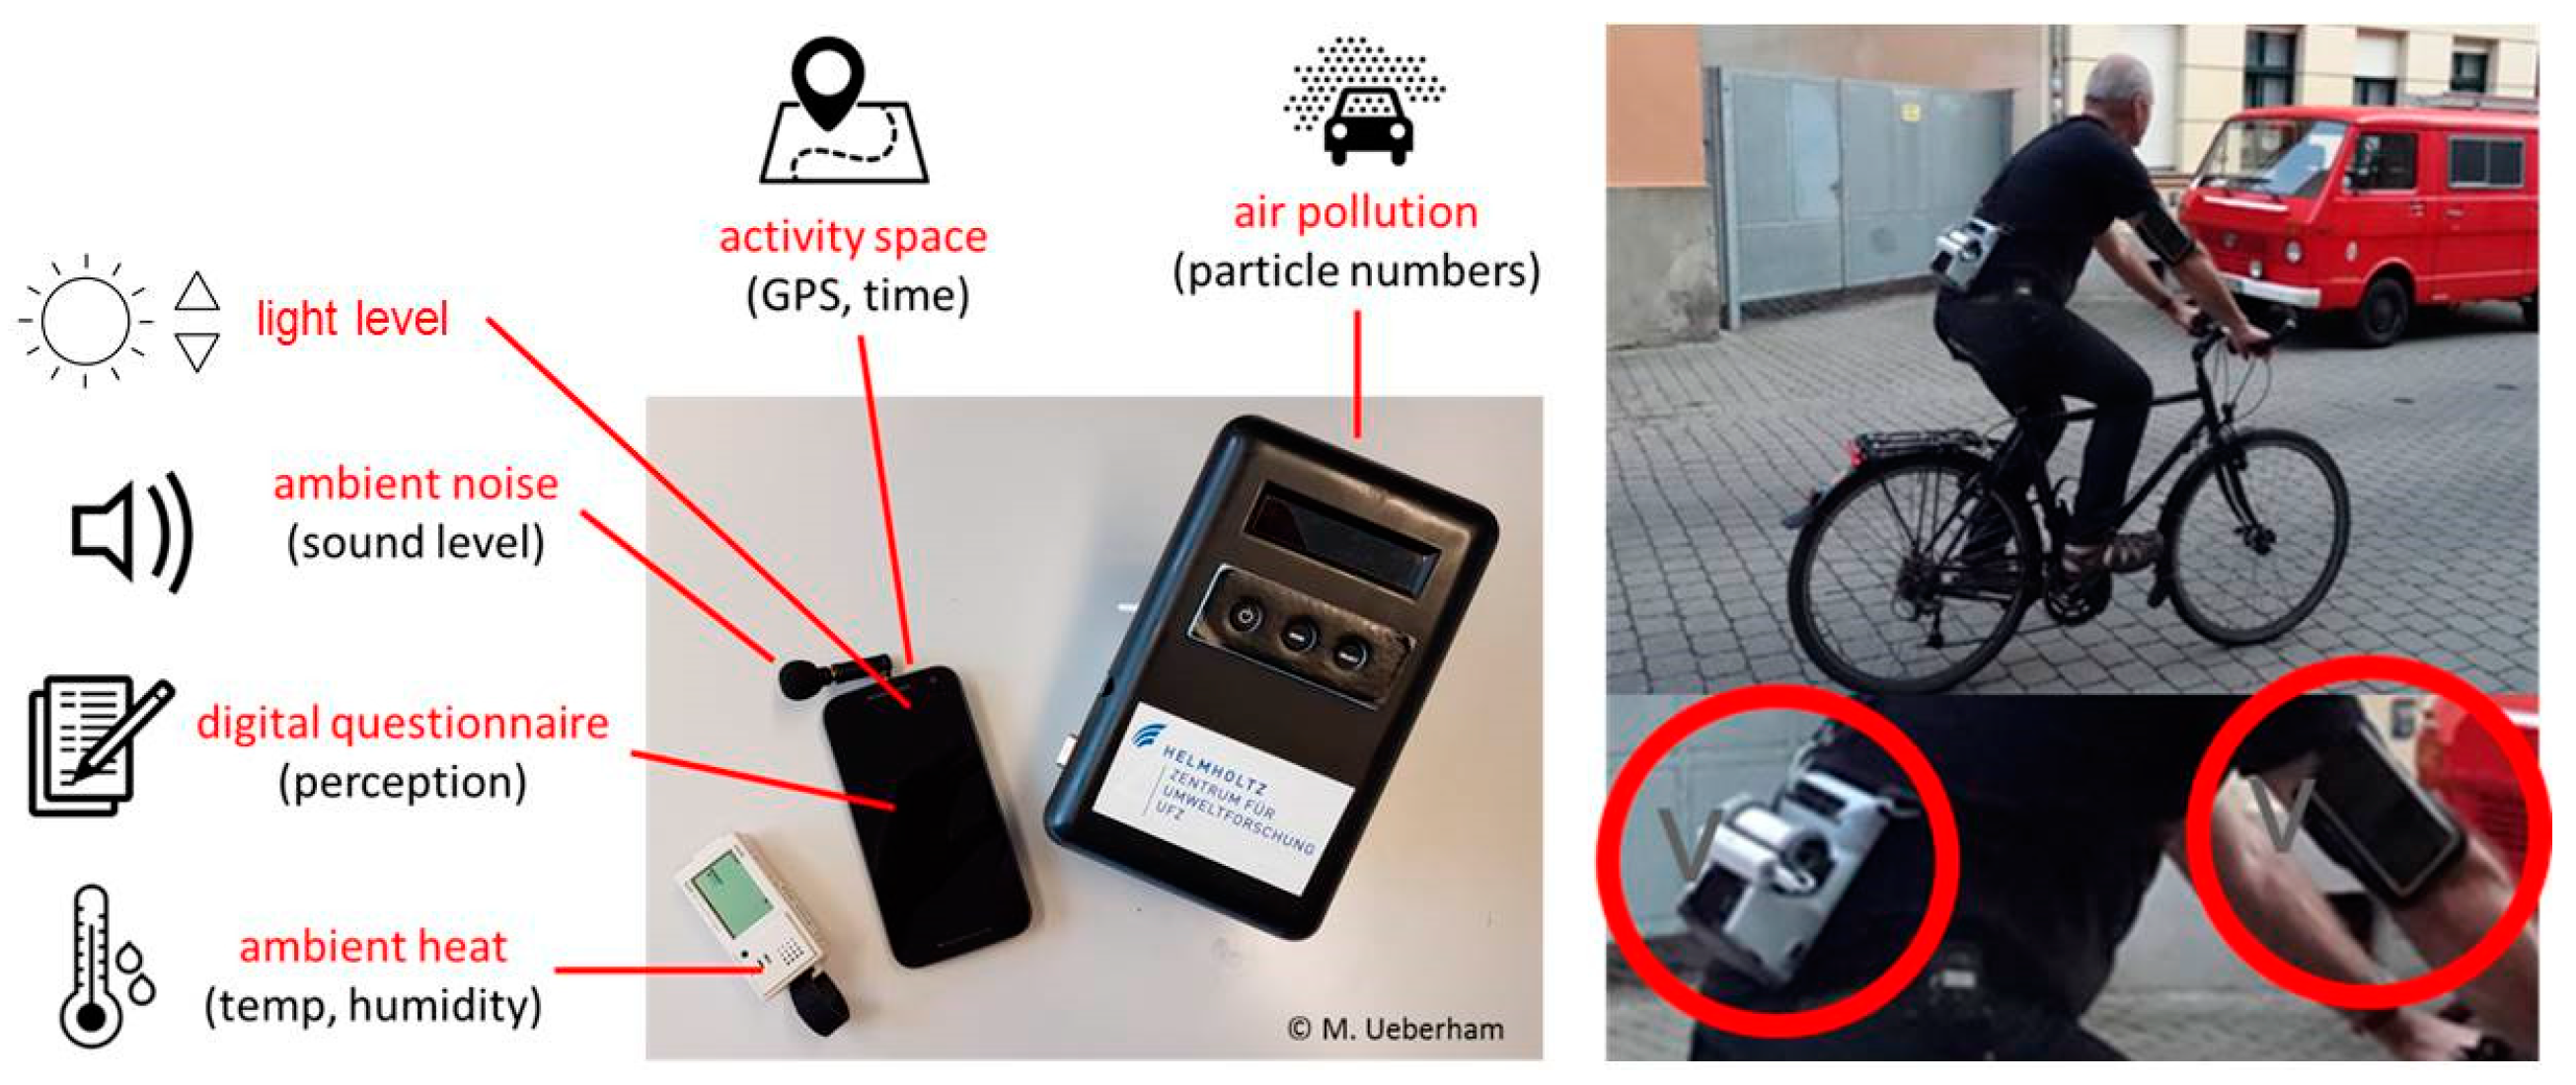
The basic equipment for each cyclist consisted of two parts (Figure 1): (i) a particle counter (Dylos DC 1700, Dylos Cooperation, Riverside, CA, USA) with an attached ventilated temperature sensor (Hobo MX 1101, Onset Computer Corporation, Bourne, MA, USA) and (ii) a smartphone (Motorola G3, Motorola Mobility LLC, Chicago, IL, USA) with an attached external microphone (ETM-001, Edutige Europe, Munich, Germany). Our designed open-source smartphone sensing application was preinstalled [34]. The recording interval for noise and heat was 2 s and 60 s (fixed interval) for air pollution. All devices were synchronized using the timestamp and internal clocks before the study.
2.3. Data Analysis
For the interpersonal comparison, the mean subjective and objective exposures of each cyclist were calculated on the basis of the mean recordings along the routes, as the subjective data were requested for each route. Subjective exposure data were gathered on an ordinal scale from 1 (very low) to 5 (very high). The objective data values were based on the original unit of each parameter (Table 1).
For the subjective versus objective comparison, the spearman rank correlations of means of each route were calculated and checked for significant difference (α = 0.05). For a better interpersonal visualization of the deviations between subjective and objective exposures, the differences for each route were computed. Therefore, the objective values were reclassified into the ordinal range of 1–5. The reclassification references for the new class ranges are listed in Table 2. The heat index of Steadman [37] is related to relative humidity. We, therefore, took the mean of 55% rH as an overall reference based on the raw data of the temperature/humidity sensor (Hobo MX1101). The health guidelines for noise reclassification were taken from the WHO [38]. Since no guidelines have been published for PNC, we decided to use quantiles to generate equally distributed classes of samples.
The subjective mean values were subtracted from the reclassified figures of the objective measurements.
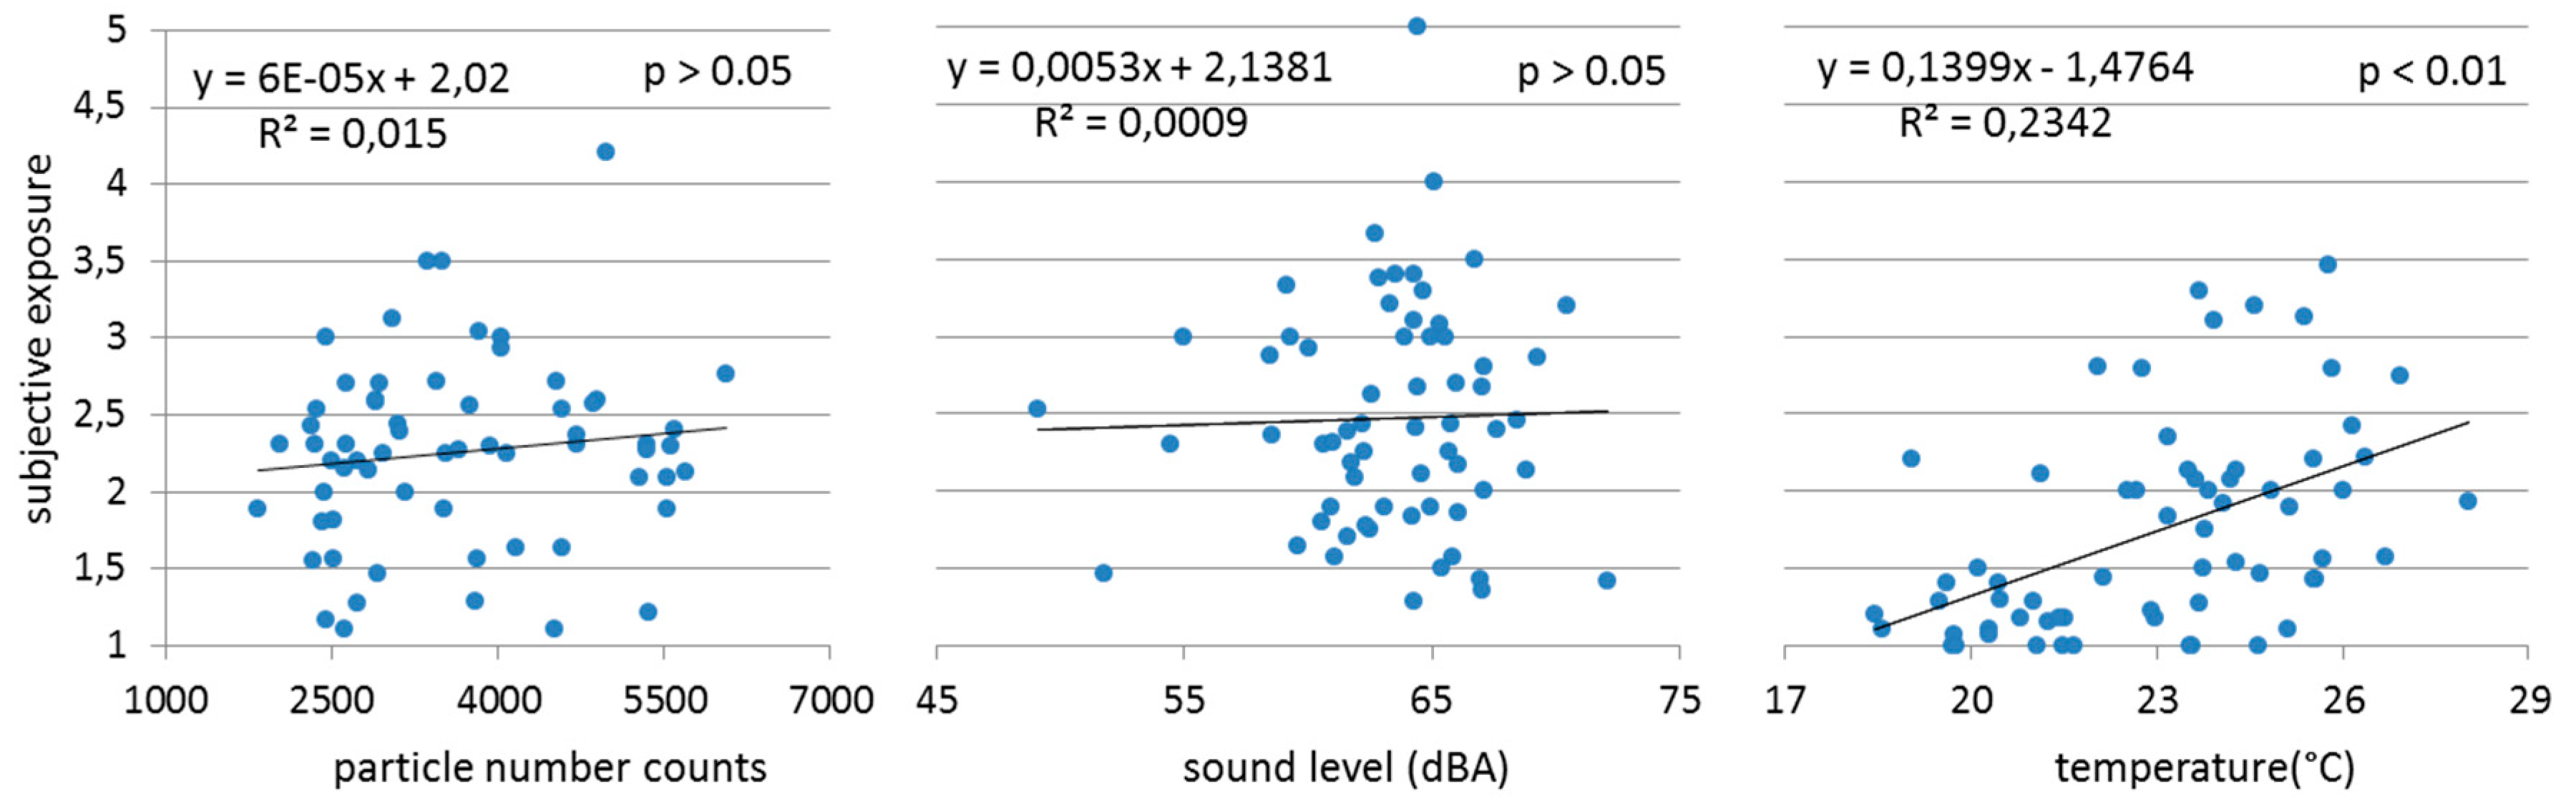
Furthermore, a ordinal regression with the cyclists mean subjective and original objective exposure values was performed to verify the findings from the correlation calculations and to test the extent to which the objective measurements can explain the subjective perception variance. For the analysis, the software SPSS Statistics 24 (IBM, Armonk, NY, USA) was used.
3. Results
3.1. Study Cohort and Descriptive Analysis
The sample of participants consisted of 66 cyclists, 45% (n = 30) male and 54% (n = 36) female, with a mean age group of 35–44 years. The mean duration of daily cycling was 45 min. In total, 80% of the cyclists were employed and commuted by bike, 10% were students, and 10% were retired; 90% rated their overall health as good to very good.
The average objective exposure per individual is listed in the supplementary information (Figure S3). The exposure of each individual depended on the route and confounding factors like weather, traffic, built-up or natural surroundings. In total, 730 cycle routes were recorded.
The mean temperature during the study period was 23 ± 3 °C. Mean noise exposure was 63.4 ± 6 dBA. The mean PNC exposure was 4020 ± 750. When all weeks were compared for stressors, lower and stable coefficients of variation (CVs) for heat (~12%) and noise (~18%) were recorded compared to PNC (57–91%), as shown in Table 3. This indicates that the exposure to PNC was to a higher extent characterized by extreme values and higher spatio-temporal variations.
3.2. Interpersonal Exposure
To compare the perception and objective exposures, the mean differences of the subjective feedback after each route was subtracted from the reclassified objective exposure values (Table 4). In general, the objective exposure to noise and PNC was twice as high as for heat. This gap, however, was lower on the perception level. The total mean interpersonal difference of perceived and real exposure was similar for noise and PNC (0.7 to 0.8) and nearly zero for heat (−0.1). A positive difference indicates that cyclists underestimated their personal objective exposure.
Accordingly, PNC and noise were clearly underestimated, whereas heat was estimated quite realistically. The mean difference for each cyclist is shown in Figure 2. The majority of cyclists underestimated their exposures to noise (84%) and PNC (80%). Thus, there was no significant correlation between the perceived and objective exposures to noise and PNC (p > 0.05). In contrast, the values for heat exposure showed a significant moderate correlation (r = 0.68). The sensitivity of the chosen objective reclassification method was tested using slightly modified scale ranges, but no significant changes of correlations were observed. The regression analysis (Figure 3) confirmed the correlation results. The objective measurements of PNC and noise were not associated with the subjective measurements and cannot explain the variation of the subjective exposure. In contrast, the objective temperature data explained 23% of the variance of the subjective data (R2 = 0.23).
3.3. Route Decision Behavior and Health Impact Awareness
The cyclists were asked about factors that influence the decision-making about their daily routes. The most frequently chosen factors were length, time taken for the route, as well as greenspaces, followed by a low volume of traffic and existing cycle lanes (Table 5).
Around 66% stated that they never or rarely change the course of their everyday cycle routes. Accordingly, route selection is strongly a matter of habit.
The answers to the health-related questions of the survey (Table 6) revealed that the perceived exposure is also a multi-dimensional construct. Most cyclists agree that the exposure to all stressors can have negative impacts on health in general (45 to 86%), and a minority even feel the direct impacts (8 to 12%). The cyclists, in general, feel highly exposed to noise (39%) and PNC (48%). Hence, a highly perceived exposure is not necessarily related to a perceived health impact. Furthermore, the minority (20 to 40%) stated that they can influence their exposure to all of the stressors through their own actions.
Surprisingly, 85% of the respondents would be willing to use a route planning application that suggests personalized low-exposure routes. One-third of them mentioned that route alternatives should not be much slower than the fastest route.
4. Discussion
4.1. Tackling the Exposure Awareness Gap
The results of the measurement campaign clearly showed that the majority of cyclists underestimated individual noise and air pollution exposure. Heat stress, on the other hand, was estimated more in line with the objective measurements. There are multiple reasons for this. Heat is more noticeable and strongly influenced by the body’s metabolism (e.g., sweating) and radiation. Furthermore, most people are pre-informed about the daily temperature by the weather forecast and expect a certain degree of heat, which ultimately also affects their perception of it to a great extent.
Except for indicators such as unpleasant smelling fumes and visible smoke, PNC are hardly perceptible for humans. Although noise is easy to recognize, citizens in urban areas are used to higher levels of daily background noise from traffic and therefore underestimate this stressor [39]. Another aspect that the results revealed is that people not only misjudge the level of their environmental exposure but also rate it less differentiated than it actually is. The mean subjective ratings (1.7 to 2.5) are closer than the objective rating (1.6 to 3.3). This indicates public misperceptions of intensities and ranges of exposure.
In consequence of the subjective underestimation of noise and PNC, one solution would be for people to choose their daily routes according to low objective exposure conditions. Even though length and time taken are important factors for route choice, the data show that greenspace also plays an equally important role, while providing healthier environmental conditions [40,41]. In addition, as roads with little traffic and existing cycle paths are of great importance to the majority, urban transport planning should prioritize cycle route planning along roads and paths other than main roads, through green areas with separate cycle (high)ways where necessary [42]. Some studies have evaluated the positive effects of alternative route choices on lower air pollution exposure [43,44]. However, the data showed that route choice is more often a matter of habit and that the majority of cyclists do not feel personal health impacts from noise, heat, and PNC. In consequence, a greater awareness should take place through the confrontation with objective personal exposure data and appropriate suggestions for healthier route alternatives. Therefore, participatory sensing projects are a promising way to enhance environmental literacy and promote public risk communication [45]. Preferably, cyclists should also be able to see the personal amount of exposure reduction as result of detours in order to raise their feeling of self-efficacy.
Smart applications like route planning apps on smartphones could help to perform a healthier route alternative analysis, but this requires further research on small-scale spatio-temporal exposure and technical developments. The data of our pilot study revealed that the willingness to use such tools is high, but they need to be easy-to-use and adjustable to the route preferences of the cyclist.
4.2. Harnessing Smart Sensing for Research in Health Geography
The approach of smart sensing can also be applied in many other demographic groups to raise awareness, especially for target risk groups with diseases (e.g., asthma, allergies, or circulation problems), as environmental stressors are expected to rise in frequency and more people are becoming vulnerable [10,46]. These groups might also be more motivated to change their everyday routes than people who may be used to a certain stressor. In this sense, more research should investigate how personal exposure assessments could be taken into account as a new “geo-medical” therapy option. To increase the motivation to use a smart sensing tool for a healthier route choice, gamification is a promising example to integrate fun and interest in using the smartphone, especially for children [47]. In general, more research should harness smart sensing for exposure assessments with children and adolescents, as they have more complex and dynamic activity spaces [48,49].
However, even if people knew more about their exposure to environmental stressors, they still might not be willing or able to change their mobility behavior. Route decision-making is complex, and relocating activity locations and travel routes is a spatio-temporal trade-off between personal health aspects, practical daily fixed constraints (e.g., the workplace, home, school), and environmental conditions (e.g., weather, terrain) [50]. These confounding factors should be taken into account in further studies, as the individual behavior, natural environment and health status have interrelated connections [51].
The possibilities of a new sensor technology to help people to develop environmental exposure mitigation strategies have not yet been sufficiently investigated. This is of more importance than ever, as urban health is an emerging topic for sustainable and livable cities [52].
4.3. Limitations
The sample of this exploratory study was biased as it consisted of highly motivated cyclists that were interested in assessing their personal exposure. The general group of cyclists may not be as interested at such a high level to use wearable sensors for exposure monitoring. However, an online survey several months after the campaign with 3280 cyclists confirmed the trend of using technology to optimize cycling. As mentioned, the heat perception is somehow influenced by expectations of a certain degree of heat; however, the real-world perception plays the dominant role for the rating.
Due to the fact that the cyclists reported their exposure perception after each trip on the smartphone, the rating may be prone to some recall bias and influenced by particular intense sensory events for noise and PNC. Future planned spatial analysis will identify these objective hotspots of high exposure events.
The cyclists of our personal exposure campaign assigned just moderate wearing comfort ratings for the sensors, and this could be improved. However, the solution might not be to carry smart sensors on every cycle trip, but to measure one week on a representative route and to check regularly after optimizing the route if the alternative is still the healthiest option.
5. Conclusions
The paper highlighted the possibilities for using smart sensing for new insights into the relationship between objective and subjective exposures exemplified by a sample of cyclists. The application of a unique set of sensors revealed a large gap between exposure perception and objective data for noise and air pollution. Cyclists are willing to take detours for exposure mitigation, but need better personalized information. In this context, the benefits of a combination of active and passive smart sensing for personal exposure assessments have so far been underestimated and should receive higher priorities in order to support future healthy urban planning [53,54]. The rapid development of mobile smart technologies and more individualized exposure data will receive greater attention in environmental science to improve human health and promote sustainable travel behavior [55,56,57]. The special value lies in the combination of health and spatio-temporal data to assess the matter of place.
Supplementary Materials
The following are available online at https://www.mdpi.com/2071-1050/11/5/1412/s1, Figure S1. Witten questionnaire Survey excerpt; Figure S2. Smartphone questionnaire survey; Figure S3. Mean objective exposure of cyclists.
Author Contributions
Conceptualization: M.U., U.S., and U.W.; Formal analysis: M.U.; Investigation: M.U.; Methodology: M.U. and U.S.; Supervision: U.S. and U.W.; Writing—original draft: M.U.; Writing—review & editing: M.U., U.S., M.D., and U.W. All authors have read and approved the final manuscript.
Funding
This work was supported by the German Federal Environmental Foundation (DBU) with a scholarship (AZ: 20015/411).
Conflicts of Interest
The authors declare no conflict of interest.
References
- Nieuwenhuijsen, M.J. Influence of urban and transport planning and the city environment on cardiovascular disease. Nat. Rev. Cardiol. 2018. [Google Scholar] [CrossRef] [PubMed]
- Oja, P.; Titze, S.; Bauman, A.; de Geus, B.; Krenn, P.; Reger-Nash, B.; Kohlberger, T. Health benefits of cycling: A systematic review. Scand. J. Med. Sci. Sports 2011, 21, 496–509. [Google Scholar] [CrossRef] [PubMed]
- Cole, C.A.; Carlsten, C.; Koehle, M.; Brauer, M. Particulate matter exposure and health impacts of urban cyclists: A randomized crossover study. Environ. Health Glob. Access Sci. Source 2018, 17, 78. [Google Scholar] [CrossRef] [PubMed]
- Khreis, H.; Warsow, K.M.; Verlinghieri, E.; Guzman, A.; Pellecuer, L.; Ferreira, A.; Jones, I.; Heinen, E.; Rojas-Rueda, D.; Mueller, N.; et al. The health impacts of traffic-related exposures in urban areas: Understanding real effects, underlying driving forces and co-producing future directions. J. Transp. Health 2016, 3, 249–267. [Google Scholar] [CrossRef]
- Kohlhuber, M.; Schenk, T.; Weiland, U. Verkehrsbezogene luftschadstoffe und lärm. In Umweltgerechtigkeit. Chancengleichheit Bei Umwelt und Gesundheit: Konzepte, Datenlage und Handlungsperspektiven; Bolte, G., Bunge, C., Hornberg, C., Köckler, H., Mielck, A., Eds.; Huber: Bern, Switzerland, 2012; p. 440. [Google Scholar]
- Schuster, C.; Honold, J.; Lauf, S.; Lakes, T. Urban heat stress: Novel survey suggests health and fitness as future avenue for research and adaptation strategies. Environ. Res. Lett. 2017, 12, 044021. [Google Scholar] [CrossRef]
- Guo, Y.; Gasparrini, A.; Armstrong, B.; Li, S.; Tawatsupa, B.; Tobias, A.; Lavigne, E.; de Sousa Zanotti Stagliorio Coelho, M.; Leone, M.; Pan, X.; et al. Global variation in the effects of ambient temperature on mortality: A systematic evaluation. Epidemiology 2014, 25, 781–789. [Google Scholar] [CrossRef] [PubMed]
- Halonen, J.I.; Hansell, A.L.; Gulliver, J.; Morley, D.; Blangiardo, M.; Fecht, D.; Toledano, M.B.; Beevers, S.D.; Anderson, H.R.; Kelly, F.J.; et al. Road traffic noise is associated with increased cardiovascular morbidity and mortality and all-cause mortality in london. Eur. Heart J. 2015, 36, 2653–2661. [Google Scholar] [CrossRef] [PubMed]
- Recio, A.; Linares, C.; Banegas, J.R.; Diaz, J. The short-term association of road traffic noise with cardiovascular, respiratory, and diabetes-related mortality. Environ. Res. 2016, 150, 383–390. [Google Scholar] [CrossRef] [PubMed]
- Krefis, A.; Augustin, M.; Schlünzen, K.; Oßenbrügge, J.; Augustin, J. How does the urban environment affect health and well-being? A systematic review. Urban Sci. 2018, 2, 21. [Google Scholar] [CrossRef]
- Landrigan, P.J.; Fuller, R.; Acosta, N.J.R.; Adeyi, O.; Arnold, R.; Basu, N.; Baldé, A.B.; Bertollini, R.; Bose-O’Reilly, S.; Boufford, J.I.; et al. The lancet commission on pollution and health. Lancet 2017, 391, 10119. [Google Scholar]
- Chaix, B. Mobile sensing in environmental health and neighborhood research. Annu. Rev. Public Health 2018, 39, 367–384. [Google Scholar] [CrossRef] [PubMed]
- Perchoux, C.; Chaix, B.; Cummins, S.; Kestens, Y. Conceptualization and measurement of environmental exposure in epidemiology: Accounting for activity space related to daily mobility. Health Place 2013, 21, 86–93. [Google Scholar]
- Zhao, P.; Kwan, M.P.; Zhou, S. The uncertain geographic context problem in the analysis of the relationships between obesity and the built environment in guangzhou. Int. J. Environ. Res. Public Health 2018, 15. [Google Scholar] [CrossRef] [PubMed]
- Mazaheri, M.; Clifford, S.; Yeganeh, B.; Viana, M.; Rizza, V.; Flament, R.; Buonanno, G.; Morawska, L. Investigations into factors affecting personal exposure to particles in urban microenvironments using low-cost sensors. Environ. Int. 2018, 120, 496–504. [Google Scholar] [CrossRef] [PubMed]
- Li, Z.; Che, W.; Frey, H.C.; Lau, A.K.H.; Lin, C. Characterization of PM2.5 exposure concentration in transport microenvironments using portable monitors. Environ. Pollut. 2017, 228, 433–442. [Google Scholar] [CrossRef] [PubMed]
- Rivas, I.; Kumar, P.; Hagen-Zanker, A.; Andrade, M.D.; Slovic, A.D.; Pritchard, J.P.; Geurs, K.T. Determinants of black carbon, particle mass and number concentrations in london transport microenvironments. Atmos. Environ. 2017, 161, 247–262. [Google Scholar] [CrossRef]
- Gilliland, J.; Maltby, M.; Xu, X.; Luginaah, I.; Shah, T. Influence of the natural and built environment on personal exposure to fine particulate matter (PM2.5) in cyclists using city designated bicycle routes. Urban Sci. 2018, 2, 120. [Google Scholar] [CrossRef]
- Hankey, S.; Marshall, J.D. On-bicycle exposure to particulate air pollution: Particle number, black carbon, PM2.5, and particle size. Atmos. Environ. 2015, 122, 65–73. [Google Scholar] [CrossRef]
- Int Panis, L.; de Geus, B.; Vandenbulcke, G.; Willems, H.; Degraeuwe, B.; Bleux, N.; Mishra, V.; Thomas, I.; Meeusen, R. Exposure to particulate matter in traffic: A comparison of cyclists and car passengers. Atmos. Environ. 2010, 44, 2263–2270. [Google Scholar] [CrossRef]
- Rank, J.; Folkeb, J.; Jespersen, P.H. Differences in cyclists and car drivers exposure to air pollution from traffic in the city of copenhagen. Sci. Total Environ. 2001, 279, 131–136. [Google Scholar] [CrossRef]
- Loh, M.; Sarigiannis, D.; Gotti, A.; Karakitsios, S.; Pronk, A.; Kuijpers, E.; Annesi-Maesano, I.; Baiz, N.; Madureira, J.; Oliveira Fernandes, E.; et al. How sensors might help define the external exposome. Int. J. Environ. Res. Public Health 2017, 14. [Google Scholar] [CrossRef] [PubMed]
- Kuhlicke, C.; Steinführer, A.; Begg, C.; Bianchizza, C.; Bründl, M.; Buchecker, M.; De Marchi, B.; Di Masso Tarditti, M.; Höppner, C.; Komac, B.; et al. Perspectives on social capacity building for natural hazards: Outlining an emerging field of research and practice in europe. Environ. Sci. Policy 2011, 14, 804–814. [Google Scholar]
- Bickerstaff, K.; Walker, G. Public understandings of air pollution: The ‘localisation’ of environmental risk. Glob. Environ. Chang. 2001, 11, 133–145. [Google Scholar] [CrossRef]
- Verbeek, T. The relation between objective and subjective exposure to traffic noise around two suburban highway viaducts in ghent: Lessons for urban environmental policy. Local Environ. 2018, 23, 448–467. [Google Scholar] [CrossRef]
- Von Szombathely, M.; Albrecht, M.; Augustin, J.; Bechtel, B.; Dwinger, I.; Gaffron, P.; Krefis, A.; Oßenbrügge, J.; Strüver, A. Relation between observed and perceived traffic noise and socio-economic status in urban blocks of different characteristics. Urban Sci. 2018, 2, 20. [Google Scholar] [CrossRef]
- Oltra, C.; Sala, R. Perception of risk from air pollution and reported behaviors: A cross-sectional survey study in four cities. J. Risk Res. 2018, 21, 869–884. [Google Scholar] [CrossRef]
- Aletta, F.; Van Renterghem, T.; Botteldooren, D. Influence of personal factors on sound perception and overall experience in urban green areas. A case study of a cycling path highly exposed to road traffic noise. Int. J. Environ. Res. Public Health 2018, 15. [Google Scholar] [CrossRef] [PubMed]
- Nikolopoulou, M.; Kleissl, J.; Linden, P.F.; Lykoudis, S. Pedestrians’ perception of environmental stimuli through field surveys: Focus on particulate pollution. Sci. Total Environ. 2011, 409, 2493–2502. [Google Scholar] [CrossRef] [PubMed]
- Allström, A.; Kristoffersson, I.; Susilo, Y. Smartphone based travel diary collection: Experiences from a field trial in stockholm. Transp. Res. Procedia 2017, 26, 32–38. [Google Scholar] [CrossRef]
- Harari, G.M.; Müller, S.R.; Aung, M.S.H.; Rentfrow, P.J. Smartphone sensing methods for studying behavior in everyday life. Curr. Opin. Behav. Sci. 2017, 18, 83–90. [Google Scholar] [CrossRef]
- Cornet, V.P.; Holden, R.J. Systematic review of smartphone-based passive sensing for health and wellbeing. J. Biomed. Inform. 2018, 77, 120–132. [Google Scholar] [CrossRef] [PubMed]
- Morawska, L.; Thai, P.K.; Liu, X.; Asumadu-Sakyi, A.; Ayoko, G.; Bartonova, A.; Bedini, A.; Chai, F.; Christensen, B.; Dunbabin, M.; et al. Applications of low-cost sensing technologies for air quality monitoring and exposure assessment: How far have they gone? Environ. Int. 2018, 116, 286–299. [Google Scholar] [CrossRef] [PubMed]
- Ueberham, M.; Schmidt, F.; Schlink, U. Advanced smartphone-based sensing with open-source task automation. Sensors 2018, 18, 8. [Google Scholar] [CrossRef] [PubMed]
- Ueberham, M.; Schlink, U. Wearable sensors for multifactorial personal exposure measurements—A ranking study. Environ. Int. 2018, 121, 130–138. [Google Scholar] [CrossRef] [PubMed]
- Plotnikoff, R.C.; Trinh, L. Protection motivation theory: Is this a worthwhile theory for physical activity promotion? Exerc. Sport Sci. Rev. 2010, 38, 91–98. [Google Scholar] [CrossRef] [PubMed]
- Steadman, R.G. The assessment of sultriness. Part i: A temperature-humidity index based on human physiology and clothing science. J. Appl. Meteorol. 1979, 18, 861–873. [Google Scholar] [CrossRef]
- World Health Organization. Environmental Noise Guideline for the European Region; World Health Organization: Copenhagen, Denmark, 2018. [Google Scholar]
- Fink, D.J. What is a safe noise level for the public? Am. J. Public Health 2017, 107, 44–45. [Google Scholar] [CrossRef] [PubMed]
- Kondo, M.C.; Fluehr, J.M.; McKeon, T.; Branas, C.C. Urban green space and its impact on human health. Int. J. Environ. Res. Public Health 2018, 15. [Google Scholar] [CrossRef] [PubMed]
- Nieuwenhuijsen, M.J.; Khreis, H.; Triguero-Mas, M.; Gascon, M.; Dadvand, P. Fifty shades of green: Pathway to healthy urban living. Epidemiology 2017, 28, 63–71. [Google Scholar] [CrossRef] [PubMed]
- Mertens, L.; Compernolle, S.; Deforche, B.; Mackenbach, J.D.; Lakerveld, J.; Brug, J.; Roda, C.; Feuillet, T.; Oppert, J.M.; Glonti, K.; et al. Built environmental correlates of cycling for transport across Europe. Health Place 2017, 44, 35–42. [Google Scholar]
- Apparicio, P.; Carrier, M.; Gelb, J.; Séguin, A.-M.; Kingham, S. Cyclists’ exposure to air pollution and road traffic noise in central city neighbourhoods of montreal. J. Transp. Geogr. 2016, 57, 63–69. [Google Scholar] [CrossRef]
- Jereb, B.; Batkovič, T.; Herman, L.; Šipek, G.; Kovše, Š.; Gregorič, A.; Močnik, G. Exposure to black carbon during bicycle commuting–alternative route selection. Atmosphere 2018, 9, 21. [Google Scholar] [CrossRef]
- Ramirez-Andreotta, M.D.; Brody, J.G.; Lothrop, N.; Loh, M.; Beamer, P.I.; Brown, P. Improving environmental health literacy and justice through environmental exposure results communication. Int. J. Environ. Res. Public Health 2016, 13. [Google Scholar] [CrossRef] [PubMed]
- San José, R.; Pérez, J.L.; Pérez, L.; Gonzalez Barras, R.M. Effects of climate change on the health of citizens modelling urban weather and air pollution. Energy 2018, 165, 53–62. [Google Scholar] [CrossRef]
- Edwards, E.A.; Lumsden, J.; Rivas, C.; Steed, L.; Edwards, L.A.; Thiyagarajan, A.; Sohanpal, R.; Caton, H.; Griffiths, C.J.; Munafo, M.R.; et al. Gamification for health promotion: Systematic review of behaviour change techniques in smartphone apps. BMJ Open 2016, 6, e012447. [Google Scholar] [CrossRef] [PubMed]
- Bagot, K.S.; Matthews, S.A.; Mason, M.; Squeglia, L.M.; Fowler, J.; Gray, K.; Herting, M.; May, A.; Colrain, I.; Godino, J.; et al. Current, future and potential use of mobile and wearable technologies and social media data in the abcd study to increase understanding of contributors to child health. Dev. Cogn. Neurosci. 2018, 32, 121–129. [Google Scholar] [CrossRef] [PubMed]
- Leaffer, D.; Wolfe, C.; Doroff, S.; Gute, D.; Wang, G.; Ryan, P. Wearable ultrafine particle and noise monitoring sensors jointly measure personal co-exposures in a pediatric population. Int. J. Environ. Res. Public Health 2019, 16. [Google Scholar] [CrossRef] [PubMed]
- Yeboah, G.; Alvanides, S.; Thompson, E.M. Everyday cycling in urban environments: Understanding behaviors and constraints in space-time. In Computational Approaches for Urban Environments; Springer: Cham, Switzerland, 2015; pp. 185–210. [Google Scholar]
- Lawrence, R.J.; Forbat, J.; Zufferey, J. Rethinking conceptual frameworks and models of health and natural environments. Health 2019, 23, 158–179. [Google Scholar] [CrossRef] [PubMed]
- Nieuwenhuijsen, M.; Khreis, H. Integrating Human Health into Urban and Transport Planning; Springer: Cham, Switzerland, 2018. [Google Scholar]
- Hankey, S.; Lindsey, G.; Marshall, J.D. Population-level exposure to particulate air pollution during active travel: Planning for low-exposure, health-promoting cities. Environ. Health Perspect. 2017, 125, 527–534. [Google Scholar] [CrossRef] [PubMed]
- Nieuwenhuijsen, M.J.; Khreis, H.; Verlinghieri, E.; Mueller, N.; Rojas-Rueda, D. Participatory quantitative health impact assessment of urban and transport planning in cities: A review and research needs. Environ. Int. 2017, 103, 61–72. [Google Scholar] [CrossRef] [PubMed]
- Tonne, C.; Basagana, X.; Chaix, B.; Huynen, M.; Hystad, P.; Nawrot, T.S.; Slama, R.; Vermeulen, R.; Weuve, J.; Nieuwenhuijsen, M. New frontiers for environmental epidemiology in a changing world. Environ. Int. 2017, 104, 155–162. [Google Scholar] [CrossRef] [PubMed]
- Reis, S.; Seto, E.; Northcross, A.; Quinn, N.W.; Convertino, M.; Jones, R.L.; Maier, H.R.; Schlink, U.; Steinle, S.; Vieno, M.; et al. Integrating modelling and smart sensors for environmental and human health. Environ. Model. Softw. 2015, 74, 238–246. [Google Scholar] [CrossRef] [PubMed]
- Andersson, A.; Winslott Hiselius, L.; Adell, E. Promoting sustainable travel behaviour through the use of smartphone applications: A review and development of a conceptual model. Travel Behav. Soc. 2018, 11, 52–61. [Google Scholar] [CrossRef]
Figure 1.
Sensor equipment (left) and study participant wearing the sensors (right).

Figure 2.
Differences between objective and subjective exposures for (a) particle number counts, (b) environmental noise and (c) temperature.
Figure 2.
Differences between objective and subjective exposures for (a) particle number counts, (b) environmental noise and (c) temperature.

Figure 3.
Regression of the mean subjective and the mean objective exposures of each cyclist.

Table 1.
Measured environmental parameters.
| Heat | Noise | PNC (0.5–2.5 µm) | |
|---|---|---|---|
| Proxy | Temperature | Sound level | Particle number counts |
| Device | Hobo MX 1011 | Edutige ETM-001 | Dylos DC 1700 |
| Recording interval | 2 s | 2 s | 60 s |
| Objective range, unit | 10–36 °C | 30–90 dBA | 250–18,000 part/liter (size 0.5 2.5 µm) |
| Subjective range | ordinal 1–5 (smartphone application survey) | ||
Table 2.
Reclassification of objective values.
| Heat | Noise | PNC | |
|---|---|---|---|
| Reclassification Reference | Heat Index (Steadman) | Health Guidelines (WHO) | Quantiles |
| Class 1 (n) | <23 °C (216468) | <42 dBA (25012) | <1620 part (4000) |
| Class 2 (n) | 23–27 °C (316225) | 42–54 dBA (91173) | 162–2280 part (4000) |
| Class 3 (n) | 27–31 °C (296827) | 54–66 dBA (200093) | 2280–3240 part (4000) |
| Class 4 (n) | 31–34 °C (340701) | 6–78 dBA (192957) | 3240–5120 part (4000) |
| Class 5 (n) | >34 °C (81601) | >78 dBA (46214) | >5120 part (4000) |
Table 3.
Mean, standard deviation (SD), and coefficient of variation (CV) based on weeks.
| Study Week (# Cyclists, n) | Temperature (°C) | Noise (dBA) | PNC (#/l) |
|---|---|---|---|
| Mean | SD | CV | |||
| Week 1 (10) | 26.1 | 2.8 | 11% | 61.5 | 10.7 | 17% | 3585 | 2896 | 80% |
| Week 2 (11) | 24.4 | 2.5 | 10% | 63.9 | 11.5 | 18% | 2493 | 1461 | 59% |
| Week 3 (10) | 23.6 | 2.2 | 9% | 65.2 | 11.0 | 17% | 3089 | 2571 | 83% |
| Week 4 (12) | 24.5 | 3.4 | 14% | 62.5 | 11.3 | 18% | 5084 | 2876 | 57% |
| Week 5 (11) | 21.5 | 2.9 | 13% | 63.2 |12.2 | 19% | 4585 | 4192 | 91% |
| Week 6 (12) | 20.5 | 2.7 | 13% | 62.8 |11.7 | 19% | 3686 | 3000 | 81% |
Table 4.
Comparison of reclassified objective and subjective exposures (scale: 1 low, 5 high).
| Temp | Noise | PNC | |
|---|---|---|---|
| Mean objective reclassified | 1.6 | 3.3 | 3.0 |
| Mean subjective | 1.7 | 2.5 | 2.3 |
| Mean difference | −0.1 | 0.8 | 0.7 |
| Correlation, significance | 0.68, p < 0.01 | 0.20, p > 0.05 | 0.10, p > 0.05 |
Table 5.
Proportion of answers for high/very high importance (rating 4/5) for route choice (scale: 1 very low, 5 very high).
Table 5.
Proportion of answers for high/very high importance (rating 4/5) for route choice (scale: 1 very low, 5 very high).
| Aspect (Multiple Answers) | Proportion High/Very High Importance |
|---|---|
| Length and time taken | 64% (n = 42) |
| Greenspace | 64% (n = 42) |
| Low traffic volume | 52% (n = 34) |
| Existing bike lanes | 52% (n = 34) |
Table 6.
Health-related questions of the questionnaire filled in before the study.
| Heat | Noise | PNC | |
|---|---|---|---|
| The exposure to … can have negative impacts on health. | 45% (n = 30) | 79% (n = 52) | 86% (n = 57) |
| I feel personal health impacts due to the exposure to … | 12% (n = 8) | 9% (n = 6) | 8% (n = 5) |
| I feel highly exposed to … during cycling. | 18% (n = 12) | 39% (n = 26) | 48% (n = 32) |
| I can influence my exposure to … through my own actions. | 20% (n = 13) | 40% (n = 27) | 30% (n = 20) |
© 2019 by the authors. Licensee MDPI, Basel, Switzerland. This article is an open access article distributed under the terms and conditions of the Creative Commons Attribution (CC BY) license (http://creativecommons.org/licenses/by/4.0/).
Share and Cite
MDPI and ACS Style
Ueberham, M.; Schlink, U.; Dijst, M.; Weiland, U. Cyclists’ Multiple Environmental Urban Exposures—Comparing Subjective and Objective Measurements. Sustainability 2019, 11, 1412. https://doi.org/10.3390/su11051412
AMA Style
Ueberham M, Schlink U, Dijst M, Weiland U. Cyclists’ Multiple Environmental Urban Exposures—Comparing Subjective and Objective Measurements. Sustainability. 2019; 11(5):1412. https://doi.org/10.3390/su11051412
Chicago/Turabian StyleUeberham, Maximilian, Uwe Schlink, Martin Dijst, and Ulrike Weiland. 2019. "Cyclists’ Multiple Environmental Urban Exposures—Comparing Subjective and Objective Measurements" Sustainability 11, no. 5: 1412. https://doi.org/10.3390/su11051412
Note that from the first issue of 2016, this journal uses article numbers instead of page numbers. See further details here.