Quantifying Spatio-Temporal Patterns of Rice Yield Gaps in Double-Cropping Systems: A Case Study in Pearl River Delta, China


1
Key Laboratory of Land Surface Pattern and Simulation, Institute of Geographical Sciences and Natural Resources Research, Chinese Academy of Sciences, Beijing 100101, China
2
CAS Center for Excellence in Tibetan Plateau Earth Sciences, Chinese Academy of Sciences (CAS), Beijing 100101, China
3
School of Environmental Design and Rural Development, University of Guelph, Guelph, ON N1G2W5, Canada
4
Géographie, Université de Montréal, Montréal, QC H2V2B8, Canada
*
Author to whom correspondence should be addressed.
Sustainability 2019, 11(5), 1394; https://doi.org/10.3390/su11051394
Submission received: 4 January 2019
/
Revised: 28 February 2019
/
Accepted: 2 March 2019
/
Published: 6 March 2019
(This article belongs to the Special Issue Agricultural Production and Global Climate Change: Social, Cultural, and Agroecological Aspects of the Agriculture/Climate Interface)
Abstract
:Quantifying the contributing and limiting factors of yield potential is of vital importance, and the closure of existing yield gaps on currently available agricultural land is regarded as the most effective measure to meet future food demands. In this study, the CERES-Rice model and long-term rice yield records of 12 sites from 1981 to 2010 were combined together to investigate the spatial and temporal distributions of yield potential, yield attainable, yield actual, and yield gaps for double cropping rice in the Pearl River Delta (PRD), China. The evaluated yield potential of all the sites ranged from 7500 to 14,900 kg/ha, while yield attainable was from 6400 to 12,665 kg/ha, and yield actual was from 4000 to 7000 kg/ha. The yield gaps between yield potential and yield actual, yield potential and yield attainable, and yield attainable and yield actual were projected to be 3500 kg/ha, 1400 kg/ha, and 2100 kg/ha, respectively. The decrease of yield potential was due to the increasing temperature for early mature rice and the prolonged sunshine hours for the yield potential of late mature rice, respectively. The social–economic impacts of yield actual were also assessed, and adaptive measures were simulated so that the yield would certainly increase.
1. Introduction
It is generally accepted that the global population is projected to reach 9.3 billion in the next few decades; therefore, an estimation of 70% or more for the sustainable intensification of agricultural production is urgently required to feed the growing population [1,2,3,4]. However, the arable land for crops accounts for only 12% of the total global land area, while the remaining lands are not suitable for cultivation, so that feeding the world’s population sustainably is an important challenge [5]. The increasing global population needs a major boost in agricultural productivity and agricultural yields to meet the goals of feeding more people. Fortunately, the global agricultural production has increased considerably due to the increase of the planting area and the introduction of new technologies in recent past decades [6]. However, the stagnation of rice yields has been reported in China and Japan, while maize yields appear to have plateaued certainly in China, Italy, and France [7]. Yield stagnation and even decline in some areas is likely to put pressure on other regions to make up for these decreasing yields elsewhere in order to feed the increasing population, resulting in more cultivated areas being developed. The common adaptive solutions to raise yield production are commonly achieved by increasing agricultural yields on existing farmland and expanding production to other cropping areas. However, much of the remaining cultivatable lands are of high social, economic, and ecological value, and expanding to such areas would certainly raise greenhouse gas emissions and contribute to climate change [8,9]. Therefore, closing the yield gaps such as raising agricultural yields on existing farmland and producing more grains on the current agricultural areas should be of higher priority. To close the yield gaps, the realistic estimates of the spatial and temporal variability of yield gaps must be acknowledged, and the geographic patterns, trends, and limiting factors during the past few decades should also be recognized and confirmed. Informing policies, advancing agricultural technology, and adopting appropriate adaptive measures for agriculture should be confirmed to enhance crop yields without environmental degradation.
Yield gap analysis can identify regions where large increases in food production are still feasible, and it can also identify the most important factors limiting current farm yields. By definition, yield potential is the yield of an adapted specific crop cultivar growing with optimal agronomy, nutrients, and abundant water [10,11,12]. Yield potential could possibly obtain high agricultural yields within a unit of land in a timely fashion, and the practical operations should be performed with the effective control of pests, diseases, weeds, water, and other stresses [13]. For a given site with a specific cultivar, the yield potential is determined only by solar radiation, temperature, atmospheric CO2, and genetic traits that control the length of the growing season and the light interception. Yield attainable is the best yield that is achieved through the skillful use of the best available technology, and yield actual reflects the normal management techniques under current state of soils and climate [14,15]. Several methodologies have been proposed and applied to estimate yield potential such as simulation models, field experiment and yield competition, and maximum farmer yield. The field experiment and yield competition need perfect growth conditions throughout the cropping period; furthermore, the strict growing condition is quite difficult to perform when the area of the testing plot is several hundred square meters in size. Also, the experiments and competitions must be replicated for many years in order to exclude the variations of random errors and obtain robust estimation results [16]. Investigating the maximum farmer yield is an alternative, but a less common approach, as it is quite difficult to investigate and confirm every yield of each farmer when the study scale is regional or national. Therefore, the simulation models are the most adopted method for assessing the yield potential at site, regional, and national levels, involving identifying the reasons for the gaps and evaluating the management options. After strict calibration and validation, the simulation models can achieve a high accuracy of yield gap estimation using the reproduced genotype × environment × management (G×E×M) interactions for thousands of times, capturing spatial and temporal variations [17].
Many researchers have evaluated the yield potential and analyzed the yield gaps at spatial and temporal scales using various crop simulation models, leading to the provision of useful information on management strategies or useful advice to increase agricultural yields. Alice G. Laborte predicted that rice yields would increase only by 18% from 2007 to 2050 if current cultivars, production technologies, and other prevailing conditions remain constant; therefore, investments in technology transfer and institutional arrangements were suggested [18]. Chen investigated the spatio-temporal patterns of winter wheat yield potential and yield gap during the past three decades in North China by using the simulation method; the results indicated that the yield actual in 62% of the counties have not reached 40% of the yield potential, which means that there is enough room for greater rice production [19]. Sun assessed the yield gaps and predicted the changing trend of winter wheat yield in China with the APSIM-Wheat model [20]. Tao analyzed the changing trend of maize yield potential and yield gaps during the past 30 years in China [21]. Wang assessed the yield gap of the North China Plain with the APSIM-maize model, and found that irrigation and nitrogen fertilizers have been managed to near the optimal level already, but new techniques and new facilities are also urgently needed in the future to achieve further yield development [22].
Rice (Oryza) is a staple food in China, and the data from the National Bureau of Statistics of China shows that rice covers 18.4% of China’s cultivated area and accounts for 33.8% of the Chinese grain area (http://www.stats.gov.cn/). The Pearl River Delta is the largest rice production area and the most densely populated area in China, and there is enough evidence showing that farmland has significantly decreased due to economic and environmental changes (http://www.gdstats.gov.cn/). Therefore, it is of vital importance to evaluate the yield gaps of rice and investigate the consumption patterns in this major product that may be vulnerable to climate change. So far, only a few studies have explored the changing trend in yield gaps caused by climate, cultivars, and crop management nationally, including this area, but their data are commonly large-scale with limited applicability. Most papers have not covered all the limiting factors of yield potential and yield actual, which are typically the social–economic factors. Chen involved the analysis of the social–economic factors, but the scale of the data was based on the province level, which is not correct because the real cropping conditions and management operations are different for each city or even each country [19]. Therefore, there is a necessity for evaluating and analyzing the yield gaps in this delta, which is of significant importance for both regional and national food security. Based on high-quality resolved weather data and soil data, as well as well-recorded management data, the objectives of this study are to: (1) explore the spatial and temporal variation in potential yields and yield gaps; (2) simulate the adaptive measures and provide useful adaptive measures to raise the levels of yields with the present existing varieties being constant; and (3) analyze the yield gap, identify the climatic variables limiting the yield potential, and analyze the social–economic factors limiting the yield actual (i.e., without new genetic improvements).
2. Materials and Methods
2.1. Study Area and Sites
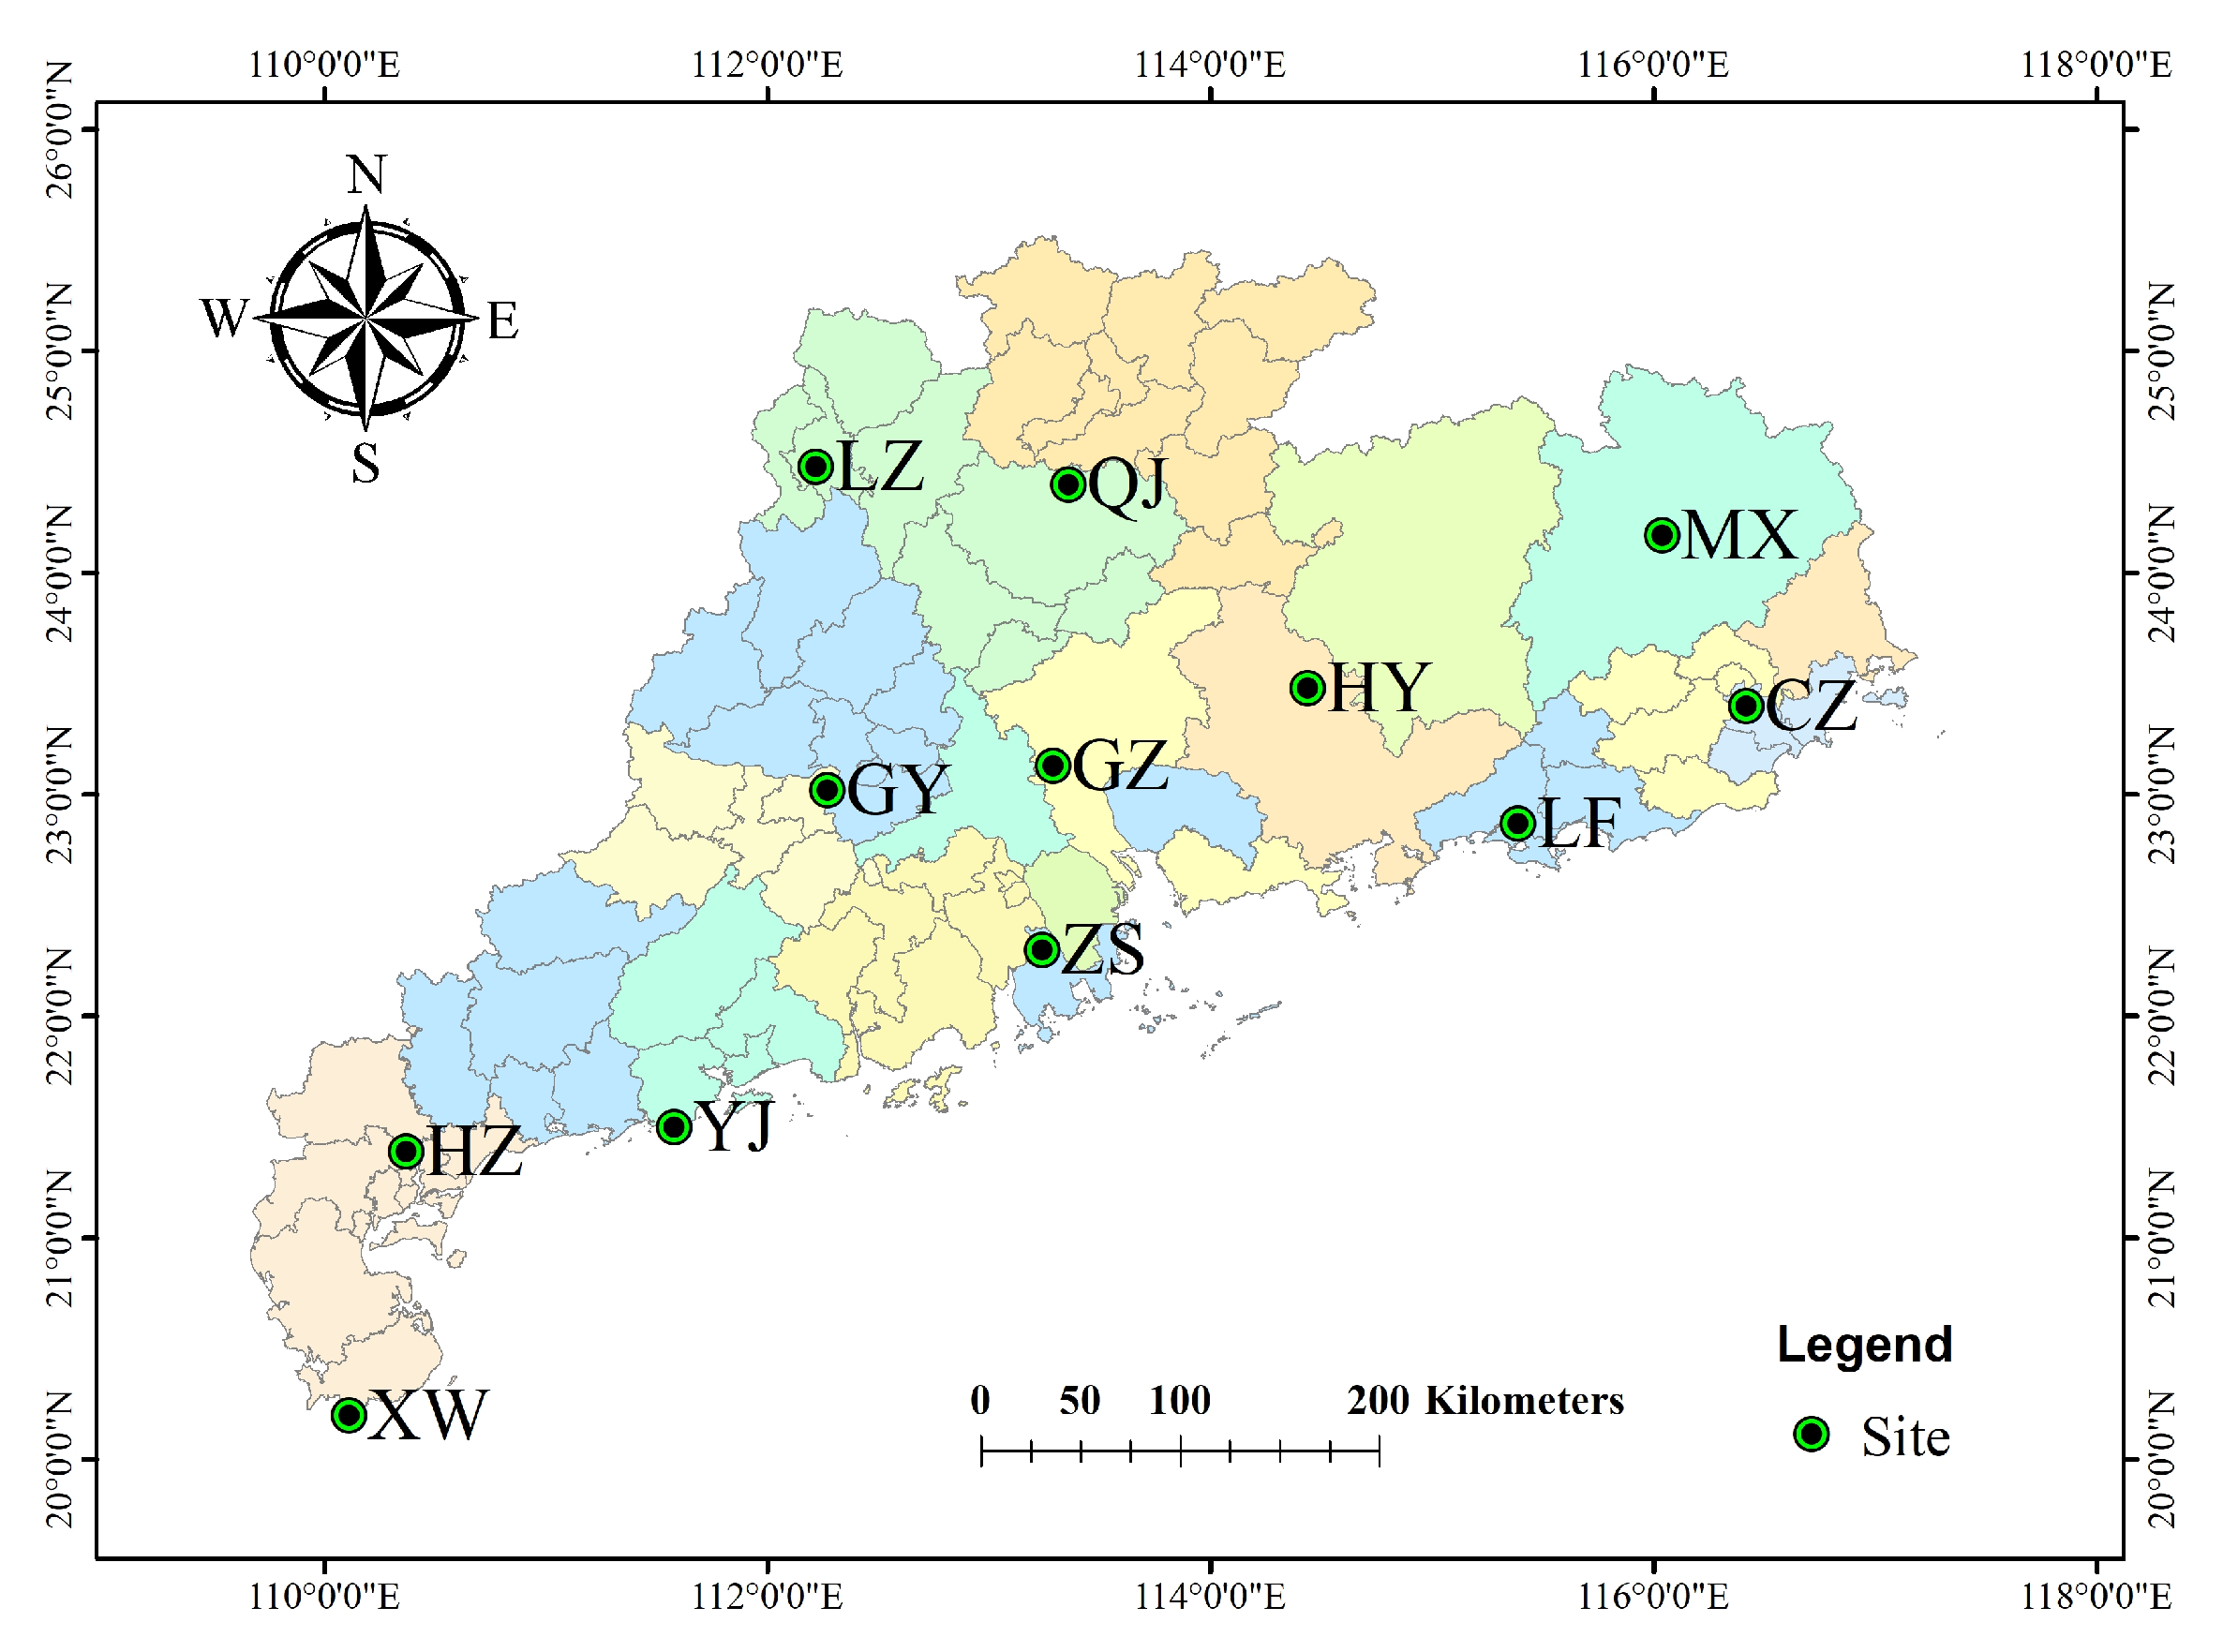
Located in South China, the Pearl River Delta (PRD) is one of the most important rice production bases, and it is also the most susceptible place to climate change impacts. Rice here is cultivated twice a year, and the total of rice production is 1087 million tons according to the National Statistical Yearbook 2017 (http://www.stats.gov.cn/). The delta is also one of the most densely urbanized regions in the world, and the population is expected to increase even more in the coming decades. Evaluating the potential yield and analyzing the constraining factors limiting rice yields are of vital importance, because these will inform regional or even national policy to try to increase the rice yields. Figure 1 shows the selected 12 climate stations of the National Meteorological Network of the China Meteorological Administration (CMA) in the delta (http://data.cma.cn/), and these are quite helpful for analyzing the relationships between yields and locations. The names of all the sites are Chaozhou (CZ), Gaoyao (GY), Heyuan (HY), Huazhou (HZ), Lianzhou (LZ), Lufeng (LF), Meixian (MX), Qujiang (QJ), Guangzhou (GZ), Xuwen (XW), Yangjiang (YJ), Zhongshan (ZS). The weather conditions of each site are apparent, the total sunshine hour of each day is near 14 h, the annual average temperature varies from 16 to 25 ℃, and the total annual precipitation is approximately 1400 mm.
2.2. Data and Model Parameterization
The long time-scale recorded management data from 1981 to 2010 allows continuous simulations for potential yields and yield attainable. The double cropping rice system is the dominant operation in the area, with the early mature rice being seeded in March, and the late mature rice being seeded in July. The soil, weather, and field management records were used to calibrate and validate the models, and therefore the reliability of the simulation results depends on the quality of the input data that is used for the models. However, there is a wide range in the quality and spatial and temporal scale, and the resolution of climate and soil data, as well as widely differing assumptions about the cropping system context and crop model calibration. A standard methodology for selecting data and the procedure for processing data are introduced in detail in the following sub-sections.
2.2.1. Soil Data
The soil data in this study were extracted using the longitude and latitude through locations of the Chinese agrometeorological experimental stations from the China Soil Scientific Database. The database includes the basic physical properties such as the soil color, slope, pH, and planted area, as well as other properties. More detailed information covers the runoff potential, fertility factor, organic carbon, cation exchange capacity, and total nitrogen of each specific layer. The general average thickness of the soil in Pearl River Delta is 100 cm, and the typical pH ranges from 5 to 7. The soil properties are used to calibrate and validate the model, while in simulating the yield potential, the soil is not involved, since the fertilization and irrigation is enough to support the rice growth. The detailed soil information of each site is given in Table 1.
2.2.2. Weather Data
The daily weather data were acquired from the CMA including sunshine hours, minimum temperature, maximum temperature, and precipitation (from 08:00 to 20:00). When the change variation is within 10%, 10 years of weather data are sufficient to evaluate the average yield in favorable environments, but more than 20 years are required in less favorable environments. The weather dataset acquired from the CMA covers more than 600 sites; to obtain the exact weather information, the dataset is processed with the R language package to extract the 12 specific stations by latitude and longitude inside the PRD. The weather observed by the agrometeorological experimental stations cannot be directly used for the simulation, and the original weather data must be transformed into the standard daily solar radiation format data based on the latitude and daily sunshine hours through a strict procedure in Matlab2014a to make sure of the authority and reliability of the simulation results. The solar radiation requires precision measurement instruments, which are not available for most of the stations. Therefore, the sunshine hours are recorded instead of the solar radiation, and the daily solar radiation was estimated from daily sunshine hours based on the Angstrom equation [23]:
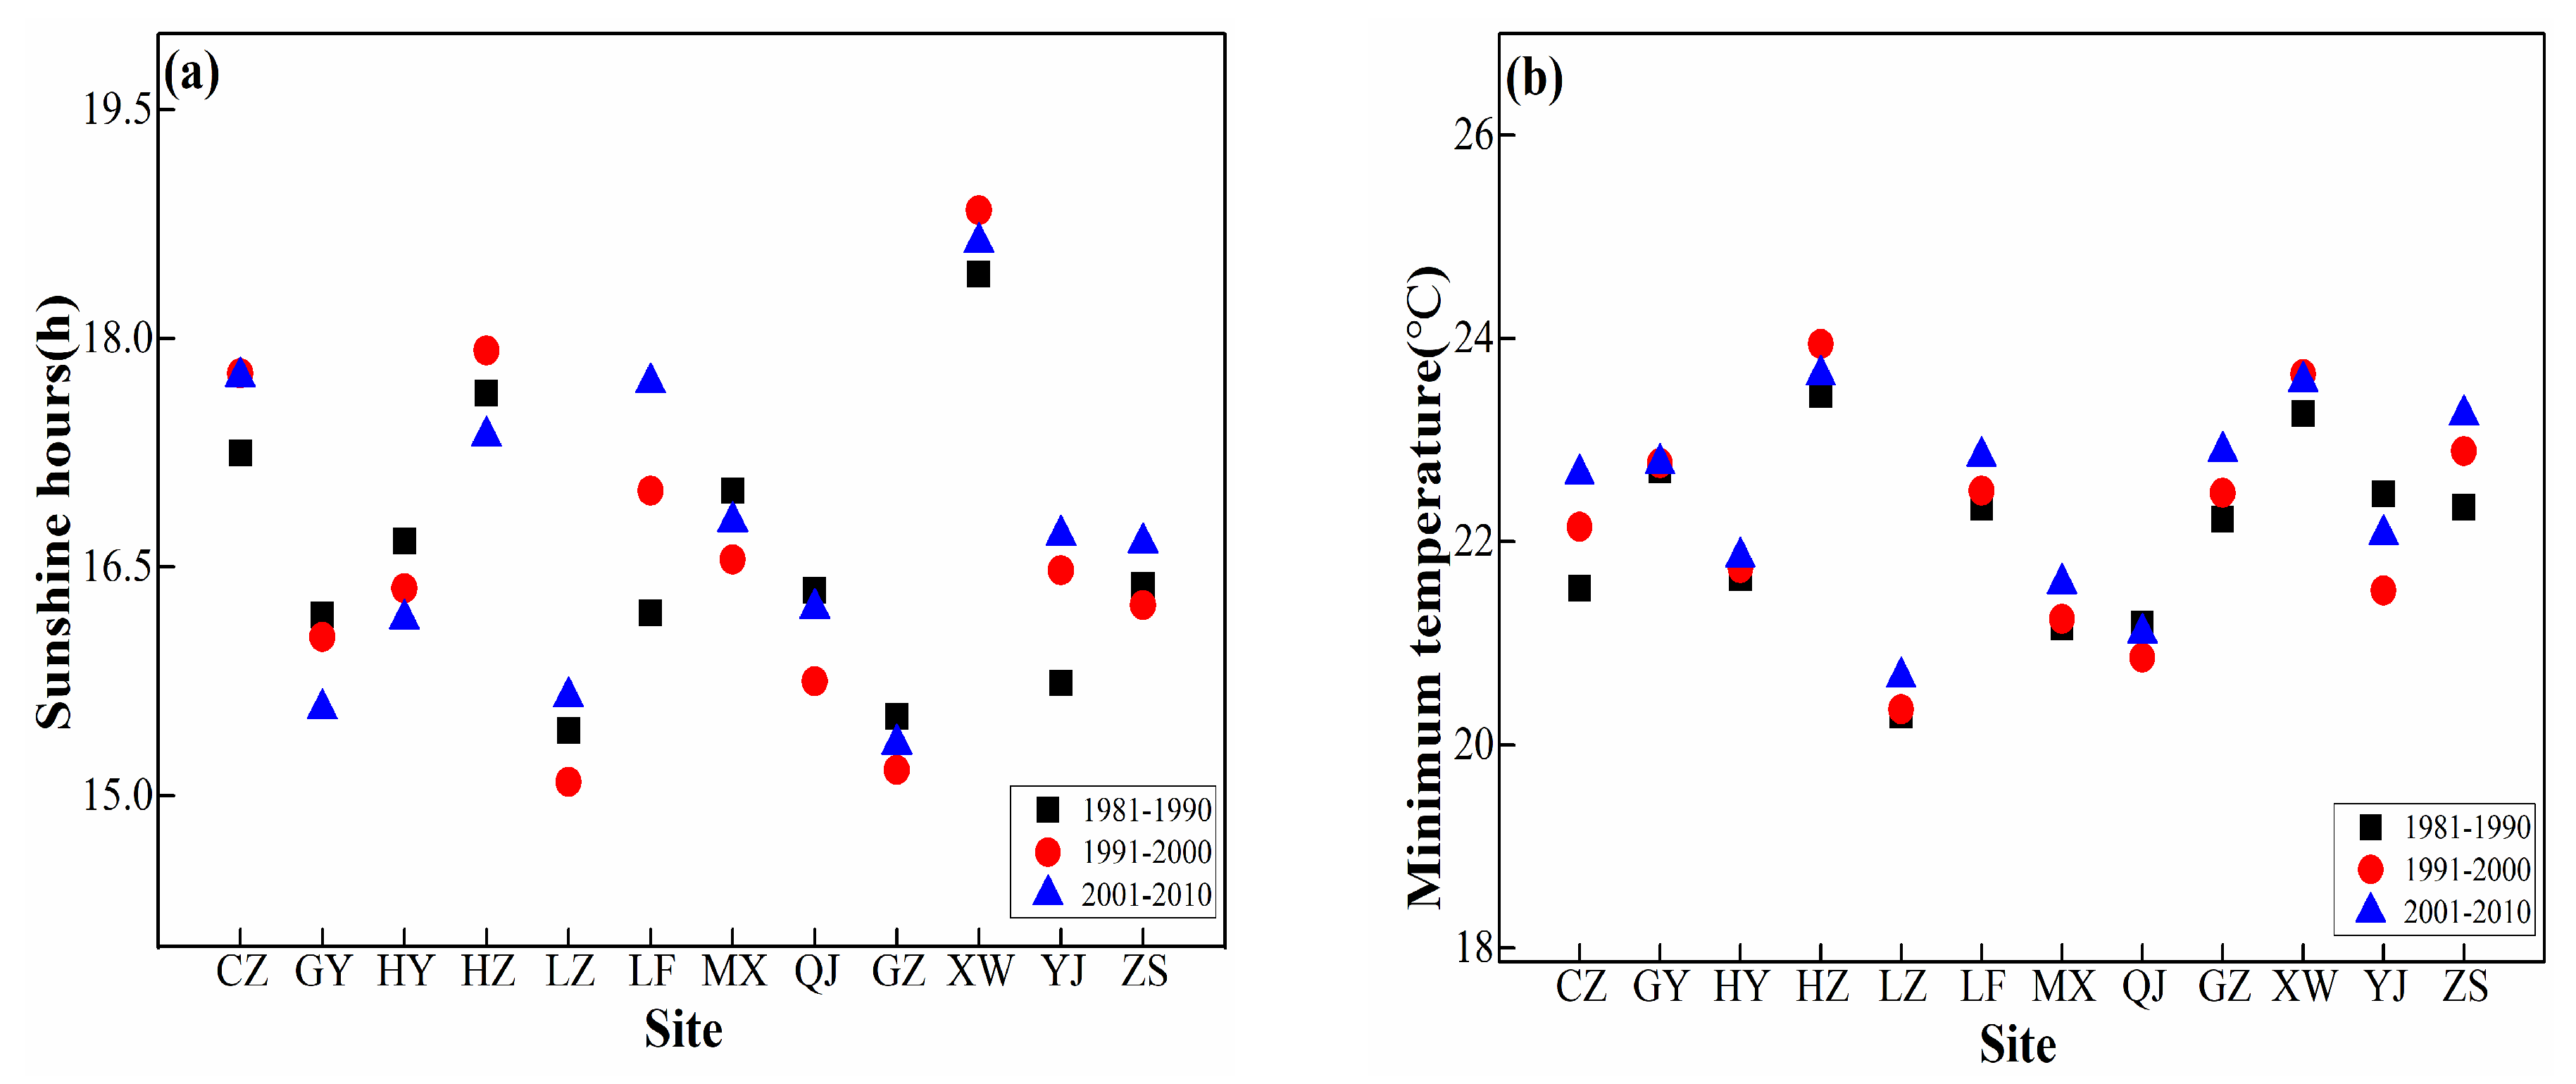
In this equation, RS represents the solar radiation (MJ/m2/d), n and N are the actual and maximum durations of sunshine respectively, and Ra is the extraterrestrial radiation (MJ/m2/d). In addition, N and Ra can be calculated from the latitude. The weather information of each site is from 1981 to 2010, and the information is divided into three parts: 1981 to 1990, 1991 to 2000, and 2001 to 2010 to explore the change of weather. The detailed change information of each site for each time period is given in Figure 2.
2.2.3. Field Management
China is a traditional agricultural-based country with a long history of crop cultivation, and it has been eager to pay attention to the observation, collection, and documentation of the varieties of crop development. More than 600 agrometeorological experimental stations (AES) have been established by the National Meteorological Information Center (NMIC) for the observation and collection of crop development data involving the weather, crop phenology, and management across the cultivation areas [24,25]. These data are observed by professional agricultural technicians following standardized observation criteria and strictly prescribed procedures, which are all very valuable for enhancing the model performance and facilitating its application in China. The agricultural management records data from 1981 to 2010 that were used in this study were derived from the NMIC, which contains the sowing, transplanting date, crop emergence, flowering and maturity dates, cultivar type, yields, and management practices, as well as the detailed information of seed placement depth, plant density magnanimity of irrigation, and fertilization, which are all covered. These data are recorded at the agrometeorological experimental station close to the weather station at each site, and can be transformed into the required input data to the CERES-Rice model such as the flowering duration (the number of days from transplanting date to flowering date) and the maturity duration (the number of days from transplanting date to maturity date). The detailed information of management of each site is given in Appendix A.
2.2.4. Model Parameterization
The CERES-Rice is a mechanistic crop model that has been extensively used to evaluate the effects of environmental, biological, and management changes on crop growth and agricultural yields for several decades [26,27,28,29,30]. Also, this model has been used for determining yield potential and identifying the yield gaps of rice in many countries. Simulation models are likely to provide the most accurate estimate of the yield potential ceiling for specific fields and for regions when information on spatial variation of model inputs is available. They are also helpful for the initial evaluation of a single management factor, such as planting date, across multiple environments and for more complex interactions among several management factors, such as planting date, plant population, or cultivar maturity [31,32].
Model calibration and validation are necessary to verify the crop cultivar genetic coefficients and optimize the input parameters, which can improve the reliability of the simulation results so that the model can be used for evaluation [33,34] (Table 2). Model calibration involves adjusting the crop cultivar genetic coefficients and model validation to make sure that the simulated and observed rice growth duration and yield parameters are in close agreement. The model validation compares simulated results with observed results using the calibrated crop cultivar genetic coefficients and other independent datasets. The model evaluation assesses the crop model’s performance or its simulated capacity. The precisely operated experimental sites without diseases or extreme climate events are chosen. The growth coefficients such as flowering duration, maturity duration, and yield are selected as the growth duration and yield parameters, respectively, and one year of observed data is used to calibrate, and the other two years of observed data are used to validate. Each rice station is independently calibrated and validated to acquire the most precise station-specific and cultivar-specific rice coefficients to verify the simulation results more accurately.
Before model evaluation, the model parameters should be calibrated and validated first. In this study, each site was confirmed with a rice cultivar that beholds the highest yield, and the specific rice cultivar was planted for many years (more than three years). Also, the optimal management for each site during the last 30 years should also be independently confirmed, because the site is geographically isolated. The optimal management data contain the seeding date, sowing date, transplanting date, seeding density, fertilizing date, and the irrigating date, which are needed to reflect the dominant cropping system. Each cultivar was used to calibrate and validate the rice growth parameters with the site-based soil, weather, and management in one year. The other two years of management data such as the flowering period, maturity period, and yield are used for validation. The generalized likelihood uncertainty estimation (GLUE) was adopted in this study to efficiently match the simulated and observed experimental data [35]. After calibration and validation, the normalized root mean square error (NRMSE) and the predicted deviation (PD) were conducted to assess and estimate the consistency and deviation between the simulated and observed values, respectively. The NRMSE and PD are each described as follows:
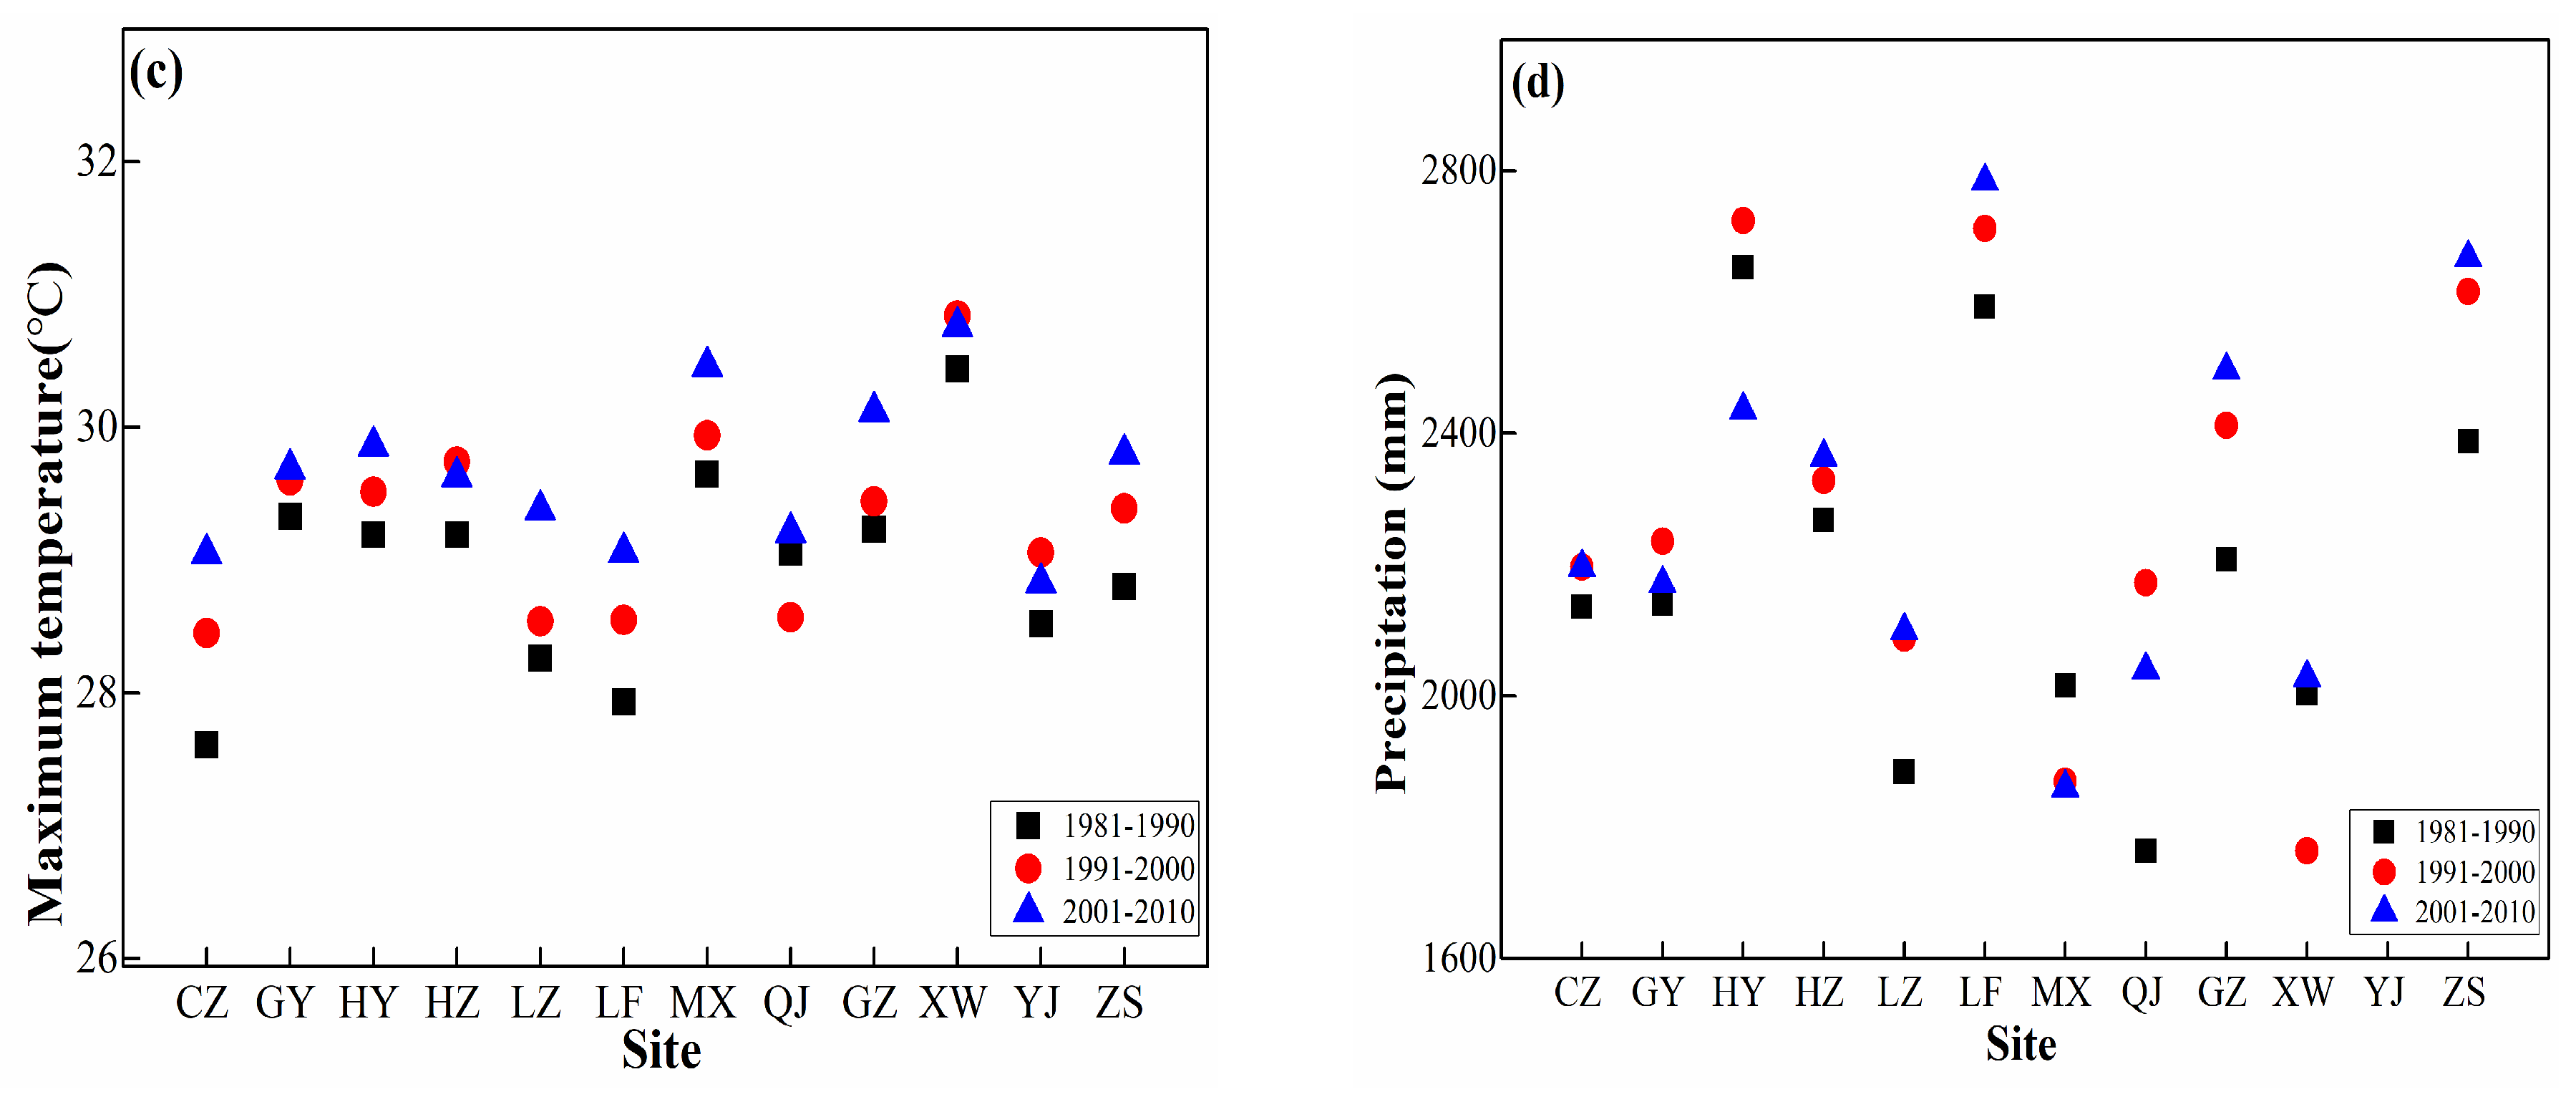
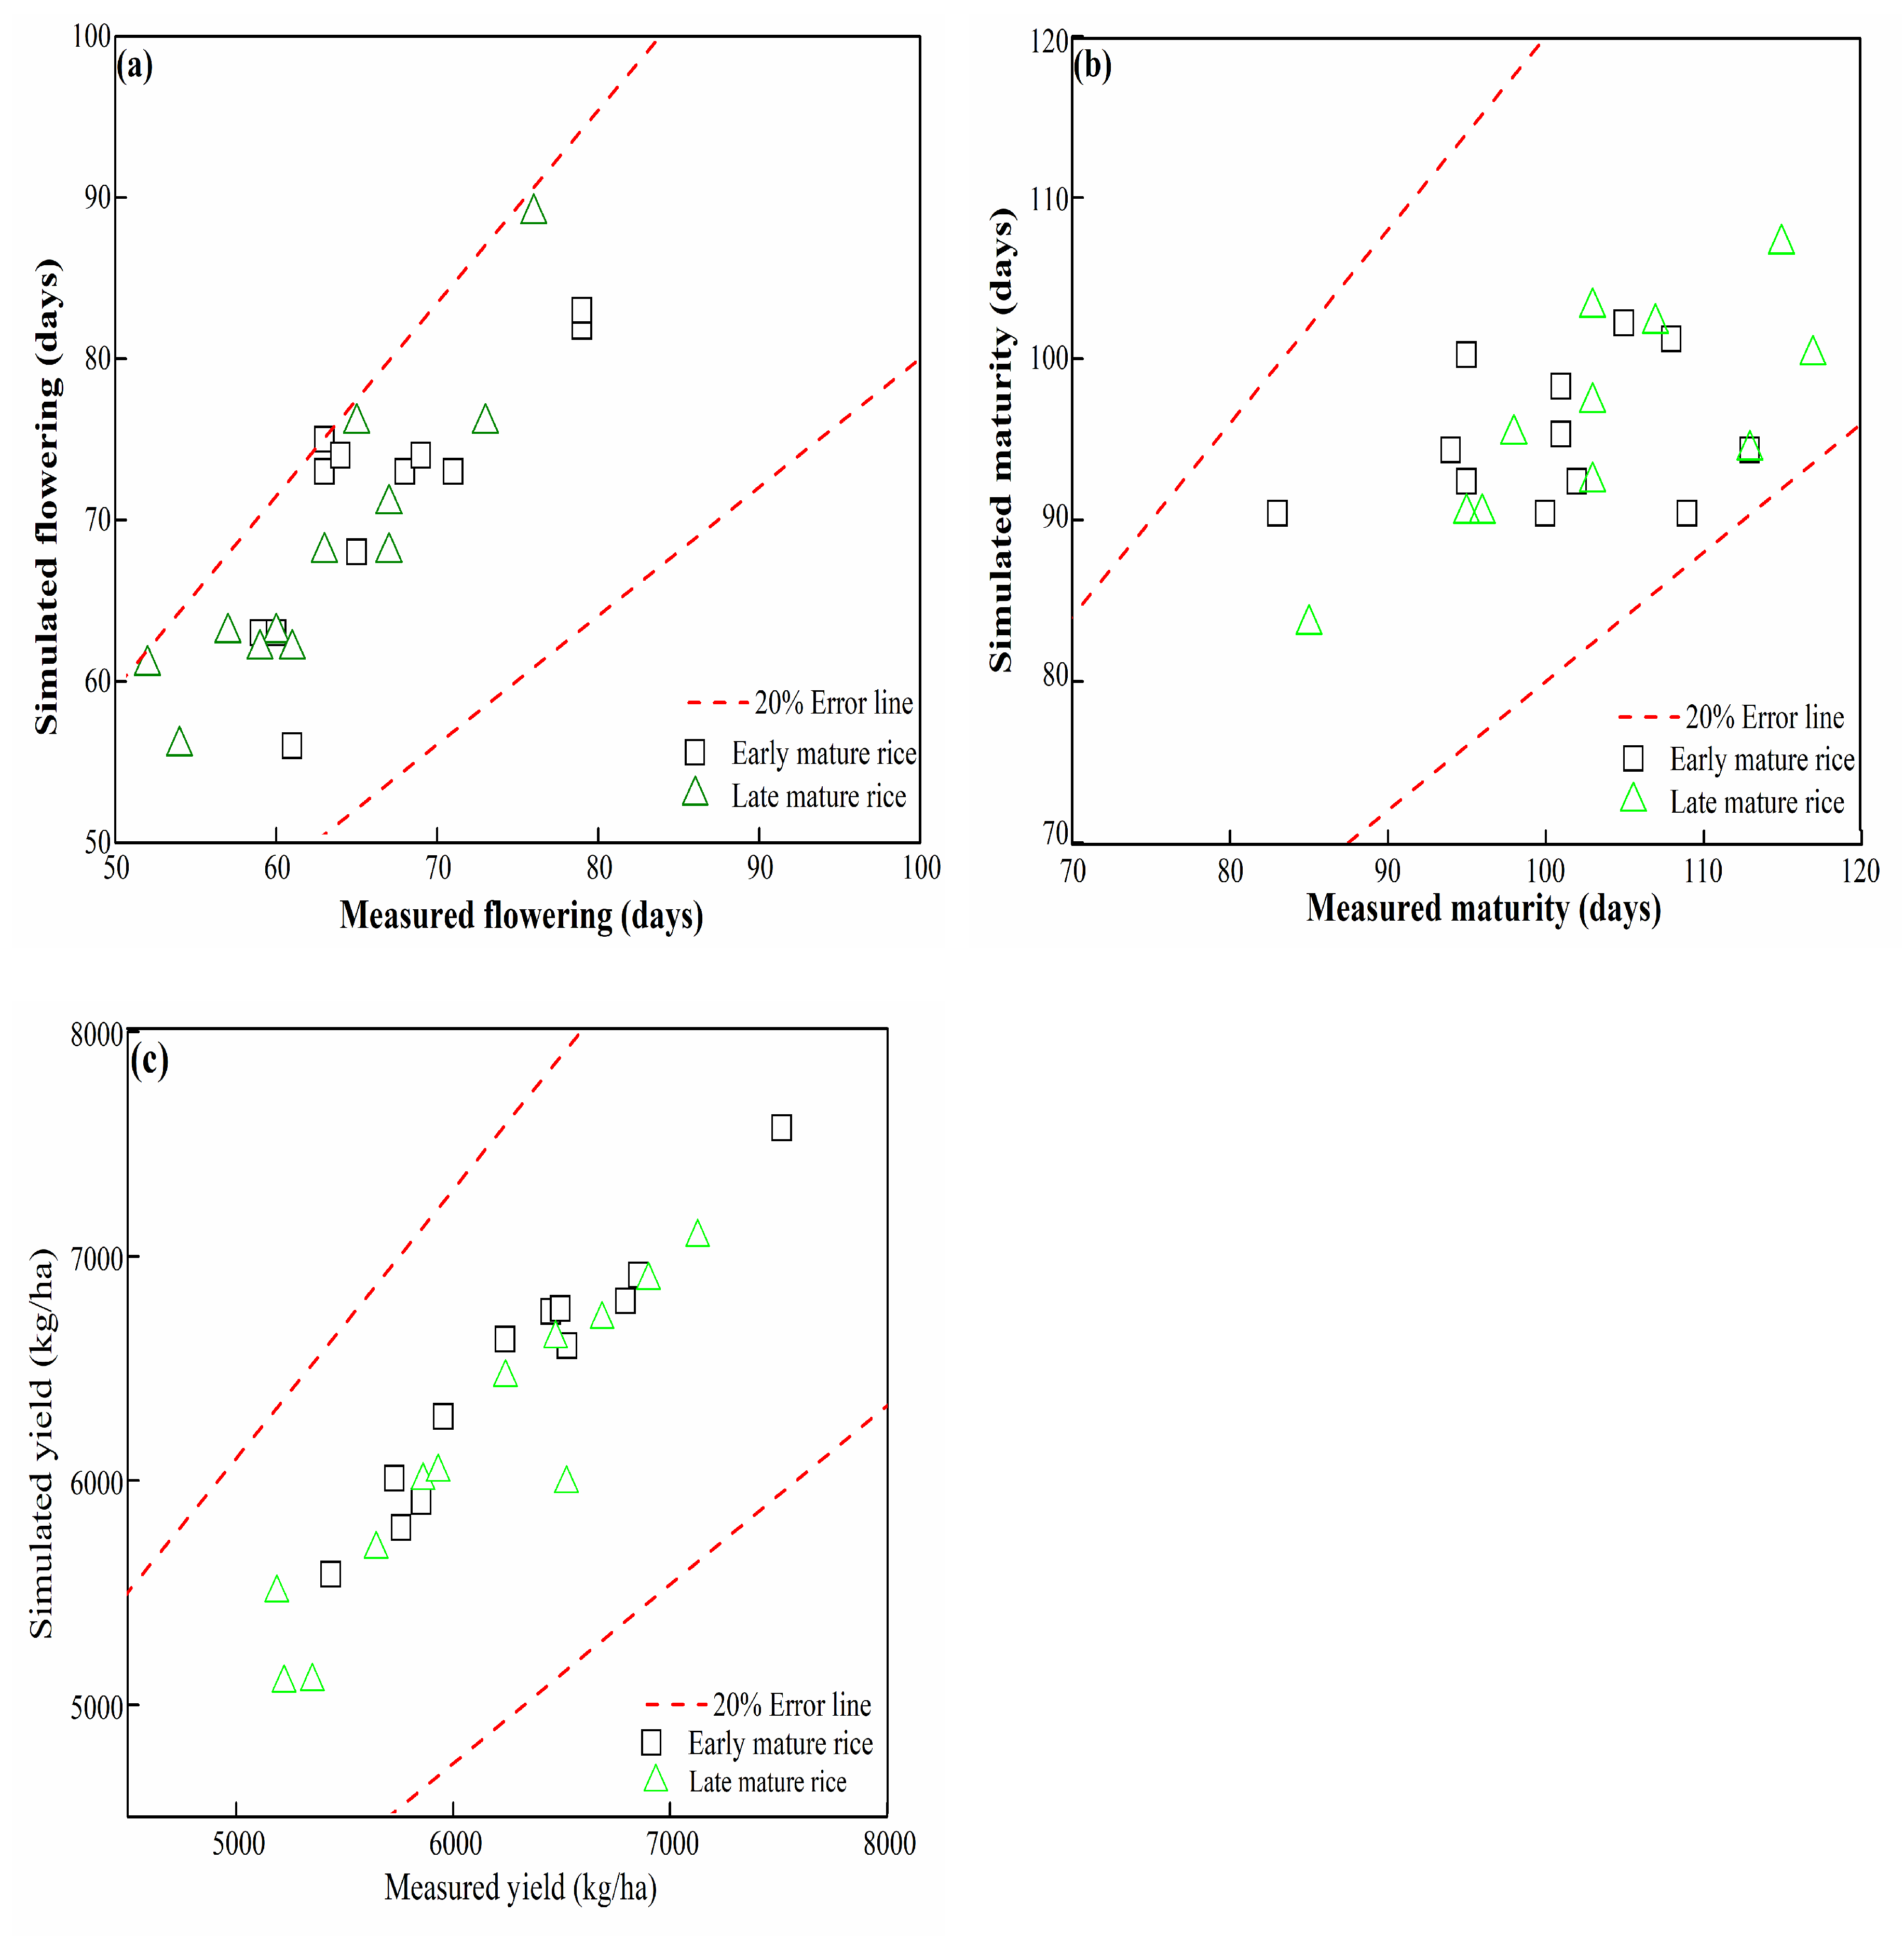
In the equation, Si represents the simulated parameter values, and Oi represents the observed ones, is the mean value of observed data, n is the number of comparisons, and PDi is each relative error. When the NRMSE is less than 10%, between 10–20%, and between 20–30%, the simulation is considered as having been perfectly, good, and moderately conducted, respectively [36]. The difference between the observed and simulated variables within 20% are strictly acquired in this study. The results of calibrations and validations are shown in Figure 3, and the detailed information of rice parameters are given in Appendix A.
After rigorous calibration and validation, the detailed information of calibration and validation is shown in Figure 3. The calibrated and validated NRMSE between observed and simulated variables (flowering dates, maturity dates, and yields) are 12.28%, 13.13%, and 11.38% for early mature rice. Similarly, the NRMSEs are 18.05%, 16.63%, and 15.27% for late mature rice. For early mature rice, the NRMSEs are all less than 15%, which indicates a perfect model performance; for late mature rice, the NRMSEs all exceed 15% but are less than 20%, indicating a good model performance. Considering the various cultivars and agronomic management practices, the performance of the model is acceptable for simulating the yield potential. The detailed information of site location, cropping system, cultivar name, and cultivar parameters are each shown in Appendix B.
2.3. Methodology
2.3.1. Modeling Yield Potential and Calculation of Yield Gaps
The rice parameters were used to simulate the yield potential with weather data from 1981 to 2010, while the soil data was held constant as before. In the simulation options, the water and nitrogen were adequately provided in the model by turning off switches of water and nitrogen during the simulations. In the CERES-Rice model, the yield is closely related to the climate change variables; the equations are:
In this equation, YieldER and YieldLR each represent the early mature rice yield and late mature rice yield, Tavg represents the daily average temperature, Prec represents the daily average precipitation, Radi represents the daily average solar radiation, and P and r are the representation of the significance level and the correlation coefficient, respectively. These variables and equations are integrated into the CERES-Rice model, which will influence rice yields in a combinatory way. For a single site, the early mature rice and late mature rice were simulated respectively because the management and cultivars are totally different. For either early mature rice or late mature rice, there are 30 years of weather data, which means 30 kinds of potential simulation results. After simulations, every 10 years of simulations were averaged to assess the change of yield potential during three time scales (1981–1990, 1991–2000, and 2001–2010), respectively. Since the yield attainable is defined as the highest rice yield that farmers can achieve using the best management practices such as optimum sowing date, irrigation, fertilizers, and so forth, the switches of water and nitrogen are turned on when simulating the yield attainable. The yield actual is from the National Bureau of Statistics (http://www.stats.gov.cn/). Thus, the yield potential, yield attainable, and yield actual are all obtained for a specific experimental site.
After the calibration, validation, and evaluation of yield potential and yield attainable based on each site, the site-based experimental stations should be up-scaled to the regional scale. Commonly there are two main up-scaling methods; the first one is to choose the representative point or experimental site and then simulate the yield potential and yield attainable of these patterns, and the results are then finally scaled up to a higher geographical unit by unit yield by multiplying the total planted area of the region. Another common method involves evaluating the yield potential and yield attainable using the weather, soil, and cropping systems data based on each 0.5° × 0.5° grid, up-scaled to higher units. The first method has the advantage that it is based on local observations, and that outcomes of yield potential and yield attainable can be validated on each site more easily than with the second method. Since the data are very precise, therefore, the first method mentioned is adopted in this study. There are 30 years of weather data, so there are 30 simulation results of yield potential and yield attainable. In order to minimize the influence of variation between simulations, yield potential was simulated for each zone over a span of 30 years and then averaged to estimate the long-run yield potential for each zone. According to the definition of all the levels of yield gaps, the yield gaps are obtained by calculating the difference between yield potential, yield attainable, and yield actual. Subsequently, the yield gap percentage for each site is also obtained:
2.3.2. Analysis of Social–Economic Effects
Yield potential is closely connected with the climate variables such as sun radiation, temperature, and precipitation. Since the growing period for early mature rice and late mature rice are totally different, therefore, the yield potential of early mature rice and late mature rice are each assessed with these climate variables during the growing time period of rice. For the yield actual, multiple linear regressions were conducted to analyze the impacts of socio-economic factors on changes of yield actual.
In this equation, yield actual, farmers, fertilizer, pesticide, irrigation, and machine power represent the yield actual, number of farmers, fertilizer use, pesticide use, irrigated area, total power of machinery, total electricit, y and the average income of farmers, respectively. The N is the number of all sites. l1, l2, l3, l4, l5, l6, and l7 each represent the coefficients of these socio-economic factors.
2.3.3. Conduction of Adaptive Measures
The adaptive measure of changing planting dates is suggested by the IPCC, which can be simulated in the model [37]. In the planting group, the sowing date was always explaining more than the sowing density, and hence it is more taken into consideration [38,39]. Therefore, to obtain the most optimal date of planting, the planting dates of rice are adjusted by advancing and delaying the planting date over 40 days at intervals of five days; then, the planting dates are used as the only change variable in the simulation. Therefore, the yields related to each planting date are obtained, and the planting date with the highest rice yield is selected and suggested [40].
3. Results
3.1. Spatial and Temporal Variations in Yield Actual, Yield Potential, and Yield Attainable
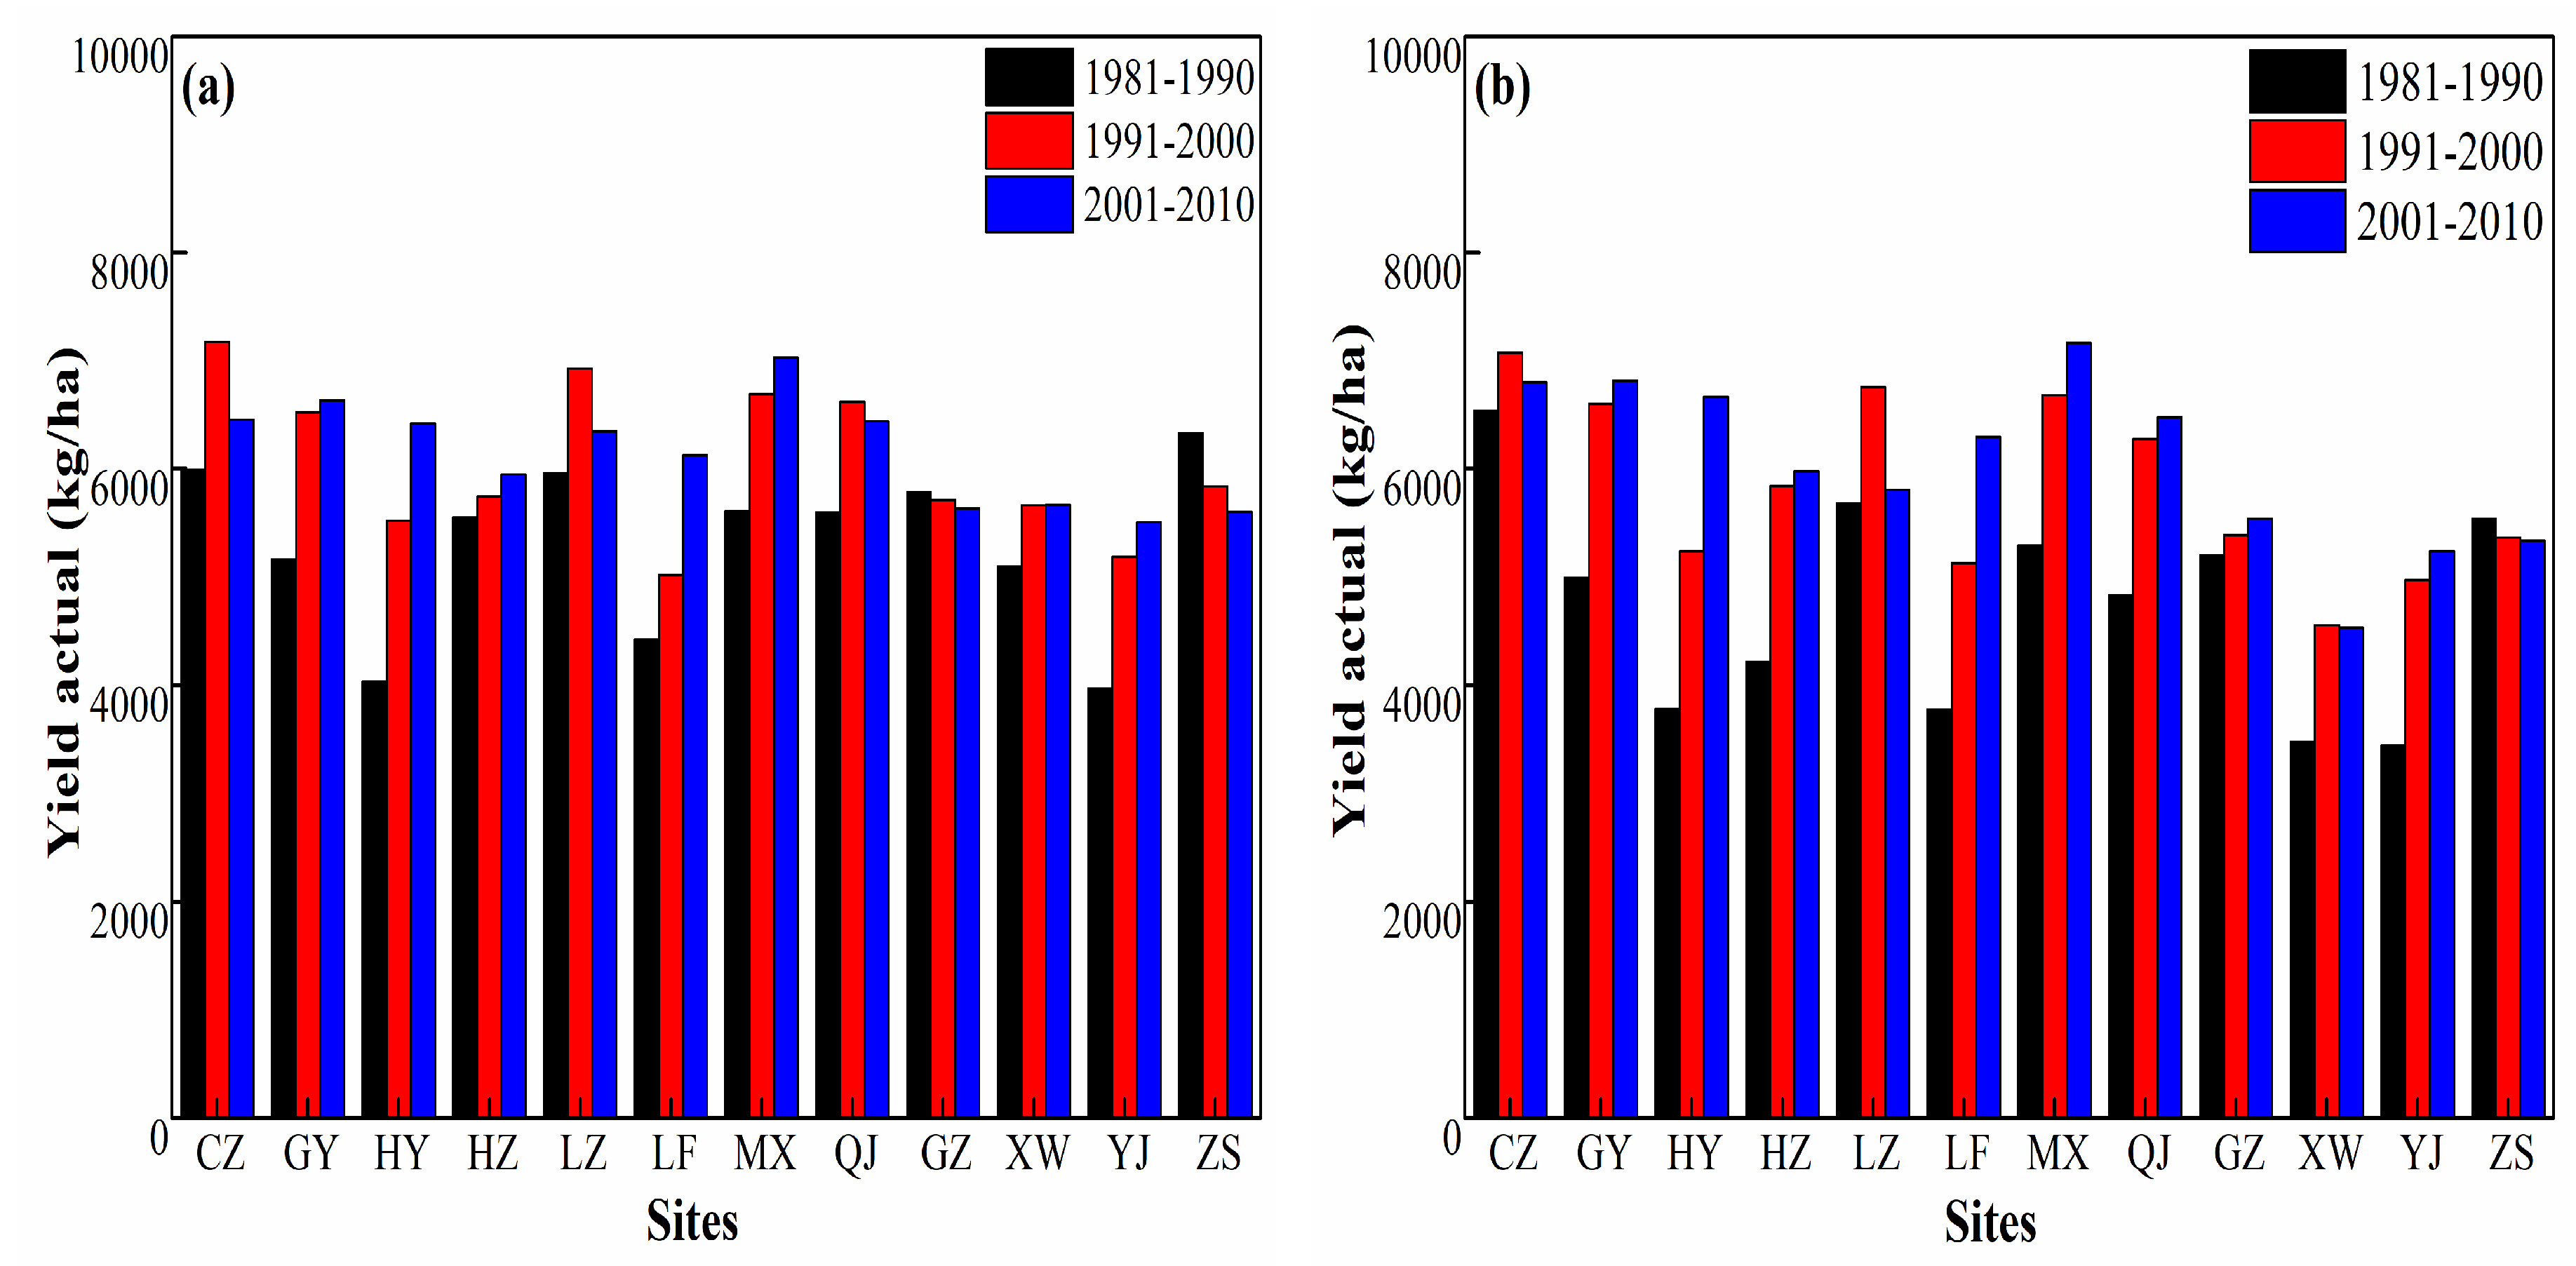
For each site, 30 years of yield actual were each obtained for early mature rice and late mature rice; then, the average of the yield actual was calculated, respectively. The yield actual approximately ranges from 4500 to 7000 kg/ha for early mature rice, and from 5000 to 7000 kg/ha for late mature rice, respectively. The trend of rice yield for each site can be obtained, and an overall increasing yield actual was observed in most sites across the Delta. Only a few sites show an obvious decreasing trend in the past 30 years.
Figure 4 indicated that for early mature rice, the yields of the sites of GY, HY, HZ, LF, MX, and YJ were increasing, obviously. However, the yields of the sites of CZ, LZ, QJ, GZ, XW, and ZS were either decreasing or stagnating. For late mature rice, the changing trend was merely the same as that for the early mature rice.
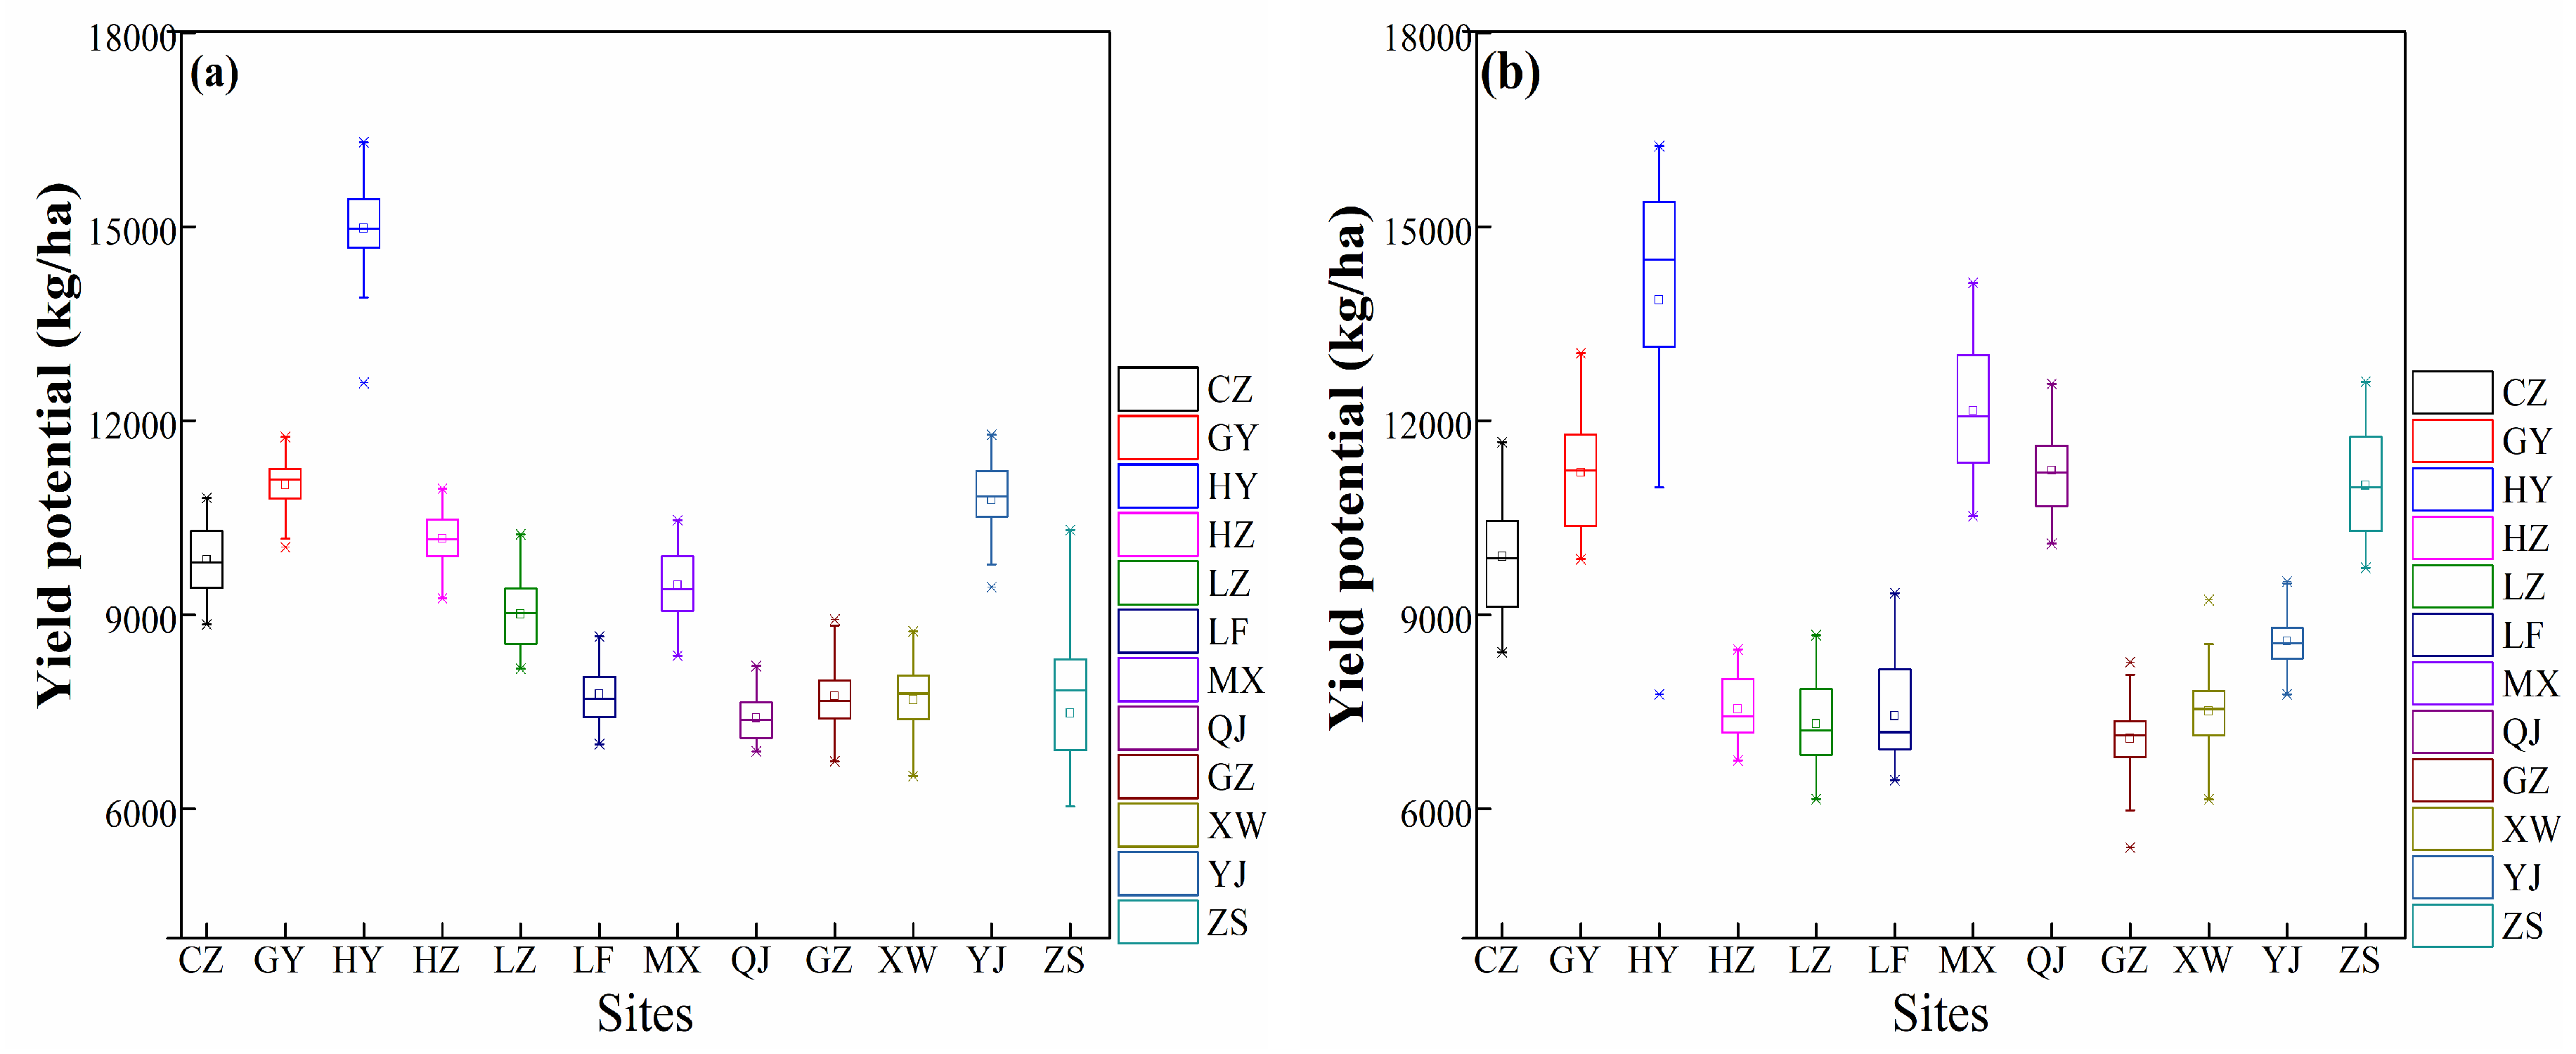
Figure 5a,b show that the simulated results of yield for early mature rice and late mature rice of each site from 1981 to 2010, respectively. The variations were less than 10%; therefore, the results were acceptable within the error range. The largest variation occurred in sites ZS and HY for early mature rice and late mature rice, respectively. From the box chart, it can also be concluded that the variations for early mature rice were smaller than those of late mature rice during this period. For the same site, the variations of yields for early mature rice were smaller than those for late mature rice. This may be due to the variations of weather conditions during the growing period of late mature rice.
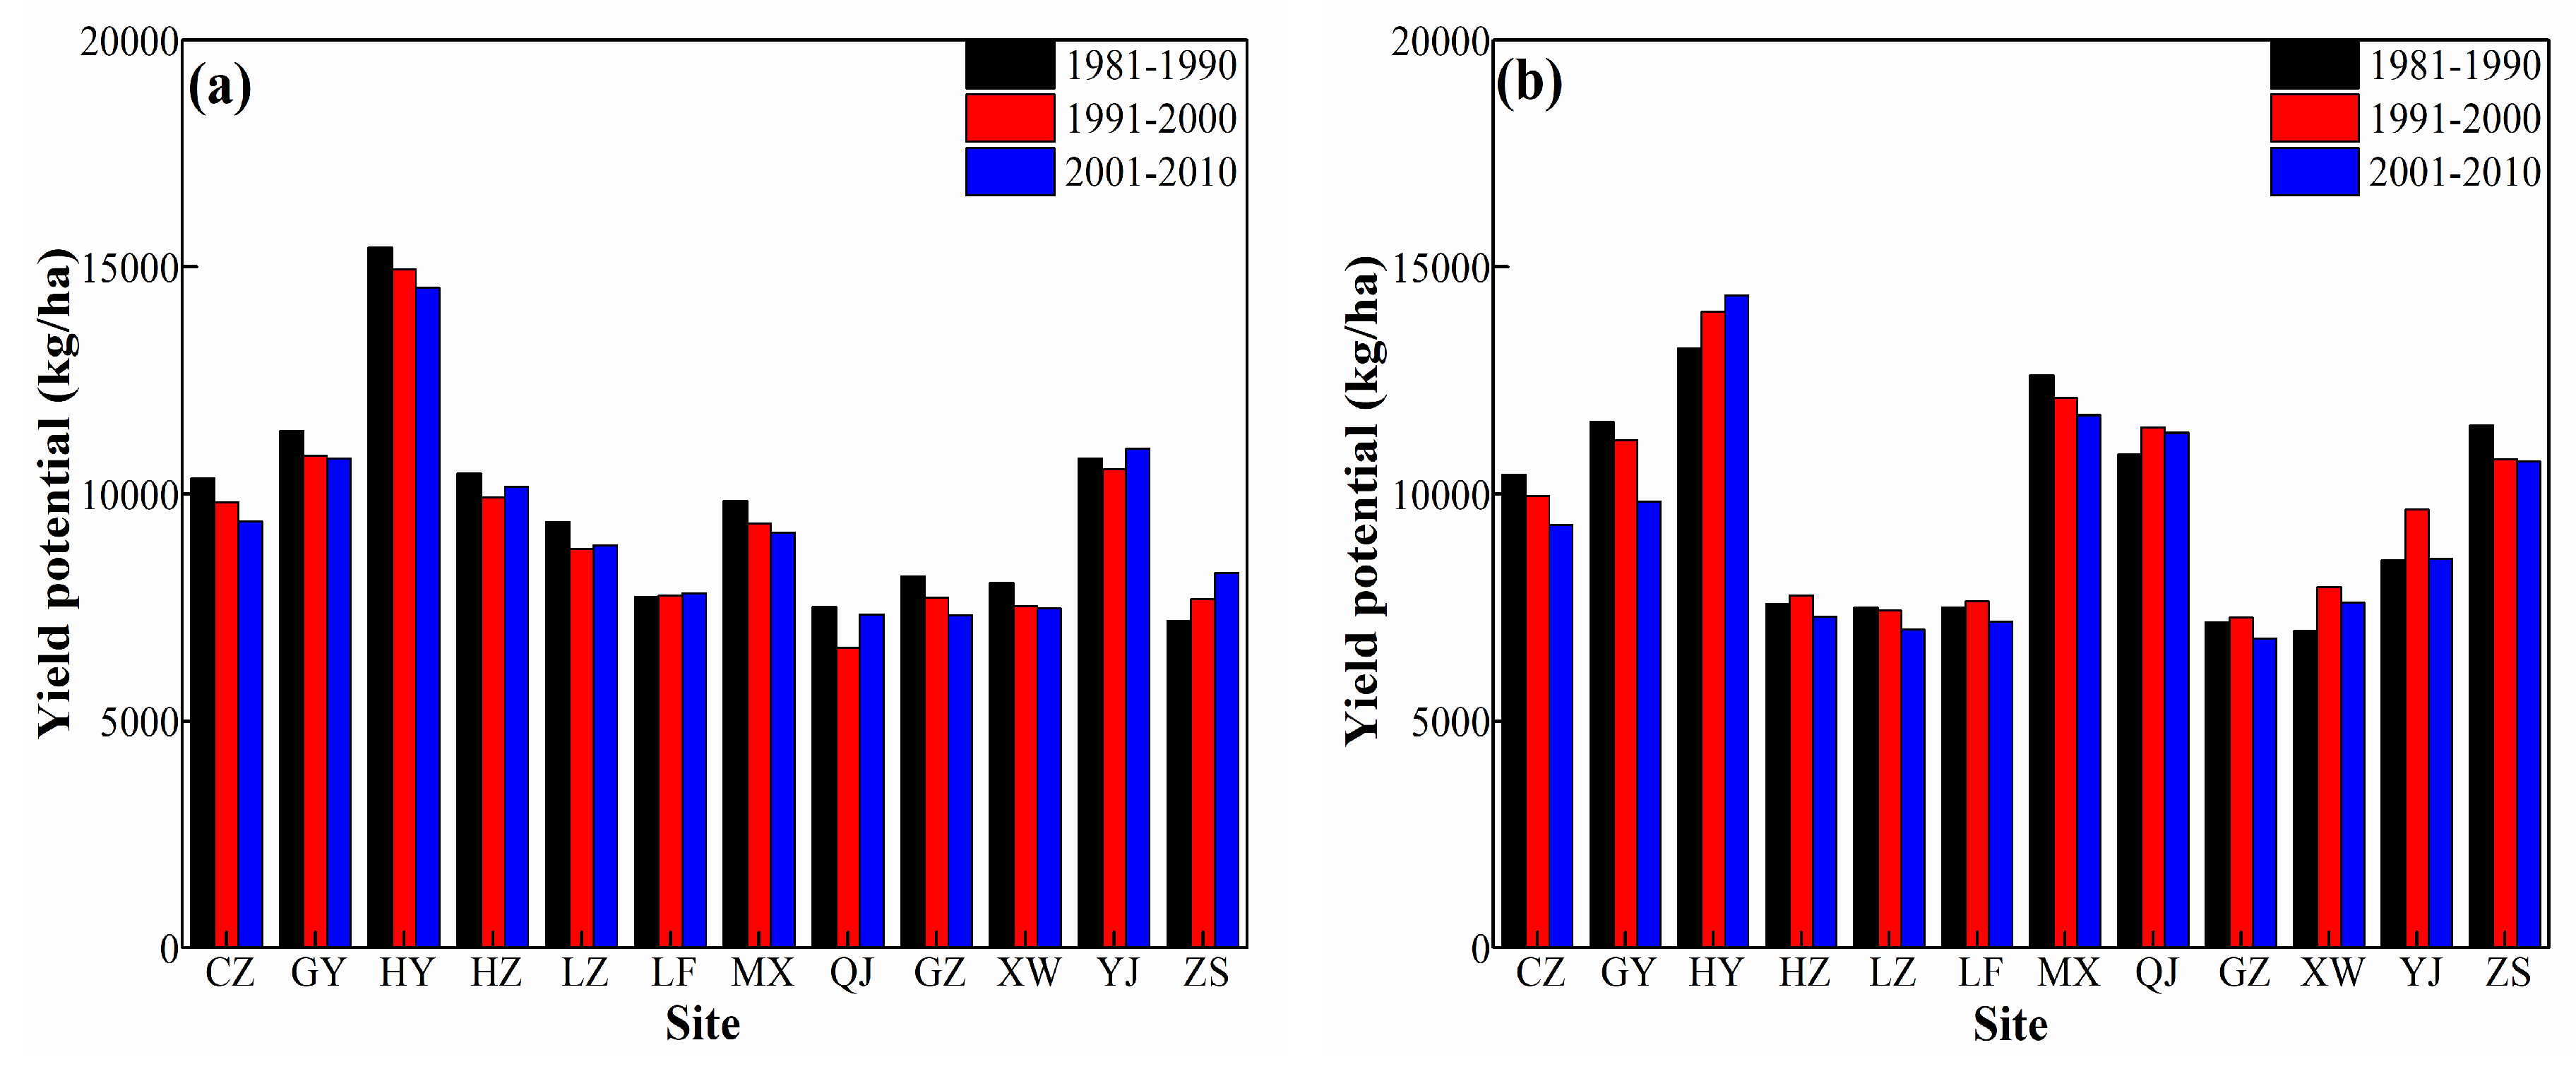
From Figure 6a,b, it can be observed that for most sites, the yield potential of early mature rice decreased during the three time periods except for site ZS, which had a small increase, and site LF, which had a yield stagnation. While for late mature rice, all of the sites were experiencing an obviously reducing trend. It can be concluded that for both early mature rice and late mature rice, the yield potential was decreasing constantly for most of the sites.
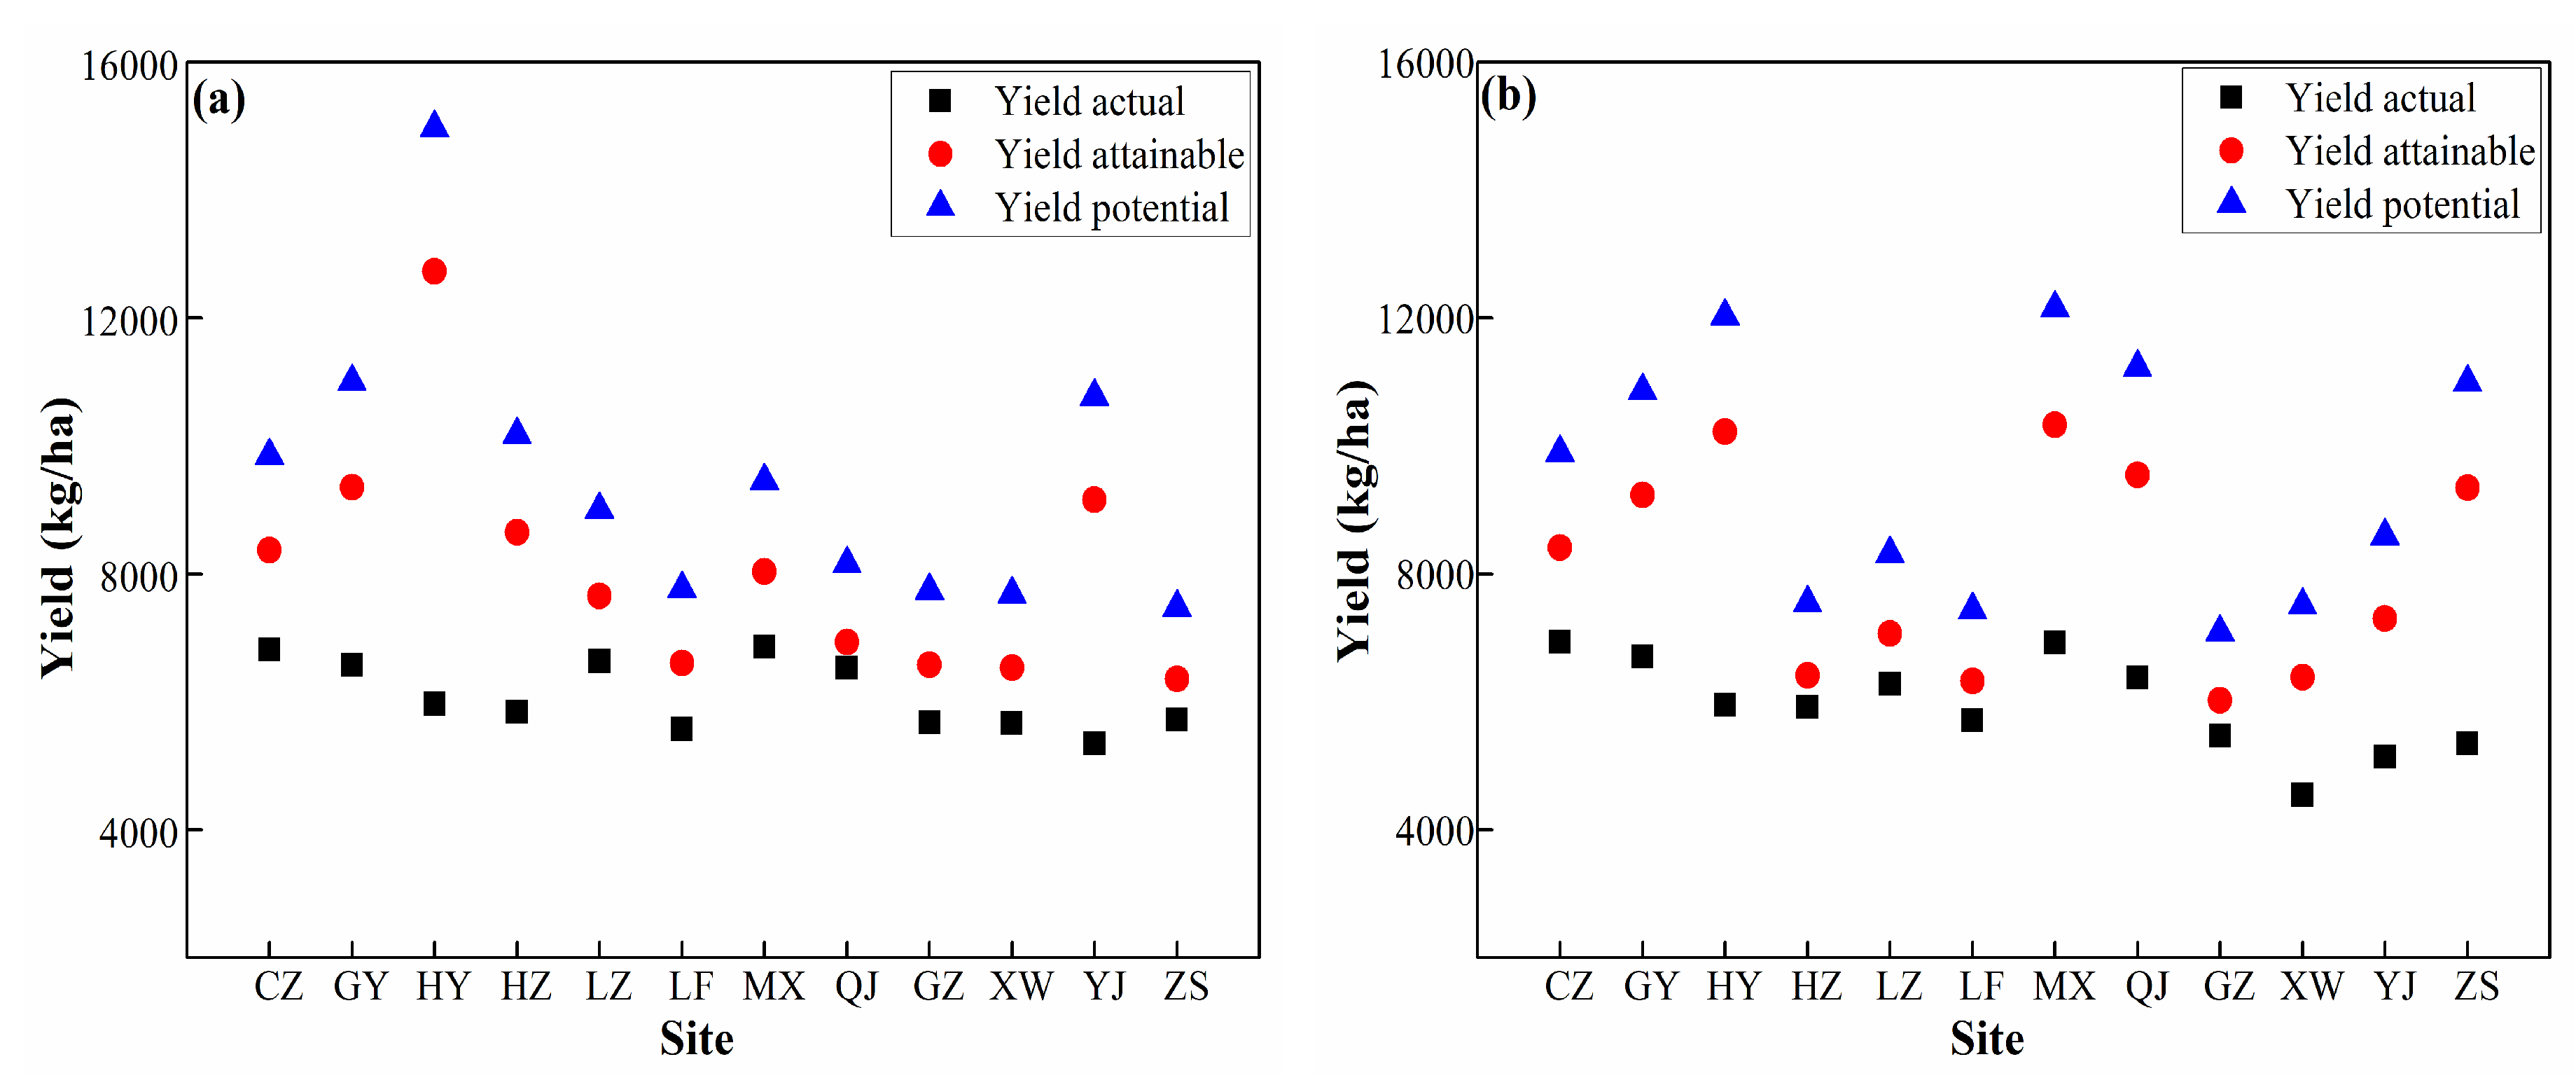
Yield attainable was less than the absolute biophysical ‘potential yields’, which represented the yield that is achievable using the current best-known technology and management techniques at a given time in a given ecosystem. The yield attainable was simulated using the same method for yield potential, except that the nutrients and water were provided abundantly. In other words, yield attainable also suffers from some nutrients and water stress for some time in the growing stages. Thus, the yield potential, yield attainable, and yield actual were all obtained, and the detailed information was shown in Figure 7a,b. In most of the sites, the yield actual has reached more than 50% of the yield potential, while the yield actual was less than the yield attainable, suggesting that rice yields were not near the yield potential, and that there is ample room for improvement. The average farm yields in a region or country are inevitably smaller than the yield potential, sometimes significantly so, because achieving yield potential requires near-perfect management of the crop and soil factors that influence plant growth and development throughout the crop growth cycle. In most irrigated major wheat, rice, and maize systems, yields appear to be at or near 80% of yield potential, with no evidence of yields having exceeded this threshold to date.
3.2. Spatial and Temporal Pattern of Yield Gap and Yield Gap Percentage
By definition, the yield gaps are the differences between the average of the yield potential, yield attainable, and yield actual. The yield gaps were evaluated and calculated according to each responding site, the spatial distributions of yield gap, yield gap1, and yield gap2 were shown in Figure 8 for early mature rice and late mature rice, respectively. The yield gap1 was mainly due to the management method, rice cultivar, soil, and market influence. The yield gap2 was mainly due to factors that are generally not controllable such as environmental conditions and some technologies unavailable in the farmers’ fields.
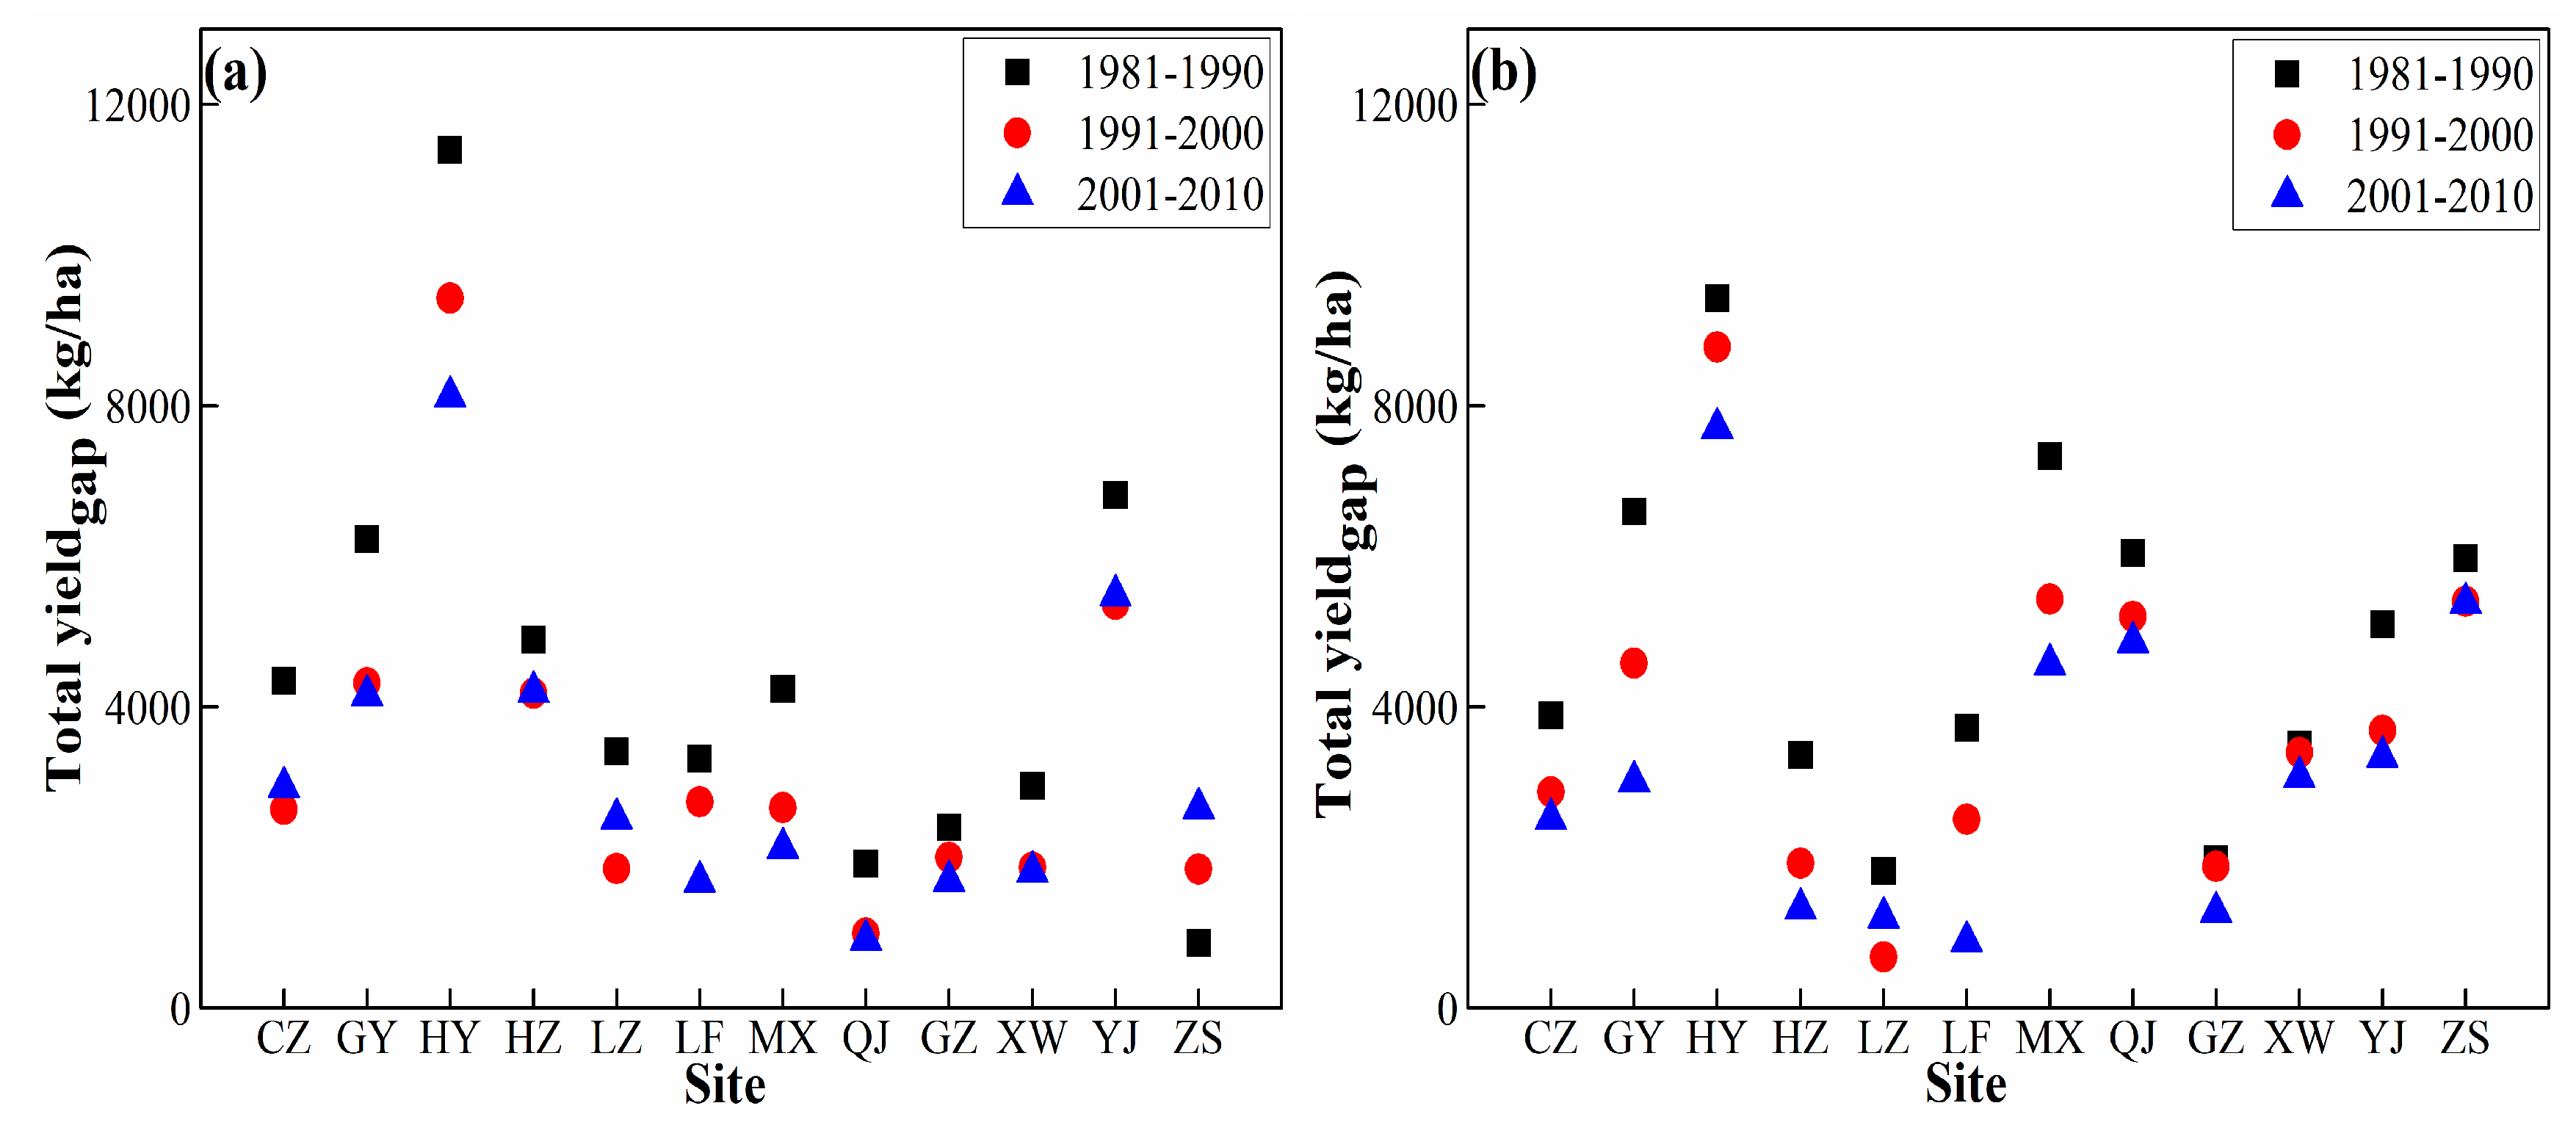
In order to explore the changing trends of yield gap for early mature rice and late mature rice, the yield gaps were divided using the three periods, and each period was averaged to acquire more reliable results by long time series of data. Figure 9 shows clearly the changing of the yield gap of each site for early mature rice and late mature rice, respectively.
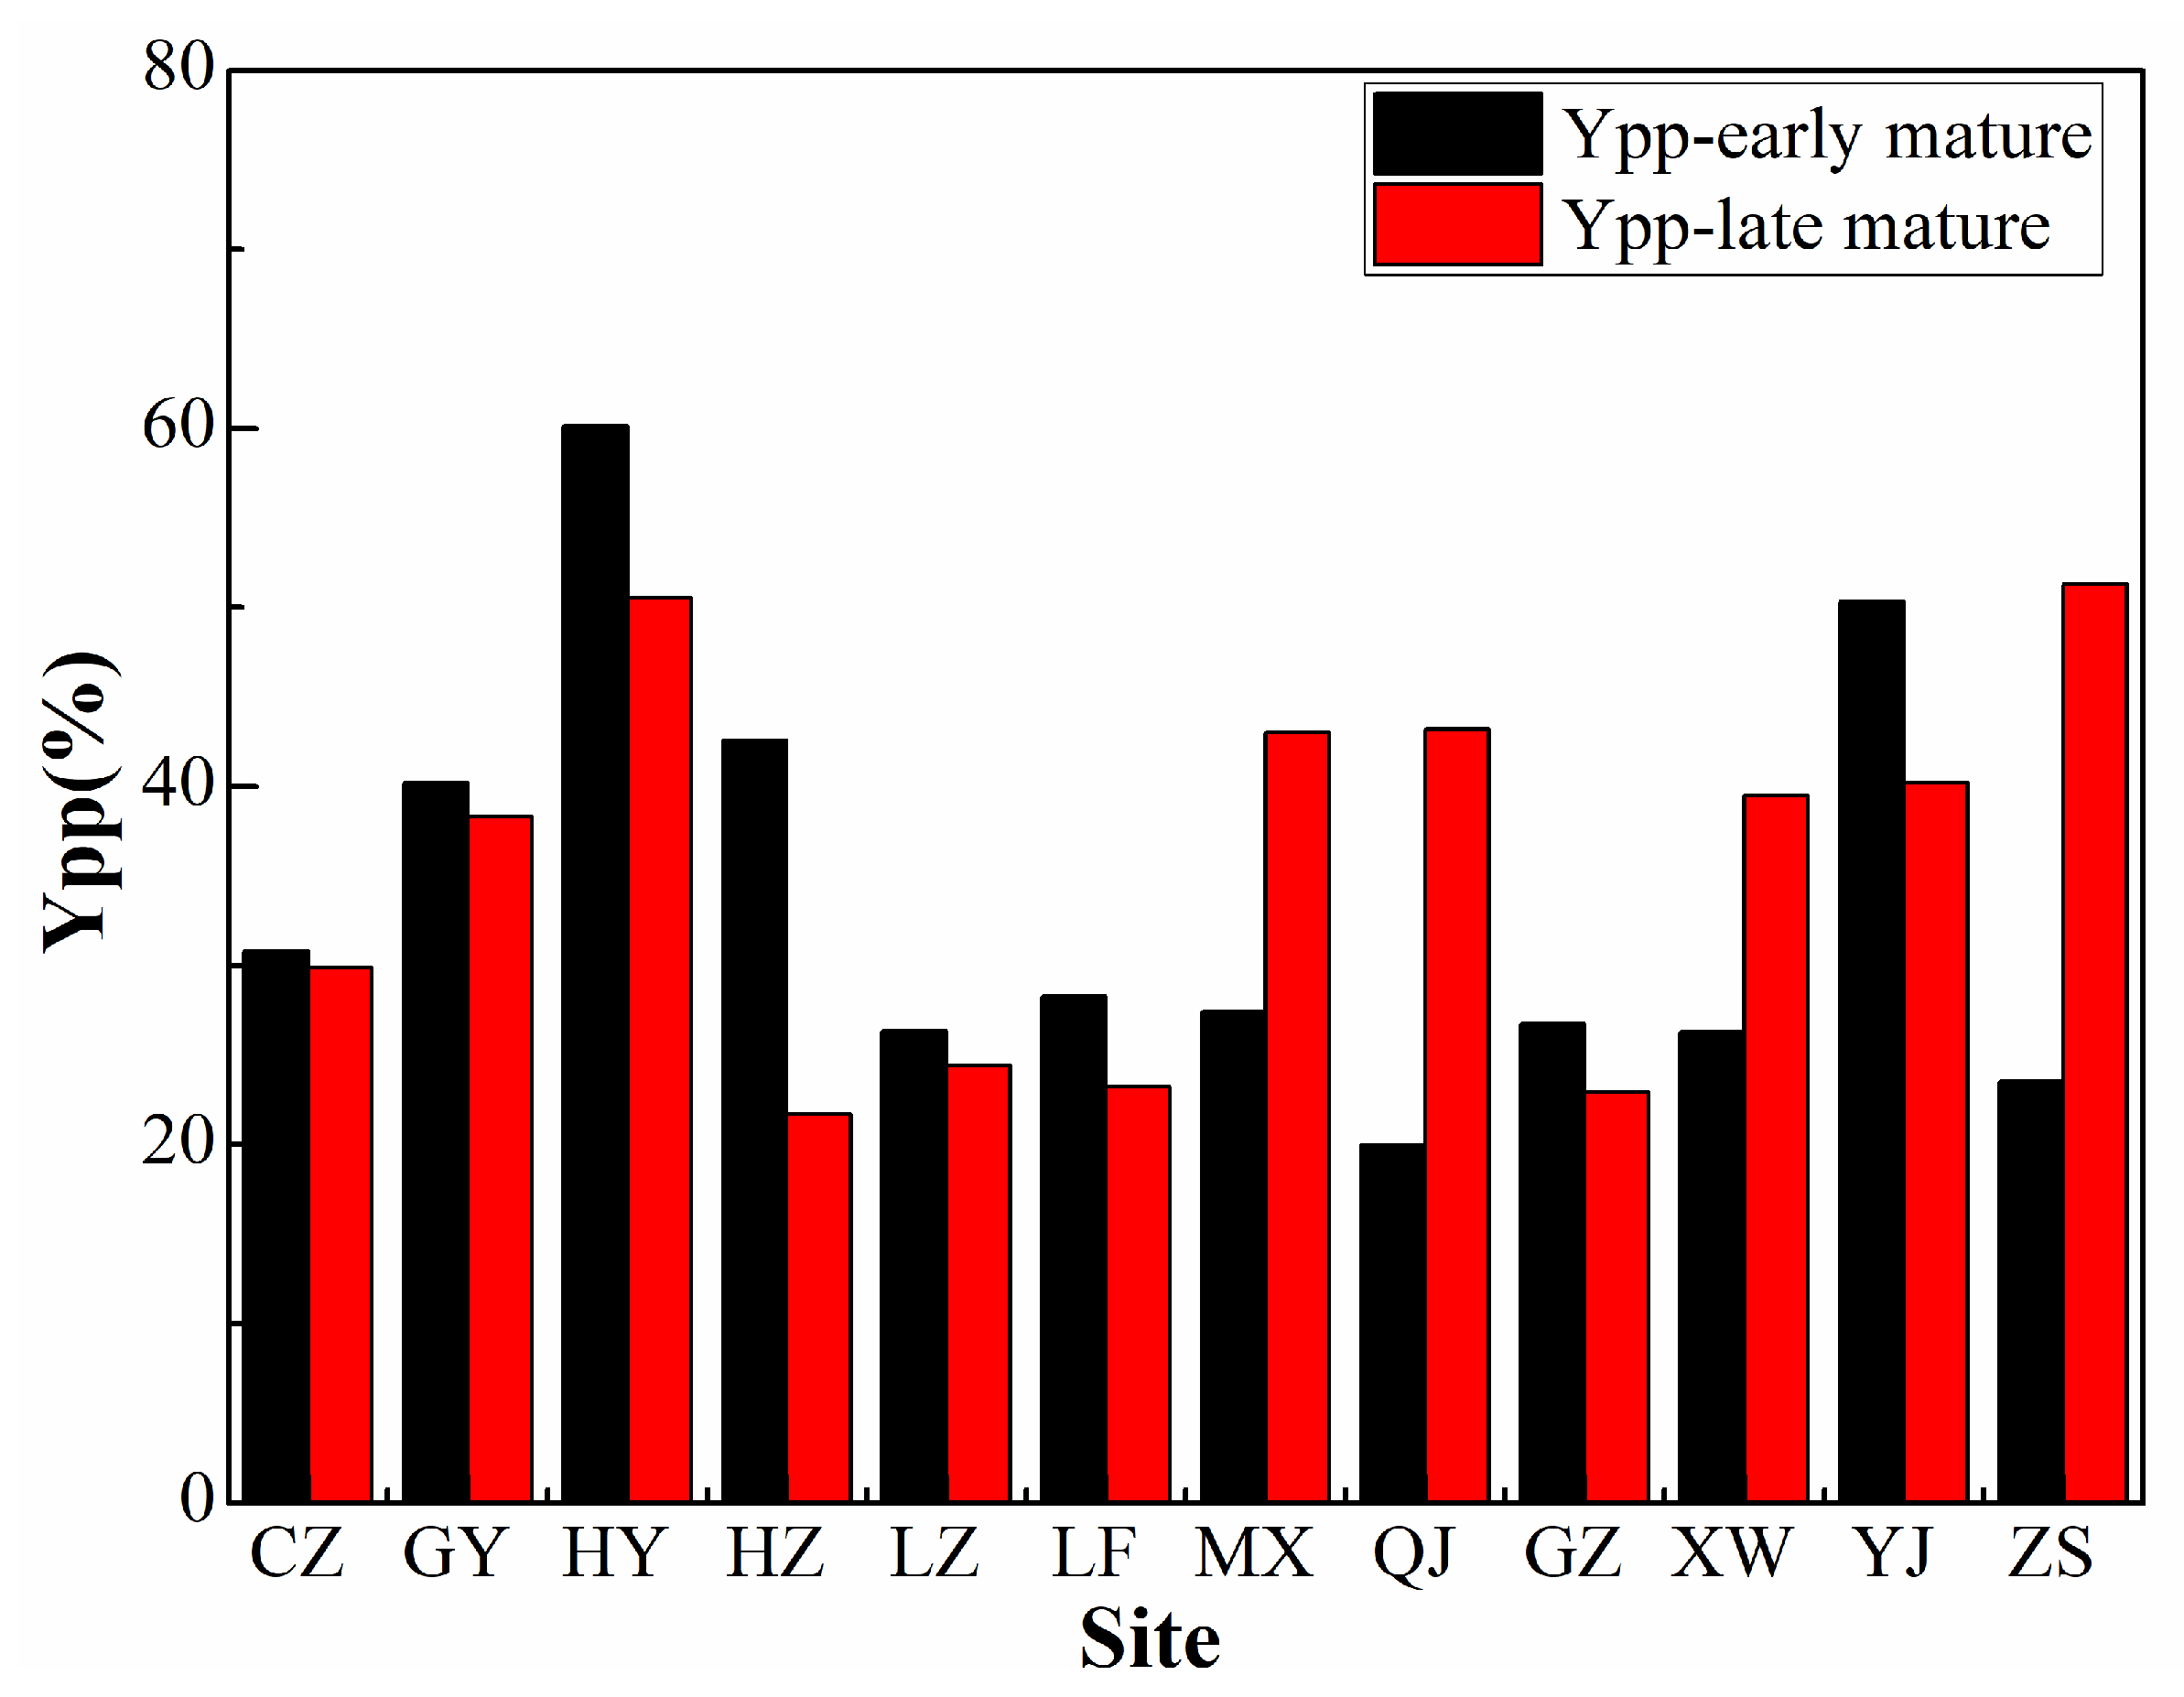
Yield gap percentage (Ypp) was obtained by Equation (7), and the results are shown in Figure 10. The higher the Ypp, the more potential ability the yield will have. The result clearly showed that the Ypp of the GY, HZ, and YJ sites for early mature rice and the HY, MX, and ZS sites for late mature rice all exceed 40%, implying a great potential ability for rice yield increase. Therefore, adaptive measures must be taken to raise the yield in these sites.
3.3. Impacts of Social–Economic Factors
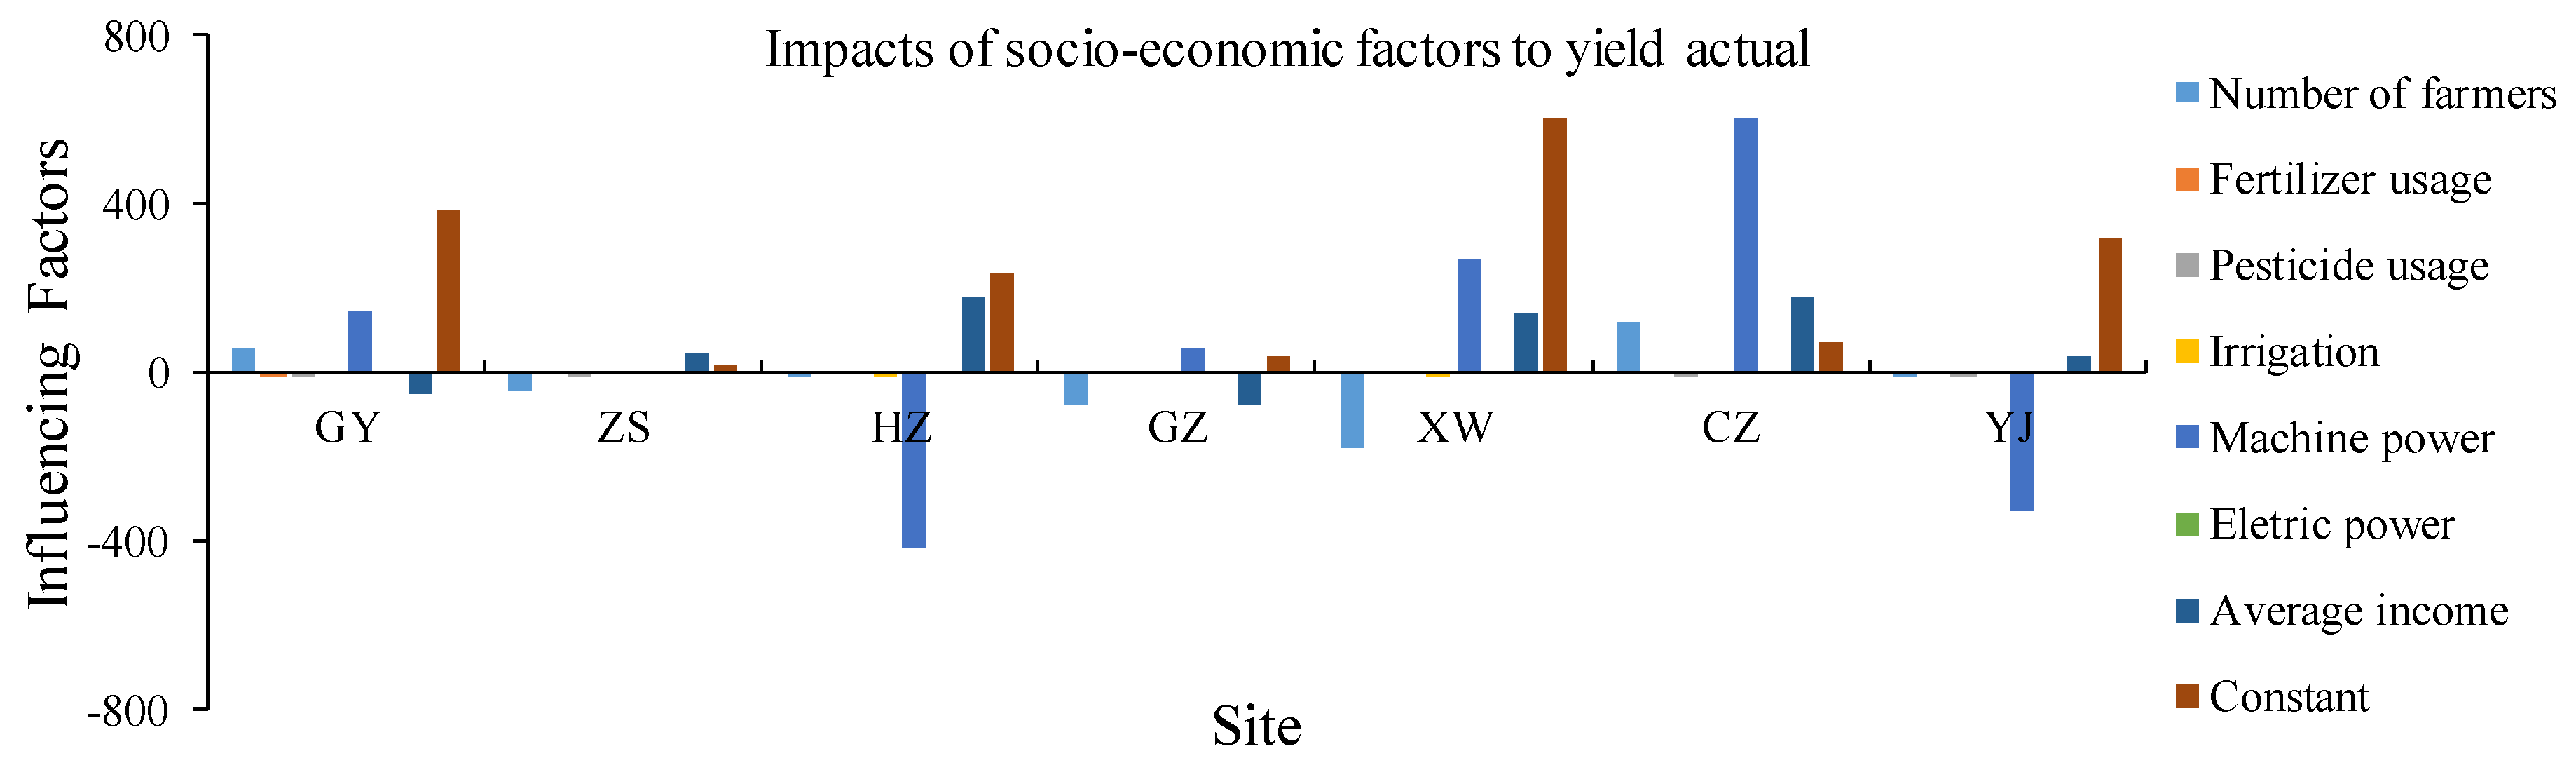
The yield actual was influenced by a variety of variables such as the number of farmers, usage of fertilizer and pesticide, application of irrigation, and machine power. These data were recorded by the Department of Statistics of local government through a standard procedure, and can be acquired from the statistics of Guangdong province, since these data were at the city level from 2001–2010, and some of the sites were not covered; the sites that have the corresponding economic variables were assessed and analyzed using the multiple linear regression method. These regressions were conducted on the same scale over the time period. The results are shown in Figure 11; it is evident that the number of people had a positive correlation with yield actual at the GY and CZ sites, while it had a negative correlation with yield actual at the other sites; fertilization had a positive correlation at all the sites; pesticide had a positive correlation in HZ, GZ, and XW, while it had a negative correlation at the remaining sites; machine power had a negative correlation at the HZ and YJ sites; electricity and irrigation have few impacts on the yields, so they can be neglected; average income is in a negative correlation in the GY and GZ sites. In all, with all these socio-economic variables considered, more usage of fertilization and machine power can increase the rice production. Irrigation has little impact, meaning that rice growing in this delta will not be influenced by irrigation, and also it can be concluded from Section 2.2.2 that the rainfall and water is abundant in this whole study area. The use of pesticide had a negative correlation at most of the sites, meaning that a great usage of pesticide will not benefit rice production, while in contrast, it will certainly reduce the yields. As for the average income of farmers, it had a positive correlation relationship at most of the sites, meaning that farmers would like to buy more fertilizer when they are able to. In all, the yield actual did not reach the ceiling of yield potential, so there is enough room to increase the yield of all the sites, and the common methods can be the greater adoption of organic fertilizers such as cattle manure, which will increase the organic components and improve the soil quality.
3.4. Adaptive Measures to Raise Rice Production
Even though the yield actual was increasing due to high-yielding cultivars and abundant irrigation and fertilization, also the rice yields of both early mature rice and late mature rice continued increasing, implying a shrinking of space for further yield improvement. Figure 6 clearly showed that the yield potential has a potential tendency to decrease; this is mainly due to the changing of weather conditions (Figure 2). Since the optimal management practice represents the average level of operations by farmers, there is the possibility that management practice can be improved by modifying or changing management procedures. In a crop group, the change of sowing date is generally considered to be the most adaptive measure, which would allow the crop to capture more solar radiance, escape high temperatures, and increase the length of the grain-filling period, which would possibly raise agricultural yields. For the early mature rice, the main growing period is in April, May, June, and July, and therefore, the early mature rice would be easily influenced by the high temperature. The high temperature can be avoided by adjusting the planting dates, such as advancing and delaying the sowing date by several days. Due to this, the optimal planting date for each site could be easily confirmed through simulation models.
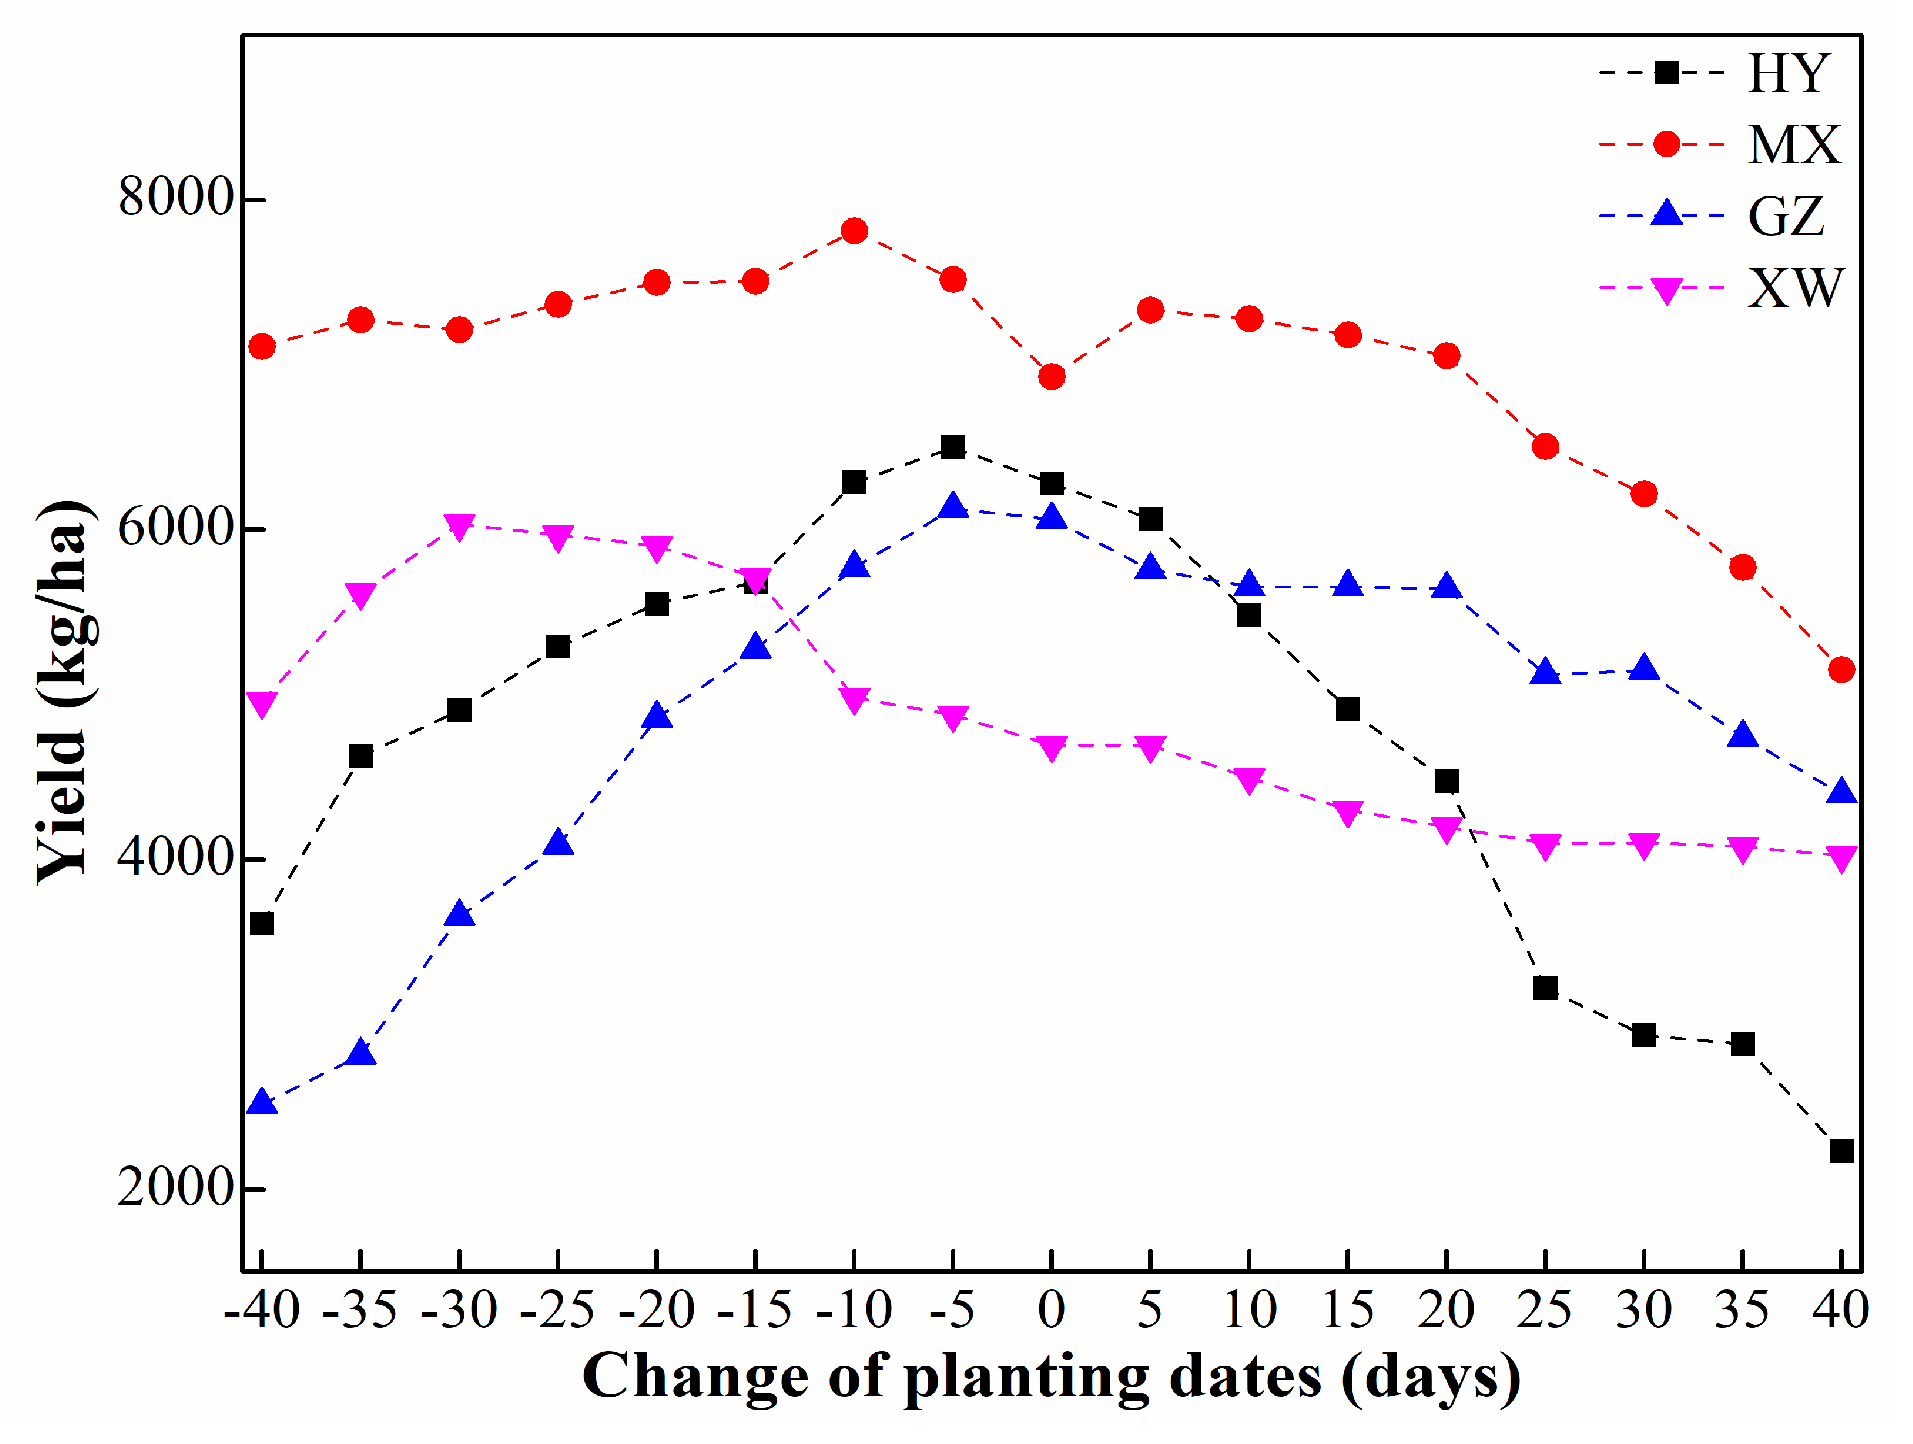
In order to obtain the most suitable planting dates, the planting dates were adjusted by advancing and delaying 40 days from the present date at intervals of five days; then, the simulated yields were compared with yields where the planting dates were held constant. We conducted the simulations at the HY, MX, GZ, and XW sites, where the yield potential had been predicted to decline dramatically in the future. Figure 12 showed the changing planting dates and the corresponding yield of four sites. The simulation results showed that changing the planting date could actually increase the yield to a certain degree. The maximum could be reached when the planting dates were advanced by five, 10, 10, and 20 days from the present planting dates for the HY, MX, GZ, and XW sites, respectively. For late mature rice, new genetic cultivars and new technologies are suggested to improve the rice yield.
4. Discussion
4.1. Analysis of the Cause of Changing Yield Gaps during 1981–2010
The changing of the total yield gaps of each site during the three time periods is shown in Figure 9. It can be concluded that the total yield gaps for most of the sites were reducing from 1981 to 2010. The main reason for this was the decreasing of yield potential and the increasing of yield actual. For the decreasing of yield potential, the main cause was the changing climate conditions, which had a negative impact on the agriculture and producing yield. It has been previously indicated that rice is very sensitive to changes in climatic variables such as the radiation, temperature, and precipitation during the growing season. The decreasing yield potential is closely connected with these changing climatic variables. For most of the sites in this study, the sun radiation is prolonged with time, temperature is increasing, and the annual total precipitation is more than 1700 mm/yr. An increase of 1℃ in temperature during the growing season of rice could reduce yield by approximately 3% to 10%, and higher temperatures would certainly shorten the flowering period and the maturity period. In CERES-Rice model, the early mature rice yield and late mature rice yield are closely connected with the daily average temperature and average solar radiation. The cause of the changing yield potential and yield gap in this delta is related to the difference in the climatic data, and the principal factors being different. For early mature rice, the yield potential is undergoing a yield reduction from 1981 to 2010 at most of the sites, such as the CZ, LZ, GZ, and ZS sites. The main reason for this are the climatic variables such as the changing precipitation, sunshine hours, and temperature, which are influencing the yield profoundly.
The solar radiation, temperature, and precipitation during the growing periods were analyzed to reveal inner connections between yield and changing climatic variables. From Figure 2, it can be seen that the temperature and sunshine hours were all increasing, while the precipitation was decreasing, in most sites. The changing temperature and precipitation will reduce the yields, and sunshine hours will increase the yields. All of the yield potentials were decreasing, indicating that increasing temperature is the main factor influencing the early mature rice yield. For late mature rice, the sunshine hours were prolonged, and precipitation was decreasing. The detailed relationship between the yield and climatic variables are given in Equation (4) and Equation (5). The equations show that for late mature rice, the sunshine hours and the precipitation will reduce the rice yield. Therefore, the main factor influencing the late mature rice is the sunshine hours, or in other words, sun radiation. Therefore, the increasing temperature and the prolonged sunshine hours are the main factors reducing the yields of early mature rice and late mature rice, respectively.
The total yield gaps are closing due to the decreasing of the yield potential and the increasing of yield actual for 95% of the sites. The reasons for the increasing yield actual are the improved management practice and the variations in sites, which are caused by the different climatic conditions.
4.2. Approaches to Raise Yields
It can be obtained from Figure 4 that the overall of yield actual showed the tendency of increase; however, the extent was relative low, and some sites were already undergoing yield decrease between 1981–2010. In other words, the yields were vulnerable to yield stagnation at these sites. The yield stagnation and yield decrease can be solved by adaptive measures such as changing the planting dates, which was introduced in Section 3.4. This was considered on the level of yield actual. The results shown in Figure 12 indicated the potential ability of increasing yield by adjusting the planting dates. In Section 2.2.2, the climatic variables clearly showed that adjusting the planting dates would likely avoid the high temperature for early mature rice. Such an adaptive measure is very effective, and can be easily adopted by farmers without sophisticated operations. Changing the present rice cultivar with high-temperature tolerant ones and breeding new advanced rice cultivars should of equal importance, which are similar to the suggested solution to cope with the changing agricultural environment, especially the increasing temperature and decreasing solar radiation. However, the simulations of these measures are beyond the scope of this study. We mainly focused on the yield potential related analysis, in which the rice cultivar should be hold constantly.
In addition, Figure 8 clearly showed that yield gap2 is relative smaller than yield gap1, which means that the yield actual has not reached the yield ceiling, and there is plenty of room for raising the yield actual. The difference between yield gap2 and yield gap1 is commonly caused by agricultural management such as policy supports, fiscal subsidies, and technical progress. From the results in Section 3.3, it is indicated that some factors may have already played important roles in promoting the yield production in this region. Such factors will encourage farmers to strengthen their management technologies and improve the planting environment. It is likely that the yield ceiling will be further closed under the influences of these external factors. The results of the impacts of social–economic-related factors that were outlined in Section 3.3 also implied that the usage of fertilization and machine power were not adequately provided. However, the actual usage cannot be precisely simulated in the model, because there are so many uncertainties in fertilizers (such as the varieties) due to the large scale of the whole region. Appendix A shows the normal level of detailed usage of fertilizers in each site. The Urea and Compound were the main fertilizers in the site scale. It can be obtained that the chemical fertilizers were preferred; however, the usage of chemical fertilizers over a long period of time would reduce soil quality. The climate change impacts caused by greenhouse gas emissions are one of the most important ecological environment problems facing mankind. However, there is evidence that the usage of organic fertilizer will inevitably increase the emissions of greenhouse gases such as N2O, CO2, and CH4 compared with the usage of traditional chemical fertilizers. Therefore, the adoption of both chemical fertilizers and organic fertilizers are highly suggested in this region to deal with the future change of climate change impacts. Only in this way will the rice yield increase and the soil quality improve at the same time. As for the usage of irrigation and pesticide, both could decrease yields at most sites, because these factors were already abundantly provided. A greater adoption of these two factors would have little impact or even reduce the rice yield, because heavy adoption would influence the growth of rice and eventually reduce the rice yield.
In summary, adopting the adaptive measures and improving the agricultural management should be addressed to enhance the rice yield, which will further ensure the security of the food supply regionally.
4.3. Uncertainty of Modeling
When using crop models to estimate the potential yields, uncertainties seem to appear in all of the model-based estimates. Commonly, the uncertainties are related to: (1) input data; (2) model performance; and (3) error estimates from the up-scaling method [13,41].
The first uncertainty usually happens in developing countries and areas, where the data can be sparse and poorly maintained due to shortage of labor and financial support. For this study, the uncertainty related to data is mainly caused by the weather stations and field management records. The weather stations can observe the climatic variables by minutes and hours, but the normal public has no access to these detailed data. Furthermore, the simulation models are the accumulation of the everyday growth of the crop, so that the change of climatic variables such as extremely hot or cold, and increasing CO2 concentration, which will influence yields dramatically, can hardly be evaluated. These data are used to verify the genetic coefficients of each specific rice cultivar, and are crucial for calibration and validation. Even though the yield gaps that were estimated in this study were accomplished using high-quality input data, there are still uncertainties that result from the input data.
The second uncertainty can be improved by simulation models. There are circumstances in which models are poorly calibrated and validated, which will lead to results that are less reliable and can seriously distort results, and will certainly decrease their usefulness to inform regional or national policies and lead to the effective prioritization of research and development investment for agriculture [42]. An inaccurate understanding of the cropping system will lead to inaccurate simulation results, such as using data that are only available for a few specific years, are not representative of larger spatial areas, and do not allow up-scaling to regional or global levels. The simulations with only one variety are not representative of the whole region. Even though the chosen cropping system represents the normal average level of farmers, the cropping system is so complex that it can hardly be evaluated when using the average operation level. Also, pest control is beyond the scope of this research. Similar to most model-based studies, modeling estimates could be further improved by increasing the model accuracy via more sophisticated parameterization, and increasing the number of calibrated varieties [43].
As for the third uncertainty, some studies have tended to conduct site-specific estimations of potential yields, and then interpolated the results to a larger scale to evaluate the regional spatial and temporal patterns of potential yields and yield gaps [44,45]. However, up-scaling these location-specific estimates to the regional scale may produce large uncertainties because of the spatially heterogeneous conditions of climate, soil, and planting practices, and consequently can result in a poor level of representativeness.
5. Conclusions
In this study, the yield potential and yield attainable were obtained for each site using simulation models. The spatial and temporal changing trends and patterns of yield potential were obtained. Non-controllable factors, agronomic factors, and socio-economic factors under the changing climate were confirmed. Adaptive measures were simulated, and changing management practices were adopted to face this natural challenge. The planting date was optimized by changing the planting date and confirmed with the constant rice cultivar for the early mature rice. The new genetic cultivars from agronomic practices are suggested for the late mature rice. To further improve the total yield of rice in the coming decades, our results highlight the necessity of the introduction of new agricultural technology and new varieties to break the potential ceiling and realize higher yield production. Moreover, breeding climate-resilient cultivars to further increase yield potential should be of equal importance, but this is beyond the scope of this study.
Author Contributions
For research articles with several authors, a short paragraph specifying their individual contributions must be provided. The following statements should be used “conceptualization, Y.G.; methodology, Y.G.; software, Y.G.; validation Y.G.; formal analysis, Y.G.; investigation, Y.G.; resources, Y.G. data curation, Y.G. writing—original draft preparation, Y.G. writing—review and editing, Y.G., W.W. and C.R.B.; visualization, Y.G.; supervision, W.W.; project administration, W.W.; funding acquisition, W.W., please turn to the CRediT taxonomy for the term explanation. Authorship must be limited to those who have contributed substantially to the work reported.
Funding
This research was funded by the Strategic Priority Research Program of the Chinese Academy of Sciences (XDA19040304) and the National Key Research and Development Program of China Grants (Grant No. 2016YFA0602402).
Conflicts of Interest
The authors declare no conflict of interest.
Appendix A

Table A1.
The detailed information of management of each site.
| Site | Cropping | Cultivar | Sowing | Emergence | Tillering | Jointing | Booting | Heading | Maturing | Urea (kg) | Compound (kg) |
|---|---|---|---|---|---|---|---|---|---|---|---|
| CZ | Early mature | Teyou254 | 2/18 | 2/22 | 4/2 | 5/8 | 5/30 | 6/10 | 7/11 | 25.5 | 60 |
| Late mature | Xieyou3550 | 7/18 | 7/22 | 8/14 | 9/10 | 9/22 | 10/2 | 11/10 | 27 | 60 | |
| GY | Early mature | Xuehuanian | 3/7 | 3/12 | 4/20 | 5/18 | 6/4 | 6/14 | 7/9 | 10 | 50 |
| Late mature | Xuehuanian | 7/6 | 7/10 | 8/18 | 9/6 | 9/16 | 9/30 | 11/4 | 5 | 45 | |
| HY | Early mature | Zayou | 3/23 | 3/27 | 5/6 | 5/26 | 6/10 | 6/20 | 7/18 | 1.5 | 35 |
| Late mature | Zayou | 7/11 | 7/15 | 8/18 | 9/4 | 9/14 | 9/24 | 10/26 | 42.5 | ||
| HZ | Early mature | Qishanzhan | 3/28 | 3/31 | 5/2 | 5/26 | 6/12 | 6/19 | 7/18 | 15 | 85 |
| Late mature | Gaozhoubaigu | 7/16 | 7/19 | 8/16 | 9/8 | 9/24 | 10/3 | 10/31 | 50 | 20 | |
| LZ | Early mature | Jinyou207 | 3/27 | 3/29 | 5/3 | 5/25 | 6/15 | 6/22 | 7/18 | 40 | 20 |
| Late mature | Jinyou253 | 7/5 | 7/7 | 7/29 | 8/21 | 9/14 | 9/20 | 10/25 | 50 | 50 | |
| LF | Early mature | YouI402 | 3/12 | 3/19 | 4/20 | 5/27 | 6/17 | 6/22 | 7/28 | 20 | 30 |
| Late mature | Yueyou350 | 7/22 | 7/24 | 8/20 | 9/2 | 9/23 | 10/6 | 11/7 | 10 | 30 | |
| MX | Early mature | Meiyou6 | 3/8 | 3/10 | 4/24 | 5/18 | 5/28 | 6/4 | 7/8 | 30.5 | 18 |
| Late mature | Meiyou6 | 7/17 | 7/19 | 8/14 | 9/8 | 9/18 | 9/26 | 11/4 | 34 | 16 | |
| QJ | Early mature | Jufengnian | 3/7 | 3/10 | 4/27 | 5/16 | 6/3 | 6/11 | 7/11 | 16 | 30 |
| Late mature | Baikenian | 7/7 | 7/11 | 8/4 | 8/22 | 9/14 | 9/20 | 10/20 | 15 | 45 | |
| GZ | Early mature | Meixiangzhan | 3/20 | 3/23 | 5/3 | 5/25 | 6/6 | 6/15 | 7/13 | 20 | 25 |
| Late mature | Teshan25 | 7/23 | 7/26 | 8/26 | 9/10 | 9/24 | 10/3 | 11/3 | 25 | 27.5 | |
| XW | Early mature | Gaokang999 | 2/26 | 3/2 | 4/24 | 5/10 | 5/30 | 6/7 | 7/6 | 35 | |
| Late mature | Boyou15 | 7/19 | 7/22 | 8/28 | 9/20 | 10/4 | 10/12 | 11/10 | 10 | 25 | |
| YJ | Early mature | Zayou | 3/21 | 3/24 | 5/3 | 6/2 | 6/14 | 6/23 | 7/19 | 35 | 12 |
| Late mature | Zayou | 7/21 | 7/23 | 8/20 | 9/21 | 9/29 | 10/7 | 11/8 | 45 | 30 | |
| ZS | Early mature | Tainanzhan | 2/21 | 2/27 | 4/23 | 5/14 | 6/1 | 6/11 | 7/3 | 22 | |
| Late mature | Tainanzhan | 7/14 | 7/16 | 8/12 | 9/8 | 9/16 | 9/23 | 10/14 | 50 |
Appendix B
Table A2.
The detail of site, cropping system, rice cultivar name, and parameters.
| Site | Latitude | Longitude | Cropping | Cultivar | P1 | P2R | P5 | P2O | G1 | G2 | G3 | G4 |
|---|---|---|---|---|---|---|---|---|---|---|---|---|
| CZ | 23.4 | 116.42 | Early mature | Teyou254 | 500.0 | 200.0 | 400.0 | 12.1 | 100.0 | 0.0270 | 0.11 | 1.00 |
| Late mature | Xieyou3550 | 550.0 | 250.0 | 400.0 | 12.2 | 120.0 | 0.0270 | 0.11 | 1.00 | |||
| GY | 23.02 | 112.27 | Early mature | Xuehuanian | 200.0 | 400.0 | 400.0 | 11.2 | 300.0 | 0.0220 | 1.00 | 1.00 |
| Late mature | Xuehuanian | 210.0 | 410.0 | 400.0 | 11.3 | 300.0 | 0.0220 | 1.00 | 1.00 | |||
| HY | 23.48 | 114.44 | Early mature | Zayou | 400.0 | 400.0 | 600.0 | 11.1 | 300.0 | 0.0110 | 0.55 | 1.00 |
| Late mature | Zayou | 400.0 | 400.0 | 500.0 | 11.2 | 300.0 | 0.0110 | 0.55 | 1.00 | |||
| HZ | 21.39 | 110.37 | Early mature | Qishanzhan | 400.0 | 300.0 | 400.0 | 12.1 | 200.0 | 0.0240 | 0.44 | 1.00 |
| Late mature | Gaozhoubaigu | 410.0 | 320.0 | 400.0 | 12.1 | 200.0 | 0.0240 | 0.44 | 1.00 | |||
| LZ | 24.48 | 112.22 | Early mature | Jinyou207 | 100.0 | 300.0 | 500.0 | 12.2 | 500.0 | 0.0220 | 1.00 | 1.00 |
| Late mature | Jinyou253 | 110.0 | 320.0 | 310.0 | 12.2 | 500.0 | 0.0220 | 1.00 | 1.00 | |||
| LF | 22.87 | 115.39 | Early mature | YouI402 | 100.0 | 300.0 | 300.0 | 12.1 | 100.0 | 0.0270 | 0.11 | 1.00 |
| Late mature | Yueyou350 | 300.0 | 300.0 | 500.0 | 12.3 | 300.0 | 0.0270 | 0.11 | 1.00 | |||
| MX | 24.17 | 116.04 | Early mature | Meiyou6 | 120.0 | 300.0 | 580.0 | 12.2 | 500.0 | 0.0220 | 1.00 | 1.00 |
| Late mature | Meiyou6 | 400.0 | 400.0 | 500.0 | 12.2 | 500.0 | 0.0220 | 1.00 | 1.00 | |||
| QJ | 24.4 | 113.36 | Early mature | Jufengnian | 200.0 | 200.0 | 350.0 | 12.1 | 350.0 | 0.0230 | 1.00 | 1.00 |
| Late mature | Baikenian | 300.0 | 300.0 | 500.0 | 12.2 | 500.0 | 0.0220 | 0.66 | 1.00 | |||
| GZ | 23.13 | 113.29 | Early mature | Meixiangzhan | 100.0 | 300.0 | 500.0 | 12.3 | 100.0 | 0.0270 | 0.11 | 1.00 |
| Late mature | Teshan25 | 120.0 | 320.0 | 500.0 | 12.3 | 100.0 | 0.0280 | 0.11 | 1.00 | |||
| XW | 20.2 | 110.11 | Early mature | Gaokang999 | 300.0 | 200.0 | 350. | 12.1 | 350.0 | 0.0230 | 1.00 | 1.00 |
| Late mature | Boyou15 | 310.0 | 220.0 | 350.0 | 12.1 | 350.0 | 0.0230 | 1.00 | 1.00 | |||
| YJ | 21.5 | 111.58 | Early mature | Zayou | 100.0 | 200.0 | 350.0 | 12.1 | 310.0 | 0.0350 | 0.26 | 1.00 |
| Late mature | Zayou | 400.0 | 200.0 | 350.0 | 12.1 | 350.0 | 0.0350 | 1.00 | 1.00 | |||
| ZS | 22.3 | 113.24 | Early mature | Tainanzhan | 500.0 | 200.0 | 350.0 | 13.8 | 300.0 | 0.025 | 1.00 | 1.00 |
| Late mature | Tainanzhan | 220.0 | 240.0 | 700.0 | 12.1 | 310.0 | 0.035 | 0.26 | 1.00 |
References
- Fischer, T.; Byerlee, D.; Edmeades, G. Crop Yields and Global Food Security: Will Yield Increase Continue to Feed the World? Australian Centre for International Agricultural Research (ACIAR): Canberra, Australia, 2014.
- Zhang, W.; Cao, G.; Li, X.; Zhang, H.; Wang, C.; Liu, Q.; Chen, X.; Cui, Z.; Shen, J.; Jiang, R.; et al. Closing yield gaps in China by empowering smallholder farmers. Nature 2016, 537, 671–674. [Google Scholar] [CrossRef] [PubMed]
- van Wart, J.; Kersebaum, K.C.; Peng, S.; Milner, M.; Cassman, K.G. Estimating crop yield potential at regional to national scales. Field Crops Res. 2013, 143, 34–43. [Google Scholar] [CrossRef] [Green Version]
- van Ittersum, M.K.; Cassman, K.G. Yield gap analysis—Rationale, methods and applications—Introduction to the Special Issue. Field Crops Res. 2013, 143, 1–3. [Google Scholar] [CrossRef] [Green Version]
- Lobell, D.B.; Cassman, K.G.; Field, C.B. Crop Yield Gaps: Their Importance, Magnitudes, and Causes. Annu. Rev. Environ. Resour. 2009, 34, 179–204. [Google Scholar] [CrossRef] [Green Version]
- Li, K.; Yang, X.; Liu, Z.; Zhang, T.; Lu, S.; Liu, Y. Low yield gap of winter wheat in the North China Plain. Eur. J. Agron. 2014, 59, 1–12. [Google Scholar] [CrossRef]
- Ray, D.K.; Ramankutty, N.; Mueller, N.D.; West, P.C.; Foley, J.A. Recent patterns of crop yield growth and stagnation. Nat. Commun. 2012, 3, 1293. [Google Scholar] [CrossRef] [PubMed] [Green Version]
- Pachauri, R.; Reisinger, A. Climate Change 2007. Synthesis Report. Contribution of Working Groups I, II and III to the Fourth Assessment Report; Cambridge University Press: Cambridge, UK, 2008. [Google Scholar]
- Oliver, J.E. Intergovernmental Panel in Climate Change (IPCC). Encycl. Energy Nat. Resour. Environ. Econ. 2013, 26, 48–56. [Google Scholar]
- Evans, L.T. Crop Evolution, Adaptation and Yield; Cambridge University Press: Cambridge, UK, 1996. [Google Scholar]
- Reynolds, M.; Foulkes, M.J.; Slafer, G.A.; Berry, P.; Parry, M.A.J.; Snape, J.W.; Angus, W.J. Raising yield potential in wheat. J. Exp. Bot. 2009, 60, 1899–1918. [Google Scholar] [CrossRef] [PubMed] [Green Version]
- Tollenaar, M.; Lee, E.A. Yield potential, yield stability and stress tolerance in maize. Field Crops Res. 2002, 75, 161–169. [Google Scholar] [CrossRef]
- Ittersum, M.K.V.; Cassman, K.G.; Grassini, P.; Wolf, J.; Tittonell, P.; Hochman, Z. Yield gap analysis with local to global relevance—A review. Field Crops Res. 2013, 143, 4–17. [Google Scholar] [CrossRef] [Green Version]
- Connor, D.J.; Loomis, R.S.; Cassman, K.G.; Connor, D.J.; Loomis, R.S.; Cassman, K.G. Crop ecology: Productivity and management in agricultural systems. Agric. Syst. 1994, 45, 349–350. [Google Scholar]
- Godfray, H.C.J.; Beddington, J.R.; Crute, I.R.; Haddad, L.; Lawrence, D.; Muir, J.F.; Pretty, J.; Robinson, S.; Thomas, S.M.; Toulmin, C. Food security: the challenge of feeding 9 billion people. Science 2010, 327, 812–818. [Google Scholar] [CrossRef] [PubMed]
- Cassman, K.G.; Dobermann, A.; And, D.T.W.; Yang, H. Meeting Cereal Demand While Protecting Natural Resources and Improving Environmental Quality. Annu. Rev. Environ. Resour. 2003, 28, 315–358. [Google Scholar] [CrossRef]
- van Bussel, L.G.J.; Grassini, P.; Van Wart, J.; Wolf, J.; Claessens, L.; Yang, H.; Boogaard, H.; de Groot, H.; Saito, K.; Cassman, K.G.; et al. From field to atlas: Upscaling of location-specific yield gap estimates. Field Crops Res. 2015, 177, 98–108. [Google Scholar] [CrossRef] [Green Version]
- Laborte, A.G.; de Bie, K.; Smaling, E.M.A.; Moya, P.F.; Boling, A.A.; Van Ittersum, M.K. Rice yields and yield gaps in Southeast Asia: Past trends and future outlook. Eur. J. Agron. 2012, 36, 9–20. [Google Scholar] [CrossRef]
- Chen, Y.; Zhang, Z.; Tao, F.; Wang, P.; Wei, X. Spatio-temporal patterns of winter wheat yield potential and yield gap during the past three decades in North China. Field Crops Res. 2017, 206, 11–20. [Google Scholar] [CrossRef]
- Sun, S.; Yang, X.; Lin, X.; Sassenrath, G.F.; Li, K. Winter Wheat Yield Gaps and Patterns in China. Agron. J. 2018, 110, 319–330. [Google Scholar] [CrossRef] [Green Version]
- Tao, F.; Zhang, S.; Zhang, Z.; Rötter, R.P. Temporal and spatial changes of maize yield potentials and yield gaps in the past three decades in China. Agric. Ecosyst. Environ. 2015, 208, 12–20. [Google Scholar] [CrossRef] [Green Version]
- Wang, J.; Wang, E.; Yin, H.; Feng, L.; Zhang, J. Declining yield potential and shrinking yield gaps of maize in the North China Plain. Agric. For. Meteorol. 2014, 195–196, 89–101. [Google Scholar] [CrossRef]
- Wasserman, S.R.; Tao, Y.T.; Whitesides, G.M. Structure and reactivity of alkylsiloxane monolayers formed by reaction of alkyltrichlorosilanes on silicon substrates. Langmuir 1989, 5, 1074–1087. [Google Scholar] [CrossRef]
- Tao, F.; Zhang, S.; Zhang, Z.; Rötter, R.P. Maize growing duration was prolonged across China in the past three decades under the combined effects of temperature, agronomic management, and cultivar shift. Glob. Chang. Biol. 2014, 20, 3686–3699. [Google Scholar] [CrossRef] [PubMed]
- Ying, M.; Zhang, W.; Yu, H.; Lu, X.; Feng, J.; Fan, Y.; Zhu, Y.; Chen, D. An overview of the China Meteorological Administration tropical cyclone database. J. Atmos. Ocean. Technol. 2014, 31, 287–301. [Google Scholar] [CrossRef]
- Ahmad, S.; Ahmad, A.; Soler, C.M.T.; Ali, H.; Zia-Ul-Haq, M.; Anothai, J.; Hussain, A.; Hoogenboom, G.; Hasanuzzaman, M. Application of the CSM-CERES-Rice model for evaluation of plant density and nitrogen management of fine transplanted rice for an irrigated semiarid environment. Precis. Agric. 2011, 13, 200–218. [Google Scholar] [CrossRef]
- Amiri, E.; Rezaei, M.; Bannayan, M.; Soufizadeh, S. Calibration and Evaluation of CERES Rice Model under Different Nitrogen- and Water-Management Options in Semi-Mediterranean Climate Condition. Commun. Soil Sci. Plant Anal. 2013, 44, 1814–1830. [Google Scholar] [CrossRef]
- Cheyglinted, S.; Ranamukhaarachchi, S.; Singh, G. Assessment of the CERES-Rice model for rice production in the Central Plain of Thailand. J. Agric. Sci. 2001, 137, 289–298. [Google Scholar] [CrossRef]
- Liu, H.-L.; Liu, H.-B.; Lei, Q.-L.; Zhai, L.-M.; Wang, H.-Y.; Zhang, J.-Z.; Zhu, Y.-P.; Liu, S.-P.; Li, S.-J.; Zhang, J.-S.; et al. Using the DSSAT model to simulate wheat yield and soil organic carbon under a wheat-maize cropping system in the North China Plain. J. Integr. Agric. 2017, 16, 2300–2307. [Google Scholar] [CrossRef]
- Timsina, J.; Humphreys, E. Performance of CERES-Rice and CERES-Wheat models in rice–wheat systems: A review. Agric. Syst. 2006, 90, 5–31. [Google Scholar] [CrossRef]
- Lv, Z.; Liu, X.; Cao, W.; Zhu, Y. A Model-Based Estimate of Regional Wheat Yield Gaps and Water Use Efficiency in Main Winter Wheat Production Regions of China. Sci. Rep. 2017, 7, 6081. [Google Scholar] [CrossRef] [PubMed]
- MacCarthy, D.S.; Adiku, S.G.; Freduah, B.S.; Kamara, A.Y.; Narh, S.; Abdulai, A.L. Evaluating maize yield variability and gaps in two agroecologies in northern Ghana using a crop simulation model. S. Afr. J. Plant Soil 2017, 35, 137–147. [Google Scholar] [CrossRef] [Green Version]
- Ritchie, J.T.; Singh, U.; Godwin, D.C.; Bowen, W.T. Cereal growth, development and yield. In Understanding Options for Agricultural Production; Tsuji, G.Y., Hoogenboom, G., Thornton, P.K., Eds.; Springer: Dordrecht, The Netherlands, 1998; Volume 7, pp. 79–98. [Google Scholar]
- Timsina, J.; Humphreys, E. Applications of CERES-Rice and CERES-Wheat in research, policy and climate change studies in Asia: A review. Int. J. Agric. Res. 2010, 1, 202–225. [Google Scholar]
- Jones, J.W.; He, J.; Boote, K.J.; Wilkens, P.; Porter, C.; Hu, Z. Estimating DSSAT cropping system cultivar-specific parameters using Bayesian techniques. In Methods of Introducing System Models into Agricultural Research; American Society of Agronomy: Madison, WI, USA, 2011; pp. 365–394. [Google Scholar]
- Ahmad, A.; Ali, A.; Khaliq, T.; Wajid, S.A.; Iqbal, Z.; Ibrahim, M.; Javeed, H.M.R.; Hoogenboom, G. OILCROP-SUN Model Relevance for Evaluation of Nitrogen Management of Sunflower Hybrids in Sargodha, Punjab. Am. J. Plant Sci. 2013, 4, 1731–1735. [Google Scholar] [CrossRef]
- Sun, G.; Mu, M. Understanding variations and seasonal characteristics of net primary production under two types of climate change scenarios in China using using the LPJ model. Clim. Chang. 2013, 120, 755–769. [Google Scholar] [CrossRef]
- Beza, E.; Silva, J.V.; Kooistra, L.; Reidsma, P. Review of yield gap explaining factors and opportunities for alternative data collection approaches. Eur. J. Agron. 2016, 82, 206–222. [Google Scholar] [CrossRef]
- Bryant, C.R.; Sarr, M.A.; Délusca, K. Agricultural Adaptation to Climate Change; Springer International Publishing: New York, NY, USA, 2016. [Google Scholar]
- Jiang, M.; Shi, C.L.; Liu, Y.; Jin, Z.Q. Response of rice production to climate change based on self-adaptation in Fujian Province. J. Agric. Sci. 2017, 155, 751–765. [Google Scholar] [CrossRef]
- Grassini, P.; Bussel, L.G.J.V.; Wart, J.V.; Wolf, J.; Claessens, L.; Yang, H.; Boogaard, H.; Groot, H.D.; Ittersum, M.K.V.; Cassman, K.G. How good is good enough? Data requirements for reliable crop yield simulations and yield-gap analysis. Field Crops Res. 2015, 177, 49–63. [Google Scholar] [CrossRef] [Green Version]
- Tingem, M.; Rivington, M.; Bellocchi, G.; Colls, J. Crop yield model validation for Cameroon. Theor. Appl. Climatol. 2009, 96, 275–280. [Google Scholar] [CrossRef]
- Oort, P.A.J.V.; Saito, K.; Zwart, S.J.; Shrestha, S. A simple model for simulating heat induced sterility in rice as a function of flowering time and transpirational cooling. Field Crops Res. 2014, 156, 303–312. [Google Scholar] [CrossRef]
- Chen, Y.; Wang, P.; Zhang, Z.; Tao, F.; Wei, X. Rice yield development and the shrinking yield gaps in China, 1981–2008. Reg. Environ. Chang. 2017, 17, 2397–2408. [Google Scholar] [CrossRef]
- Dar, M.U.D. Modeling Climate Change Impact; A Study on Different Procedures and Strategies: A Review. Int. J. Pure Appl. Biosci. 2017, 5, 183–200. [Google Scholar] [CrossRef]
Figure 1.
Study area and spatial location of sites.

Figure 2.
Sunshine hours, minimum temperature, maximum temperature, and precipitation of three time periods for each site, respectively: (a) sunshine hours; (b) minimum temperature; (c) maximum temperature; (d) precipitation. The black square, red circle, and blue triangle each represent the time periods 1981–1990,1991–2000, and 2001–2010, respectively.


Figure 3.
Calibration and validation results for: (a) flowering date; (b) maturity date; and (c) yield.
Figure 3.
Calibration and validation results for: (a) flowering date; (b) maturity date; and (c) yield.

Figure 4.
The average of yield actual for each site during three time periods: (a) for early mature rice; (b) for late mature rice.
Figure 4.
The average of yield actual for each site during three time periods: (a) for early mature rice; (b) for late mature rice.

Figure 5.
Simulated yield potentials of each site using weather data from 1981–2010: (a) for early mature rice; (b) for late mature rice.
Figure 5.
Simulated yield potentials of each site using weather data from 1981–2010: (a) for early mature rice; (b) for late mature rice.

Figure 6.
Change of yield potential of each time for early mature rice and late mature rice during three time periods respectively: (a) for early mature rice; (b) for late mature rice.
Figure 6.
Change of yield potential of each time for early mature rice and late mature rice during three time periods respectively: (a) for early mature rice; (b) for late mature rice.

Figure 7.
Yield potential, yield attainable, and yield actual of each site during three time periods: (a) for early mature rice; (b) for late mature rice.
Figure 7.
Yield potential, yield attainable, and yield actual of each site during three time periods: (a) for early mature rice; (b) for late mature rice.

Figure 8.
Spatial distributions of yield gap, yield gap1, and yield gap2 of each site for early mature rice and late mature rice, respectively. Note: The red, yellow and green histogram represent the yield gap, yield gap1, and yield gap2, respectively. (a) For early mature rice; (b) for late mature rice.

Figure 9.
The changing of total yield gap for early mature rice and late mature rice, respectively: (a) for early mature rice; (b) for late mature rice.
Figure 9.
The changing of total yield gap for early mature rice and late mature rice, respectively: (a) for early mature rice; (b) for late mature rice.

Figure 10.
Yield gap percentage (Ypp) (%) of each site for early mature rice and late mature rice.

Figure 11.
Impacts of social-economic factors on yield actual.

Figure 12.
Changing of planting dates with the corresponding yields.

Table 1.
Detailed information on the soil of each of the following sites: Chaozhou (CZ), Gaoyao (GY), Heyuan (HY), Huazhou (HZ), Lianzhou (LZ), Lufeng (LF), Meixian (MX), Qujiang (QJ), Guangzhou (GZ), Xuwen (XW), Yangjiang (YJ), and Zhongshan (ZS).
Table 1.
Detailed information on the soil of each of the following sites: Chaozhou (CZ), Gaoyao (GY), Heyuan (HY), Huazhou (HZ), Lianzhou (LZ), Lufeng (LF), Meixian (MX), Qujiang (QJ), Guangzhou (GZ), Xuwen (XW), Yangjiang (YJ), and Zhongshan (ZS).
| Site | Color | Drainage | Runoff | Clay (%) | Organic (%) | pH | Exchange (cmol/kg) | Nitrogen (%) |
|---|---|---|---|---|---|---|---|---|
| MX | Brown | Well | Moderately High | 34.2 | 1.79 | 4.9 | 2.4 | 0.16 |
| GY | Yellow | Moderately Well | Moderately High | 18.4 | 1.4 | 5 | 3.1 | 2.11 |
| GZ | Red | Moderately Well | Moderately High | 14 | 3.46 | 7.1 | 1 | 0.18 |
| SG | Red | Moderately Well | Moderately High | 21.5 | 1.61 | 7.3 | 2.3 | 0.1 |
| LZ | Brown | Well | Moderately High | 32.9 | 3.3 | 8.1 | 3.4 | −99 |
| XW | Red | Moderately Well | Moderately High | 20.1 | 2.21 | 5.8 | 0.1 | 0.12 |
| CZ | Red | Moderately Well | Moderately High | 35 | 2.43 | 7.5 | 1 | 0.11 |
| YJ | Red | Well | Moderately High | 14.2 | 2.06 | 4.8 | 1.1 | 0.12 |
| HY | Yellow | Moderately Well | Moderately High | 14 | 1.99 | 4.9 | 1.3 | 0.09 |
| HZ | Red | Moderately Well | Moderately High | 6.7 | 0.89 | 5 | 0.7 | 0.06 |
| LF | Red | Moderately Well | Moderately High | 11.5 | 2.51 | 5 | 2.5 | 0.13 |
| ZS | Red | Well | Moderately High | 14.2 | 2.06 | 4.8 | 1.1 | 0.12 |
Table 2.
The genetic coefficients and definitions for rice cultivars in the CERES-Rice model.
| Genetic Coefficients | Definitions |
|---|---|
| P1 | The growing degree-days in the basic vegetation phase |
| P20 | The critical photoperiod or the longest day length measured in hours, during which development occurred at a maximum rate |
| P2R | The extent of delay in panicle initiation, expressed in °C-days |
| P5 | The time period in °C-days from the beginning of grain filling to physiological maturity with a base temperature of 9 °C in the grain-filling phase |
| G1 | The potential spikelet numbers per panicle |
| G2 | The single grain weight |
| G3 | The coefficients relative to IR64 cultivars |
| G4 | The temperature tolerance coefficient |
© 2019 by the authors. Licensee MDPI, Basel, Switzerland. This article is an open access article distributed under the terms and conditions of the Creative Commons Attribution (CC BY) license (http://creativecommons.org/licenses/by/4.0/).
Share and Cite
MDPI and ACS Style
Guo, Y.; Wu, W.; Bryant, C.R. Quantifying Spatio-Temporal Patterns of Rice Yield Gaps in Double-Cropping Systems: A Case Study in Pearl River Delta, China. Sustainability 2019, 11, 1394. https://doi.org/10.3390/su11051394
AMA Style
Guo Y, Wu W, Bryant CR. Quantifying Spatio-Temporal Patterns of Rice Yield Gaps in Double-Cropping Systems: A Case Study in Pearl River Delta, China. Sustainability. 2019; 11(5):1394. https://doi.org/10.3390/su11051394
Chicago/Turabian StyleGuo, Yahui, Wenxiang Wu, and Christopher Robin Bryant. 2019. "Quantifying Spatio-Temporal Patterns of Rice Yield Gaps in Double-Cropping Systems: A Case Study in Pearl River Delta, China" Sustainability 11, no. 5: 1394. https://doi.org/10.3390/su11051394
Note that from the first issue of 2016, this journal uses article numbers instead of page numbers. See further details here.