Phosphorus Demand for Food Security: A Case Study of a Food-Deficient Country
by
Thabiti Soudjay Kamal
1,2,3, 
Yunfeng Huang
4,*,
Su Xu
1,3,
Imranul Islam
1,2,3 and
Shenghui Cui
1,3,* 1
Key Lab of Urban Environment and Health, Institute of Urban Environment, Chinese Academy of Sciences, 1799, Jimei Road, Xiamen 361021, China
2
International School, University of Chinese Academy of Sciences, Beijing 100049, China
3
Xiamen Key Lab of Urban Metabolism, Institute of Urban Environment, Chinese Academy of Sciences, Xiamen 361021, China
4
College of Food and Biological Engineering, Jimei University, Xiamen 361021, China
*
Authors to whom correspondence should be addressed.
Sustainability 2019, 11(5), 1345; https://doi.org/10.3390/su11051345
Submission received: 20 January 2019
/
Revised: 21 February 2019
/
Accepted: 26 February 2019
/
Published: 4 March 2019
(This article belongs to the Special Issue Sustainable Crop Production Systems)
Abstract
:The modern global food production system relies heavily on a considerable input of phosphorus. Sustainable food and agriculture need integrated phosphorus management, especially in phosphorus-scarce and food-deficient countries. This study aimed to investigate the phosphorus requirements to meet the future food demand for a phosphorus-scarce and food-deficient country, Comoros, as a case study. With its rapid population growth, domestic food production is far from meeting the food demand in Comoros, and the country relies on imported foods to satisfy the national needs; it is currently a net food importer, an import-dependent nation. We first calculated the virtual and embedded phosphorus flows through food trade in Comoros, from 1991 to 2013, and then estimated the phosphorus requirements for the future food demand under two scenarios. We found that the total virtual and embedded phosphorus through imported food increased from 163,313 to 493,190.97 kg and 53,190.12 to 143,009.62 kg in 1991 and 2013, respectively. Whereas, the embedded phosphorus through exported food shifted from 2548.75 to 1334.5 kg in 1991 and 2013, respectively. In addition, the Self-Sufficiency Ratio (SSR) analysis found that Comoros’s SSR is far below 100%; it varied from 46.27% in 1991 to 29.70% in 2013, indicating that the capacity of domestic production to cover domestic consumption fell by 16.57% during that period. In terms of phosphorus requirements, Comoros will require approximately 3,003,435.09 kg of phosphorus to reach 90% of the SSR or 3,337,150.10 kg to achieve 100% of the SSR, by 2030. These amounts could allow farmers to domestically produce the entire volume of food crops and livestock products that would otherwise be imported from trade.
1. Introduction
Among the great challenges the world faces is how to feed a growing global population. That is why in September 2015, at the Sustainable Development Summit, the world leaders adopted the 2030 Agenda for Sustainable Development, which includes 17 Sustainable Development Goals (SDGs). “Ending hunger, achieving food security and improving food nutrition, and promoting sustainable agriculture” are the major points, amongst others of the second SDGs (https://www.un.org/development/desa/disabilities/envision2030-goal2.html). Therefore, this study, using the framework of the SDGs, attempts to answer the urgent call on how to boost agricultural productivity, taking Comoros as a case study of a food-deficient country. Approximately 71% of the food-deficient countries are located in Africa, where many studies have highlighted the phosphorus deficiency of the soil in general and in sub-Saharan Africa in particular [1,2,3,4,5,6]. However, there is currently a dearth of clear and specific estimates of the phosphorus requirements for overcoming this deficiency and boosting the agricultural productivity of a single nation. Thus, this article attempts to estimate the phosphorus requirements for Comoros to satisfy its food needs solely by domestic food production. Considering its rapid population growth, how many tons of food and phosphorus will be required to feed the growing number of Comorian mouths at the national level, in 2030?
Phosphorus is one of the three essential nutrients that plants need for growth, and there is no substitute for it. Phosphorus is obtained from phosphate rock and is applied as fertilizer on agricultural soil. It plays an important role in food production and has been used for increasing crop yields for quite a long time (probably since the 1950s) [4,7,8,9]; 90% of the global phosphorus demand is for food production [10] and approximately 170.7 million tons of phosphorus fertilizer nutrients were consumed in 2010, worldwide [11]. However, phosphorus consumption varies from one country to another, despite its crucial role in growing plants. In general, Africa is the continent with the lowest phosphorus fertilizer consumption in the world [4,12], although the largest phosphate reserves (approximately 85% of the world’s share) are found in an African country (Morocco: Estimation data from the International Fertilizer Development Center (IFDC) reserves for products). Comoros is among those African countries with little or no phosphorus fertilizer application to agricultural soils.
Agriculture is the most important economic sector in Comoros. It contributes 40% of the Gross Domestic Product (GDP) and 90% of fiscal revenues, and employs over 80% of the population [13,14,15]. It provides an essential proportion of basic food needs for consumption. Yet despite the importance of phosphorus, Comorian agriculture is dominated by small-scale farmers using rudimentary practices, including little or no phosphorus fertilizer input [16]. Consequently, domestic food crop production per capita has decreased during the last two decades [17]; nearly 95% of the rice consumed in Comoros is imported [18] and currently rice production in Comoros has now essentially ceased. Therefore, to satisfy the population’s needs, the country imports almost 40% of its total food requirements [19], from cereals to livestock products, to sugar crops, to vegetables. Currently, the situation is exacerbated by the rapid rate of population growth, and the country relies on imports to feed its population [20]. One of the difficulties of becoming a net food importer—an import-dependent nation—is that Comoros is one of the world’s poorest countries, near the bottom of the low-income countries (ranked 174 of 182 countries according to the 2017 World Bank data) (www.https://en.wikipedia.org/wiki/List_of_countries_by_GDP_(PPP)_per_capita). Hence it has serious difficulty paying the import food bills solely from the revenue derived from its three main agricultural exports (vanilla, cloves, and ylang-ylang) [21]. Thus, there is an urgent need to estimate the phosphorus requirements for Comoros, in order to boost sustainable agricultural productivity and increase crop yields.
In order to introduce sufficient innovations to the agricultural sector to achieve a 100% food Self-Sufficiency Ratio (SSR) and become a food import-independent nation, the Comorian government has implemented initiatives and set up long-term goals, by upgrading its Strategy for Accelerated Growth and Sustainable Development plan to the SCA2D-2030 for an emerging country. This process will require an intensification of agricultural inputs, especially phosphate fertilizer. Therefore, to understand how the agricultural sector could grow faster in terms of sustainable productivity improvement, it is necessary to estimate the phosphorus volume Comoros requires to achieve 100% SSR and meet its future domestic food demand.
The purpose of this study was therefore to estimate the phosphorus requirements for the Comorian agricultural sector to feed the future population. This goal comprises three main tasks: (1) an analysis and estimation of the embedded and virtual phosphorus flowing through the food trade in Comoros, from 1991 to 2013; (2) an empirical assessment of the current SSR based on food production in Comoros for selected items; and (3) an analysis of demand projections for food items and phosphorus requirement under two scenarios: Scenario 1, reach 90% of the SSR, and Scenario 2, achieve 100% of the SSR, by 2030.
2. Materials and Methods
2.1. Description of the Study Area
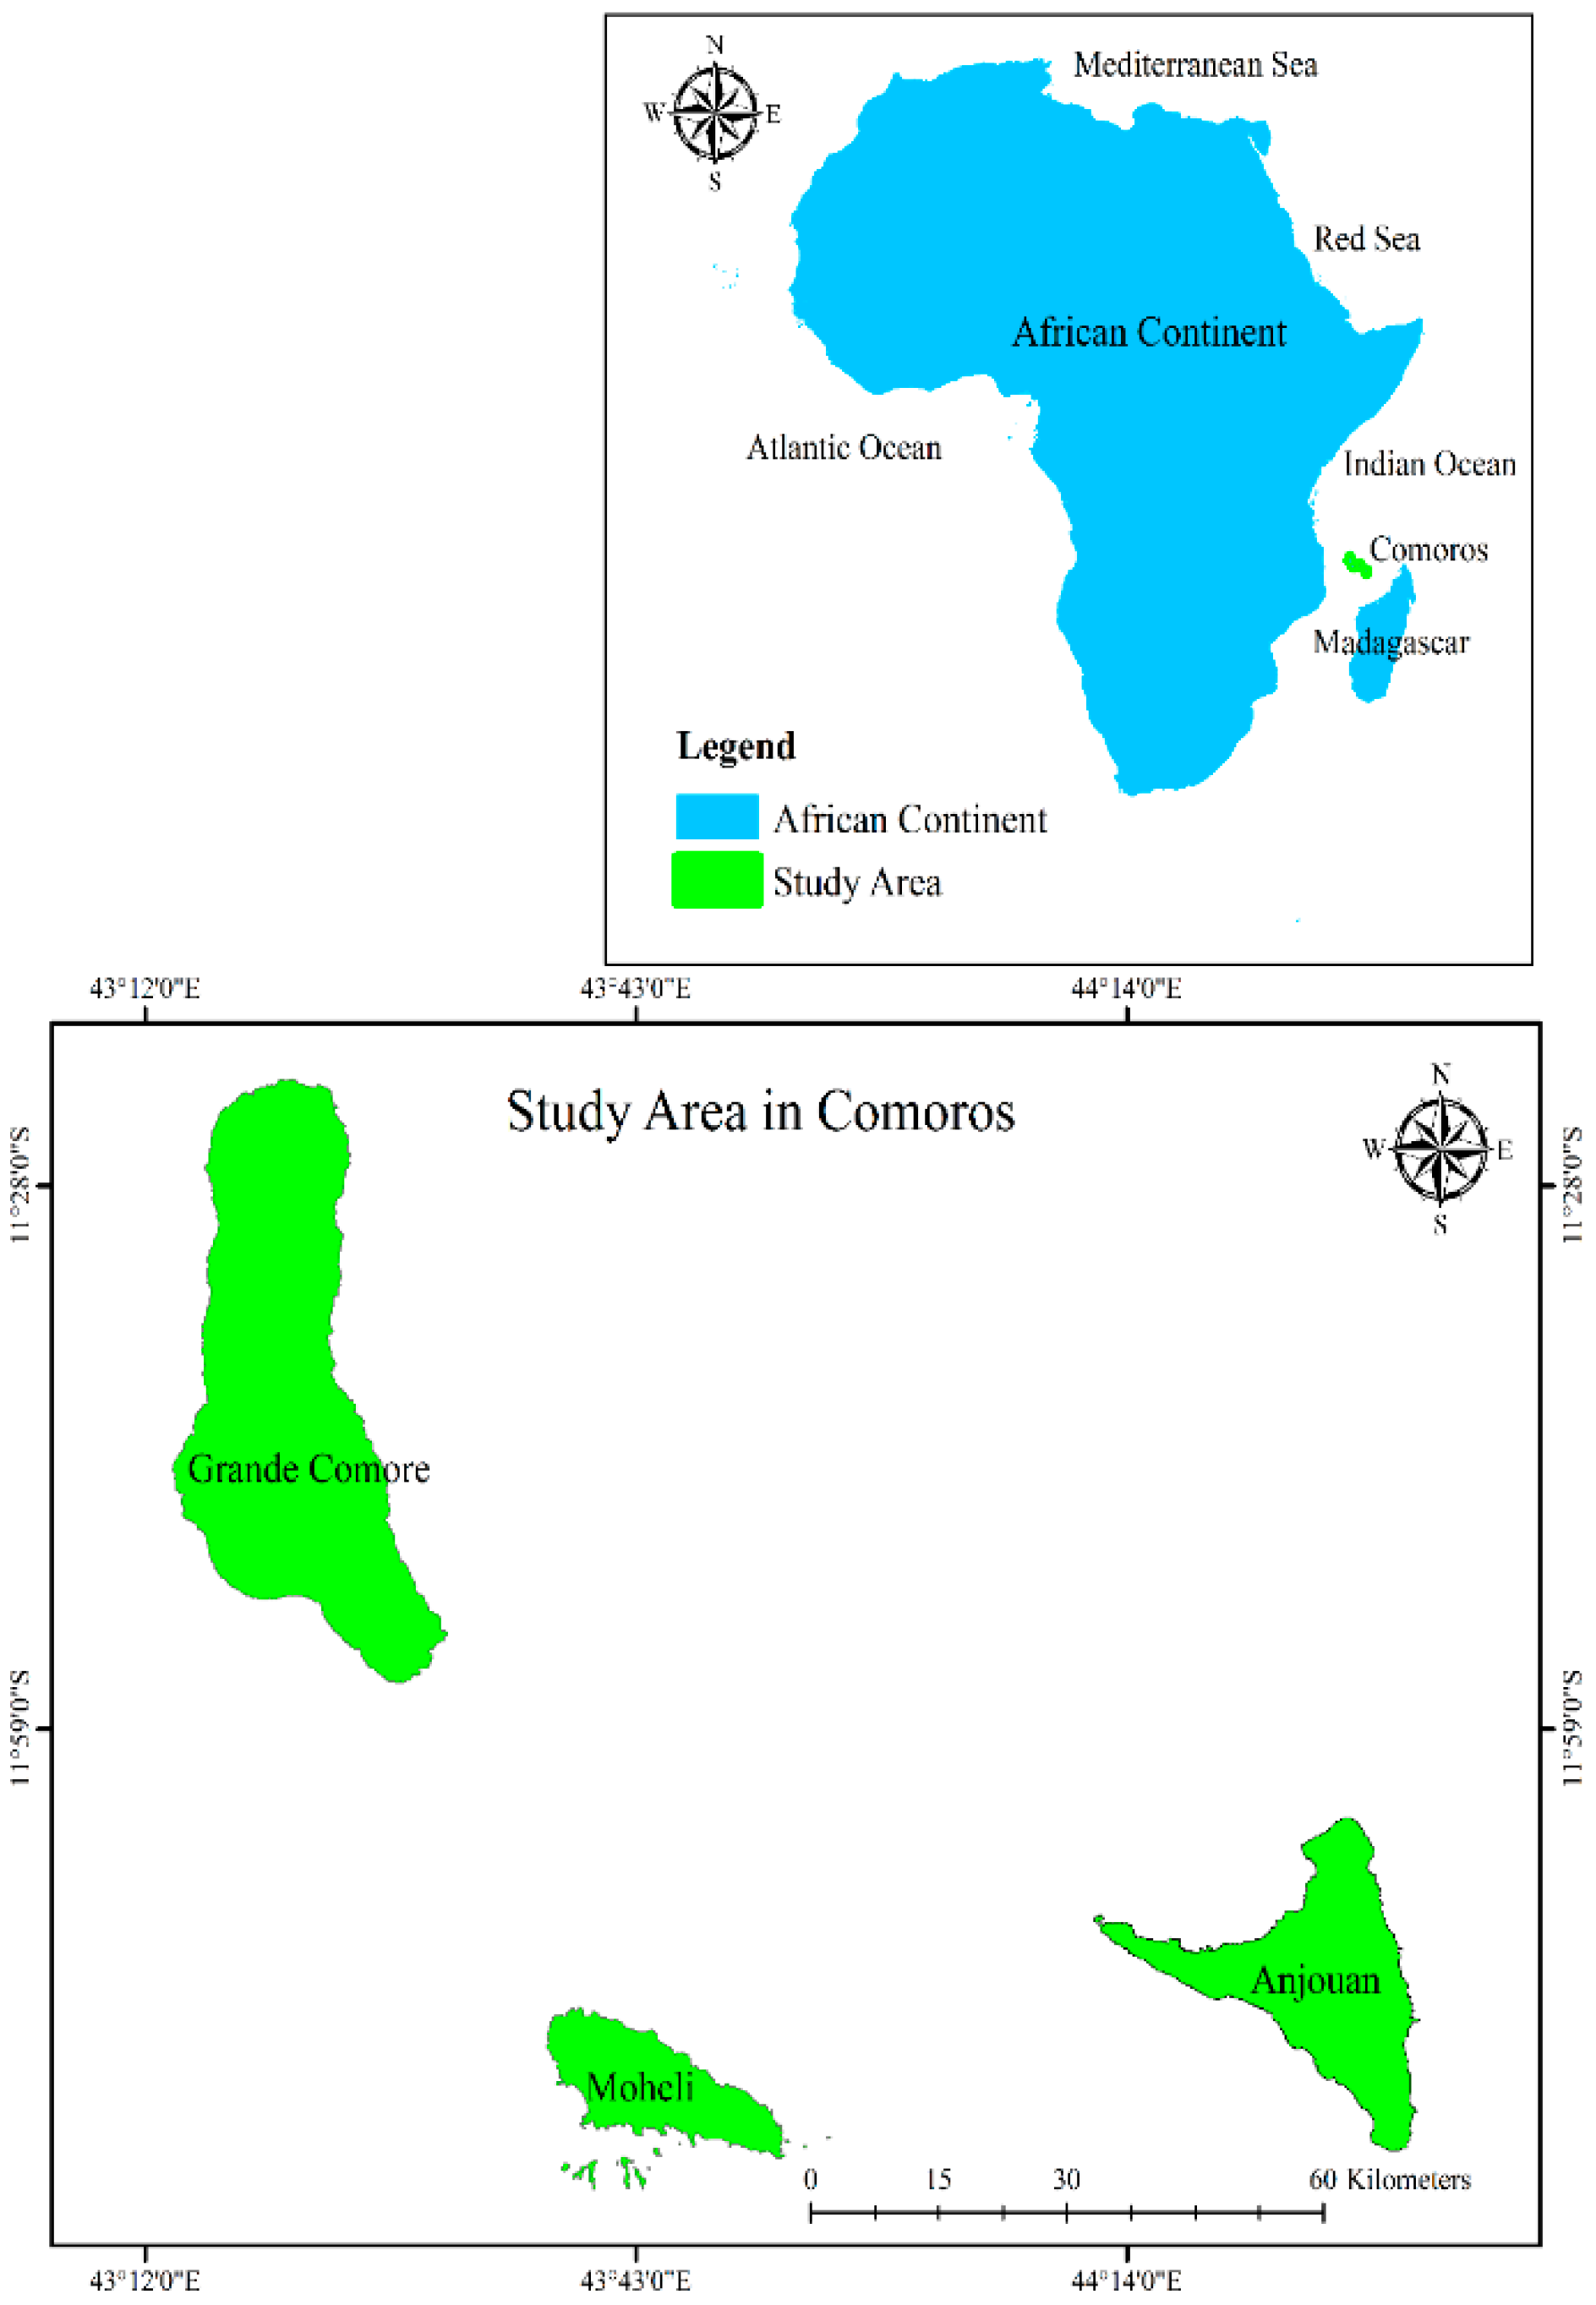
Comoros is an archipelago country, made up of four islands: Grande Comore (1146 km2), Anjouan (424 km2), Moheli (290 km2), and Mayotte (374 km2), located at the entry of the Mozambique Channel in the western Indian Ocean between the east coast of Africa and the northern cost of Madagascar. One island, known as Mayotte, remained under French administration and was claimed by Comoros in 1975 with the support of the United Nations. Therefore, our study was confined to the three islands within the administrative boundaries of Comoros Figure 1. The country is among the poorest in the world, with a Gross Domestic Product (GDP) of US $835 per capita, and an estimated population of 870,000 inhabitants (https://data.worldbank.org) in 2013.
Agriculture is the main sector of the Comorian economy, contributing nearly 90% of the national export earnings [22]. Export income, however, is reliant on the three main cash crops: vanilla, cloves, and ylang-ylang. Thus, despite the importance of agriculture, food demand in Comoros is not met by domestic production, forcing the country to rely on imported foods to satisfy the national needs, and Comoros has become a net food importer, an import-dependent nation. This food import reliance is expected to increase along with population growth, unless domestic food production improves.
2.2. Phosphorus Flows from Imported and Exported Commodities in Comoros
2.2.1. Virtual Phosphorus Flows from Imported Commodities in Comoros
Here, virtual phosphorus, as the term implies, refers to simply the amount of mineral phosphorus fertilizer used in other countries to produce the commodities (food and livestock) that are imported into Comoros. The idea is taken from the similar terms ‘virtual water’ [23] and ‘virtual nitrogen’ [24], and has been used by many scientists [25,26,27]. We calculated the virtual phosphorus based only on imported commodities. The virtual phosphorus attributable to exported commodities was considered to be equal to zero in this study, because all the Comorian export commodities are produced without mineral phosphorus fertilizer application, and data on uptake phosphorus from natural sources were difficult to obtain. Hence, we estimated the virtual phosphorus for Comoros using the following equation [27]:
where Qi,j corresponds to the volume of the product that was imported into Comoros (where i = 1, 2, …, n are the different types of commodities from countries j, 1, 2, …, m that the commodities came from); corresponds to the coefficient of conversion from raw commodities into processed products; yield corresponds to the yield of product i in country j; and fertilizer corresponds to the amount of mineral phosphorus fertilizer applied to crop i to produce food j.
2.2.2. Embedded Phosphorus Flows through Imported and Exported Commodities in Comoros
Here, embedded phosphorus refers to the sum of the amount of phosphorus contained (physically embedded) in each imported crop and livestock product. We calculated it for the main Comorian imported and exported commodities, by multiplying the amount of the commodity traded by the corresponding phosphorus contained in each commodity (See Supplentary Materials, Table S1).
2.3. SSR in Food Production for the Selected Items and Scenarios Anlaysis
The Food and Agricultural Organization of the United Nations (FAO) defines SSR as the percentage of food consumed that is produced domestically [28]. It is estimated in either calories or in volume of food produced. It can also be expressed as the monetary value of the food, or measured in terms of specific commodities. It is an index that indicates how effectively domestic food consumption is covered by domestic production. We selected items that are main staple foods annually imported into the country (See Supplentary Materials, From Tables S2 to S11). The SSR (based on food production) in the selected food items in Comoros was calculated using the following equation [29]:
where Pi is production, Ii is imports, Ei is exports, and ∆Ri is stocks (or change in reserves) for a country i. ∆Ri was considered to be equal to zero in this study, because there were no stocks; the total annual food produced domestically was consumed domestically.
We calculated the mineral phosphorus requirement in 2030 under two scenarios: scenario 1, if the country wants to reach 90% of the SSR, and scenario 2, if it wants to achieve 100% of the SSR.
2.4. Projections of Food Demand
The main determinants of food demand are population size, price, income, and population preferences. Demographic changes also have an impact on food demand. Food demand is estimated on the basis of assumptions about the base year demand, economic growth, population, and expenditure elasticity. We first analyzed the current and future (in 2030) food demand in Comoros.
The population of Comoros is estimated to have been 813,000 inhabitants in 2018 (UN estimation), with an annual population growth of 2.4% (see Supplentary Materials, Figure S1). Comoros has a rapidly increasing population and is expected to reach 1,062,000 in 2030 (UN estimation: https://population.un.org). It is among the fastest growing populations in Africa, with a population density of 309.3 per square kilometer and about 71% of the Comorian population resides in the rural areas and relies on agriculture for livelihood [30,31].
On the economic side, the Comorian economy has not performed well during the last few decades. However, economic growth has improved recently (see Supplentary Materials, Figure S2). Annual real GDP growth rose from −5.4% in 1991 to 2.8% in 2018, and is expected to reach 7.5% in 2030. The food commodities demand was projected for the year 2030 based on 2013 prices (see Supplentary Materials, Tables S12 and S13), and we assume that the economy and population of Comoros will grow at the rate of 7.5% and 1,062,000 inhabitants in 2030, respectively. Hence, the projected food-item demands were calculated using the following equation:
where Dt is the household demand for commodities in year t; d0 is the per capita demand for the commodities in the base year; y is the growth in per capita income; e is the expenditure elasticity of demand for the commodity; and Nt is the projected population in year t.
Finally, we quantified the phosphorus that will be required for future food production in Comoros, using the conversion factor [32], which estimates the phosphorus required to produce one kilogram of food crops or one kilogram of livestock products:
For food crops, we calculated the phosphorus using the following equation:
For animal products, we calculated the phosphorus using the following equation:
2.5. Data Collection and Sources
Because statistical data in Comoros are hard to get, we mainly collected our data from various national and international sources, such as the International Monetary Fund (IMF: statically appendix, (1997); (2004); (2006); (2009)), the Central bank of Comoros (BCC: annual reports, trade statistics data, (from 2005 to 2013), (FAOSTAT: from 1991 to 2013)), and the existing literature (see Supplementary Data and Materials).
2.6. Uncertainty Analysis
It is important to note that there is no doubt that our findings contain some uncertainties because our data were taken from multiple sources and were incomplete. First, some uncertainties are associated with the origin of the data. For example, our data were from several different institutions, and sometimes data varied from one institution to another, even in the same time period, so we had to adjust and reconcile the differences. Finally, it is likely that food aid is not reported to the database, although Comoros always gets some form of food aid, from Japan (rice) and Saudi Arabia (red meat), which could increase the volume of imported foods. Nevertheless, these uncertainties represent a small part of the phosphorus requirements in Comoros. Therefore, our data can be used credibly.
3. Results and Discussion
3.1. Phosphorus Flows through Food Trade in Comoros in 1991 and 2013
3.1.1. Embedded Phosphorus Flows through Food Trade in 1991 and 2013
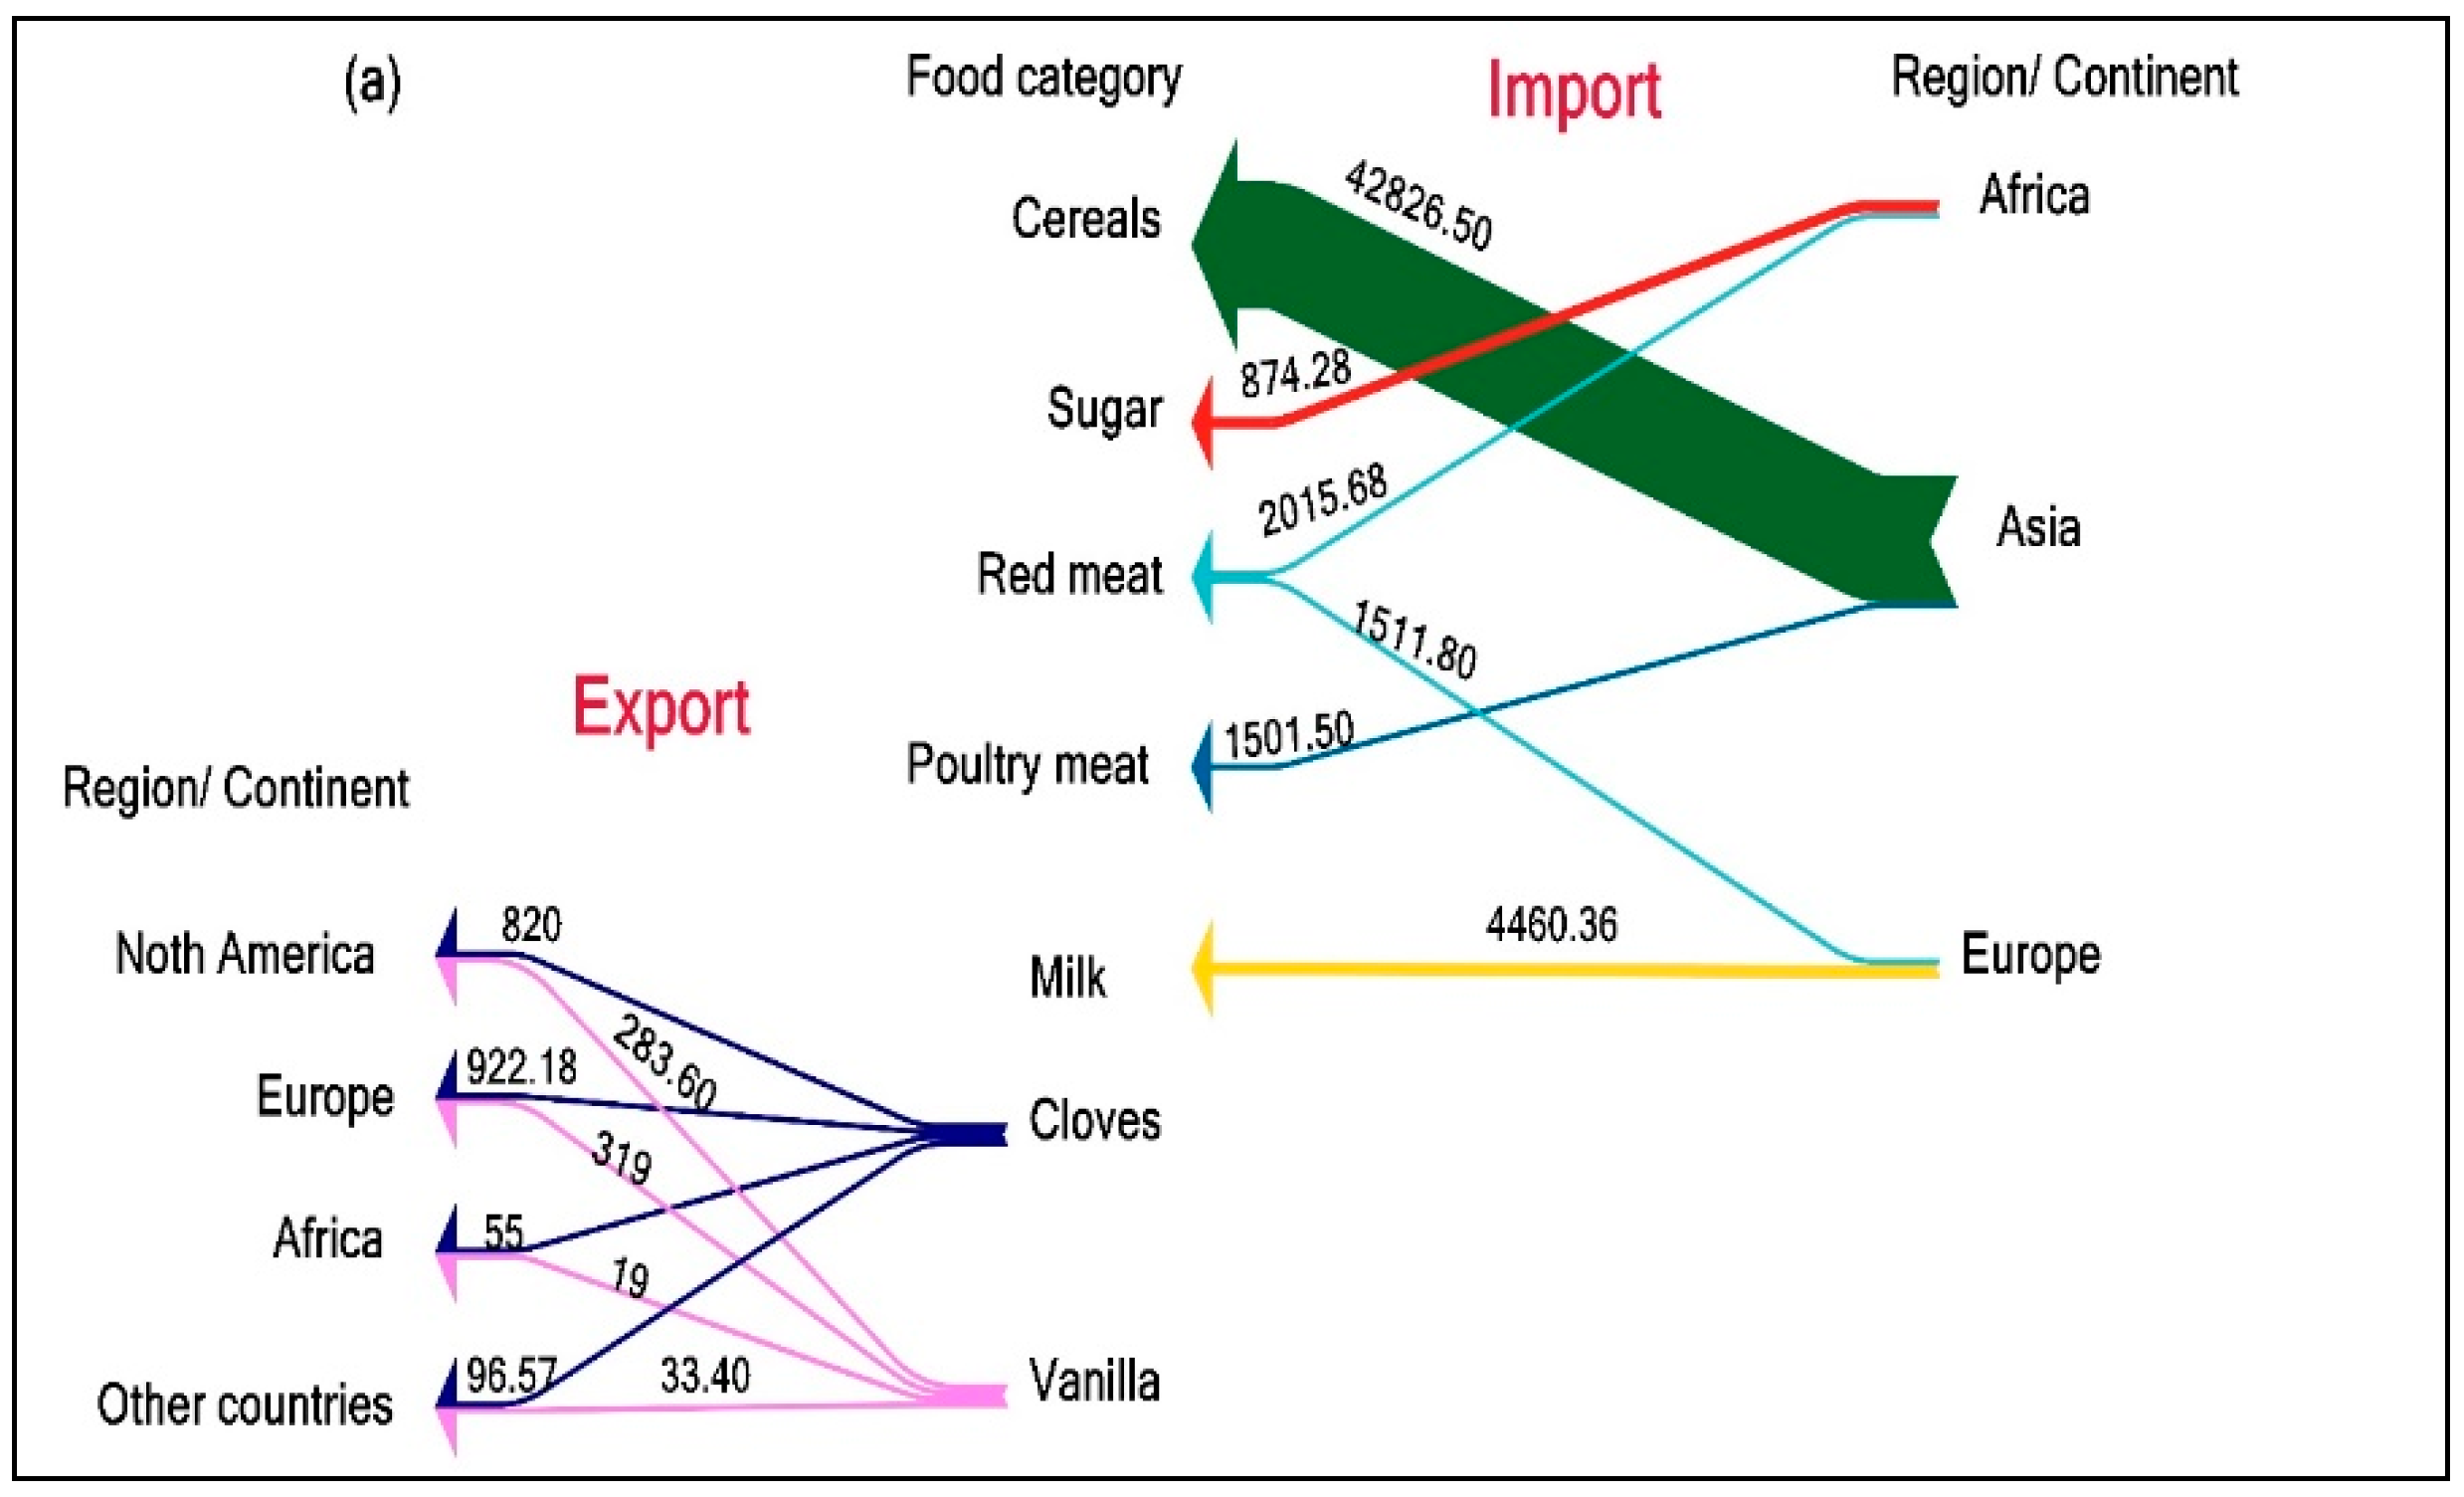
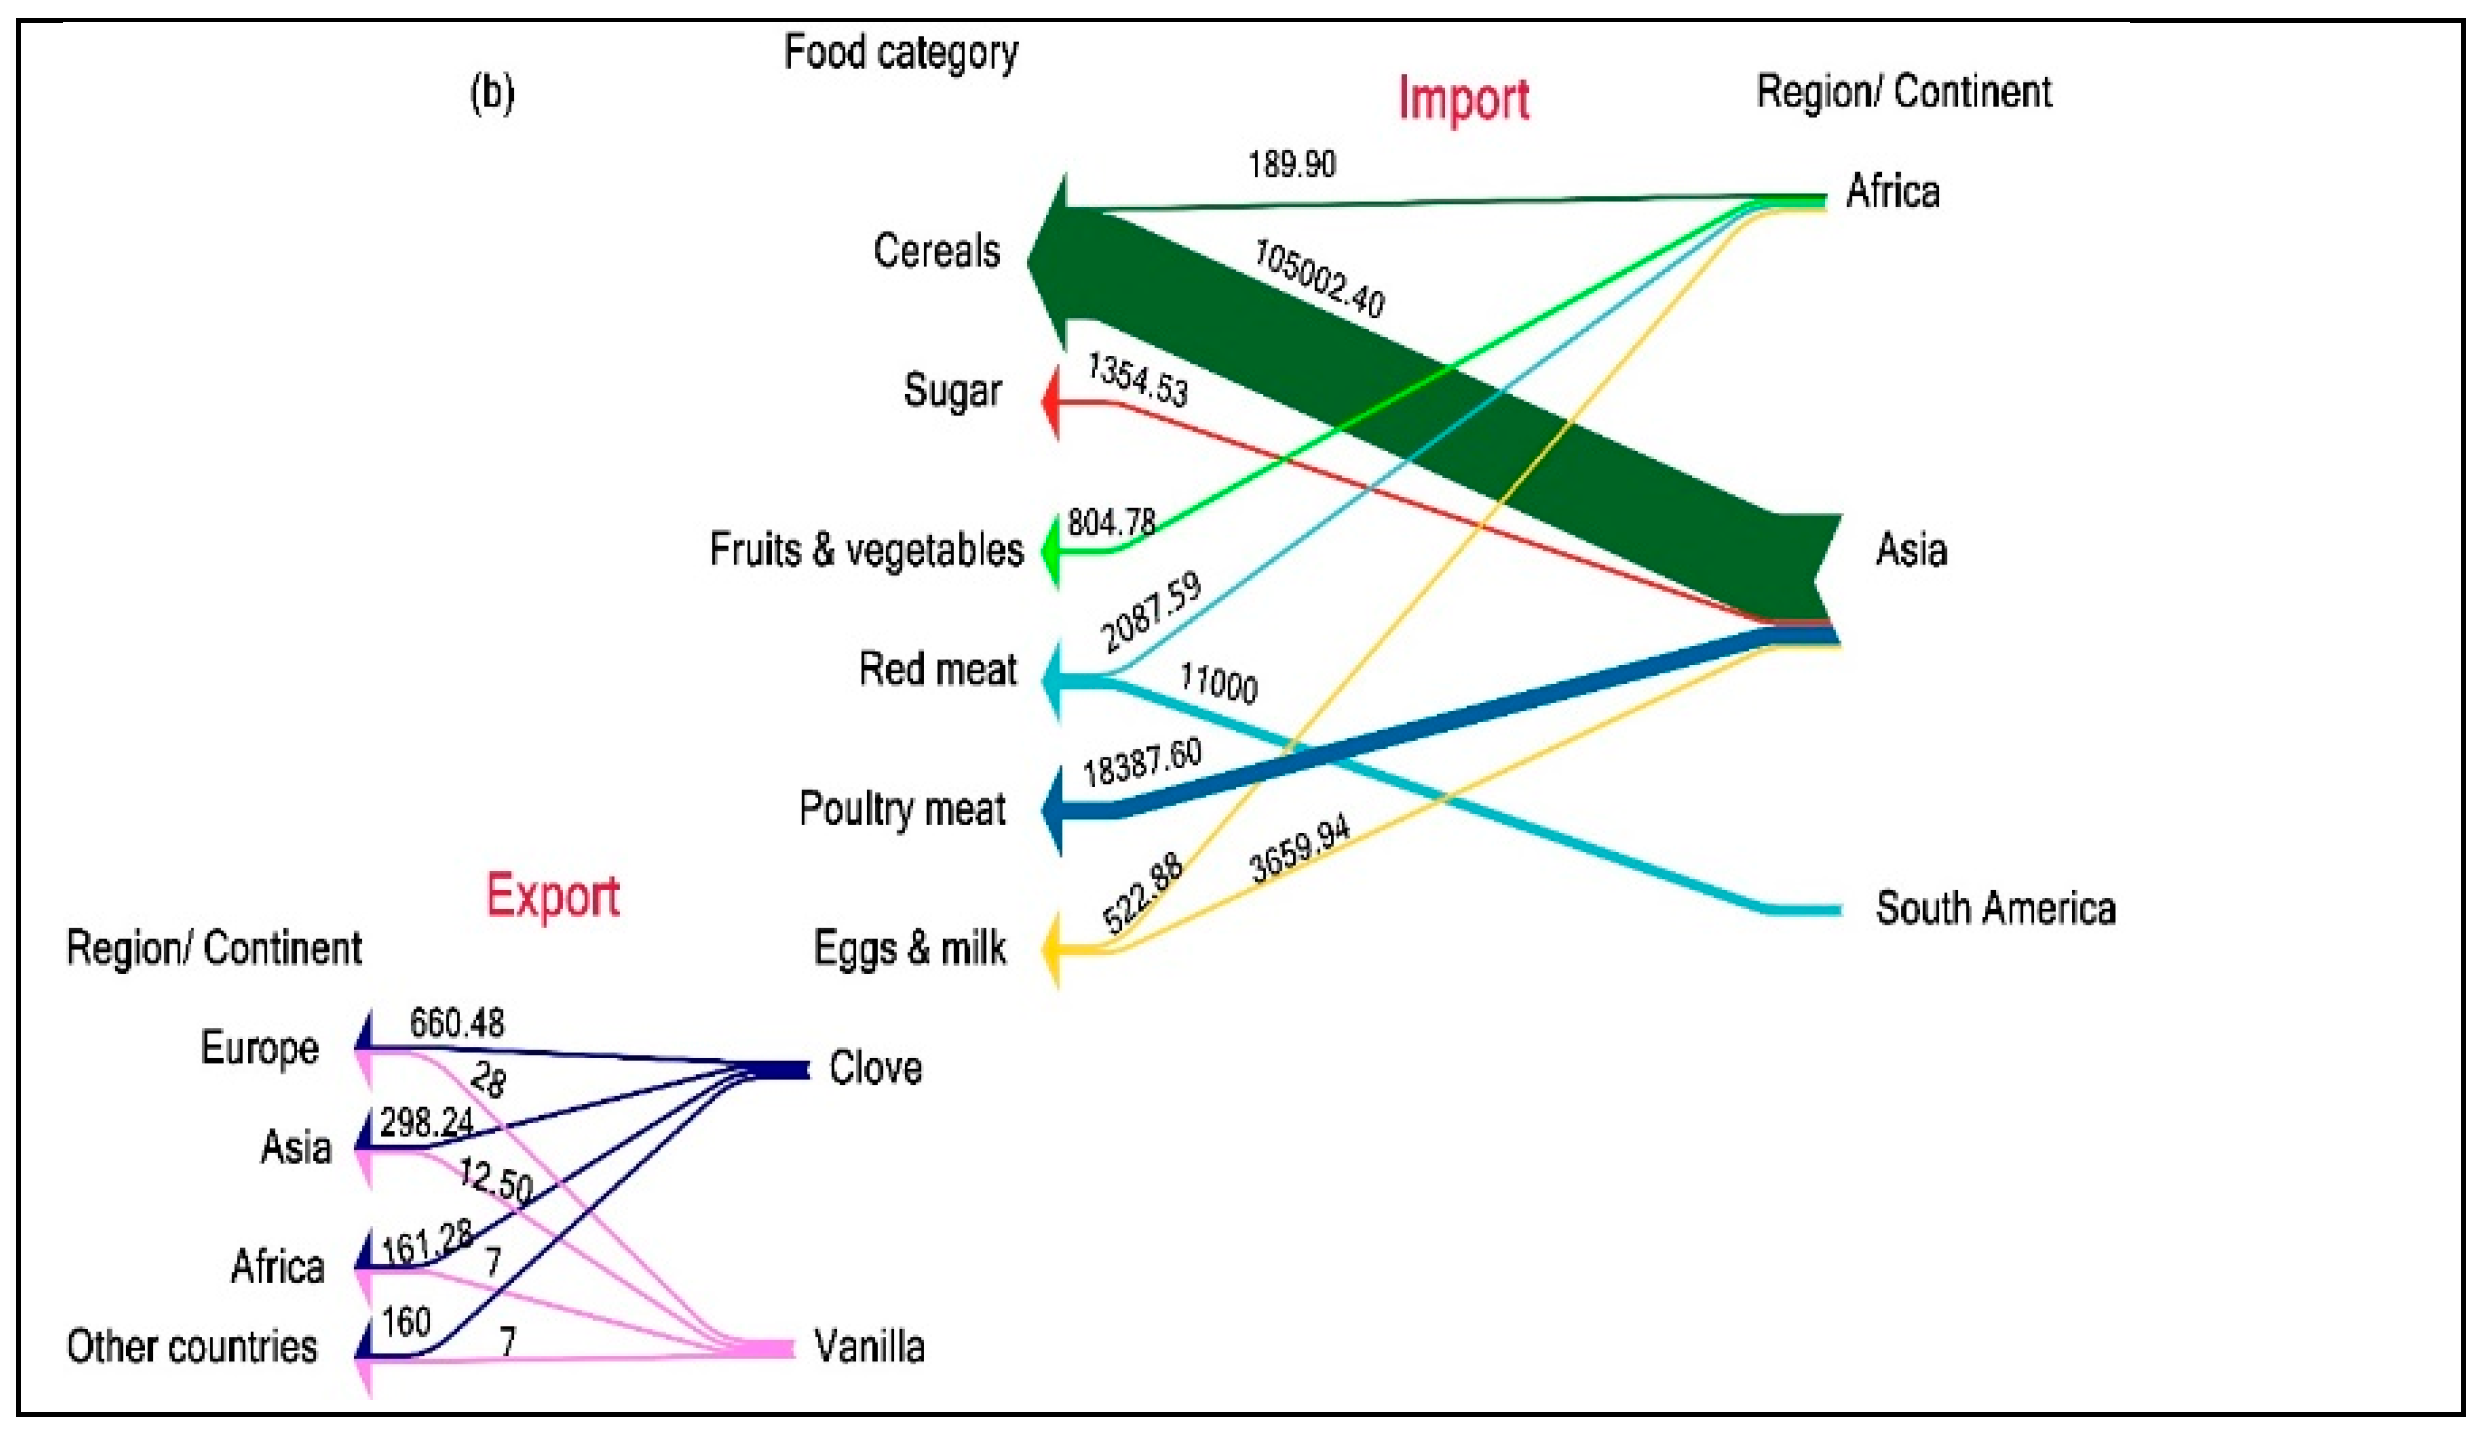
Embedded phosphorus varies according to the physical amount of phosphorus contained in a specific imported food [27]. As can bee seen in Figure 2, the main imported foods in Comoros in 1991 were cereals, sugar, red meat, poultry meat, and milk, whereas in 2013, one more type of imported food (fruits and vegetables) was added. In contrast to food imports, the main exported commodities remained the same (cloves and vanilla) in 1991 and 2013. The total phosphorus embedded through imported food in Comoros in 1991 was dominated by cereals (80.51%), followed by milk (8.38%), red meat (6.63%), poultry meat (2.82%), and sugar (1.64%). In 2013, cereals also dominated the total embedded phosphorus, at 73.55%, followed by poultry meat (12.85%), red meat (9.15%), eggs and milk (2.92%), sugar (0.94%), and fruits and vegetables (0.56%). The larger volume of embedded phosphorus in food imports was dominated by cereals because of a higher demand for rice and wheat flour. Domestic rice production has considerably decreased and almost ceased entirely, making the country a net rice importer nation.
As for food sources, in 1991, Asia became the top importer, with 42,826.50 kg and 1501.50 kg of embedded phosphorus from cereals and poultry meat, respectively. According to Figure 2, we can see that the second food importer continent for Comoros was Europe, with 4460.36 kg of embedded phosphorus from eggs and milk, and 1511.80 kg from red meat. The last food importer continent for Comoros was Africa (mainly Madagascar, Mauritius, Tanzania, and South Africa), with 2015.68 kg of embedded phosphorus from red meat and 874.28 kg of embedded phosphorus from sugar.
Compared to 1991, Asia retained the same position in 2013 as the top food importer for Comoros, with 105,192.40 kg, 18,387.60 kg, 3659.94 kg, and 1354.53 kg of embedded phosphorus from cereals, poultry meat, eggs and milk, and sugar, respectively. South America (Brazil) replaced Europe as the second food importer in Comoros in 2013, with 11,000 kg of embedded phosphorus from red meat, and Africa kept its position as the last food importer in Comoros, with 2087.59 kg, 804.88 kg, 522.88 kg, and 189.90 kg of embedded phosphorus from red meat, fruits and vegetables, eggs and milk, and cereals, respectively.
On the other hand, only two commodities dominated the embedded phosphorus through exported products in Comoros in 1991 and 2013: cloves and vanilla. The main embedded phosphorus receivers from Comoros’ exported commodities in 1991 were North America (820 kg from cloves and 283.60 kg from vanilla), Europe (922.18 kg from cloves and 319 kg from vanilla), Africa (55 kg from cloves and 19 kg from vanilla), and other countries (96.57 kg from cloves and 33.40 kg from vanilla). By 2013, North America had been replaced by Asia (298.24 kg from cloves and 12.50 kg from vanilla), although Europe (660.48 kg from cloves and 28 kg from vanilla) moved into first place as the highest importer, while Africa (161.28 kg from cloves and 7 kg from vanilla) and other countries (160 kg from cloves and 7 kg from vanilla), retained their third and fourth positions, respectively, in the list of receiving regions of embedded phosphorus from Comoros’s exported products.
3.1.2. Virtual Phosphorus Flows through Food Trade in 1991 and 2013
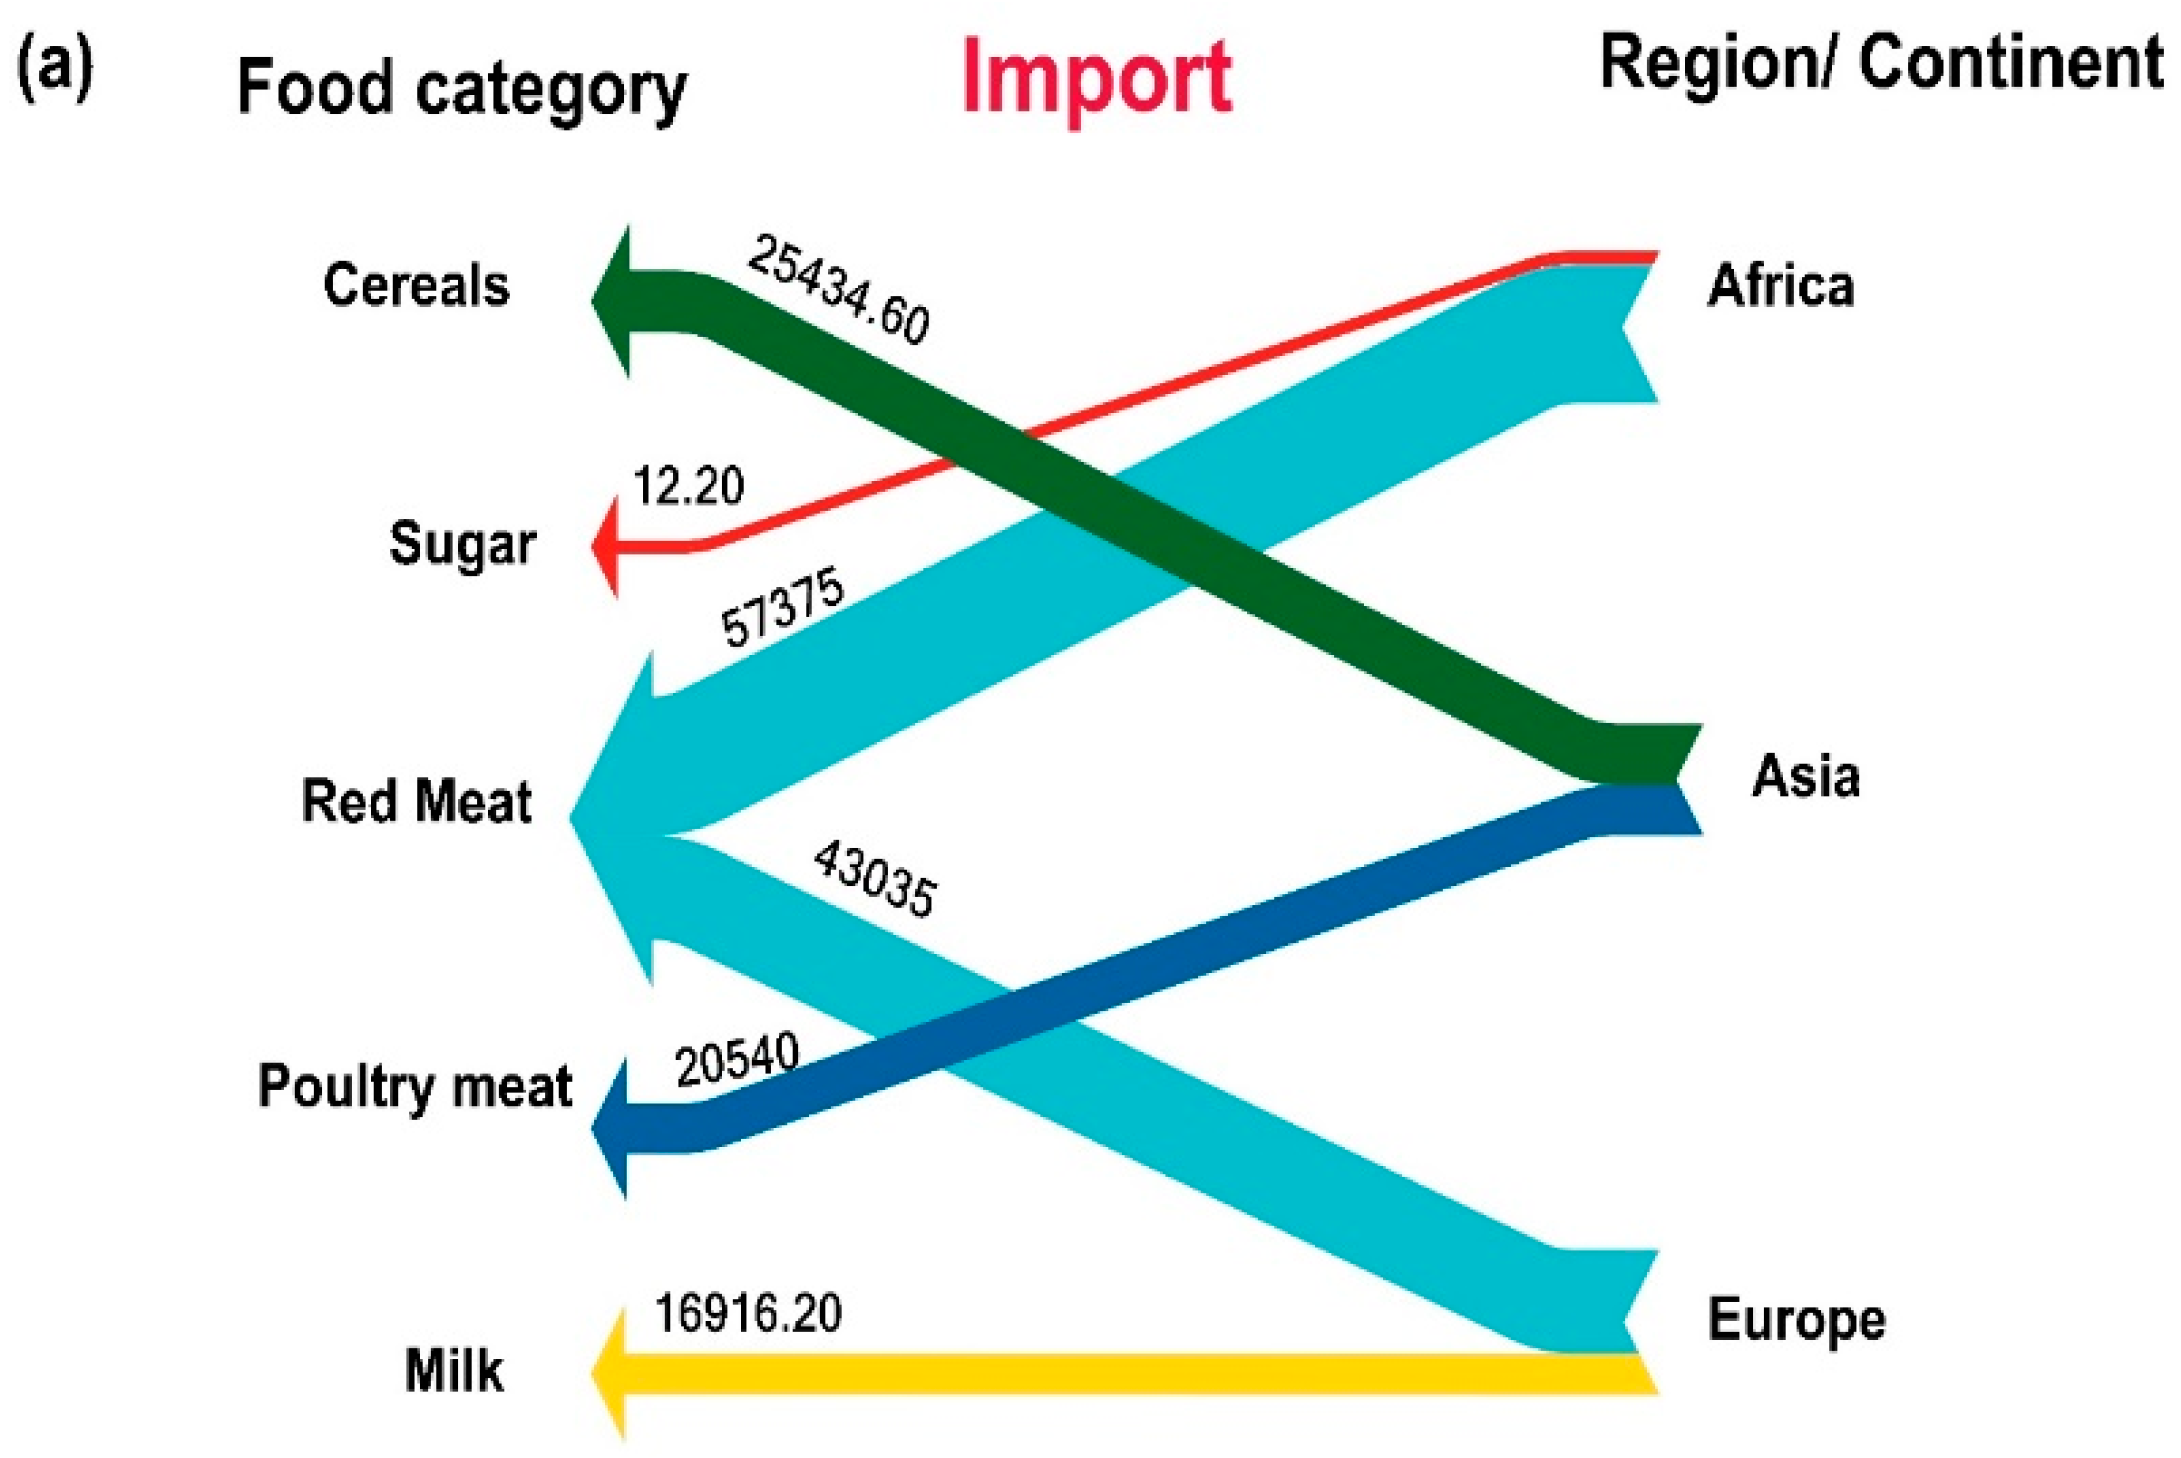
Figure 3 displays the details of virtual phosphorus flow through imported foods in Comoros in 1991 and 2013. In both years, Comoros had only three agricultural export commodities (vanilla, cloves, and ylang-ylang oil) and farmers did not use mineral phosphorus fertilizer during cultivation. Overall, red meat dominated imports, with 100,410 kg of virtual phosphorus flow, followed by cereals (25,434.60 kg), poultry meat (20,540 kg), and eggs and milk (16,916.20 kg), in 1991. Similarly, in 2013, red meat was highest in virtual phosphorus (372,539.70 kg), followed by cereals (86,552.13 kg), poultry meat (20,540 kg), and eggs and milk (8916.01 kg) for imported food. This result could be expected, because red meat (cattle, sheep, and goats) usually requires many years of feed input before being consumed as meat [33], resulting in high virtual phosphorus.
The virtual phosphorus from imported food crops in Comoros in 1991 originated from several major regions and continents: from the rest of Africa (5.738720 kg for red meat and sugar combined), from Asia (45,974.60 kg for poultry meat and cereals combined), and from Europe (59,951.20 kg for red meat and milk combined). By 2013, though, red meat virtual phosphorus (313,099.20 kg) had shifted from Europe to South America (Brazil); Africa had lost its position as sugar exporter, but retained its position with a slight increase (59,440.50 kg for red meat production), with a new type of commodity: fruits and vegetables (7.15 kg of virtual phosphorus). Asia had retained its position, with 86,551 kg from cereal production, 25,135.57 kg from poultry meat production, and 22.41 kg from sugar production. Europe had retained its position in the virtual phosphorus flow through milk, although with a significant decrease from 16,916.20 kg in 1991 to 316.91 kg in 2013. The milk produced in Comoros is destined for local consumption, but cannot meet the total demand of domestic consumption, necessitating the import of various forms of processed milk (from liquid to powdered milk).
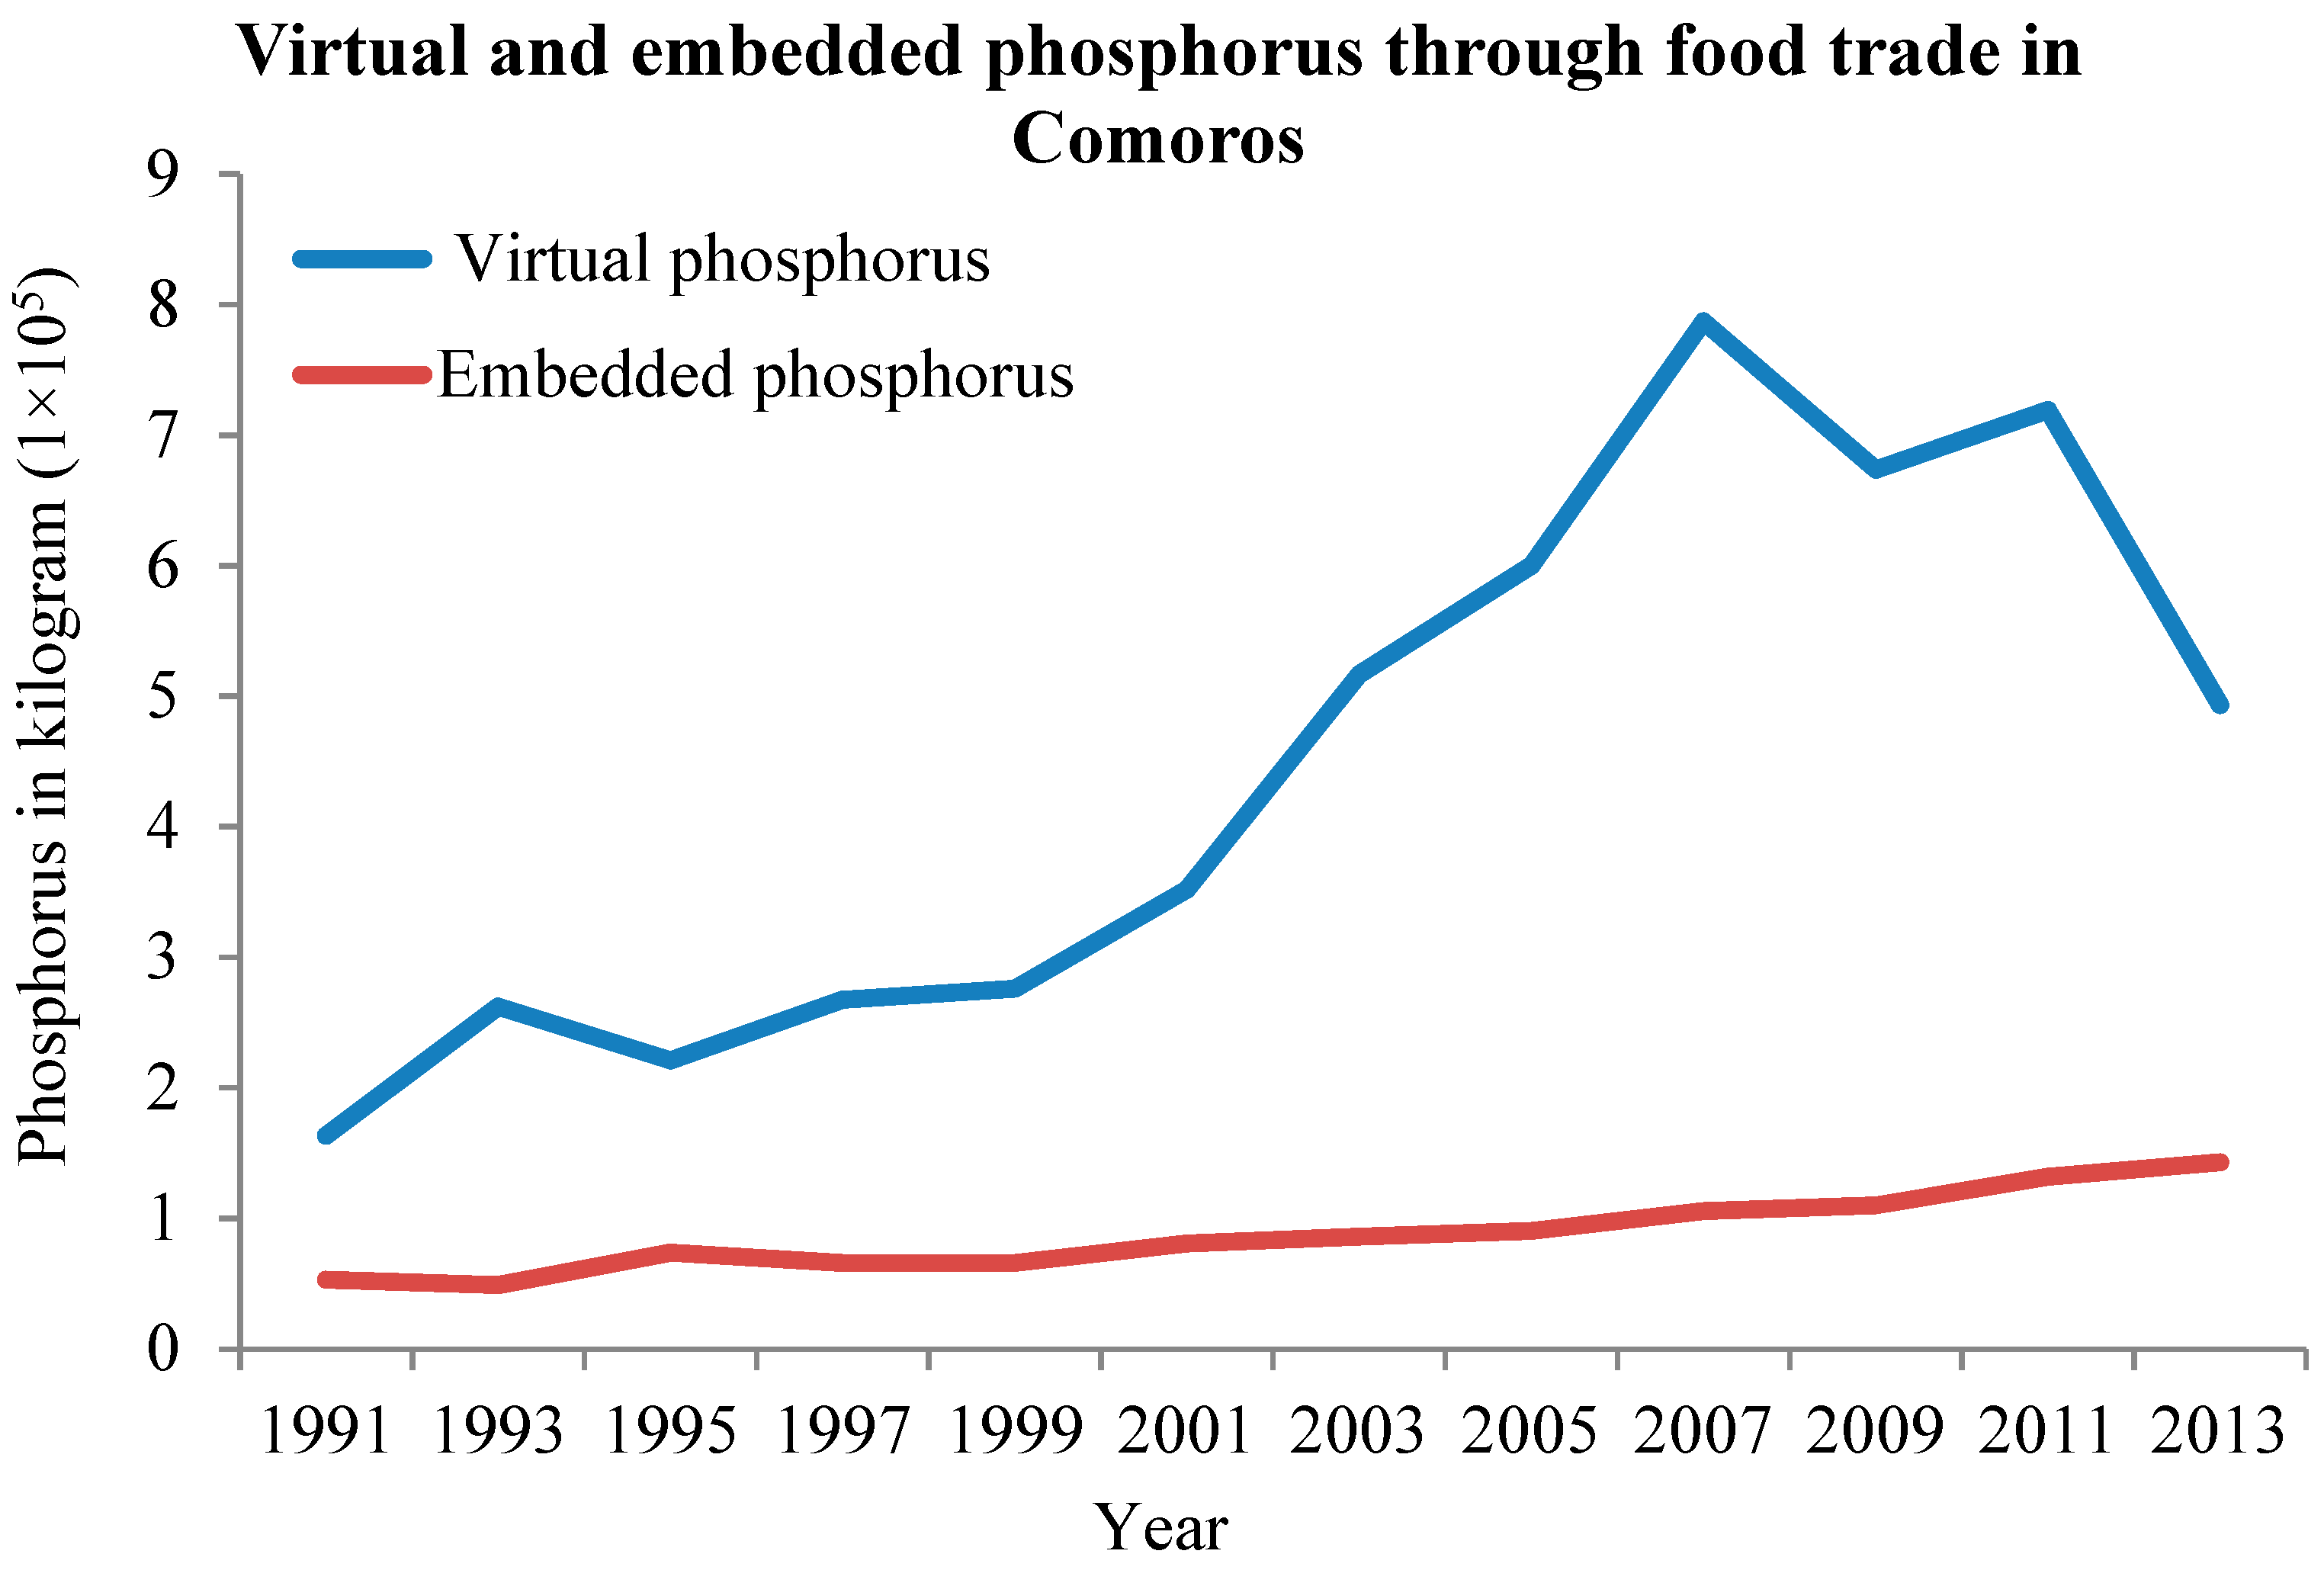
3.1.3. Comparison of Virtual Phosphorus and Embedded Phosphorus through the Food Trade in Comoros
Figure 4 compares the virtual phosphorus and the embedded phosphorus through the food trade in Comoros, from 1991 to 2013. There is clearly a large difference between the two, as the virtual phosphorus considers all the phosphorus applied during the production of the crops that were imported in Comoros, whereas the embedded phosphorus includes only the actual volume contained in the imported commodities. Moreover, the process of applying phosphorus to the soil for food production differs from one country to another. Some countries use mineral phosphorus fertilizer in a careless way, leading to environmental pollution; some consume very little or cannot afford it at all for agricultural purposes, leading to soil phosphorus deficiency. Both phosphorus rich consumer and poor consumer countries should implement policies, such as changing the diet (encourage the consumption of foods with less phosphorus requirements, like vegetables), and technics, such as maximizing the phosphorus recovery through recycling and reusing the livestock manure, waste water, household organic, and human waste. Poor phosphorus consumer countries could benefit more from maximizing the recycling and reusing. Consequently, virtual phosphorus can vary, depending on the origin of the imported commodities.
Figure 4 compares the virtual phosphorus through food trade in Comoros. In order to have a better assessment view about the virtual phosphorus requirements in Comoros for food production, we will compare our results on virtual phosphorus to other studies in other countries in the next paragraph.
3.1.4. Comparison of the Virtual Phosphorus in Comoros and Japan
We selected meat (see Supplentary Matrials, Figure S3) as the food item to compare between Comoros and Japan, for an obvious reason: animal-based meat requires a much larger amount of phosphorus than other food items. As can be seen in Table 1, Comoros required 0.28 kg per capita of virtual phosphorus in 1991 for meat production and 0.53 kg in 2013. These two amounts are far below the Japanese virtual phosphorus requirements for meat production (2.50 kg) [26]. The reason for the large difference is linked with not only the phosphorus consumption itself, but also with all the other criteria used during the calculation of virtual phosphorus in both studies.
3.2. Phosphorus Flows through Imported Fertilizer in Comoros
Comparison of Phosphorus Flows through Imported Fertilizer and through Food Trade in Comoros, 1991 to 2013
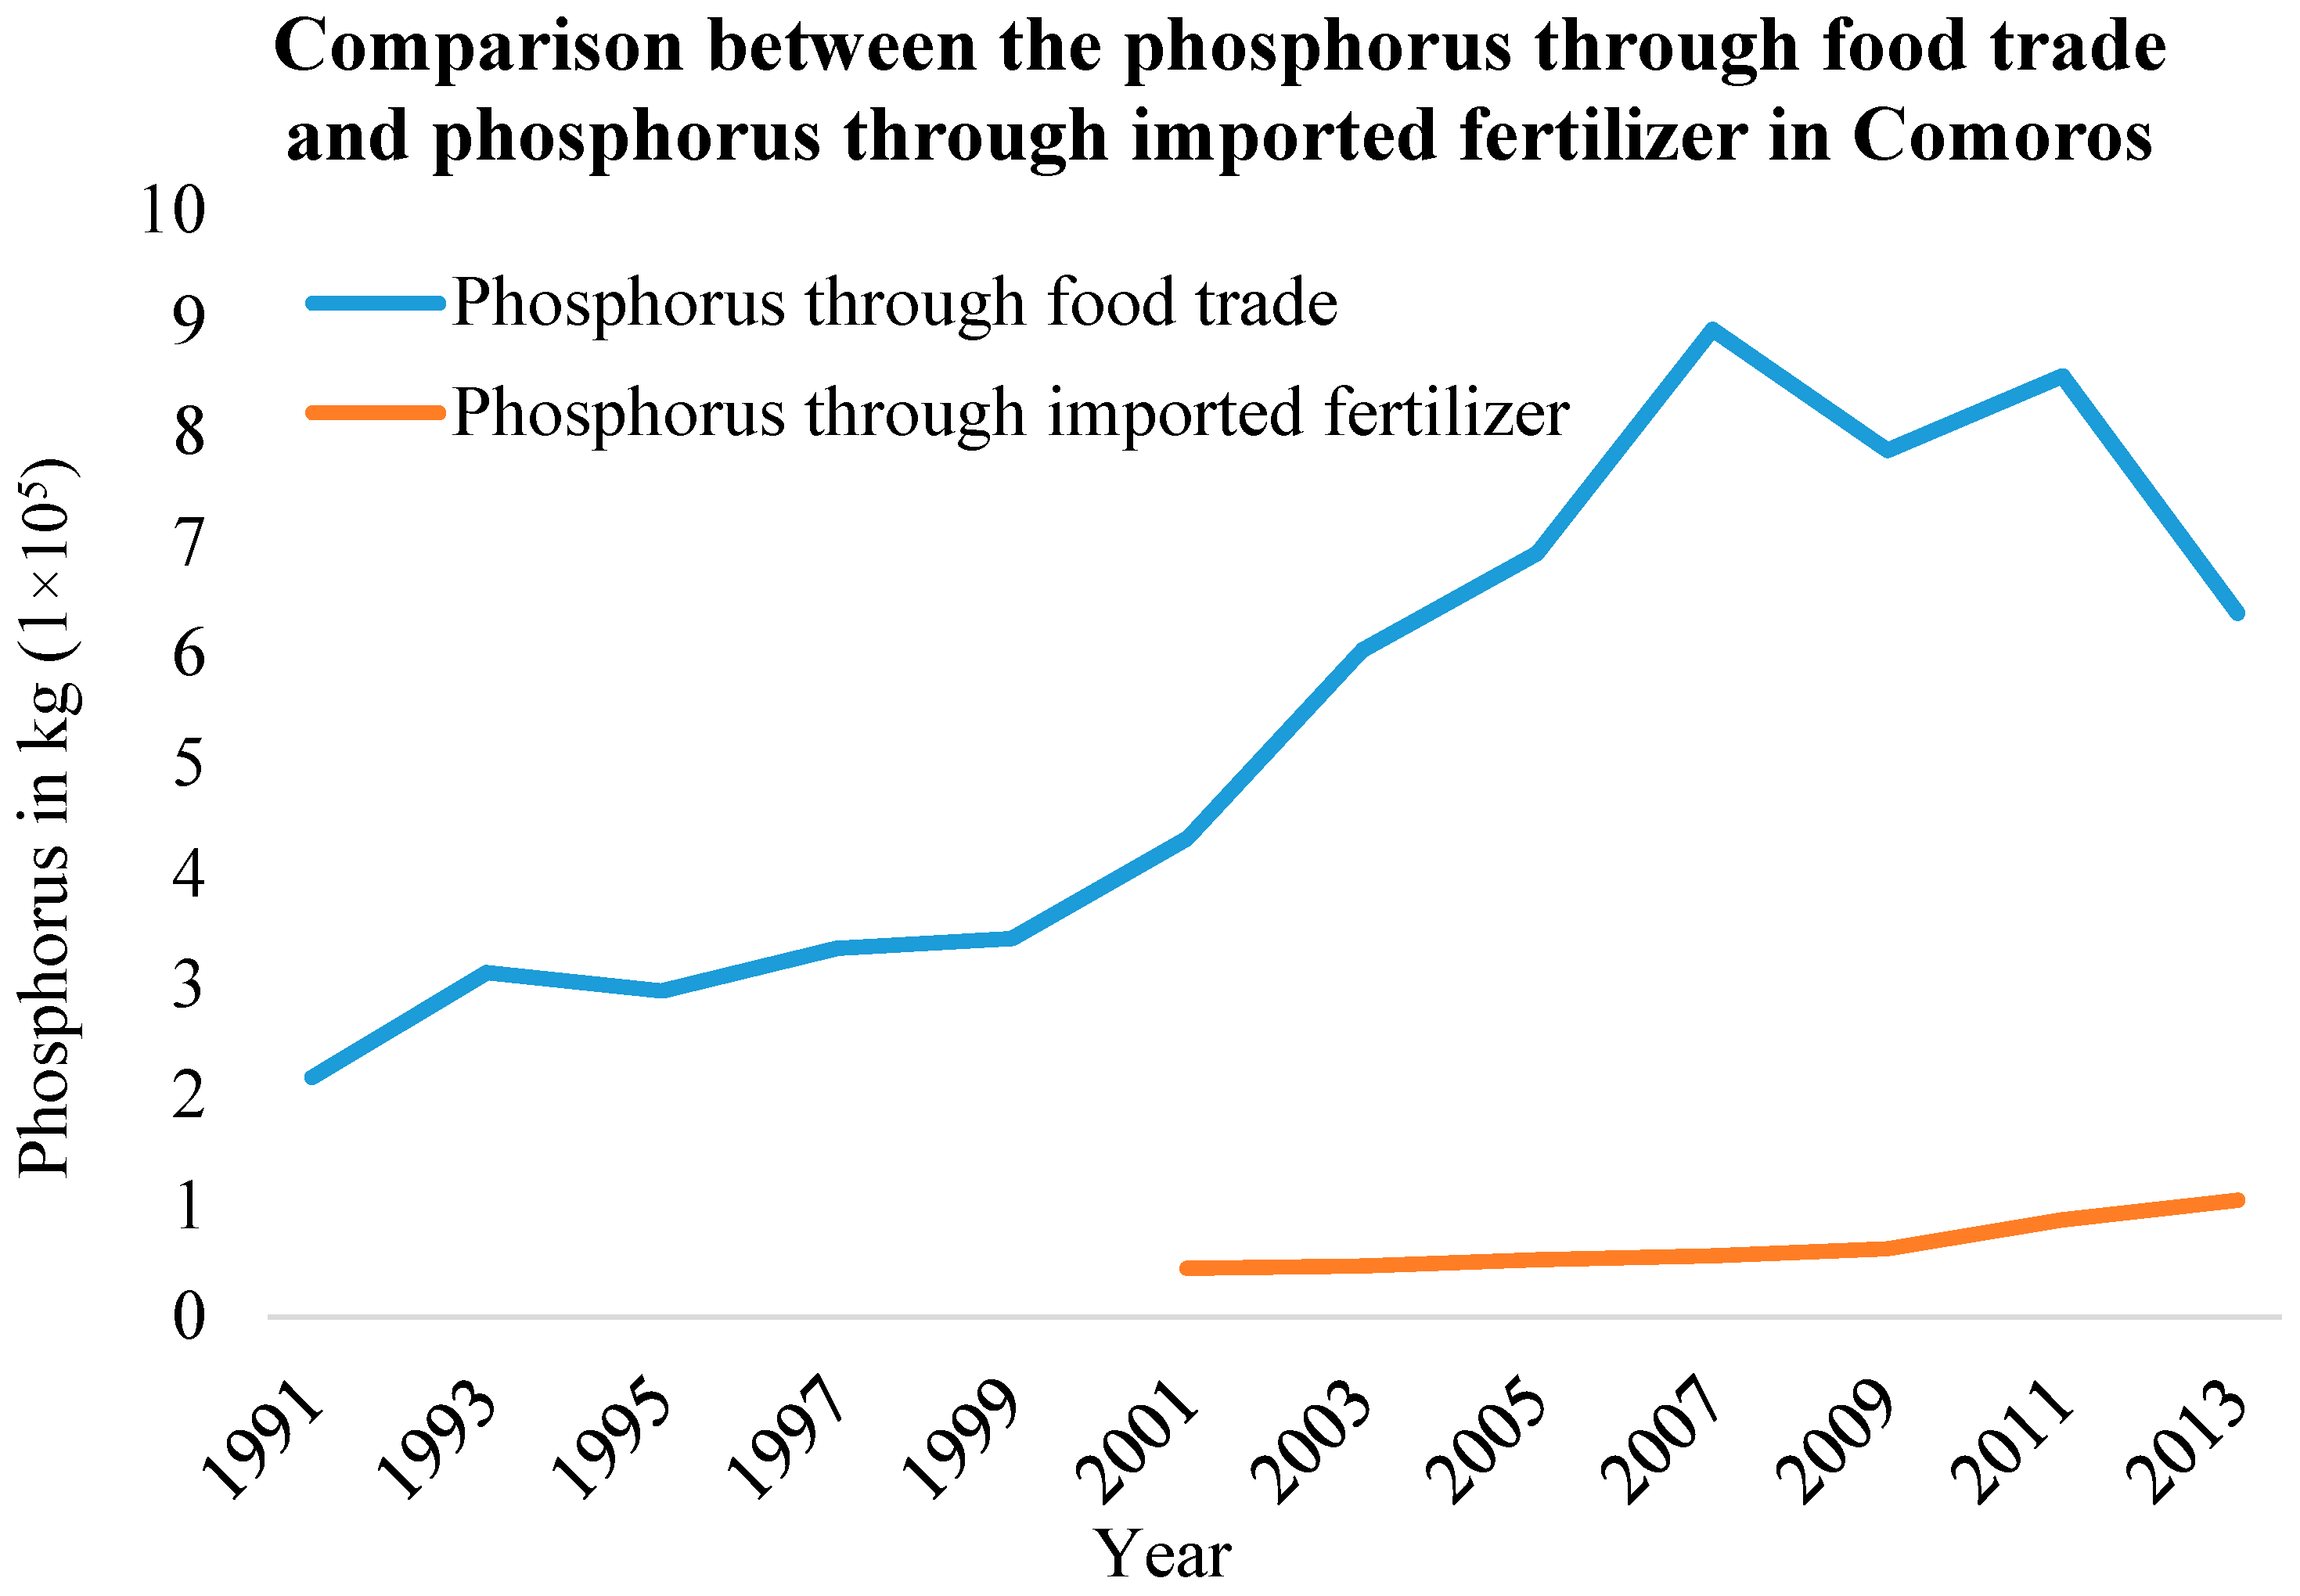
Figure 5 gives a clear comparison of the phosphorus flows through imported fertilizer and through food trade in Comoros, from 1991 to 2013. Phosphorus through food trade in Comoros is far higher than that from imported fertilizer, indicating that the country consumes more phosphorus through food trade than through imported fertilizer, and that the consumption of phosphorus fertilizer for agricultural purposes is lower. In addition, Comoros has not kept long-term historical data on phosphorus fertilizer consumption. What data are available indicate that the amount varied from 44 × 103 kg in 2000 to 1 × 10⁵ kg in 2013, making Comoros one of the most phosphorus-limited consumer countries. This is a very tiny amount compared to Japan (69 × 107 kg in 1980 and 2.53 × 10⁸ kg in 2012), France (17.75 × 10⁸ kg in 1980 and 2.53 × 10⁸ kg in 2012), and Germany (12.26 × 10⁸ kg in 1980 and 2.84 × 10⁸ kg in 2012) [34].
Figure 6 presents the relationship between the imported phosphorus through trade (embedded plus virtual plus imported fertilizer) and the population growth in Comoros. Comoros is ranked as 22nd in the world and the highest in Africa, in terms of population density [35]. It is clear that this fast growth of the Comorian population has had an impact on food consumption [36] and domestic food production. Moreover, there is also a growing demand for imported foods [37], and in turn, an increase in phosphorus.
3.3. Self-Sufficiency Ratio in Food Production for Selected Items in Comoros
Figure 7 clearly displays the annual average SSR of the selected items, from 1991 to 2013. The average SSR decreased gradually, from 46.27% in 1991 to 29.70% in 2013, meaning that the capacity of domestic production to cover domestic consumption fell by 16.57% during 1991–2013. The population grew rapidly, while the domestic food production did not improve, remaining at its traditional level, and the only way to satisfy the needs of the population was to import more food.
As for specific commodities, eggs and maize presented the highest SSR, followed by dairy products. Dry onions started at a higher SSR, but suddenly decreased considerably from 2002 to 2013. The SSR for rice gradually decreased from 9.78% in 1991 to 1.06% in 2011. According to [16], rice production in Comoros occupied almost 13,335 ha, but this value refers to hill rice, and since no fertilizers—either mineral or organic—were applied to this soil, the annual rice yield has decreased, along with the fertility of the soil. Hence, even though rice is a basic staple food of the Comorian diet, rice production continues to decline, and has now almost ceased. At this point, the country relies totally on rice imports to satisfy the local needs; rice imports per capita per year increased from 66.34 kg in 1991 to 69.87 in 2013.
The situation is no better when we look at animal food products. The SSR of poultry meat decreased from 24% in 1991 to 7% in 2013, even though the volume of domestic poultry production more than doubled from 202 Mt in 1991 to 576 Mt in 2013. That translates to an annual increase of 17 Mt, which is a small amount when compared with the amount of imported poultry meat (332.27 Mt) over the same period.
The SSR from red meat decreased from 40% in 1991 to 20% in 2013. The domestic red meat production in Comoros represented 30% of the total volume of red meat consumed in 1991, while the imported production represented 70%. In 2013, the percentage of imported red meat was 83%, and the domestic percentage was 17%—a significant increase in the imported volume and a considerable decrease in the domestic volume. The revenues of the livestock farming represented 8% of GDP [38]. Livestock production in Comoros is carried out predominantly by small family farmers, and all livestock products are locally consumed. Although accurate figures for the livestock population are not easy to obtain, in the year 2000, it was estimated that there were 49,200 heads of cattle, 220,020 poultry, and 190,000 heads of ruminants (goats and sheep). Farmers use natural grasses for feeding the animals. During the dry season, the animals are not well fed, and farmers often use garbage waste, such as banana and cassava peelings, pigeon-pea leaves, kitchen waste, and banana stems, as feed for animals [16,39]. This poor nutrition makes the animals susceptible to disease. In the period 2003–2006, half of the bovine population in Grand Comore (the largest island in Comoros) was devastated by a bovine virus, although samples taken during that period did not reveal its presence in Moheli or Anjouan [40].
Sugar, garlic, and wheat flour scored 0% each, in the SSR index in Comoros, from 1991 to 2013, because of a total absence of domestic production for the three items. Historically, during the colonization era, Comoros was an active producer of sugar and sugar cane, but when that era ended, it totally ceased and the country now relies on imported sugar for its domestic consumption. As for garlic and wheat flour, there is no evidence of any domestic production of either of these foods, either now or in the past, and the large import amounts are increasing over time and currently absorb much of the country’s foreign reserves [38].
3.3.1. Comparison between SSR in Comoros and Other Countries
We chose rice as the food item to compare with other countries because nearly 95% of the rice that is annually consumed in Comoros is imported. As can be seen in Table 2, the Comorian SSR is far smaller than that of other peer African countries, having decreased gradually from 9.78% in 1991 to 1.06% in 2011. Japan, a developed country, has the highest SSR for rice, 95%. A study conducted for “Assessing the evolving fragility of the global food system”, found that Comoros is among the top countries suffering from a rice production deficit; its SSR varied from 45% in 1992–1996 to 64% in 2005–2009 [29].
3.3.2. Enhancement of the SSR in Comoros
This study found that the average SSR for the selected items is far below 100%; it varied from 46.27% in 1991 to 29.70% in 2013. This decrease, of course, was due to a certain number of drivers; such as the deficiency of phosphorus fertilizer, reduction of the output of the domestic agricultural production, the outdated agrarian practices (including little or no P fertilizer application for crop production), and unsuitable agriculture.
Firstly, Comoros agricultural agencies should design a robust agricultural policy that focuses on importing enough fertilizer for farmers. Comoros needs to use its diplomatic relations and set up trade negation with the phosphorus-rich producer countries, like Morocco. Not only is Morocco not far away from Comoros (for the benefit of reduction the transport shipment fees and reduction of time for the container to arrive), but also, Morocco controls around 85% of the reserve of the world’s share of minable phosphorus (Estimation data from the International Fertilizer Development Center (IFDC) reserves for products). Comorian Agricultural agencies should make sure that farmers are able to access the phosphorus fertilizer easily, either in affordable ways or in subsidy ways.
Secondly, improvement of the Phosphorus Use Efficiency (PUE) in the food supply chain is crucial to the enhancement of the SSR in Comoros. Not only recycling and reusing phosphorus in the animal and crop production system, but also recycling the wastes from the transportation, food processing, and household sectors, are key approaches to enhance the PUE.
3.4. Projections of Food Demand and Mineral Phosphorus Requirements in 2030 under Scenarios 1 and 2
3.4.1. Projections of Food Demand
The projected annual domestic demands for selected food items in 2030 were calculated under the following assumptions: economic growth 7.5% and population 1,062,000 inhabitants (see Supplentary Materials, Figures S1 and S2).
Cereal demand will increase from 70,681 Mt in 2013 to 141,298 Mt in 2030, while livestock product demand will increase from 36,360.25 Mt in 2013 to 114,534 Mt in 2030. Vegetable and sugar demands will rise from 2493 Mt to 5383 Mt, and from 6157 to 14,709 Mt, in 2013 and 2030, respectively.
In regard to specific commodities, demand per capita will be 96.64 kg, 9.20 kg, and 27.19 kg for rice, maize, and wheat flour, in 2030, respectively. Red meat, poultry meat, and eggs and milk demand per capita will also attain 35.76 kg, 14.30 kg, and 57.78 kg, in 2030, respectively. Vegetables per capita demand and sugar will reach 5.06 kg, and 13.85 kg, in 2030, respectively. It is clear that, as can be seen in Table 3, food demand has been driven mainly by growth in both population and income.
3.4.2. Projections of Phosphorus Requirements
As can be seen in Table 3, the total phosphorus requirements, in 2030, in Comoros are expected to rise considerably, along with the increase in the food demands of cereals, livestock, sugar, and vegetables. Nevertheless, an appropriate amount of phosphorus could enable the country to domestically produce the entire volume of food crops and livestock products that is anticipated to be imported from trade. The total phosphorus requirements in Comoros, in 2030, will be livestock (87.42%), followed by cereals (12.27%), vegetables (0.20%), and sugar (0.08%). Our results support the conclusion from “the role of diet in phosphorus demand” study [32]: that the population increases expected in both developing and developed countries will be accompanied by increases in the demand for phosphorus.
Table 4 describes the food group (cereals, livestock, vegetables, and sugar), food items (wheat flour, maize, rice, red meat, poultry meat, eggs, milk, onions, dry, garlic, and sugar), and conversion factor (kg P/kg of crop) used to calculate the P requirement according to the projected domestic food demand in 2030. The phosphorus requirement per capita for future food demand is estimated to be 3.14 kg in 2030. This amount of phosphorus could allow Comorian farmers to domestically produce the entire volume of food crops and livestock products that would otherwise be imported.
3.4.3. Mineral Phosphorus Requirements in 2030 under Scenarios 1 and 2
Table 5 estimates the phosphorus requirements in 2030 under different scenarios. It can be seen that the country will require 3,003,435.09 kg and 3,337,150.10 kg of mineral phosphorus, in 2030, to be able to attain 90% and 100% of the SSR in the selected items, respectively. Considering the economic cost, 90% of the SSR should be a practical goal for food security, as it meets the FAO’s low risk standard recommendation.
3.4.4. Comparison of Possible Total Phosphorus and Phosphorus for Meat Production Requirements in Comoros and Globally
This study has found that the total phosphorus requirements in Comoros varied from 0.27 kg per capita in 1991 to 1.00 kg per capita 2013, and will reach 3.14 kg per capita in 2030, whereas the values found by [32] comparing 1961 and 2007 were 1.04 kg and 1.05 kg, respectively. On the other hand, the total per capita global phosphorus requirement will increase from 2.45 kg in 2007 to 3.46 kg in 2030 to 3.67 in 2050. This result closely matches the one found from “The role of diet in phosphorus demand” study [32].
As for meat production, the per capita phosphorus requirement in Comoros varied from 0.26 in 1991 to 0.70 in 2013 and will attain 2.46 in 2030. By contrast, the total per capita global phosphorus requirement will rise from 1.32 kg/capita to 1.55 to 1.72 in 2007, 2030, and 2050, respectively. This rapid increase is primarily attributable to the rise in income. In 2030, it is likely that the economic growth of Comoros will attain 7.5%, because of the discovery of huge undeveloped hydrocarbon reserves in the economic exclusive zone of the country [43]. With the combination of population and income growth, people are likely to change their dietary habits and consume a more meat-based diet, a pattern that is especially prevalent in developing countries. This fact has been argued by many scientific studies [44,45,46,47,48,49,50].
4. Conclusions
In this study, we estimated the phosphorus fertilizer requirements for the future food demand in Comoros. First, we calculated the phosphorus flows through food trade in Comoros, over 22 years, from 1991 to 2013. Secondly, our SSR results show that Comoros has an average SSR far below 100% and is not able to easily afford adequate food imports, or to distribute them equally, ensuring food security for all. Finally, the study found that approximately 3,337,150.10 kg of phosphorus fertilizer will be required by Comoros in 2030, to boost the domestic food production and considerably diminish the food imports. For a country like Comoros, where the domestic agricultural sector is struggling to provide enough food for its population, the efficient application of these amounts of phosphorus could help reduce the burden of the food import bill and minimize the food-import dependency by allowing farmers to improve their food productivity, which in turn will increase their livelihoods and ensure an adequate daily diet. This study is the first to quantify the phosphorus that will be required for Comoros to achieve these long-term goals. These precise and accurate estimates of phosphorus requirements could be used in the Accelerated Growth and Sustainable Development Strategy (SCA2D-2030) plan adopted by the Comorian government. It is important that Comoros considers ways to obtain the amount of phosphorus it needs, to ensure food self-reliance for its future population.
The agricultural sector in most food-deficient countries significantly contributes to the food consumption. However, with little or no P fertilizer application, the agricultural output stagnates, and domestic food production becomes less and less able to satisfy the population’s needs. Consequently, most food-deficient countries become food import-dependent nations, and are likely to experience an imbalance in food trade. To counteract this trend, appropriate agricultural policies in food-deficient countries can play a crucial role in boosting economic development through agricultural production, as has happened in developed countries. This goal will only be achieved, however, if agricultural policies, resource use, and agricultural production are well-developed and efficiently implemented, and food needs and production are regularly monitored. Phosphorus presents a unique opportunity for increasing crop yields and should be utilized, in order to reach the goal of zero hunger by 2030.
This study, based on empirical evidence, has shown that it would better for food-deficient countries to import enough phosphorus fertilizer to allow them to replenish their agricultural soil and produce sufficient foods to satisfy the national needs and achieve 100% SSR.
Supplementary Materials
The following are available online at https://www.mdpi.com/2071-1050/11/5/1345/s1, Figure S1: population trends and projections of Comoros, from 1991 to 2030, Figure S2: GDP of Comoros, from 1991 to 2013, Figure S3: World, Africa and Comorian red and poultry meat consumption per capita per year, Table S1: embedded phosphorus calculation, Table S2: rice imports, Table S3: wheat flour imports, Table S4: maize production and imports, Table S5: Onion, dry production and imports, Table S6:garlic imports, Table S7: red meat production and imports, Table S8: poultry meat production and imports, Table S9: eggs production and imports, Table S10: Dairy products production and imports, Table S11: sugar imports, Table S12: food items and expenditure elasticity for food demand in Comoros, Table S13: population and GDP projections in Comoros.
Author Contributions
Conceptualization, T.S.K., and S.C.; methodology, T.S.K.; software, I.I.; validation, T.S.K. and S.C., formal analysis, T.S.K.; investigation, T.S.K.; resources, Y.H. and S.C.; data curation, T.S.K.; writing—original draft preparation, T.S.K.; writing—review and editing, T.S.K. and S.X.; visualization, I.I. and Y.H.; supervision, S.C.; project administration, S.C.; funding acquisition, S.C.
Funding
This work was funded by National Key Research and Development Programe of China (Grant No. 2017YFC0506606), the National Natural Science Foundation of China for Young (31500391, 41801215), and the Chinese Academy of Sciences’ Third World Academy of Sciences (CAS-TWAS) president’s fellowship program for developing countries.
Conflicts of Interest
The authors declared that they have no conflict of interest.
References
- Smaling, E.M.A.; Stoorvogel, J.J. Assessment of Soil Nutrient Depletion in Sub-Saharan Africa: 1983–2000. 1990. Available online: https://library.wur.nl/WebQuery/wurpubs/fulltext/305176 (accessed on 11 February 2018).
- Smaling, E.M.A.; Nandwa, S.M.; Janssen, B.H. Soil Fertility in Africa Is a Stake. 1997. Available online: http://edepot.wur.nl/316011 (accessed on 7 January 2018).
- Sanchez, P.A.; Shepherd, K.D.; Soule, M.J.; Place, F.M.; Buresh, R.J.; Izac, A.N.; Mokwunye, A.U.; Kwesiga, F.R.; Ndiritu, C.G.; Woomer, P.L. Soil Fertility Replenishment in Africa: An investment in Natural Resource Capital; American Society of Agronomy and Soil Science Society of America: Madison, WI, USA, 2018; Replenishing Soil Fertility in Africa. SSSA Special Publication No. 51. 1997; Available online: http://soil5813.okstate.edu/Africa/Replenishing_soil_fertility_in_africa.pdf (accessed on 12 March 2018).
- Cordell, D.; Drangert, J.-O.; White, S. The story of phosphorus: Global food security and food for thought. Glob. Environ. Chang. 2008, 19, 292–305. [Google Scholar] [CrossRef]
- Van Der Velde, M.; Folberth, C.; Balkovic, J.; Ciais, P.; Fritz, S.; Janssens, I.A.; Obersteiner, M.; See, L.; Skalsky, R.; Xiong, W.; et al. African crop yield reductions due to increasingly unbalanced Nitrogen and Phosphorus consumption. Glob. Chang. Biol. 2014, 20, 1278–1288. [Google Scholar] [CrossRef] [PubMed] [Green Version]
- Andrew, J.M.; Singh, B.R.; Rao, I.M.; Sommer, R. Phosphorus Fertilization Management in Soils of Sub-Saharan Africa. 2016. Available online: https://illinoissoils.files.wordpress.com/2017/09/phosphorus-fertilization-and-management-in-soils-of-sub-saharan-africa.pdf (accessed on 13 January 2018).
- Liu, Y. The Human Intensified Global Phosphorus Flows and Environmental Impacts. Luxemburg, Austria, 2006. Available online: https://core.ac.uk/download/pdf/33899488.pdf (accessed on 12 November 2018).
- Smith, A.L.; Bindraban, P.S.; Schroder, J.J.; Conijin, J.G.; Van der Meer, H.G. Phosphorus in Agriculture: Global Resources, Trends and Developments. Report to the Steering Committee Technology Assessment of the Agriculture, Nature and Food Quality, The Netherlands. 2009. Available online: https://library.wur.nl/WebQuery/wurpubs/fulltext/12571 (accessed on 18 January 2019).
- Stewart, W.M.; Roberts, T.L. Food Security and the Role of Fertilizer in Supporting It. Procedia Eng. 2012, 46, 76–82. [Google Scholar] [CrossRef]
- Smil, V. Phosphorus in the Environment: Natural Flows and Human Interferences. Annu. Rev. Energy Environ. 2000, 25, 53–88. [Google Scholar] [CrossRef]
- FAO. Current World Fertilizer Trends and Outlook to 2015. 2011. Available online: http://www.fao.org/3/a-av252e.pdf (accessed on 6 December 2017).
- Vlek, P. The role of fertilizers in sustaining agriculture in sub-Saharan Africa. Fertil. Res. 1990, 26, 327–339. [Google Scholar] [CrossRef]
- African Development Bank Group (ADB). Union of the Comoros, Country Strategy Paper 2011–2015. 2011. Available online: https://www.afdb.org/fileadmin/uploads/afdb/Documents/Project-and-Operations/COMOROS%20CSP%202011-2015%20%28English%20Version%29%2014%2011%202011%20RR.pdf (accessed on 3 April 2018).
- Tango International. Comoros: Comprehensive Food Security and Vulnerability Analysis (CFSVA); United Nations World Food Programme: Rome, Italy, 2006; Available online: https://documents.wfp.org/stellent/groups/public/documents/ena/wfp085419.pdf (accessed on 9 July 2017).
- Commissioner General for Planning (CGP). Action Plan for Implementation of the 2010–2014 Poverty Reduction and Growth Strategy. International Monetary Fund, 2009. Available online: https://www.imf.org/external/pubs/ft/scr/2010/cr10191.pdf (accessed on 23 January 2017).
- World Bank. Comoros: Agricultural Sector Memorandum. 1998. Available online: http://documents.worldbank.org/curated/en/559711468246336466/pdf/multi-page.pdf (accessed on 20 September 2018).
- Earth Trends. Agriculture and Food—Comoros. 2003. Available online: https://www.rmportal.net/framelib/comoros-agriculture.pdf (accessed on 10 December 2017).
- Islamic Solidarity Fund for Development (ISFD) Report. The Union of the Comoros. Country Poverty Assessment. Islamic Solidarity Fund for Development: Jeddah, Soudi Arabia, 2011. Available online: https://isfd.isdb.org/EN/publications/Documents/Other%20Publications/Comoros%20Country%20Poverty%20Assessment%20Brief.pdf (accessed on 23 January 2017).
- FAO. Comoros and FAO: Partnering for Sustainable Agricultural Development and Food and Nutrition Security. 2015. Available online: http://www.fao.org/3/a-av252e.pdf (accessed on 7 November 2017).
- World Bank. Integrated Development and Competiveness Project (P64584). 2017. Available online: http://documents.worldbank.org/curated/en/556041518192665327/pdf/Concept-Project-Information-Document-Integrated-Safeguards-Data-Sheet.pdf (accessed on 15 November 2018).
- Rakotoarisoa, M.A.; Lafrate, M.; Paschali, M. Why Has Africa Become a Net Food Importer? Trade and Markets Division, Food and Agriculture Organization of the United Nations: Rome, Italy, 2011; Available online: http://www.fao.org/docrep/015/i2497e/i2497e00.pdf (accessed on 3 January 2017).
- World Bank. Country Partnership Strategy Paper for the Unions of Comoros. 2014. Available online: http://documents.worldbank.org/curated/en/934731468233344453/pdf/820540CAS0P131060Box385177B00OUO090.pdf (accessed on 30 October 2018).
- Allan, J.A. Overall perspectives on countries and regions. In Water in the Arab World: Perspectives and Prognoses; Rogers, P., Lydon, P., Eds.; Harvard University Press: Cambridge, MA, USA, 1994; Lydon 65–100. [Google Scholar]
- Cui, S.; Shi, Y.; Malik, A.; Lezen, M.; Gao, B.; Huang, W. A hybrid method for quantifying China’s nitrogen footprint during urbanization from 1990 to 2009. Environ. Int. 2016, 97, 138–144. [Google Scholar] [CrossRef] [PubMed]
- Matsubae, K.; Kajiama, J.; Hiraki, T.; Nagazaka, T. Virtual phosphorus ore requirement of Japanese economy. Chemosphere 2011, 84, 767–772. [Google Scholar] [CrossRef] [PubMed]
- Webeck, E.; Matsubae, K.; Nagazaka, T. Phosphorus requirements for the changing diets of China, India and Japan. Environ. Econ. Policy Stud. 2014, 17, 455–466. [Google Scholar] [CrossRef]
- Nesme, T. The surprisingly small but increasing role of international agricultural trade on the European Union dependence on mineral phosphorus fertilizer. Environ. Res. Lett. 2016, 11, 025003. [Google Scholar] [CrossRef]
- FAO. FAO Statistical Pocketbook 2012. 2012. Available online: http://www.fao.org/docrep/016/i2493e/i2493e.pdf (accessed on 12 December 2017).
- Puma, M.J.; Bose, S.; Young Chon, S.; Cook, B.I. Assessing the evolving fragility of the global food system. Environ. Res. Lett. 2015, 10, 024007. [Google Scholar] [CrossRef] [Green Version]
- Union of the Comoros (UDC). National Heath Policy. 2005. Available online: http://www.nationalplanningcycles.org/sites/default/files/country_docs/Comoros/politique_nationale_de_sante_vf_signee_07_en.pdf (accessed on 23 January 2017).
- Union Des Comores (UDC). Document de Stratégie de Croissance et de Réduction de la Pauvreté; Commissariat General au Plan: Moroni, Comoros, 2009; Available online: http://extwprlegs1.fao.org/docs/pdf/com149192.pdf (accessed on 17 January 2017).
- Metson, G.S.; Bennett, E.M.; Elser, J.J. The role of diet in phosphorus demand. Environ. Res. Lett. 2012, 7, 044043. [Google Scholar] [CrossRef] [Green Version]
- MacDonald, G.K.; Bennett, E.M.; Carpenter, S.R. Embodied phosphorus and the global connections of the United States agriculture. Environ. Res. Lett. 2012, 7, 044024. [Google Scholar] [CrossRef]
- Motesharezadeh, B.; Etesami, H.; Bagheri-Novair, S.; Amirmokri, H. Fertilizer consumption trend in developing countries vs. developed countries. Environ. Monit. Assess. 2017, 189, 103. [Google Scholar] [CrossRef] [PubMed]
- UNEP. Adapting Water Resource Management in the Comoros to Expected Climate Change; UNDP: Moroni, Comoros, 2010; Available online: https://www.thegef.org/sites/default/files/project_documents/10-18-16_Project_Document_PAD_Comoros_LDCF2_revised_clean.pdf (accessed on 4 December 2017).
- Commissioner General for Planing (CGP). Poverty Reduction and Growth Strategy Paper (PRGSP). International Monetary Fund, 2009. Available online: https://www.imf.org/external/pubs/ft/scr/2010/cr10190.pdf (accessed on 14 February 2017).
- African Development Bank Group (ADB). Country Strategy Paper 2016–2020. 2016. Available online: https://www.afdb.org/fileadmin/uploads/afdb/Documents/Project-and-Operations/COMOROS_-_2016-2020_Country_Strategy_Paper.pdf (accessed on 25 March 2018).
- Union Des Comores (UDC). Document de Stratégie de Croissance et de Réduction de la Pauvreté; Commissariat General au Plan: Moroni, Comoros, 2005; Available online: https://www.comores-online.com/mwezinet/projets/images/dscrprevise101005.pdf (accessed on 10 February 2017).
- Marie-Astrid, V. Etude Épidémiologique Rétrospective Suite à L’introduction de la Peste des Petits Animaux aux Comores. Thèse D’exercice pour obtenir the grade de Docteur Veterinaire, Médecine Vétérinaire, Ecole Nationale Vétérinaire de Toulouse—ENVT, Toulouse, France, 2013; 99p. [Google Scholar]
- De Deken, R.; Martin, V.; Saido, A.; Madder, A.; Brandt, J.; Geysen, D. An outbreak of East Coast Fever on the Comoros: A consequence of the import of immunised cattle from Tanzania? Vet. Parasitol. 2006, 143, 245–253. [Google Scholar] [CrossRef] [PubMed]
- Annual Report of the Ministry of Agriculture in Japan. Annual Report on Food, Agriculture and Rural Areas in Japan. 2006. Available online: http://www.maff.go.jp/e/pdf/fy2006_rep.pdf (accessed on 1 October 2018).
- Van Oort, P.A.J.; Saito, K.; Tanaka, A.; Amovin-Assagaba, E.; Van Bussel, L.G.J.; Wart, J.V.; De Groot, H.; Van Ittersum, M.K.; Cassman, K.G.; Wopereis, M.C.S. Assessment of rice self-sufficiency in 2025 in eight African countries. Glob. Food Secur. 2015, 5, 39–49. [Google Scholar] [CrossRef] [Green Version]
- Ango, N.E. Potential Discoveries of Hydrocarbons in the Comoros: From an Economy of Ylang-Ylang to Oil based Economy? 2016. Available online: http://www.thinkingafrica.org/V2/wp-content/uploads/2016/12/NAP-54-Oil.pdf (accessed on 23 December 2018).
- Delgado, C.L.; Courbois, C.B.; Rosegrant, M.W. Global Food Demand and the Contribution of Livestock as We Enter the New Millennium; International Food Policy Research Institute: Washington, DC, USA, 2006; Available online: https://ageconsearch.umn.edu/bitstream/91850/2/pubs_divs_mtid_dp_papers_dp21.pdf (accessed on 20 October 2018).
- D’Silva, J. The Impact of Increased Meat Consumption on Developing Countries. 2008. Available online: http://www.guengl.eu/uploads/_old_cms_files/Joyce_DSilva.pdf (accessed on 23 September 2018).
- Schroeder, T.C.; Barkley, A.P.; Schroeder, K.C. Income Growth and International Meat Consumption. J. Int. Food Agribus. Mark. 1996, 7, 15–30. [Google Scholar] [CrossRef]
- Cui, S.; Xu, S.; Wei, H.; Bai, X.; Huang, Y.; Li, G. Changing urban phosphorus metabolism: Evidence from Longyan city, China. Sci. Total Environ. 2015, 536, 924–932. [Google Scholar] [CrossRef] [PubMed]
- FAO. Mapping Supply and Demand for Animal-Source Foods to 2030. 2011. Available online: http://www.fao.org/docrep/014/i2425e/i2425e.pdf (accessed on 20 December 2017).
- FAO. Commodity Snapshots. 2016. Available online: http://www.fao.org/3/a-BT100e.pdf (accessed on 17 December 2017).
- Ranganathan, J.; Vennard, D.; Waite, R.; Dumas, P.; Lipinski, B.; Serchinger, T.; Model, G. Shifting Diets for a Sustainable Food Future. World Resource Institute, 2016. Available online: https://www.wri.org/sites/default/files/Shifting_Diets_for_a_Sustainable_Food_Future_0.pdf (accessed on 18 October 2018).
Figure 1.
Map of the study area.

Figure 2.
Embedded phosphorus flows through commodities trade in 1991 (a) and 2013 (b) in Comoros (unit: kg). Arrows are sized relative to the phosphorus flow, but we used the size of four as the lower flow threshold for streams of small size.
Figure 2.
Embedded phosphorus flows through commodities trade in 1991 (a) and 2013 (b) in Comoros (unit: kg). Arrows are sized relative to the phosphorus flow, but we used the size of four as the lower flow threshold for streams of small size.


Figure 3.
Virtual phosphorus flows through food trade in 1991 (a) and 2013 (b) (unit: kg P) in Comoros (unit: kg). Arrows are sized relative to the magnitude of the flow, but we used the size of four as the lower flow threshold for streams of a small size.
Figure 3.
Virtual phosphorus flows through food trade in 1991 (a) and 2013 (b) (unit: kg P) in Comoros (unit: kg). Arrows are sized relative to the magnitude of the flow, but we used the size of four as the lower flow threshold for streams of a small size.


Figure 4.
Comparison of virtual and embedded phosphorus through food trade in Comoros, from 1991 to 2013.
Figure 4.
Comparison of virtual and embedded phosphorus through food trade in Comoros, from 1991 to 2013.

Figure 5.
Comparison of phosphorus through food trade and phosphorus through imported fertilizer in Comoros, from 1991 to 2013. Source: Data for the phosphorus through imported fertilizer were from the Purchasing Center for Agricultural Inputs (PCAI: the official name in French is “Centrale d’Achat des Professionnels Agricole des Comores (CAPAC: trade statistics data, from 2000 to 2013).

Figure 6.
Relationship between imported phosphorus through trade and population growth in Comoros, from 1991 to 2013.
Figure 6.
Relationship between imported phosphorus through trade and population growth in Comoros, from 1991 to 2013.

Figure 7.
Detailed SSR of the selected items of Comoros, from 1991 to 2013.


Table 1.
Comparison of meat SSR in Comoros and Japan.
| Year | Country | Per Capita Virtual Phosphorus Requirements for Meat Production | References |
|---|---|---|---|
| 2009 | Japan | 2.50 kg | [26] |
| 1991 | Comoros | 0.28 kg | This study |
| 2013 | Comoros | 0.53 kg | This study |
Table 2.
Comparison of rice SSR in Comoros, other African countries, and Japan.
| Year | Country | Rice SSR (Based on Production) | References |
|---|---|---|---|
| 1991 | Comoros | 9.78% | this study |
| 2011 | Comoros | 1.06% | this study |
| 2005 | Japan | 95% | [41] |
| 2012 | Ghana * | 16.43% | |
| 2012 | Mali * | 89.53% | |
| 2012 | Tanzania * | 83.43% | |
| 2012 | Nigeria * | 52.68% | |
| 2012 | Burkina Faso * | 47.76% | |
| 2012 | Zambia * | 66.66% | |
| 2012 | SSA * | 58.91% |
* Computed based on the data from the assessment of rice self-sufficiency in 2025 in eight African countries study [42]. The SSA indicates some of the Sub-Saharan African countries, including (Burkina Faso, Ghana, Mali, Nigeria, Tanzania, and Zambia).
Table 3.
Projected annual domestic demands for selected food items in 2030, in metric tons.
| Food Group | Food Items | Consumption per Capita, Base Year 2013 (kg/year) | Projection for 2030 |
|---|---|---|---|
| Cereals | Wheat flour | 16 | 28,880 |
| Maize | 8 | 9784 | |
| Rice | 69 | 102,634 | |
| Livestock | Red meat | 10 | 37,979 |
| Poultry meat | 11 | 15,191 | |
| Eggs | 2.13 | 4530 | |
| Milk | 0.70 | 56,834 | |
| Vegetables | Onions, dry | 25.08 | 4241 |
| Garlic | 0.70 | 1142 | |
| Sugar and sweets | Sugar | 8.30 | 14,709 |
Table 4.
Quantification of the phosphorus requirements, in 2030.
| Food Group | Food Items | Conversion Factor (kg/kg P of Crop) | Phosphorus Requirements in 2030 | |
|---|---|---|---|---|
| Projected Domestic Demand (Mt) | Phosphorus Requirements (kg) | |||
| Cereals | Wheat flour | 0.0029 | 28,880 | 83,752 |
| Maize | 9784 | 28,373.60 | ||
| Rice | 102,634 | 297,638.60 | ||
| Livestock | Red meat | 0.0612 | 37,979 | 2,324,314.80 |
| Poultry meat | 0.0192 | 15,191 | 291,667.20 | |
| Eggs | 0.0126 | 4530 | 57,078 | |
| Milk | 0.0043 | 56,834 | 244,386.20 | |
| Vegetables | Onions, dry | 0.0013 | 4241 | 5513.30 |
| Garlic | 1142 | 1484.60 | ||
| Sugar | Sugar | 0.0002 | 14,709 | 2941.80 |
| Total (kg) | 3,337,150.10 | |||
Table 5.
describes the phosphorus requirements in 2030 under scenario 1 and 2.
| Phosphorus Requirement in 2030 under Scenarios 1 and 2, in kg | |
|---|---|
| Scenario 1 (90% SSR) | Scenario 2 (100% SSR) |
| 3,003,435.09 | 3,337,150.10 |
Table 6.
Comparisons of total phosphorus footprint and possible phosphorus requirements for meat production in Comoros, under this study and another study [32].
Table 6.
Comparisons of total phosphorus footprint and possible phosphorus requirements for meat production in Comoros, under this study and another study [32].
| Region | Year | Total Phosphorus Footprint (kg of Phosphorus per Capita/year) | Per Capita of Possible Phosphorus Requirement for Meat Production in kg | References |
|---|---|---|---|---|
| World | 2007 | 2.45 | 1.32 | [32] |
| 2030 | 3.46 | 1.55 | ||
| 2050 | 3.67 | 1.72 | ||
| Comoros | 1961 | 1.04 | n.a | |
| 2007 | 1.05 | n.a | ||
| Comoros | 1991 | 0.27 | 0.26 | This study |
| 2013 | 1.00 | 0.70 | ||
| 2030 | 3.14 | 2.46 |
© 2019 by the authors. Licensee MDPI, Basel, Switzerland. This article is an open access article distributed under the terms and conditions of the Creative Commons Attribution (CC BY) license (http://creativecommons.org/licenses/by/4.0/).
Share and Cite
MDPI and ACS Style
Kamal, T.S.; Huang, Y.; Xu, S.; Islam, I.; Cui, S. Phosphorus Demand for Food Security: A Case Study of a Food-Deficient Country. Sustainability 2019, 11, 1345. https://doi.org/10.3390/su11051345
AMA Style
Kamal TS, Huang Y, Xu S, Islam I, Cui S. Phosphorus Demand for Food Security: A Case Study of a Food-Deficient Country. Sustainability. 2019; 11(5):1345. https://doi.org/10.3390/su11051345
Chicago/Turabian StyleKamal, Thabiti Soudjay, Yunfeng Huang, Su Xu, Imranul Islam, and Shenghui Cui. 2019. "Phosphorus Demand for Food Security: A Case Study of a Food-Deficient Country" Sustainability 11, no. 5: 1345. https://doi.org/10.3390/su11051345
Note that from the first issue of 2016, this journal uses article numbers instead of page numbers. See further details here.