Life Cycle Assessment Comparison of Two Refractory Brick Product Systems for Ladle Lining in Secondary Steelmaking


1
Department of Mechanics, Mathematics and Management, Politecnico di Bari, 70126 Bari, Italy
2
PMQ research Group, ETSII, Universidad Politécnica de Madrid, 28006 Madrid, Spain; Visiting professor at I3-CRG, École Polytechnique, Route de Saclay, 91128 Palaiseau, Paris, France
*
Author to whom correspondence should be addressed.
Sustainability 2019, 11(5), 1295; https://doi.org/10.3390/su11051295
Submission received: 8 December 2018
/
Revised: 22 February 2019
/
Accepted: 24 February 2019
/
Published: 1 March 2019
Abstract
:This paper aims to compare the environmental performance of two types of refractory bricks for the internal lining of ladles in secondary steelmaking, where the dissolved inclusions coming from the refractory material require fine control to obtain the target steel quality. In this context, magnesia-carbon-based refractories are largely utilized, thanks to the adequate durability of the ladle lining in terms of number of heats before re-lining, but the utilization of organic binders in the mixture (pitch, resins) arises ecological and human health concerns. Concurrently, research efforts in refractory material science look at improving the quality of steel by reducing the content of dissolved carbon due to the release from the bricks, thus focusing on different refractory materials and specifically on alumina-based materials. The European Commission funded the research project “LeanStory”, aiming to promote such new lines of refractories through the cooperation between industrial partners and scholars where different recipes are considered. In the present paper, two representative systems of the refractory types considered, magnesia-carbon and magnesia-alumina, are compared with a preliminary Life Cycle Assessment (LCA). Suppliers and transports for the two product systems have been taken into account, referring to one tonne of refractory material as the functional unit for comparison. Preliminary impact results (adopting the ReCiPe Midpoint–Hierarchist perspective methodology for calculating the impact indicators) show that the new solution performs largely better almost for each indicator. Further investigations are required in order to assess the ecological performance of the two systems, considering the effective consumption of bricks for the production of steel.
1. Introduction
Refractory materials have high melting points and maintain their structural properties at very high temperatures. They are required in ferrous and non-ferrous industries, where furnaces or kilns are used. Their importance in terms of sustainability for the industry is highlighted in [1].
The steel industry uses refractories in both primary and secondary steelmaking, therefore MgO-C-based refractory materials are used in steel metallurgy to a large extent. Although the different conditions in each steel plant, where none remain the same, require multiple processing routes during secondary metallurgy to obtain the expected steel grades (including primary melting, stirring, vacuum or vacuum-oxygen decarburization degassing (VD/VOD)), ladle furnaces and chemical heating facilities are always of crucial importance. In this context, the steel ladle furnace can be considered a central element, as well as a metallurgical reactor [2], and becomes critical for producing clean steel grades.
Hot metal is desulfurized in steel ladle facilities where powdered desulfurization reagents are injected into the hot metal through an immersed lance using an inert carrier gas such as argon. Sodium carbonate (Na2CO3), CaSi, metallic calcium, calcium carbide (CaC2), and magnesium (Mg) are the reagents normally used for the desulfurization of the hot metal. In the melting vessel, the high carbon hot metal is refined to low carbon steel and during the process, dephosphorization can be controlled to very low levels. During or after tapping deoxidation, alloying agents and slag fluxes are charged into the melt, like Al, SiMn and FeSi. During the process, steel reheating electrodes adjust the temperature of the melt to compensate heat losses. Finally, during wire injection, final trimming of the steel composition is obtained and inclusion modification is applied, providing an adjusted steel composition to narrow specification limits.
Refractories for steel ladle side walls must withstand slag attack by aggressive, metallurgical reactive slag. In addition, the refractory lining must be thermodynamically stable in contact with steel, in order to avoid re-oxidation of the steel and problems with the steel cleanliness. From the market analysis performed in [3,4], it can be stated that the averaged refractory consumption is about 15 kg/tonne, with China rising the figure up to 20 kg/tonne, Europe and USA being about 10 kg/tonne and Japan having the lowest values of about 8 kg/tonne, with slightly higher values for stainless steel. Typically, today, the refractory quality mix is MgO-C bricks at the hot face (wear lining = 69.5%) and high Alumina or burned Magnesia bricks behind (permanent lining = 28.8%).
Well known associated problems with the MgO-C bricks are related to impurities such as sulfur, phosphorus, hydrogen, nitrogen and even carbon, which have impact on mechanical properties (ductility, embrittlement, toughness, etc.), as described in [5]. Those effects can be assessed because of the degradation exhibited for example in Figure 1. To this end, the relevance of the impurities against mechanical properties significantly depends on their size distribution [6].
Industry continuously looks to develop higher performing steels, which are commonly named ultra clean steels (UCS). Production of UCS has put a growing emphasis on the proper control of nonmetallic inclusions in steels. From the previous discussion it is derived that refractory materials are identifiable as one of the major sources of non-metallic inclusions in the molten steel during ladle metallurgy. Therefore, drawing up carbon free bricks for ladle furnaces is a significant contribution leading to build UCS [7]. The EU funded the research project LeanStory, aiming to promote such new line of refractories through the cooperation between industrial partners and scholars, where different recipes have been elaborated (see Section 2).
The framework of the analysis in the project is to study different perspectives (mechanical, chemical, etc.) but also the feasible recipes, the analysis of their life cycle (LCA) and their economic performance. The focus of this paper is to discuss the LCA for such new refractory material, because it shall be a relevant factor to make the decision of producing such refractories. Therefore, the rest of this paper presents in Section 2 a brief reference about the methodological framework and details regarding the new recipe and the comparison against the classical MgO-C bricks, as well as details regarding the processing of some raw materials and the supply chain. In Section 3 main results will be presented and, finally, the Discussion section will illustrate a summary of the gained knowledge.
2. Materials and Methods
2.1. Methodological Framework
The software program utilized to carry out the modeling and the LCIA (life cycle impact assessment) comparison is “OpenLCA” ([8]), taking, as functional unit of the analysis, one metric tonne of produced refractory bricks “at gate” and considering the two product systems depicted in Figure 2 and Figure 3, for the traditional MgO-C and “Carbonless” bricks, respectively. Within the software, the LCA process database adopted for the modeling of the product systems is “ecoinvent® 3.4”, in particular in the form of “Unit Processes” and with the system modeling approach “Allocation, Cut-Off by classification”. In the terminology of this database, there is a slight terminological difference with the international standard [9], in that, according to the definition, “an ecoinvent activity dataset represents a unit process of a human activity and its exchanges with the environment and with other human activities.” ([10]). Therefore, the term “activity” is to be intended as synonym of “process”. As regards the localization of processes or of utility providers (energy or transport) comprised in the ecoinvent® 3.4 database, the general rules adopted are the following: if the dataset exists as a version with a specific national localization, this version is used; if the process is localized in Europe, the “RER” or “Europe without Switzerland” version of the dataset is used, if it exists (“RER” stands for Europe according to the database documentation); finally, if the process is localized outside Europe or if the “RER” dataset does not exist, then the “RoW” (Rest of the World) dataset or the “GLO” (Global) dataset are used.
For the successive analysis of LCIA, the chosen methodology is “ReCiPe Midpoint (H)”, which covers 18 mid-point impact indicators, and adopting the perspective approach “hierarchist”. The “ReCiPe” methodology ([11,12]), acronym for the four developers “RIVM” (Dutch National Institute for Public Health and the Environment [13]), Radboud University, CML (Centruum voor Milieukunde Leiden at the Leiden University’s Institute of Environmental Sciences) and Prè Consultants, represents an “alignment of two families of methods for LCIA: the midpoint-oriented CML 2002 method and the endpoint-oriented Eco-indicator 99 method”. For this reason, it exists in two versions, as both a midpoint approach and as a damage-oriented (endpoint) approach. In the intentions of its developers, a practitioner can choose between 18 relatively robust, but not immediately comprehensible, midpoints, versus three easy to understand, but more uncertain, endpoints. Furthermore, the “hierarchist” perspective, in comparison to the other two possible views coming from the cultural theory (“egalitarian” and “individualist”), represents a balanced choice between short- and long-term effects (impacts happening many decades after emission) and is based on consensus among scientists; for this reason, it is often considered the default model ([14]). As regards the considered time-frame, for example, for the impact indicator “Climate Change” it is limited to 20 years in the “individualist” perspective, to 100 years in the “hierarchist” perspective and to 500 years in the “egalitarian” one. The implementation of the methodology “ReCiPe” is carried out in the software adopting the ecoinvent database version 3.4 Impact Assessment methods, within the framework specified in [15].
2.2. Recipe Data
Referring to data provided by industrial partners, the current investigation refers to two different MgO based mixes for refractories, reported in Table 1. The first mix is a reference recipe of traditional MgO-Carbon bricks, in which magnesia accounts in total for around 80% in weight percentage, in form of dead burnt magnesia (DBM) and fused magnesia (FM); carbon is its second major constituent, deriving from directly added flake graphite and from the decomposition of phenolic resin, used as binder in the mix. The second mix is primarily constituted by magnesia in form of DBM (almost 90%), to which alumina is added in form of tabular and reactive aluminas; therefore, this new kind of brick is deprived of the carbon content and is referred to as “Carbonless”. The component DBM 97 is present indeed with different particle size distributions, but, for industrial privacy reasons, details are not reported in Table 1. Also, for the other components, details regarding the specific chosen granulometry are not reported. In the carbonless type, some water is added during the manufacturing process to improve the plasticity of the mix, but it doesn’t appear in the table, due to its complete successive evaporation.
2.3. Brick Manufacturing Process
The basic steps for the production of refractory bricks consist of a sequence of processes which do not change in nature with the composition of the bricks but require the setup of several processing variables, varying with the types of bricks.
The basic steps can be summarized in the following:
- (Optional) crushing and sieving (to achieve a defined particle-size distribution) of the raw materials, according to the recipe;
- Mixing of the components;
- Molding (a.k.a. shaping), by means of several pressing cycles, in order to obtain a compact and easy-to-handle “green-state” solid piece;
- Pre-heating and baking (in particular, “curing” for the reference MgO-C bricks) or drying and sintering (for the “carbonless” bricks);
- Cooling, packaging and shipping.
The system boundary under examination for comparison purposes does not include the final shipping of the products, i.e., the analysis is up to the “gate” of the manufacturer. A fundamental hypothesis in the following evaluations is that the two types of bricks differ only for the energy consumption during step (4), because it is assumed that negligible differences exist for all the preceding and subsequent steps. For this reason, details regarding e.g., the electric energy consumption required by the pressing cycle have not been provided by the industrial partners and are not reported. For the same reason, particle size differences among the “DBM 97” ingredients in Table 1 are neglected and it is assumed that they come from one supplier only. In Table 2, the main differences for the relevant steps of the manufacturing process of the two types of bricks are shown.
More specifically, the datum regarding the specific energy consumption (referred to one metric tonne of product) for drying and sintering the Carbonless type of bricks has been derived from a linear interpolation between an assumed value of 3300 kJ/kg at a temperature of 1000 °C and 6000 kJ/kg at a temperature of 1760 °C. The first datum is drawn from [16], based on the typical range of specific consumptions of tunnel kilns, and the second is drawn from the European reference document [17] regarding specific energy requirements for drying and firing (at 1760–1850 °C) of magnesia bricks in tunnel kilns. The energy consumption for the traditional kind of bricks has been assumed one third of the previous figure, on the basis of information provided by industrial partners. In Section 3, regarding the results of the LCIA comparison, also a variant of this last production process is considered, envisaging the technological possibility of utilizing heat recovered from another process (in the same site, requiring much more elevated temperatures, such as heat for sintering) for baking at low temperature the traditional MgO-C reference bricks; consequently, null input thermal energy is assumed in the LCI (Life Cycle Inventory) of the brick manufacturing process. Of course, the concrete feasibility of waste heat recovery at industrial scale should be carefully assessed (with particular regard to temperature control systems) and is outside the scope of the current paper, but a concept design realization, for the pre-heating and drying phases of construction bricks, can be found for example in [18].
The brick manufacturing plant is located in the Spanish region of Asturias and, in the following product system models, all the transport distances from the known suppliers are calculated accordingly. For the two processes (or activities) “Brick manufacturing” (of the two types of brick), the input materials are quantified on the basis of the data reported in Table 1 (as it will be illustrated in the following section), along with the thermal energy consumption, identified as the energy flow “heat, district or industrial, natural gas” (product flow). This product flow is provided by a fictitious utility supplier, identified, in the ecoinvent database, as the most fit as the Unit Process “heat production, natural gas, at industrial furnace >100kW|heat, district or industrial, natural gas|cut-off”, located in “Europe without Switzerland”.
2.4. Modeling and Assumptions Regarding the Manufacturing Process of MgO-C Reference Bricks
2.4.1. Recipe Weight Percentage Adjustments
As observable in the reference bricks’ recipe in Table 1, 5% in weight is constituted by phenolic resin. From the literature references [19,20,21], it is possible to assert that when phenol-formaldehyde resins are used as binders, during the brick baking phase and the pyrolysis of the resin, some phenol, minor amounts of formaldehyde (for resole type resins) and reaction water are emitted in the tempering step. Most of these emissions are removed in kilns equipped with post-combustion systems, whereas the remaining part of vaporizable structures stay in the product delivered to steel plants and is emitted during preheating and frequently also in the first heats. In the following, it is assumed that a novolac-type phenolic resin is used. On the basis of data found in [20], with a conservative approach, it is reasonable to assume that around half of the original weight content of phenolic resin becomes volatile on heat treatment in form of emissions (partially at the brick manufacturing plant and for the remaining part in subsequent heats at the ladle furnace) and half is fixed in the graphitic structure of the brick. As reported in [21], quantitative results regarding the weight loss of phenolic resin and the emission composition can be derived from experimental trials in a controlled atmosphere (nonoxidizing, such as helium or N2), with the combined use of thermogravimetric analysis (TGA) and pyro-gas chromatography (Pyro-GC), but such analysis are beyond the scope of the funded research project. With reference to the recipe in Table 1, it is assumed that no further weight losses are present due to the decomposition of other materials. Since the content of phenolic resin accounts for 5% in weight and it is assumed that one half becomes volatile, the volatile part accounts for 2.5% of the total weight, which is not a negligible figure. Therefore, the input materials have to be referred to the re-calculated solid mass fraction (equal to the reference unit of 1 tonne of finished bricks, also resulting from subsequent ladle heats) and the recipe percentages have to be adjusted consequently, as reported in Table 3.
2.4.2. Emissions in the Heating Phase
In [19], for a novolac-type phenolic resin, cured and carbonized in a reducing atmosphere, the emission composition analysis is reported as [mol%], up to a temperature of 1000 °C. For the sake of simplicity, even though the baking (curing) temperature is only 200 °C (Table 2), it is assumed that all the above quantified emissions from the pyrolysis of phenolic resin take place during the brick manufacturing process, including also those caused by future ladle heats. These emissions are accounted for in the output LCI of the brick manufacturing process.
In order to convert values from mol% to weight percentages, the following formula has been adopted:
where: mol%i is the mol% value of the i-th chemical species; M.W.i is its molecular weight [g/mol].
Calculated values are reported in Table 4 and the complete LCI of the manufacturing process of this type of bricks is reported in Table A1 of Appendix A.
2.4.3. Modeling and Assumptions Regarding the Suppliers’ Chain
The intermediate step of the analysis (before the impact comparison) is the building up of the “product system” involved in the production of one reference unit (one metric tonne) of refractory bricks “from cradle to gate”, for both the two types of bricks. To this end, the suppliers’ chain of raw materials used in the recipe of the reference bricks has been characterized, according to information by industrial partners, locating each supplier in a specific place and calculating transport distances consequently. The chain origins with raw material acquisition, continues with its processing and converges to the process of brick manufacturing. In Figure 2 a schematic representation of material flows, with logistic information regarding the transport providers and the distances from mine sites or production sites up to the brick manufacturing plant, is reported.
For both types of refractories, it is assumed that the starting raw material is magnesite (MgCO3), extracted in an open mine in the area of Kütahya (Turkey) and successively transported and processed in the same plant, located around 50 km away. In the following subsections, a detailed description of the processes comprised in the depicted product system are illustrated, along with the adopted references of their Life Cycle Inventories (LCIs).
2.4.4. Magnesite Mining Process
The LCI for the process “Open Magnesite Mining” is drawn from [22], which refers to an open mine in Liaoning Province (China), with a yield ratio of 1000 kg of magnesite per 1087 kg of strip mine (yield ratio equal to 1000/1087 = 92%). Since, according to [23], generally, the mines in Turkey yield a much lower content of MgCO3 than the Chinese ones, with a conservative approach, a yield ratio of 50% has been adopted (i.e., 1000 kg of magnesite per 2000 kg of strip mine). Under the hypothesis that the specific utility consumption (water, electricity and diesel) remains unvaried w.r.t. the input mass of raw material (strip mine), consequential adjustments of the input and output inventories of data from [22] (indicated in the following formulas with the subscript “reference”) have been implemented in the following form: defined a generic yield Y as the ratio of 1000 (kg) of Magnesite over the mass in (kg) of strip mine necessary to obtain this reference quantity, input flows Ij (for consumptions) and output flows Ok (for emissions) are calculated as:
For waste and valuable materials, the mass flow balance is applied and, preserving the same percentage proportions among the waste flows (or valuable materials), defined the percentage of each waste flow (or valuable material) as WF%l, the following formula has been applied:
The resulting adjusted inventories are reported in Table 5.
The providers of the utilities of this process (diesel and electricity) are assumed respectively as “market for diesel|cut-off, U—RoW” and “market for electricity, low voltage|cut-off, U—TR” (where TR is Turkey and RoW is Rest of the World). Finally, the transport of magnesite to the processing plant is performed by trucks and the assumed provider in the database for this service (in Turkey) is “market for transport, freight, lorry, unspecified|cut-off, U—GLO”.
2.4.5. Processes for the MgO-based Materials
From the magnesite processing plant, it is possible to obtain all the MgO-based materials (ordinary dead burned magnesia, high purity magnesia and fused magnesia) used in both the recipes in Table 1 and the LCIs for the processes involved are drawn from [24]. In particular, for the recipe of the reference MgO-C bricks, since the purity grade attained by the production process of ordinary dead burned magnesia (ODBM) in [24] is only 89–92% of content of MgO, not coherent with that of “DBM97”, this ingredient has been considered equivalent to and substituted by high purity magnesia (HPM) (96–97.7% MgO) illustrated in the same paper and the LCI of this process is adopted. The LCI of the production of “FM97” is considered equivalent to that of fused magnesia (FM) in [24], since this material has a comparable purity grade of 96–97.8% of MgO.
The adopted utility providers of the above processes are the following
- for electricity: “market for electricity, medium voltage|cut-off, U—TR”;
- for coal: “market for hard coal|cut-off, U—RoW”;
- for heavy oil: “market for heavy fuel oil|cut-off, U—RoW”.
In particular, for the production of fused magnesia, graphite electrodes are necessary and it is assumed that their production process is equivalent to that for the production of “battery grade graphite” (with a purity grade of synthetic graphite >99.9%), present in the database. Since these electrodes must be found on markets, the adopted process is “market for graphite, battery grade|cut-off, U—GLO” with its default values for the providers. For simplification reasons, it is assumed that the transport from the supplier of electrodes to the FM manufacturing plant is negligible, or these distances can be considered already included in the process of procurement on global markets.
The transport process of all the above MgO products to the sea-port for shipping is carried out by trucks and it is taken into consideration the boarding port of Bandirma, 300 km away from the production site. It is assumed that the disembarking port is Bilbao (Spain), which implies a sea transport distance of around 5000 km. At last, the lorry transport from the port of Bilbao to the brick manufacturing plant (in Spain) requires a distance of 270 km. The providers for the transport processes are, respectively (both providers are geographically undifferentiated)
- for the road transport: “market for transport, freight, lorry, unspecified| cut-off, U—GLO” (with a total distance of 570 km) and
- for the sea transport: “market for transport, freight, sea, transoceanic ship|cut-off, U—GLO”.
2.4.6. Processes Associated with the Other Raw Materials of MgO-C Reference Bricks
The extraction site of graphite and the process plant location are in the same site, assumed in the Eastern part of China, in Shandong province, where some of the largest mines of the country are located. The assumed process in the database is the dataset “graphite production|cut-off, U—RoW”, with default suppliers (the original dataset refers to a localization in Europe); in particular, the input raw material “metamorphous rock, graphite containing, in ground” is an elementary flow found on site, with an overall assumed yield of 95%. The milled graphite is transported by trucks to the assumed port of Shanghai (China), for a distance of around 800 km and, from there, it is shipped to the port of Bilbao (Spain), covering a sea distance of around 18,666 km. Finally, it is transported along 270 km by trucks to the brick manufacturing plant (in Spain). The transport providers are the same of the MgO-based materials, with a total road distance of 1070 km by means of trucks.
The phenolic resin provider is located in Spain and for its production the dataset “phenolic resin production|cut-off, U—RER” is used, being the process located in Europe (as specified in the record documentation, “some values are based on data from a large chemical factory located in Germany”). Suppliers of the process are the default ones and, in particular, the input products formaldehyde and phenol are modeled as found on global markets (upstream processes are included). The transport of phenolic resin is performed by trucks, covering a distance of around 370 km, with the same above-mentioned provider.
The assumed location of the silicon provider is in Spain and this material (used as antioxidant in the recipe) has been identified with “silicon, metallurgical grade” (with a purity grade of 99%, used for the production e.g., of aluminum compounds, silicones and semiconductors). The adopted LCI for the production process is the dataset “silicon production, metallurgical grade|cut-off, U—RoW” (Rest of the World, since the original data refer to production plants in Norway), with default suppliers. The transport of silicon is performed by trucks, covering a distance of around 890 km, with the same above-mentioned provider.
2.5. Modeling and Assumptions Regarding the Manufacturing Process of Carbonless Bricks
2.5.1. Assumed Emissions and LCI of the Manufacturing Process
On the basis of information provided by industrial partners, in theory there are no emissions during the sintering phase of this type of bricks, except for the water, added during manufacturing to improve the plasticity of the mix, emitted as vapor in the drying stage. Water is not reported in the recipe in Table 1, since its complete successive evaporation does not alter the mass balance and the depicted weight percentages. This water content is anyway computed in the LCI. Despite the above statement, during sintering, the emission of very small quantities of air pollutants cannot be excluded. With reference to [1], the chemical analysis of the magnesia spinel refractory brick studied in that paper (which, likewise, undergoes firing at high temperature, although not specifically indicated) reveals to be very similar to that of the recipe of the Carbonless brick. In fact, it is possible to note that the content of magnesia is 89% for the magnesia spinel bricks analyzed in that paper and almost 90% for the Carbonless recipe and the content of alumina is, respectively, 9% and 8% in total (in the forms of reactive and tabular aluminas). The content of the remaining minor constituents (SiO2, CaO and Fe2O3) is unknown for the carbonless bricks. Since the two compositions are very similar, it is assumed that, during sintering, the new brick origins the same gaseous emissions like those of the analyzed magnesia-spinel brick, reported in the above-mentioned paper. For the LCI, some minor adjustments have been adopted, since in the database some chemical compounds are not present or are found in a slightly different form. The weight loss percentage as volatile mass can be calculated as 6.4475 kg/1000 kg = 0.64% which is a negligible value, not enough to justify adjustments of the recipe in terms of weight percentages, as done instead for the reference brick. The assumed LCI of the manufacturing process of the Carbonless type of bricks is reported in Table A2 of Appendix A.
2.5.2. Modeling and Assumptions Regarding the Suppliers’ Chain
In Figure 3, a schematic representation of material flows, with logistic information regarding distances, analogously like those in Figure 2, is reported.
In addition to the assumptions already illustrated in Section 2.4 concerning the geographical origin of magnesia-based products and the adopted LCIs of their production processes, the following further assumptions refer to the suppliers of raw materials of the Carbonless bricks. Alongside, the references for the LCIs of the associated processes are provided. The component “DBM97”, present in the recipe in Table 1 (indeed, with different particle size distributions, not mentioned for industrial privacy reasons), has been identified as high purity magnesia (HPM) (96–97.7% MgO) in [24], with a total amount of almost 75% in weight and no distinction regarding particle size distribution. The component “DBM90” has been identified as ordinary dead burned magnesia (ODBM) in the same paper, characterized by a purity grade of 89–92% of MgO. The providers of these processes have already been mentioned.
2.5.3. Processes for Alumina-based Materials
On the basis of information provided by industrial partners, the production site of both “Tabular Alumina” and “Reactive Alumina” is located in the same plant in France and it is assumed that, for both processes, the starting material is calcined alumina, produced in the same site. For this last process the LCI is given by the dataset in the database “aluminum oxide production|cut-off, U—GLO”, with no transport associated, as the process is carried out on-site (the starting material is aluminum hydroxide, available on global markets).
Tabular alumina is made up of grains of alpha alumina with a diameter from 50 to 300 µm, formed by crystalline growth during sintering. The production process, according to [25], starts with the grinding of a purified synthetic calcined alumina from the Bayer process, which is then agglomerated in a special ball-forming process, with water only, without additives. After drying, the dried green balls are sintered in a continuous vertical shaft kiln (fired by gas), where the conversion to tabular alumina takes place at temperatures of 1800–1900 °C. Successively, after cooling, the sintered alumina balls are crushed and the particles are screened according to appropriate sizes. Lastly, fine tabular alumina powder (<0.3 mm) is obtained by means of a ceramic ball grinding process. For the LCI quantification of this production process, it is assumed that the major impact derives from the sintering phase, while the other steps are neglected. According to industrial evaluations, in a comparison with Fused Alumina, the energy consumption for one tonne of tabular alumina is in the range 20–35% the energy required by Fused Alumina, which is in the range from 2000 kWh to 3000 kWh. On the basis of these data, adopting a conservative approach, the energy consumption of 1050 kWh/t (3780 MJ/t) of thermal energy has been assumed (35% of 3000 kWh), with the energy provider in the database “heat production, natural gas, at industrial furnace >100 kW|cut-off, U—Europe without Switzerland”.
Reactive alumina, according to [26], is a fully ground calcined alumina of which a substantial portion is made of primary crystals less than 1 μm. In the manufacturing process, reactive aluminas require intensive grinding with ceramic grinding media (such as batch dry grinding in a ceramic-lined ball mill) for more than 24 hours. The electric consumption for this phase has been considered as the most relevant in the entire production process and characterizing its LCI. For its quantification, to a first approximation, a possible approach is the application of the Bond equation [27]:
where:
- W is the specific grinding energy [kWh/tshort];
- Wi is the Bond ball mill work index [kWh/tshort];
- F80 is the feed 80% passing size in [μm];
- P80 is the product 80% passing size in [μm].
In the above formula, the unit for mass is the “short ton”, equal to 907.18474 kg. The work index represents the resistance of the material to crushing and grinding and it will be assumed as a known constant value. According to table data in the reference site [28], which in turn cites values found in the handbook [29], the work index for alumina is in the range 7–34 kWh/tshort. For the quantification of the parameter F80, it should be considered that alumina obtained with the calcination process, often referred to as “sandy alumina”, is characterized by 90% particles with dimensions larger than 45 μm. Considering the particle size distribution depicted in [30], it is possible to assume F80 around 100 μm. As regards the value of P80, accurate information on typical particle size distribution of reactive aluminas can be found in the technical document [31]. It can be observed that the variability range of P80 is quite wide (from 0.6 μm of some very fine ground mono-modal aluminas to 8 μm of some bimodal and multimodal types). With a conservative approach, but excluding aluminas for which D50 is less than 0.5 μm, the assumption P80 = 3 μm has been made and, for the work index, the quite maximum value of 30 kWh/tshort is adopted, in order to take into account its possible variability during the process. Finally, considering a grinding machine efficiency of 0.8, by means of Equation (4) and referring the figure to one metric tonne, the electrical energy consumption of around 200 kWh/t is calculated. The adopted provider of electricity in the database is “market for electricity, medium voltage|cut-off, U—FR” (localized in France).
The transport of tabular and reactive aluminas is performed by trucks, covering a distance to the brick manufacturing plant of around 1120 km, with the provider “market for transport, freight, lorry, unspecified|cut-off, U—GLO”.
2.5.4. Processes Associated with the Other Raw Materials of Carbonless Bricks
For the extraction process of clay, the adopted process in the database is “clay pit operation|cut-off, U—RoW” with default providers (the original data refer to a localization in Switzerland). This dataset assumes a thickness of the clay layer in nature of 30 m and “Clay, unspecified, in ground”, as input elementary flow, whose main component (as reported in the documentation) is Kaolin (kaolinite: Al2O3·2SiO2·2H2O). The extraction and supplier location are in the same site, in France, and transports are performed by trucks covering a distance of around 670 km with the same provider specified above.
With regard to the component carboxylic acid salt of aluminum, considering that its weight percentage in the recipe in Table 1 is roughly 0.15%, applying a cut-off rule, the ecological impact of its production process has been excluded from the analysis and from the product system. It is worth noting that, on the contrary, its high unitary cost is not negligible. The transport process has been included in the product system and, assuming the location of the provider in the UK and the transport performed by trucks passing through the Channel Tunnel (“Eurotunnel”), a total distance of around 2070 km is traveled, with the transport provider already mentioned.
3. Results
In this section, the results of LCIA calculations are reported.
3.1. Results of the Comparison in Relative and Absolute Terms
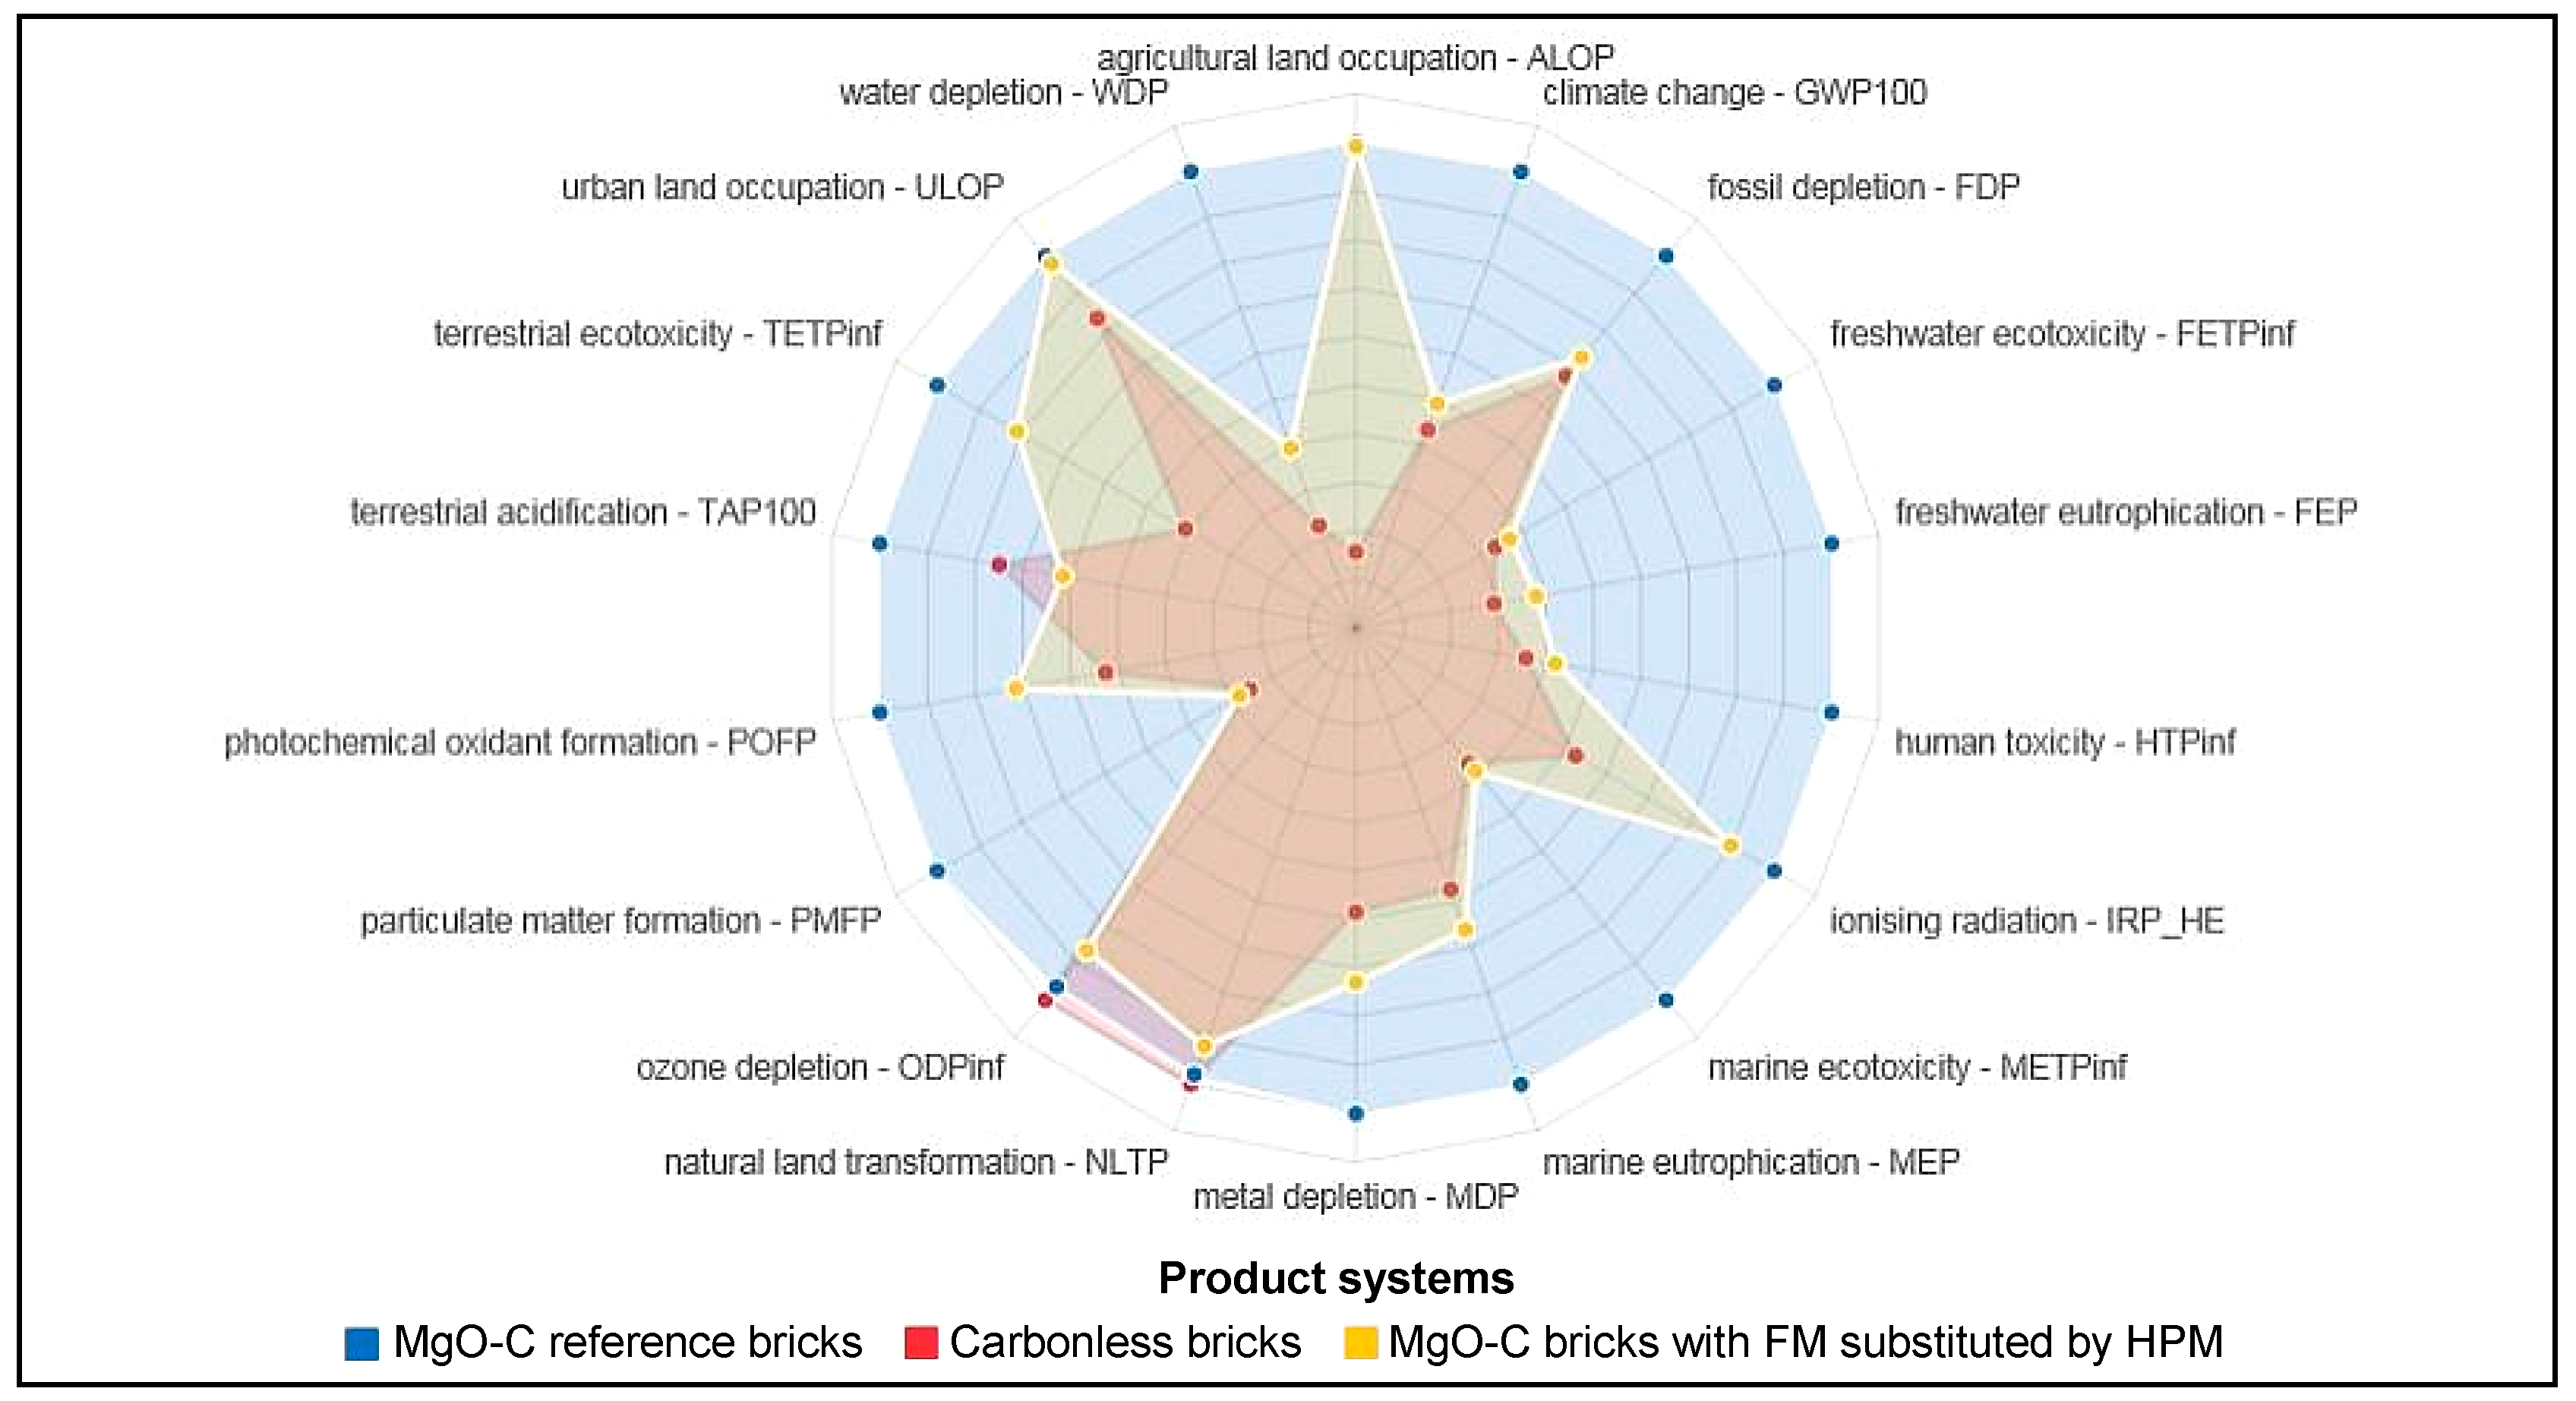
In Figure 4, the radar chart of the comparison among the two illustrated product systems is reported, in terms of relative values, that’s to say the value of 100 (outer circle) is assigned to the maximum value attained by each impact indicator.
As it is possible to observe, the product system of carbonless bricks performs better for all the impact indicators, except for “Ozone Depletion Potential (ODP)” and “Natural Land Transformation”. In Table 6, the quantitative results of the impact indicators are reported, alongside the achieved percentage reductions in brackets, taking the values found for the MgO-C bricks product system as reference. The indicators are sorted with the absolute values of the reductions achieved by the Carbonless bricks product system (second column) in descending order. As it is possible to observe, the major reductions (over 50%) of impact indicators achieved by the Carbonless bricks product system are found for: “Agricultural Land Occupation” (−84.3%), “Water Depletion” (−77.6%), “Particulate Matter Formation” (−74.6%), “Freshwater Eutrophication” (−71%), “Freshwater Ecotoxicity” (−66.6%), “Human Toxicity” (−64.2%), “Marine Ecotoxicity” (−63.6%), “Terrestrial Ecotoxicity” (−59.2%) and “Climate Change” (−56.5%). On the contrary, slightly increased values are found for the two indicators “Natural Land Transformation” (+2.2%) and “Ozone Depletion” (+3.7%).
For the variant with the conceived possibility of utilizing recovered heat for the brick baking process (in its product system, null input thermal energy during this phase is the only difference) the results, w.r.t. the first product system, show valuable reductions, as expected, for “Climate Change” (−6.1%), “Fossil depletion” (−7.2%), “Ozone Depletion” (−12.7%) and also for “Natural Land Transformation” (−11.8%), whereas slight decreases are found for the remaining indicators (under 2.3%).
3.2. Analysis of the Major Process Contributors to Impacts
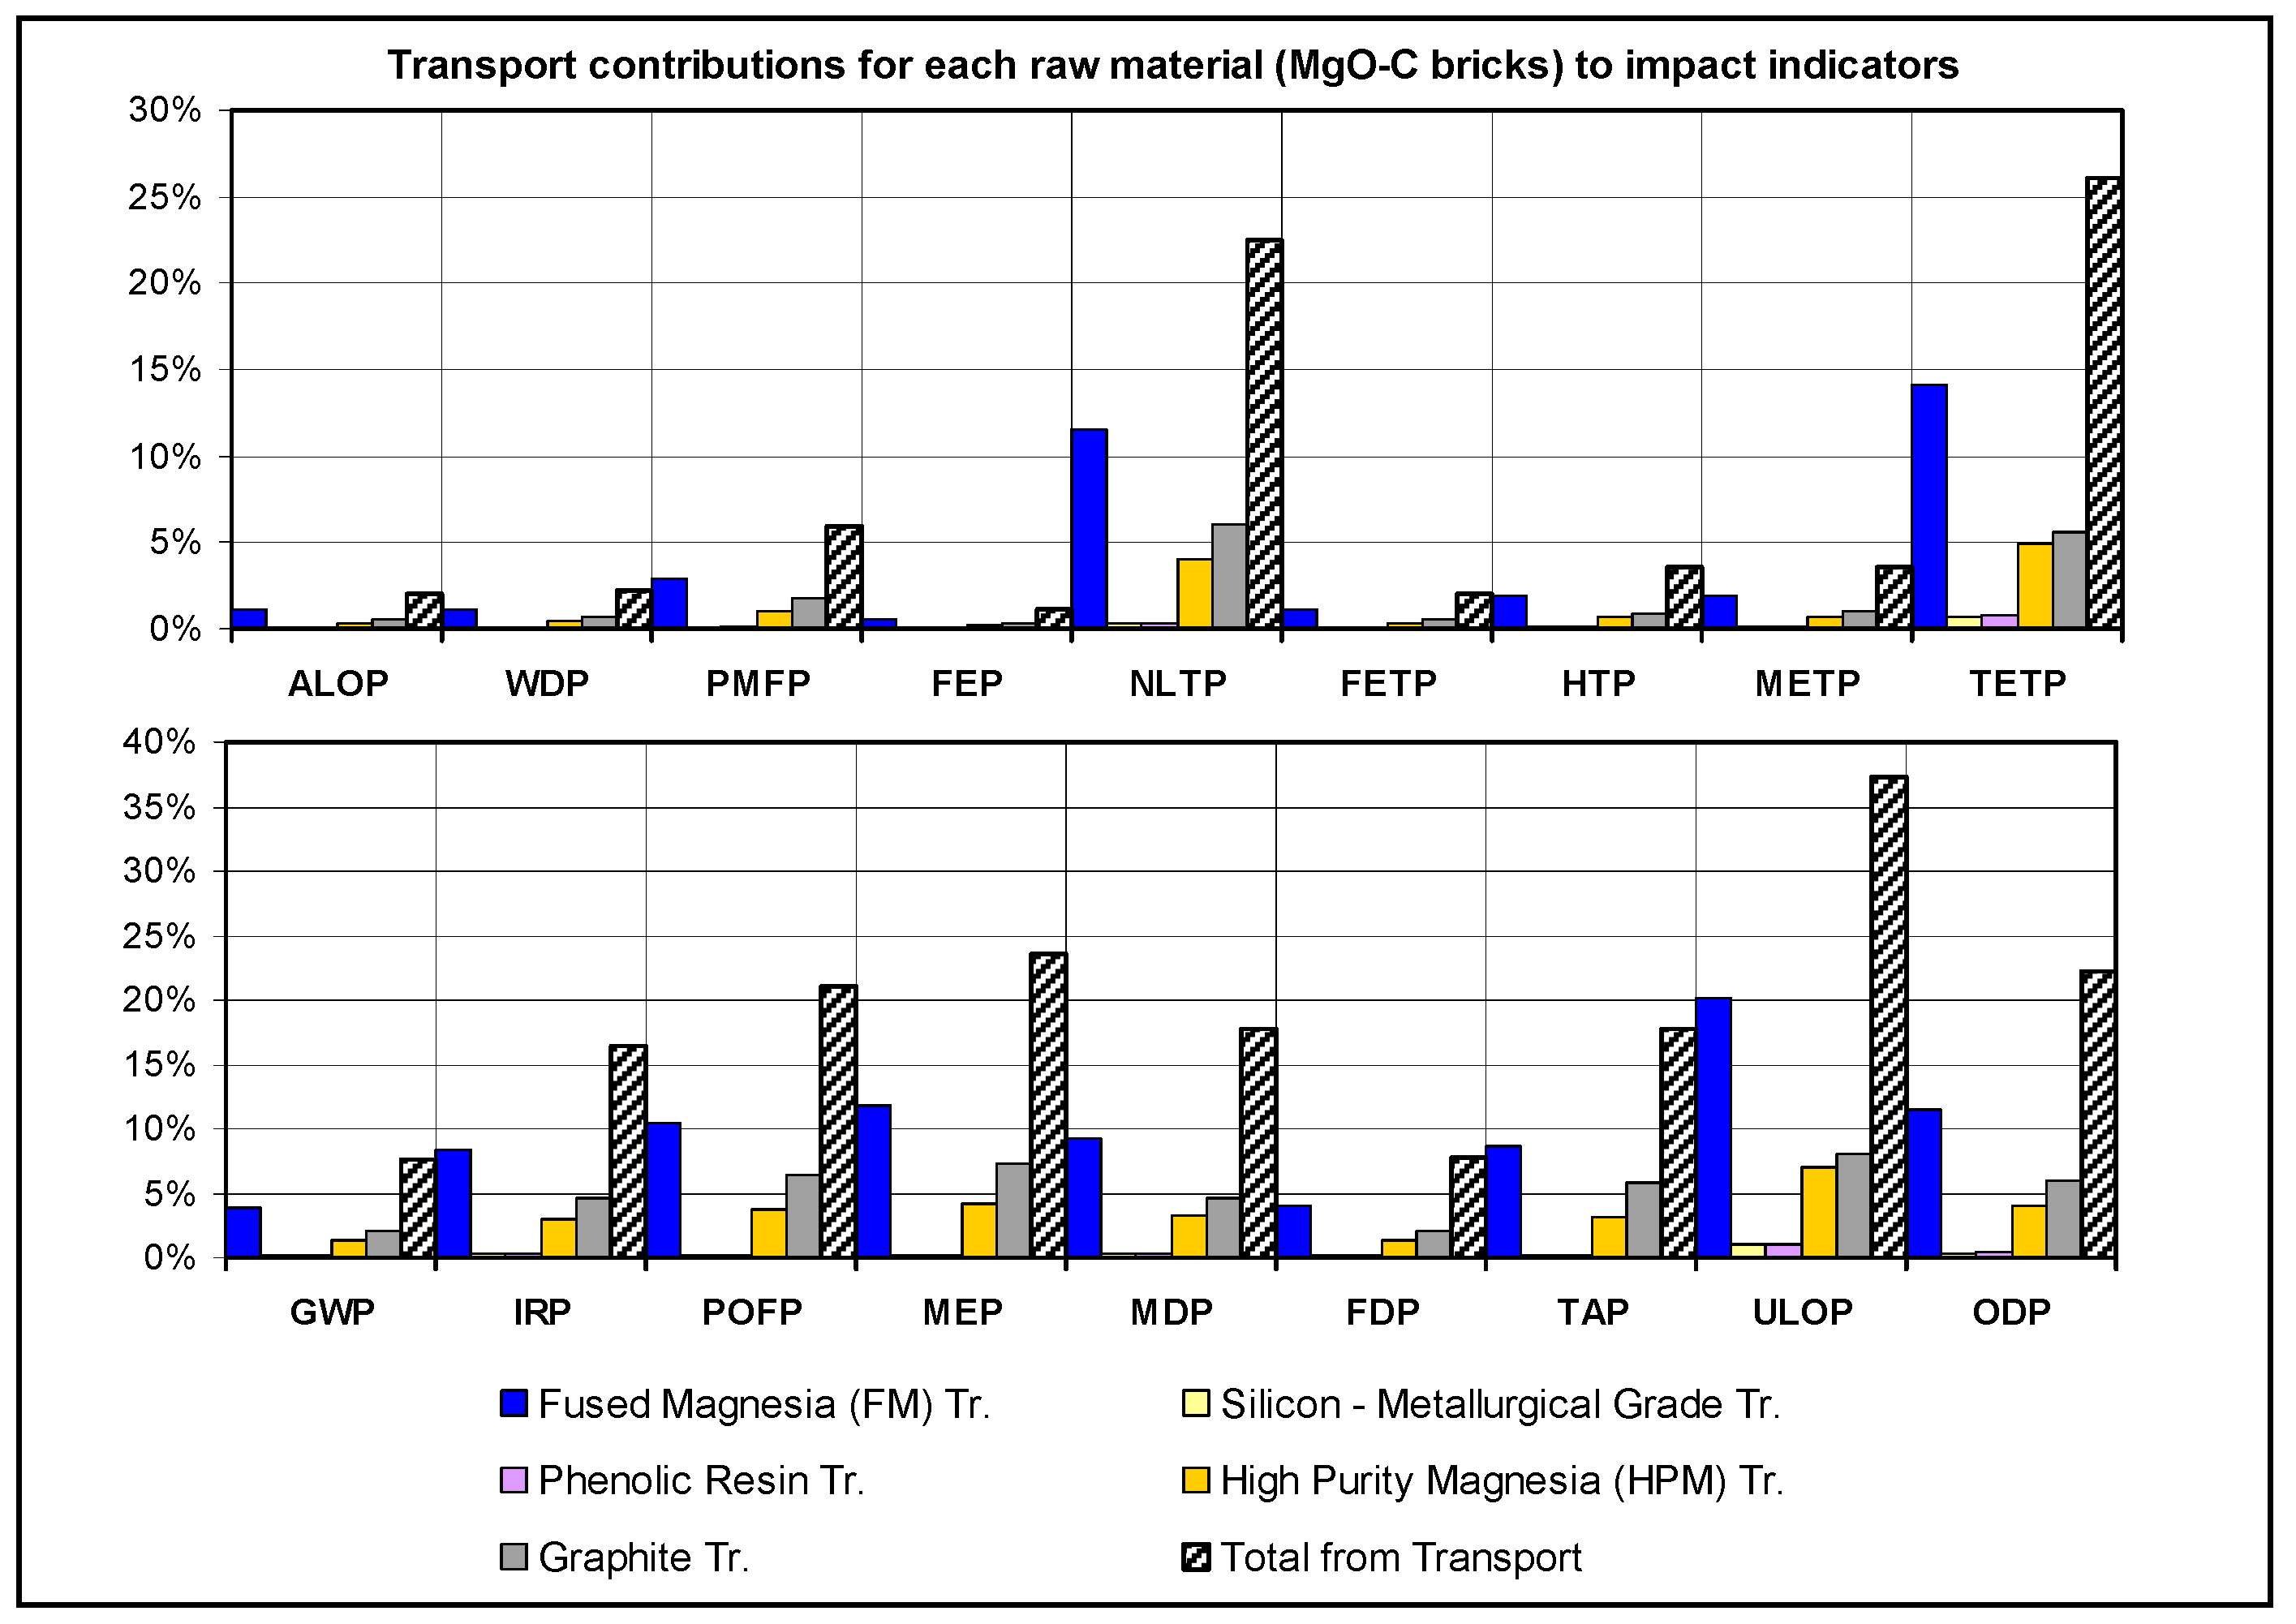
In the following histogram diagrams, the attention is focused on the disaggregated contribution to each impact indicator of every process involved in the illustrated product systems, adopting for the indicators the abbreviation names reported in Figure 4. In particular, in Figure 5 and Figure 6, referring to the MgO-C bricks and to the Carbonless bricks, respectively, the process contributors to the impacts, in direct upstream position with respect to the bricks manufacturing phase, are depicted. For the first type, the involved upstream processes comprise the production (including transport) of the needed raw materials high purity magnesia (HPM), fused magnesia (FM), graphite, phenolic resin and silicon, plus the impact from the use of gas for heating (in the tunnel kiln) with the specified provider (“heat production—natural gas”); as observable, for some impact indicators, also the direct contribution from the aerial emissions during baking (as assumed in Section 2.4.2) exists. For the Carbonless bricks, the upstream production and transport processes refer to the raw materials high purity magnesia (HPM), ordinary dead burned magnesia (ODBM), reactive and tabular aluminas, clay. In addition, the contributions from gas burning during the sintering phase and separately from the aerial emissions during this phase (as assumed in Section 2.5.1) are shown. The process involved in the production of the carboxylic acid salt of aluminum, as mentioned earlier, has been excluded from the model, being a negligible fraction in the recipe. In Figure 7 and Figure 8, the contributions coming separately from the transport processes of the raw materials only (from the mentioned suppliers’ sites to the brick manufacturing plant) are reported. For the carbonless type of bricks, the transport associated to the carboxylic acid salt of aluminum, although included in the impact calculations, is not shown in Figure 8, being below 0.5% for all the indicators. In the following, a brief description of the main results depicted in the figures is illustrated.
For the reference traditional bricks (Figure 5), the dominant process contributor (above or around 50%) is identifiable in the fused magnesia production process for almost all the impact indicators, except for four cases. For agricultural land occupation potential (ALOP), differently from all the other indicators, the first contributor (almost 80%) is the production process of “silicon, metallurgical grade”, despite it accounts for around 2% only in weight in the recipe (Table 3). For the terrestrial ecotoxicity potential (TETP) impact indicator also the emissions during the baking phase have comparable consequences (37.9% for the latter and 39.3% for FM); for the Ionizing Radiation Potential (IRP) indicator, also the silicon production process plays an important role (32.2% and 36.1% for FM); finally, for the metal depletion potential (MDP) indicator, the phenolic resin production process shows a relevant contribution too (31.3% and 46.8% for FM).
As regards the contributions from the transport processes (Figure 7), their total share ranges from 1.2% for freshwater eutrophication potential (FEP) to 37.3% for urban land occupation potential (ULOP). For all the impact indicators, i.e., taking into consideration the transports only, the major contribution comes from the transport of fused magnesia, which accounts for 54% of the total for ULOP and for TETP, 53% for HTP, and around 50% for the other indicators.
Considering the Carbonless bricks (Figure 6), for almost all the impact indicators, the most relevant process contributor is the high purity magnesia production process (including transport), with percentages definitely above 50%, whereas for six impact indicators (GWP, FDP, ODP, MDP, TAP and PMFP) some detailing is necessary. In the case of the indicator global warming potential (GWP) the major contribution is represented instead by “heat production” from natural gas (which includes burning and the upstream processes) with 42.1%, followed by the HPM production process, with 38.4%. This result confirms the relevant impact of the use of a huge amount of gas during the sintering phase of the carbonless bricks. In regards to the indicator fossil depletion potential (FDP), HPM production process represents 53.3%, followed by “heat production” from gas with 32.1%, since these processes are energy intensive and require the use of fossil resources. In fact, according to [24], the specific consumption of fossil fuels to produce one tonne of HPM is 278.3 kg of coal and 68 kg of heavy oil, besides the electric energy consumption (219.85 kWh). Similarly, the ozone depletion potential (ODP) impact indicator is essentially determined by the effects of HPM production (46.2%) and of “heat production” from gas (37.1%). For the impact indicator metal depletion potential (MDP), besides the contribution of 41.1% from HPM, the production processes of Reactive and Tabular Aluminas share ex aequo the relevant figure of 19.7%, as expected, since they are used in the same amount in the recipe, share the same upstream processes (aluminum oxide production from bauxite) and are very narrowly differentiated for the last stage of their production processes. This consideration is valid for these two components, in general, for the other impact indicators. For the indicator terrestrial acidification potential (TAP), alongside the contribution of 43.4% from HPM, the assumed emissions themselves during the sintering phase (as illustrated in Section 2.5.1) contribute for around 34%. Similarly, for the particulate matter formation potential (PMFP), a relevant share (18.9%) is due to these emissions, after the contribution from HPM (59.6%).
The impact contributions of the transport processes only (Figure 8) ranges from a total figure of 3.3% for Freshwater Eutrophication Potential (FEP) to 60.2% for Terrestrial Ecotoxicity Potential (TETP). Similarly to what already observed with fused magnesia in the reference bricks, also in this case, for all the impact indicators, the major contribution comes from the transport of high purity magnesia, which accounts on average 75% of the total, from around 70% (TETP and ULOP indicators) to around 80% (TAP indicator).
3.3. Results of the Comparison Substituting Fused Magnesia with High Purity Magnesia in the Reference Bricks’ Recipe
As highlighted in the previous section, the major impact contributor among the involved product system’s processes for the MgO-C bricks is the production of fused magnesia. In this section, a new calculation of the “ReCiPe Midpoint (H)” impact indicators is performed for this product system, assuming that in the recipe specified in Table 1 the component fused magnesia could be entirely substituted by DBM97, that’s to say by high purity magnesia, as described in [24]. In this case, the magnesia content of the recipe (81%) would be constituted only by DBM97. It is to point out that this assumption is not supported by a technological knowledge regarding the behavior of the obtained bricks (in terms of mechanical and thermal properties) nor by performed tests and must be intended purely as a hypothesis to provide reference results. In Figure 9, the radar chart of the results is shown, including the previously illustrated product systems. It’s possible to observe that the substitution, in comparison with the reference recipe of MgO-C bricks, has a beneficial effect on all the indicators, almost at the same level of the Carbonless bricks for many of them, as indicated by the similar shape. For three indicators in particular (TAP, ODP and NLTP) even lower values than the Carbonless bricks product system are found.
In Table 7, the results are reported in detail, together with the achieved percentage reductions in brackets, taking the values found for the MgO-C bricks product system as reference. The adopted order is the ratio of the difference between the percentage reductions achieved, respectively, by the Carbonless product system and by the product system in the said hypothesis over the reduction in the first case, considering only the positive values, in ascending order; the negative values (lower reductions achieved) are considered separately in descending order. It’s possible to outline that for a group composed by the first nine indicators (from PMFP to WDP) the values of the above defined ratios are under the value of 0.22; for MDP and POFP are 0.35 and 0.4 respectively; for another group of indicators (from TETP to ALOP), these ratios are in the range 0.677–0.99; finally, for the TAP, the ODP and the NLTP indicators the MgO-C brick variant performs better than the Carbonless type, also because for the last two indicators the Carbonless type leads to a slight worsening than the reference case.
4. Discussion
Looking to produce UCS, the choice of the refractory materials to be used for the steel ladle lining could be of considerable importance. In this way, the usage of carbonless bricks could be a potentially interesting option, but its consideration needs to enlarge the knowledge about the overall expected impacts. In order to obtain an accurate perspective of the full range of environmental effects from their use at industrial scale, LCI and LCA are the adequate instruments to assess the impact of shifting from the MgO-C based bricks to the carbonless ones.
The highest relative impact in the carbonless bricks manufacture derives from the production process of high purity magnesia (HPM) and from the sintering phase, as they involve huge energy consumption, higher in comparison to the manufacturing process of the MgO-C bricks.
At this point, it is necessary to emphasize that the present analysis was performed on the production process of “pure” (i.e., not-recycled) bricks. However, it is expected that, in normal operating conditions, around 20% in weight of the raw materials to produce a new brick will come from the recycling process [32] (i.e., after the complete demolition of the internal lining of a ladle, part of the used bricks, not affected by the direct contact with steel nor by degradation, can be grinded and reused in the recipe), although alumina based larger grains would be preferred, depending on their market price [33]. As far as it is expected the same amount of recycled materials for both types of bricks, corresponding environmental impacts will be reduced accordingly, except for the emissions of volatile organic compounds (VOCs) in the MgO-C type, since the phenolic resin must be added and fired necessarily and except for air emissions (in particular CO/CO2, NOx) and energy consumption consequences, during firing/sintering; in brief, the environmental consequences of the production phase would maintain similar figures even adopting recycling for both types.
The adopted LCIA methodology “ReCiPe Midpoint—Hierarchist perspective” allows to highlight, with a consensus-based approach, the overall better ecological performances of the carbonless bricks’ product system for 16 out of 18 indicators. In particular (Table 6), except for the impact indicators Natural Land Transformation and Ozone Depletion, for which a slight quantitative increment is observed (3% on average), the numerical assessment of the impact indicators Agricultural Land Occupation, Water Depletion, Particulate Matter Formation, Freshwater Eutrophication, Freshwater Ecotoxicity, Human Toxicity and Marine Ecotoxicity, show a decrease to around one third, or less, the respective values found in the MgO-C bricks’ product system.
Further analysis has also shown that theoretical reductions (with figures similar to those achieved by the carbonless bricks’ product system) could be obtained just for half the indicators (first nine rows in Table 7) substituting fused magnesia with high purity magnesia in the recipe. However, this substitution must be intended as hypothetical because of the lack of experimentation and data regarding both the bricks production and the steel ladle management.
Finally, the option of recovering heat for the baking phase of the traditional bricks has also been considered and it would imply a general slight reduction of impacts (under 2.3%), more consistent for Climate Change (−6.1%), Fossil depletion (−7.2%), Ozone Depletion (−12.7%) and Natural Land Transformation (−11.8%).
It must be pointed out that the boundaries of the illustrated analysis are “from cradle to gate” of the refractory bricks only, while the final aim of the research project LeanStory is the assessment of UCS production performance figures with the new bricks. At the moment, experimentation is ongoing and data on steel ladle management as well as on the produced UCS quality/cleanliness are not available yet. Therefore, there is no possibility to extend the analysis to the operational phase of the bricks and to shift the functional unit from the production of one tonne of refractory bricks to the production of one tonne of ultra-clean steel.
The acquisition of knowledge regarding the whole lifecycle of a reference steel ladle will be an essential part of future research developments for the complete ecological and economic assessment of the industrial adoption of the new carbonless bricks. Data concerning the number of heats and maintenance requirements of the reference ladle (until the demolition of its internal refractory lining, followed by a complete rebuilding) have still to be assessed in the last step of the research project. Their availability will allow investigation concerning the amount of bricks required per tonne of UCS as well as the attained UCS quality, for achieving competitiveness on the steel market scenario.
Author Contributions
Conceptualization, J.O.-M. and F.B.; methodology, F.B.; software, F.B.; validation, J.O.-M.; formal Analysis, F.B.; investigation, F.B.; data curation, F.B.; writing—original draft preparation, F.B. and J.O.-M.; Writing-Review & Editing, F.B., J.O.-M. and R.I.
Funding
This research was funded by EU under the Research Funds for Coal and Steel, through the grant number RFSR-CT-2015-00005 (LEANSTORY).
Acknowledgments
The authors acknowledge to all the partners involved in the LeanStory project because of their support to this research.
Conflicts of Interest
The authors declare no conflicts of interest. The funding sponsors had no role in the design of the study; in the collection, analyses, or interpretation of data; in the writing of the manuscript, or in the decision to publish the results.
Appendix A

Table A1.
Assumed LCI of the production process of one tonne of MgO-C bricks.
| Input 1/Output | Flow | Value |
|---|---|---|
| Input materials (t) | DBM97 | 0.2154 |
| FM97 | 0.6154 | |
| Graphite | 0.1231 | |
| Phenolic resin | 0.05128 | |
| Antioxidants (silicon) | 0.0205 | |
| Energy consumption (MJ) | Heat (from gas) | 1800 |
| Emissions to air (kg) | Water | 5.878 |
| CO | 2.148 | |
| CO2 | 0.982 | |
| CH4 | 2.237 | |
| Phenol | 9.318 | |
| Xylenol 2 | 3.066 | |
| Benzene | 0.218 | |
| Toluene | 0.385 | |
| H2 | 1.408 | |
| Output wanted (t) | MgO-C bricks | 1 |
1 Electric energy consumption not considered because of negligible differences in the comparison between the manufacturing processes of the two types of bricks; 2 Within the software implementation, this emission has been replaced by “Xylene”, since in the Ecoinvent® database version 3.4 “Xylenol” is not included.
Table A2.
Assumed LCI of the production process of one tonne of Carbonless bricks.
| Input 1/ Output | Flow | Value |
|---|---|---|
| Input materials [t] | DBM97 | 0.7488 |
| DBM90 | 0.1497 | |
| Tabular alumina | 0.04 | |
| Reactive alumina | 0.04 | |
| Clay | 0.02 | |
| Carboxylic acid salt of Aluminum | 0.0015 | |
| Water | sensitive information | |
| Energy consumption [MJ] | Heat (from gas) | 5430 |
| Emissions to air [g] (original values as reported in [1]) | CO | 3237 |
| CO2 | 425.785 | |
| SO2 | 2465 | |
| NOx | 183 | |
| Particulate matter | 30.2 | |
| Hydrogen Fluoride | 38.25 | |
| Hydrogen Chloride | 23.44 | |
| 4-chlorotoluene 2 | 0.921 | |
| 2-chlorotoluene 3 | 0.914 | |
| 1,1,2,2-tetrachloroethane | 20.37 | |
| Benzene | 5.149 | |
| Toluene | 7.916 | |
| p+m Xylene 4 | 1.504 | |
| Ethylbenzene 5 | 1.496 | |
| Styrene | 0.698 | |
| O-xylene | 0.954 | |
| Isopropyl-Benzene 6 | 0.083 | |
| n-propyl-Benzene 7 | 0.215 | |
| Trimethyl-Benzene | 0.895 | |
| Butylbenzenes 8 | 0.936 | |
| 4-Isopropyltoluen 9 | 0.264 | |
| Naphthalene | 0.123 | |
| Formaldehyde | 1.99 | |
| Arsenic | 0.0729 | |
| Chromium | 0.1102 | |
| Cadmium | 0.0044 | |
| Copper | 0.1248 | |
| Manganese | 0.0189 | |
| Nickel | 0.0038 | |
| Lead | 0.097 | |
| Titanium | 0.2011 | |
| Water vapour | same as input (sensitive information) | |
| Output wanted [t] | Carbonless bricks | 1 |
1 Electric energy consumption not considered because of negligible differences in the comparison between the manufacturing processes of the two types of bricks; 2,3 Considered undifferentiated as Toluene, 2-chloro; 4 Considered half as para-Xylene and half as m-Xylene; 5 Not present alone in the Ecoinvent® database version 3.4 and considered equivalent to “BTEX” (Benzene, Toluene, Ethylbenzene, and Xylene) in unspecified ratio; 6,7,8 In the Ecoinvent® database called “Cumene”, “1-Propyl Benzene” and “T-butylbenzene”, respectively; 9 Not present in the Ecoinvent® database version 3.4 and not included in the LCI.
References
- Ozkan, A.; Günkaya, Z.; Tok, G.; Karacasulu, L.; Metesoy, M.; Banar, M.; Kara, A. Life cycle assessment and life cycle cost analysis of magnesia spinel brick production. Sustainability 2016, 8, 662. [Google Scholar] [CrossRef]
- Lachmund, H. Demands on refractory material for secondary metallurgy. In Proceedings of the International Seminars Refractories Technology—Steel Ladle Lining, Ijmuiden, The Netherlands, 20–22 June 2002. [Google Scholar]
- Buhr, A. Trends in Clean Steel Technology and Refractories Engineering. In Proceedings of the UNITECR 2015, Wein, Austria, 15–18 September 2015. [Google Scholar]
- Roberts, J. Outlook for Refractory End Market to 2020. In Proceedings of the 57th International Colloquium on Refractories, Aachen, Germany, 24–25 September 2014. [Google Scholar]
- Lange, K.W. Thermodynamic and kinetic aspects of secondary steelmaking processes. Int. Mater. Rev. 1988, 33, 53–89. [Google Scholar] [CrossRef]
- Hansén, T.; Jönsson, P. Some ideas of determining the macro inclusion characteristics during steelmaking. In Proceedings of the 24th Electric Furnace Conference, Phoenix, AZ, USA, 11–14 November 2004. [Google Scholar]
- Wang, H.; White, J.F.; Sichen, D. A New Experimental Design to Study the Kinetics of Solid Dissolution into Liquids at Elevated Temperature. Metall. Mater. Trans. B 2018, 49, 688–698. [Google Scholar] [CrossRef] [Green Version]
- openLCA—The Life Cycle and Sustainability Modeling Suite. Available online: http://www.openlca.org/openlca (accessed on 13 January 2019).
- International Organization for Standardization (ISO). ISO 14044:2006 Environmental Management—Life Cycle Assessment—Requirements and Guidelines; ISO Central Secretariat: Geneva, Switzerland, 2006. [Google Scholar]
- Glossary Page on the Ecoinvent Database Official Site. Available online: https://www.ecoinvent.org/support/glossary/glossary-detail.html (accessed on 13 January 2019).
- Margni, M.; Curran, M.A. Chapter 4—Life Cycle Impact Assessment. In Life Cycle Assessment Handbook: A Guide for Environmentally Sustainable Products; Curran, M.A., Ed.; Scrivener Publishing LLC: Beverly, MA, USA, 2012; pp. 67–104. ISBN 978-1-118-09972-8. [Google Scholar]
- Goedkoop, M.; Heijungs, R.; Huijbregts, M.; De Schryver, A.; Struijs, J.; van Zelm, R. ReCiPe 2008—A Life Cycle Impact Assessment Method Which Comprises Harmonised Category Indicators at the Midpoint and the Endpoint Level—Report I: Characterisation, First edition (version 1.08)—May 2013 Amendment; Ministerie van VROM: Den Haag, The Netherlands, 2013. [Google Scholar]
- About RIVM. Available online: https://www.rivm.nl/en/about-rivm (accessed on 13 January 2019).
- European Commission—Joint Research Center (JRC)—Institute for Environment and Sustainability (IES). ILCD Handbook: Recommendations for Life Cycle Impact Assessment in the European Context—Based on Existing Environmental Impact Assessment Models and Factors, 1st ed.; Publications Office of the European Union: Luxemburg, 2011; ISBN 978-92-79-17451-3. [Google Scholar]
- Wernet, G.; Bauer, C.; Steubing, B.; Reinhard, J.; Moreno-Ruiz, E.; Weidema, B. The ecoinvent database version 3 (part I): Overview and methodology. Int. J. Life Cycle Assess. 2016, 21, 1218–1230. [Google Scholar] [CrossRef]
- Kaya, S.; Mançuhan, E.; Küçükada, K. Modelling and optimization of the firing zone of a tunnel kiln to predict the optimal feed locations and mass fluxes of the fuel and secondary air. Appl. Energy 2009, 86, 325–332. [Google Scholar] [CrossRef]
- European Commission—Joint Research Center (JRC). Reference Document on Best Available Techniques in the Ceramic Manufacturing Industry; European Commission: Luxemburg, 2007. [Google Scholar]
- Prasertsan, S.; Theppaya, T.; Prateepchaikul, G.; Kirirat, P. Development of an energy-efficient brick kiln. Int. J. Energy Res. 1997, 21, 1363–1383. [Google Scholar] [CrossRef]
- Irie, S.; Rappolt, J. Chapter 19—Phenolic Resin for Refractories. In Phenolic Resins: A Century of Progress; Pilato, L., Ed.; Springer: Berlin/Heidelberg, Germany, 2010; pp. 503–516. ISBN 978-3-642-04713-8, e-ISBN 978-3-642-04714-5. [Google Scholar]
- Funabiki, K.; Nakamura, M.; Tsuriya, M. Carbonization of Phenolic Resins. Jpn. Thermosetting Plast. Ind. Assoc. 1981, 2, 220–235. [Google Scholar] [CrossRef]
- Ebner, C.; Skala, K.; Rechberger, L.; Neubauer, B. Avoidance of Hazardous Substances via Low Emission MgO-C Technology Shown with the Example of a Ladle Lining Refractory. RHI Bull. J. Refract. Innov. 2017, 22–27. Available online: http://digital.library.aist.org/pages/PR-372-292.htm (accessed on 13 January 2019).
- Li, J.; Zhang, Y.; Shao, S.; Zhang, S. Comparative life cycle assessment of conventional and new fused magnesia production. J. Clean. Prod. 2015, 91, 170–179, Supplementary data in Appendix A. [Google Scholar] [CrossRef]
- Mikami, H.M. Chapter 10—Refractory MgO. In Proceedings of the Raw Materials for Refractories Conference; Smothers, W.J., Ed.; The American Ceramic Society Inc.: Columbus, OH, USA, 1983; pp. 97–118. ISBN 9780470374009. [Google Scholar]
- Li, J.; Zhang, Y.; Shao, S.; Zhang, S.; Ma, S. Application of cleaner production in a Chinese magnesia refractory material plant. J. Clean. Prod. 2016, 113, 1015–1023. [Google Scholar] [CrossRef]
- Büchel, G.; Liu, X.; Buhr, A.; Dutton, J. Review of tabular alumina as high performance refractory material. InterCeram Refract. Man. 2007, 6–12. Available online: https://www.researchgate.net/publication/288399513_Review_of_tabular_alumina_as_high_performance_refractory_material (accessed on 13 January 2019).
- Gürel, S.B.; Altun, A. Reactive alumina production for the refractory industry. Powder Technol. 2009, 196, 115–121. [Google Scholar] [CrossRef]
- Bond, F.C. Crushing and Grinding Calculations—Parts I and II. Br. Chem. Eng. 1961, 6, 378–385 & 543–548. [Google Scholar]
- 911Metallurgist Site—Table of Bond Work Index by Minerals. Available online: https://www.911metallurgist.com/blog/table-of-bond-work-index-by-minerals (accessed on 13 January 2019).
- Weiss, N.L. SME Mineral Processing Handbook; Society of Mining Engineers of the American Institute of Mining, Metallurgical, and Petroleum Engineers: New York, NY, USA, 1985. [Google Scholar]
- Li, W.; Liu, J.; Yin, Z.; Liu, W.; Zhang, Z.; Hu, Y. Technology improvement of sandy alumina production from diasporic bauxite in China. In Proceedings of the 7th International Alumina Quality Workshop, Perth, Western Australia, Australia, 16–21 October 2005. [Google Scholar]
- Alteo Alumina. Specialty Aluminas for high Performance Refractories, 2018 ed. Available online: https://www.alteo-alumina.com/IMG/pdf/alteo_2018_refractory_brochure_web.pdf (accessed on 13 January 2019).
- Vidal de Almeida, B.; Marinho de Faria, R.; Tarcizo de Oliveira Vieira, A.; Nascimento Silva, S.; Vernilli, F. Recycling of steelworks refractories: Processing and properties. Ironmak. Steelmak. 2016, 43, 775–779. [Google Scholar] [CrossRef]
- Plešingerová, B.; Vadasz, P.; Kameský, R.; Derďak, J.; Bounziova, J.; Dedinska, E.; Vojtko, M. Post-mortem characterization of alumina-c refractory bricks with organic bond from steel production: Potentially of Al2O3-material recovery. Ceramics–Silikáty 2017, 61, 223–230. [Google Scholar] [CrossRef]
Figure 1.
Conventional MgO-C bricks after usage. Source: LeanStory project.

Figure 2.
Suppliers’ chain for the production of the reference bricks.
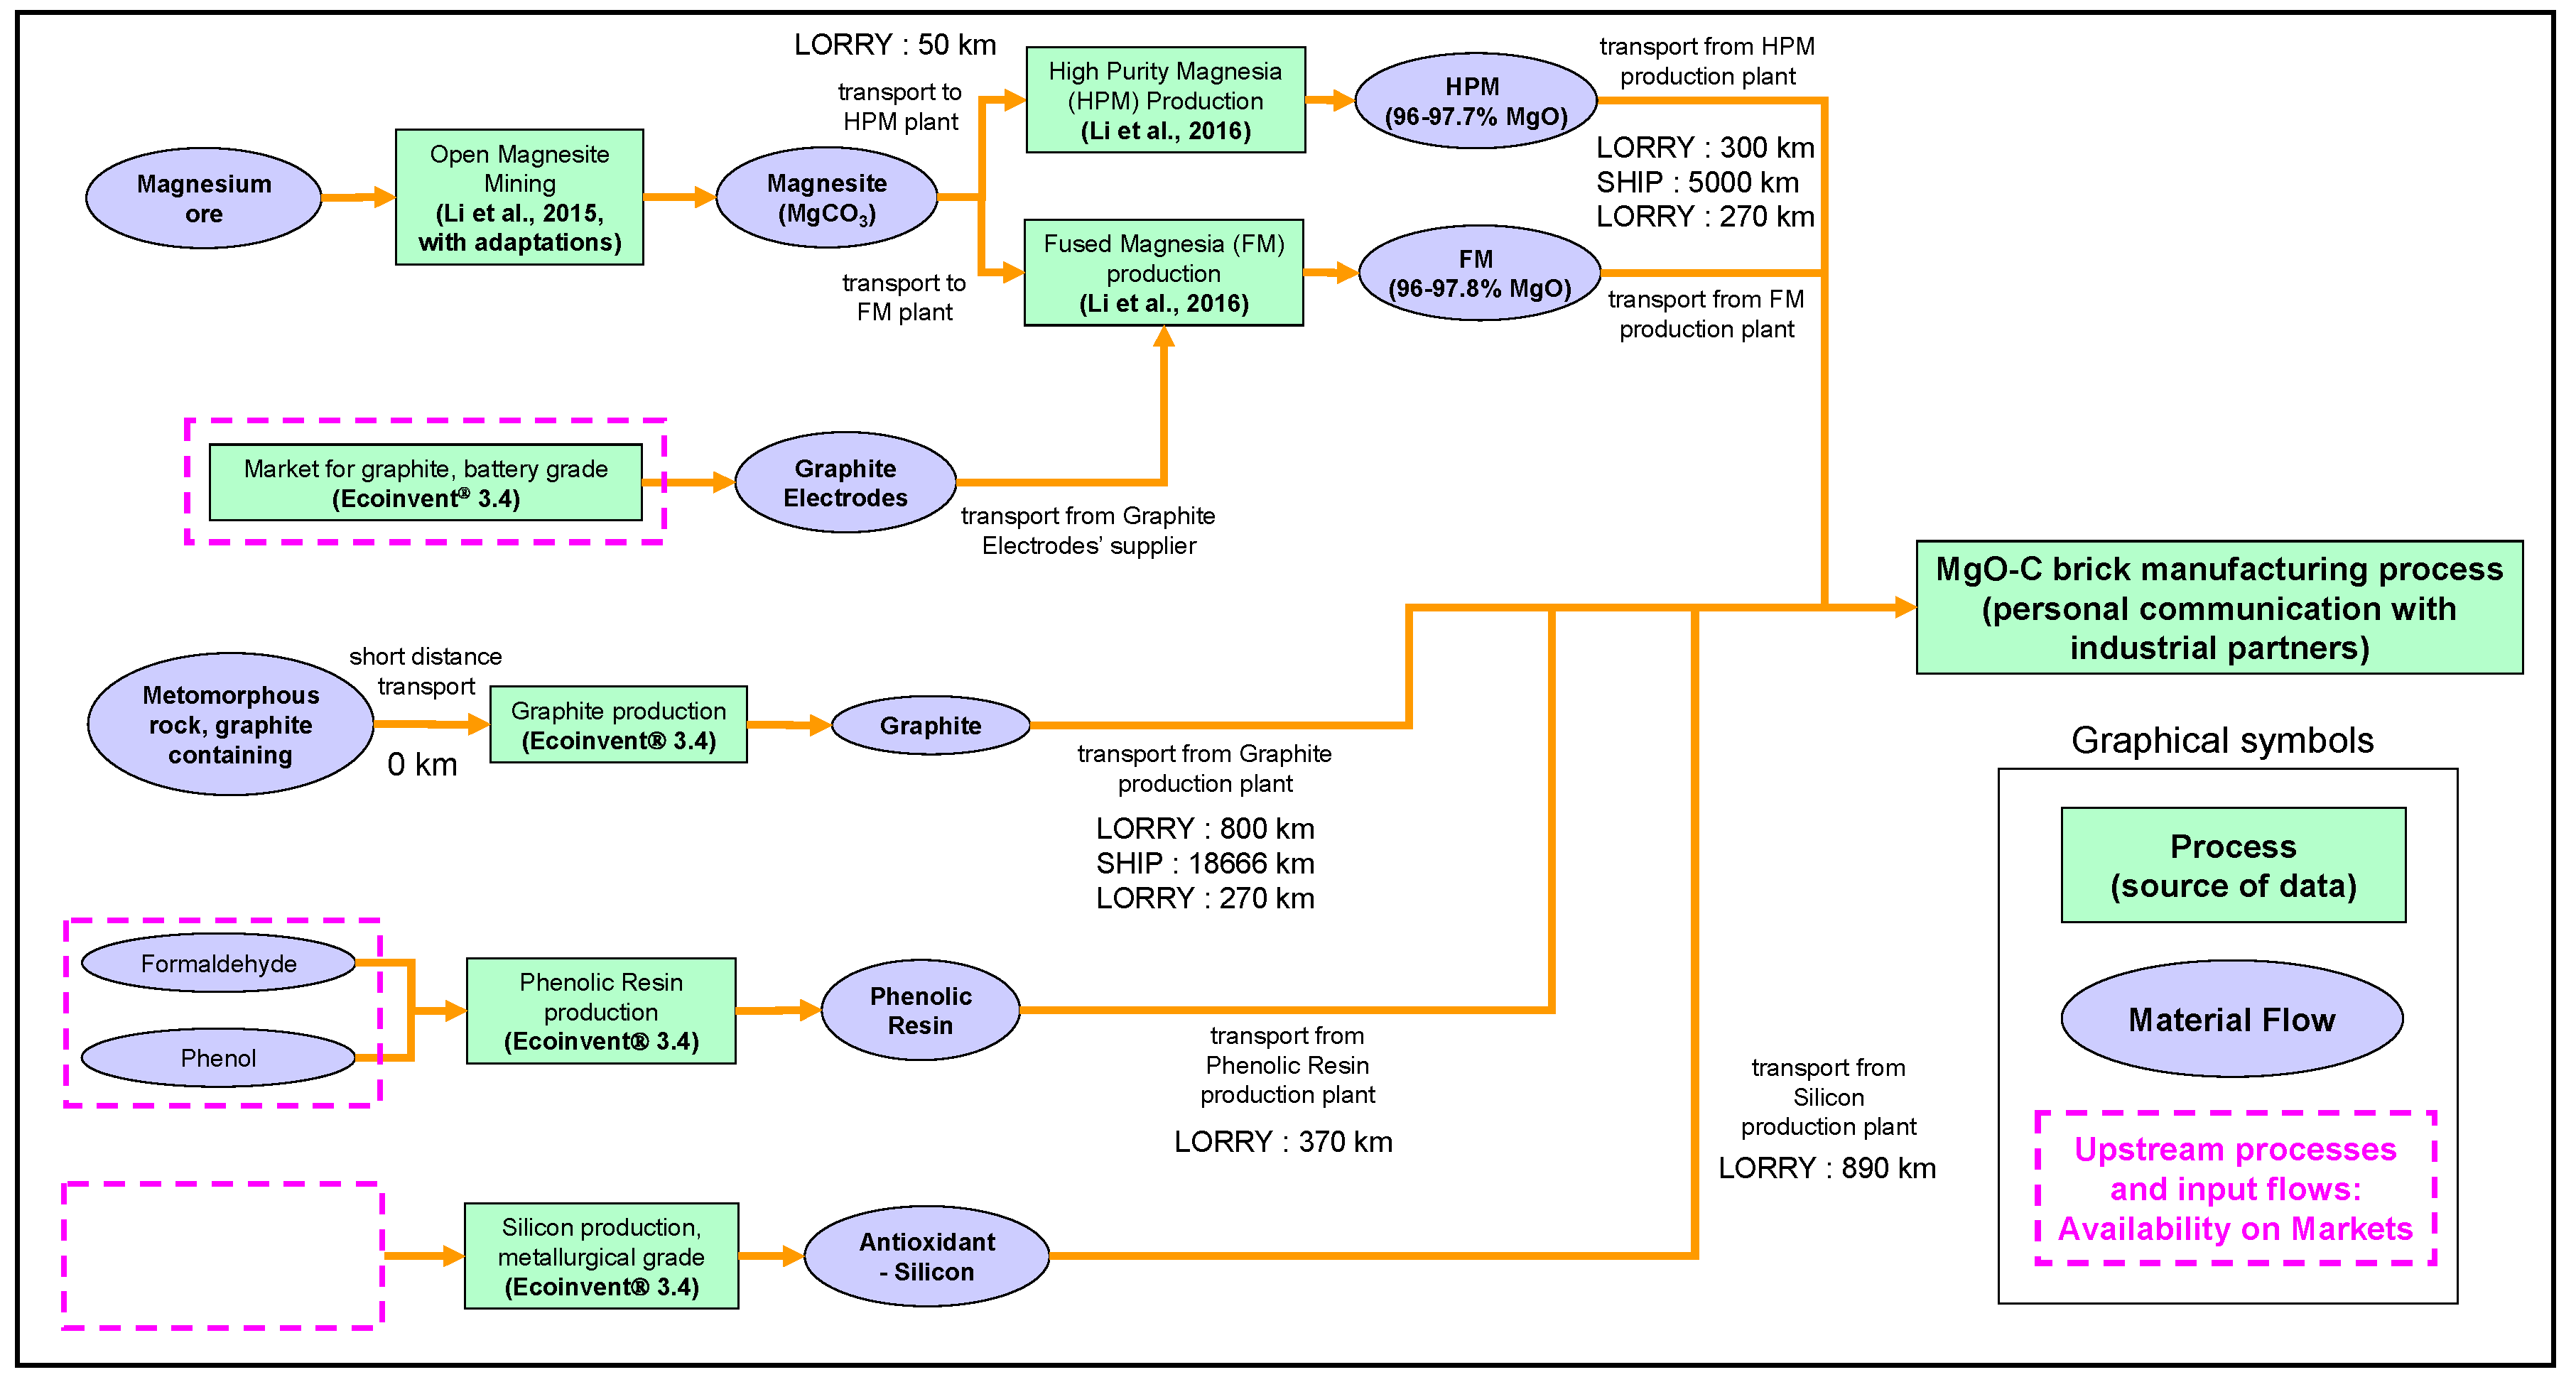
Figure 3.
Suppliers’ chain for the production of Carbonless bricks.
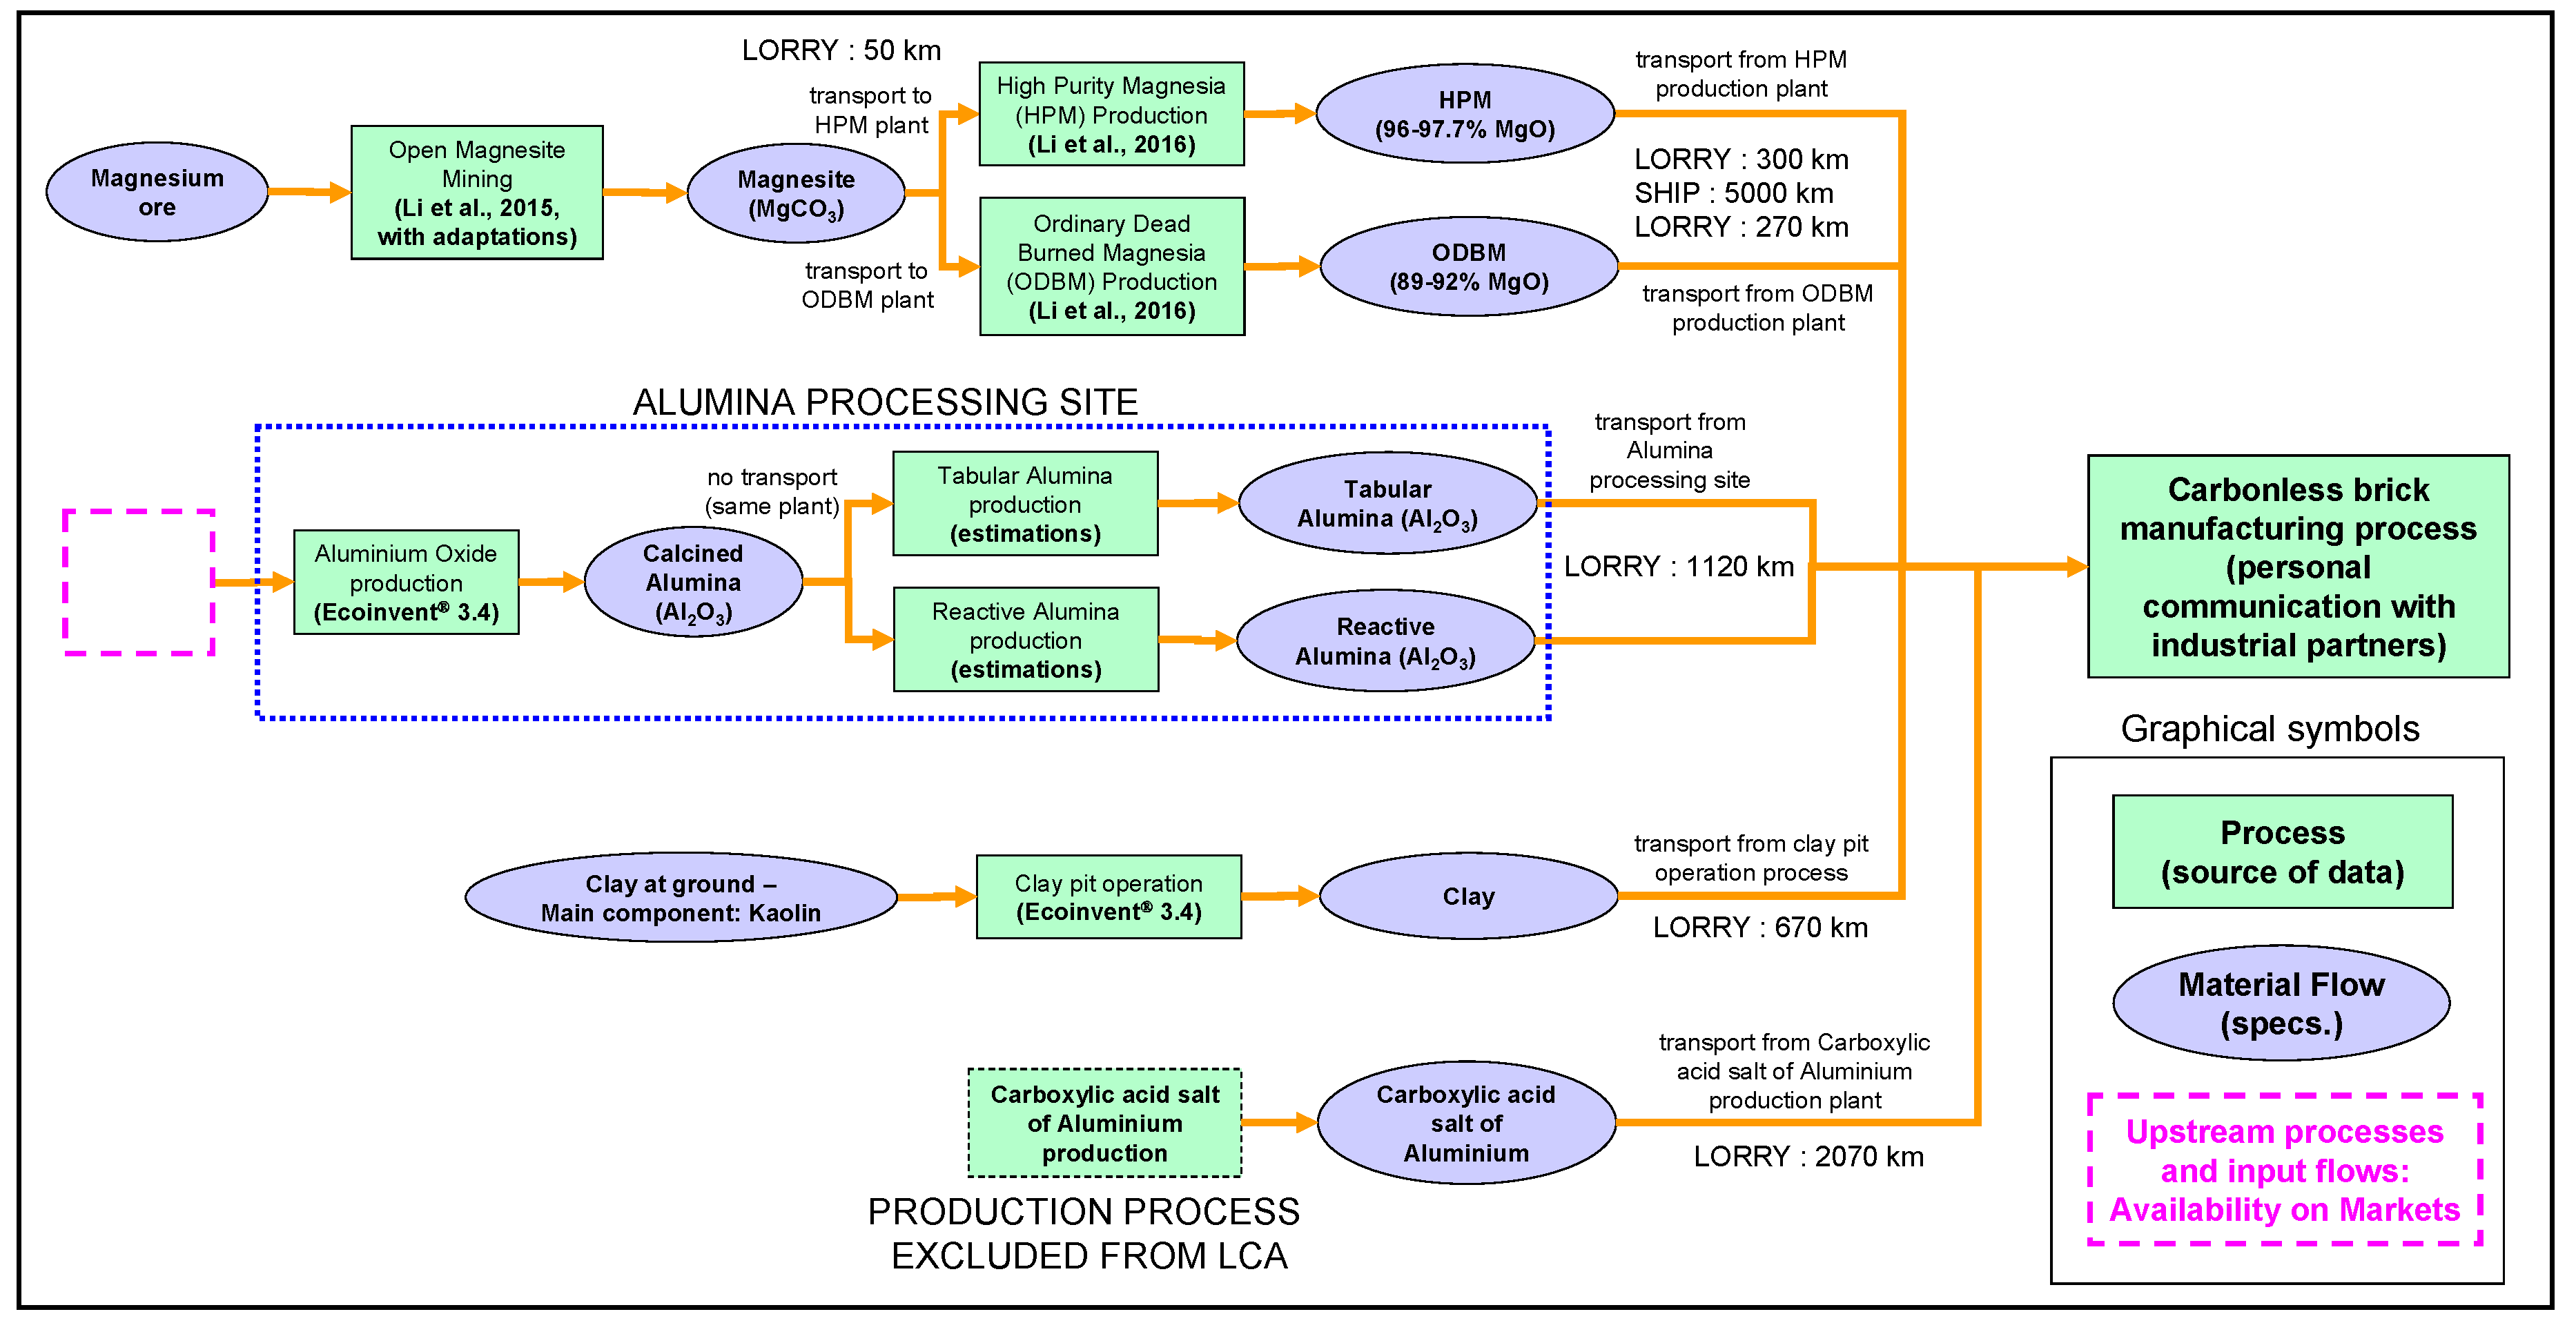
Figure 4.
Radar chart of the ReCiPe Midpoint (H) impact indicators as relative values for the two illustrated product systems.
Figure 4.
Radar chart of the ReCiPe Midpoint (H) impact indicators as relative values for the two illustrated product systems.

Figure 5.
Process contributions to impact indicators for MgO-C bricks.
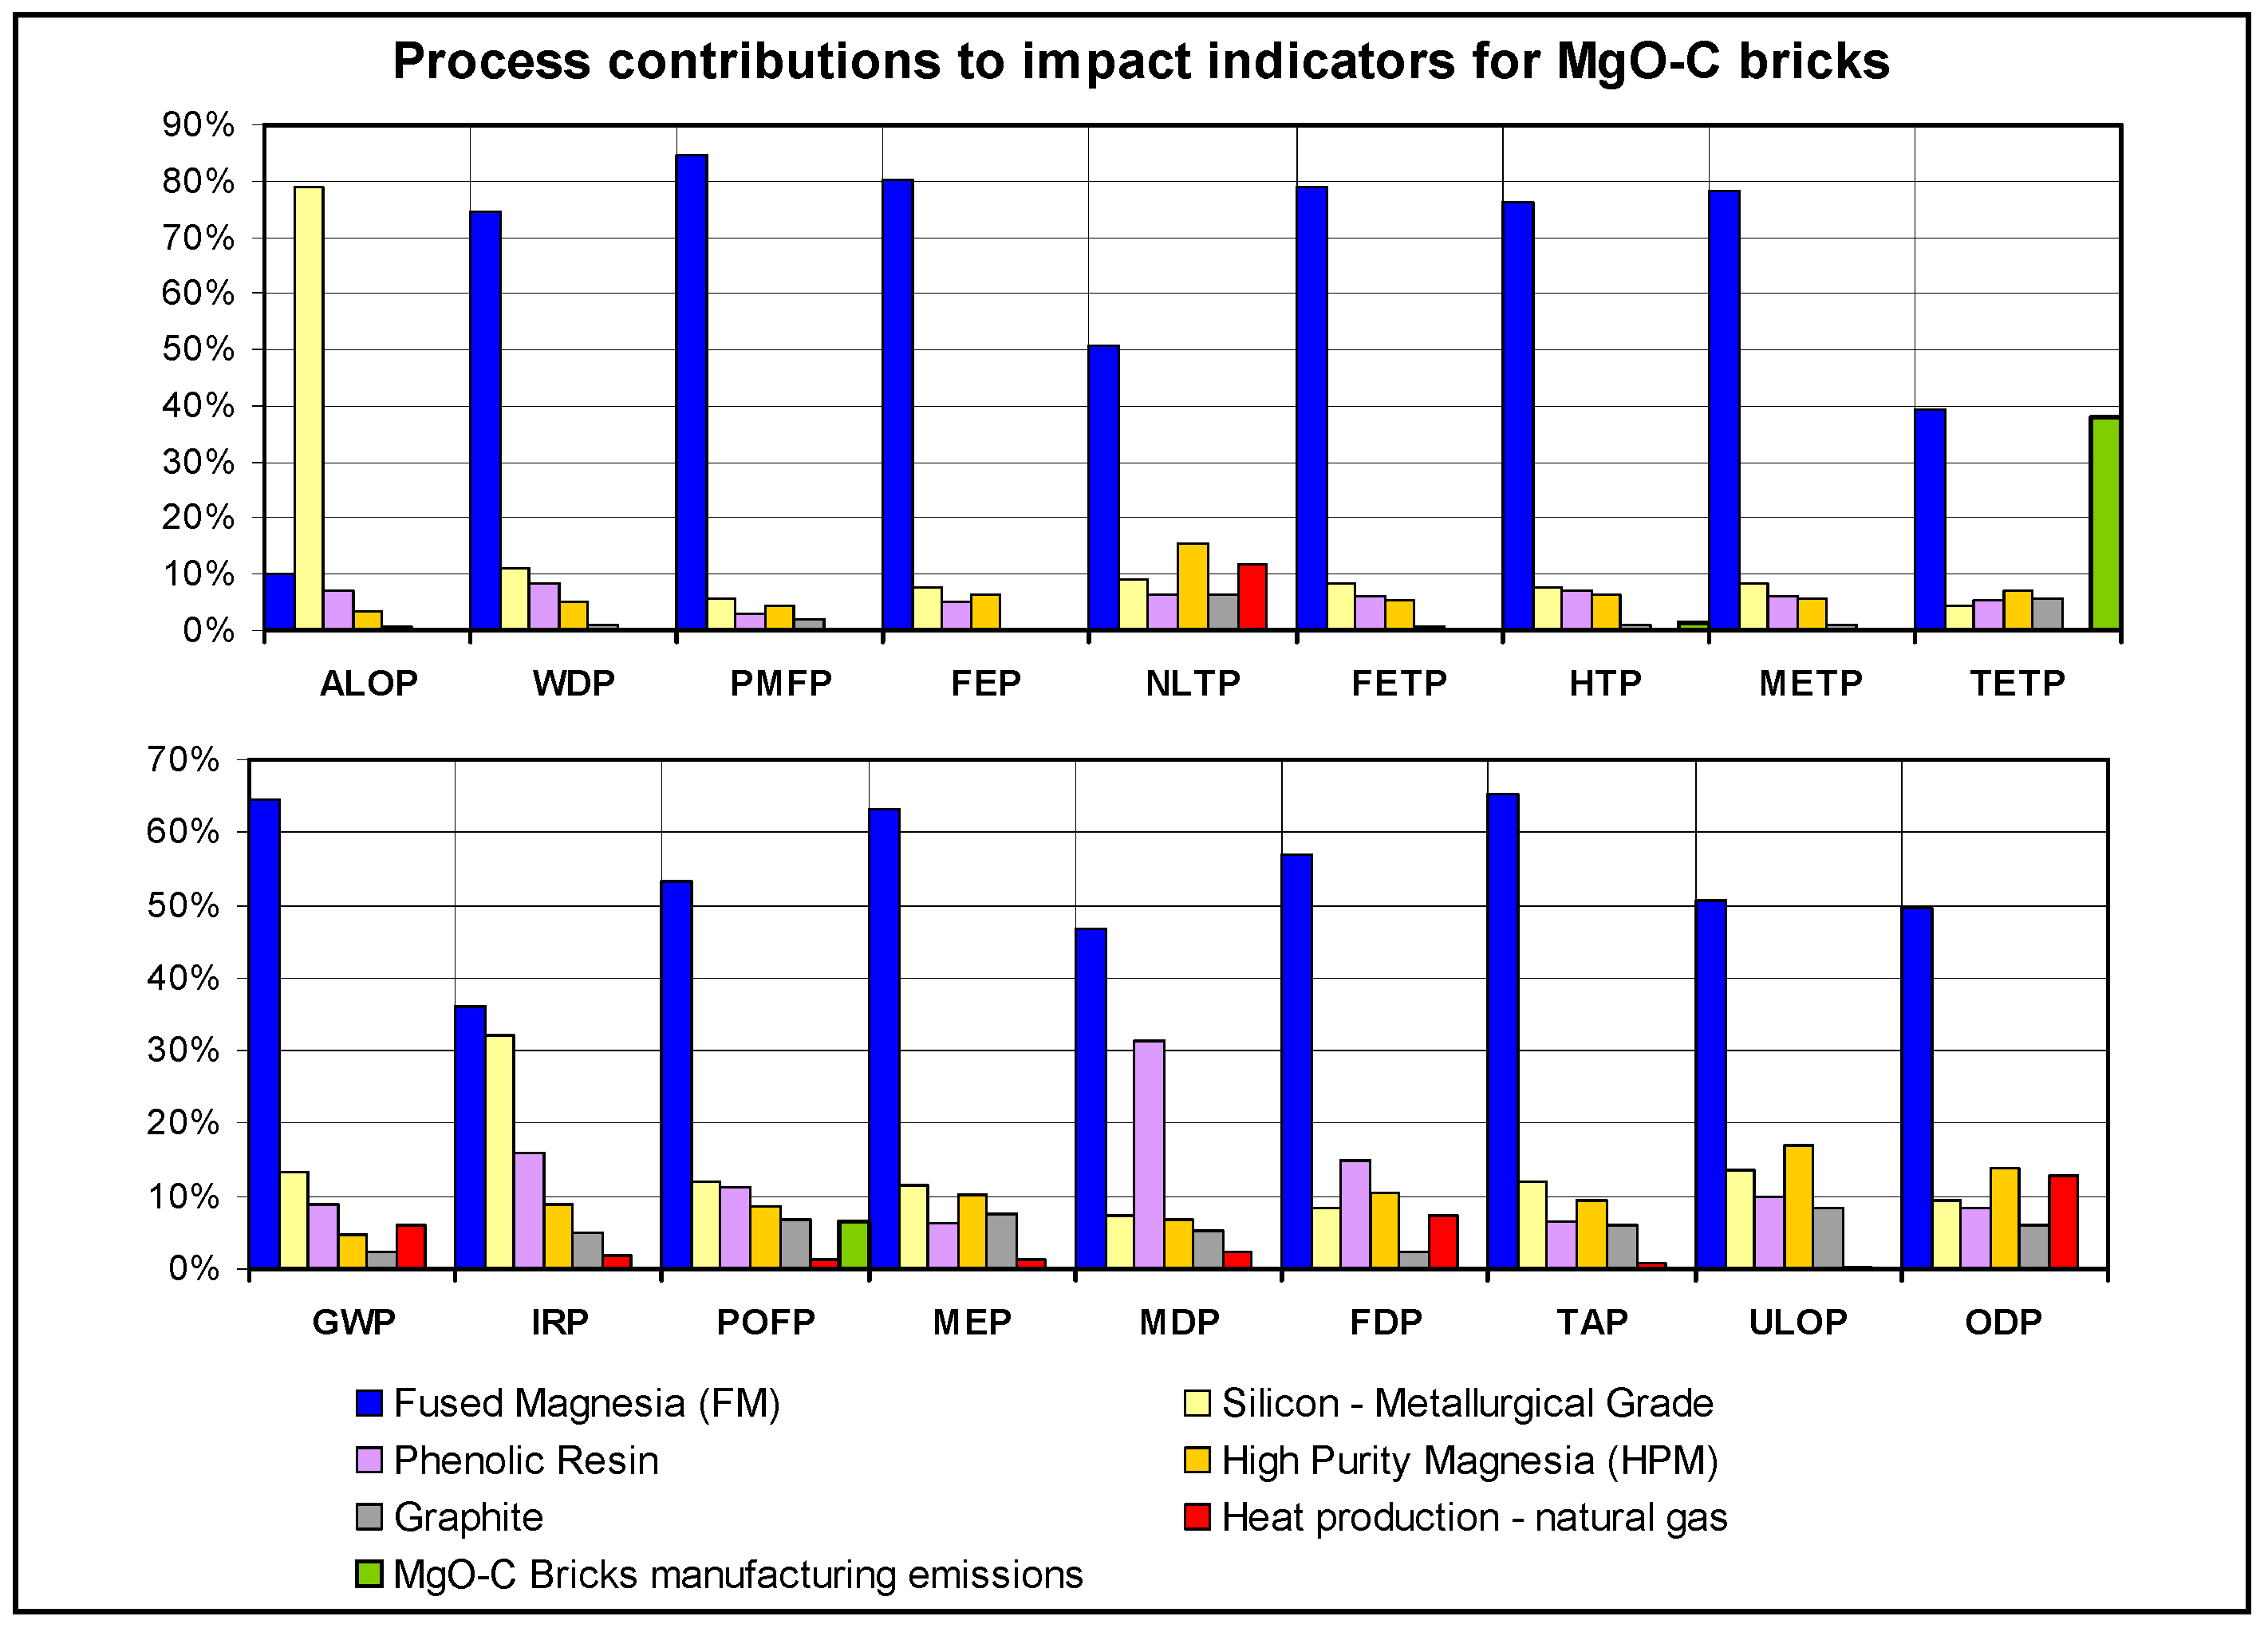
Figure 6.
Process contributions to impact indicators for Carbonless bricks.
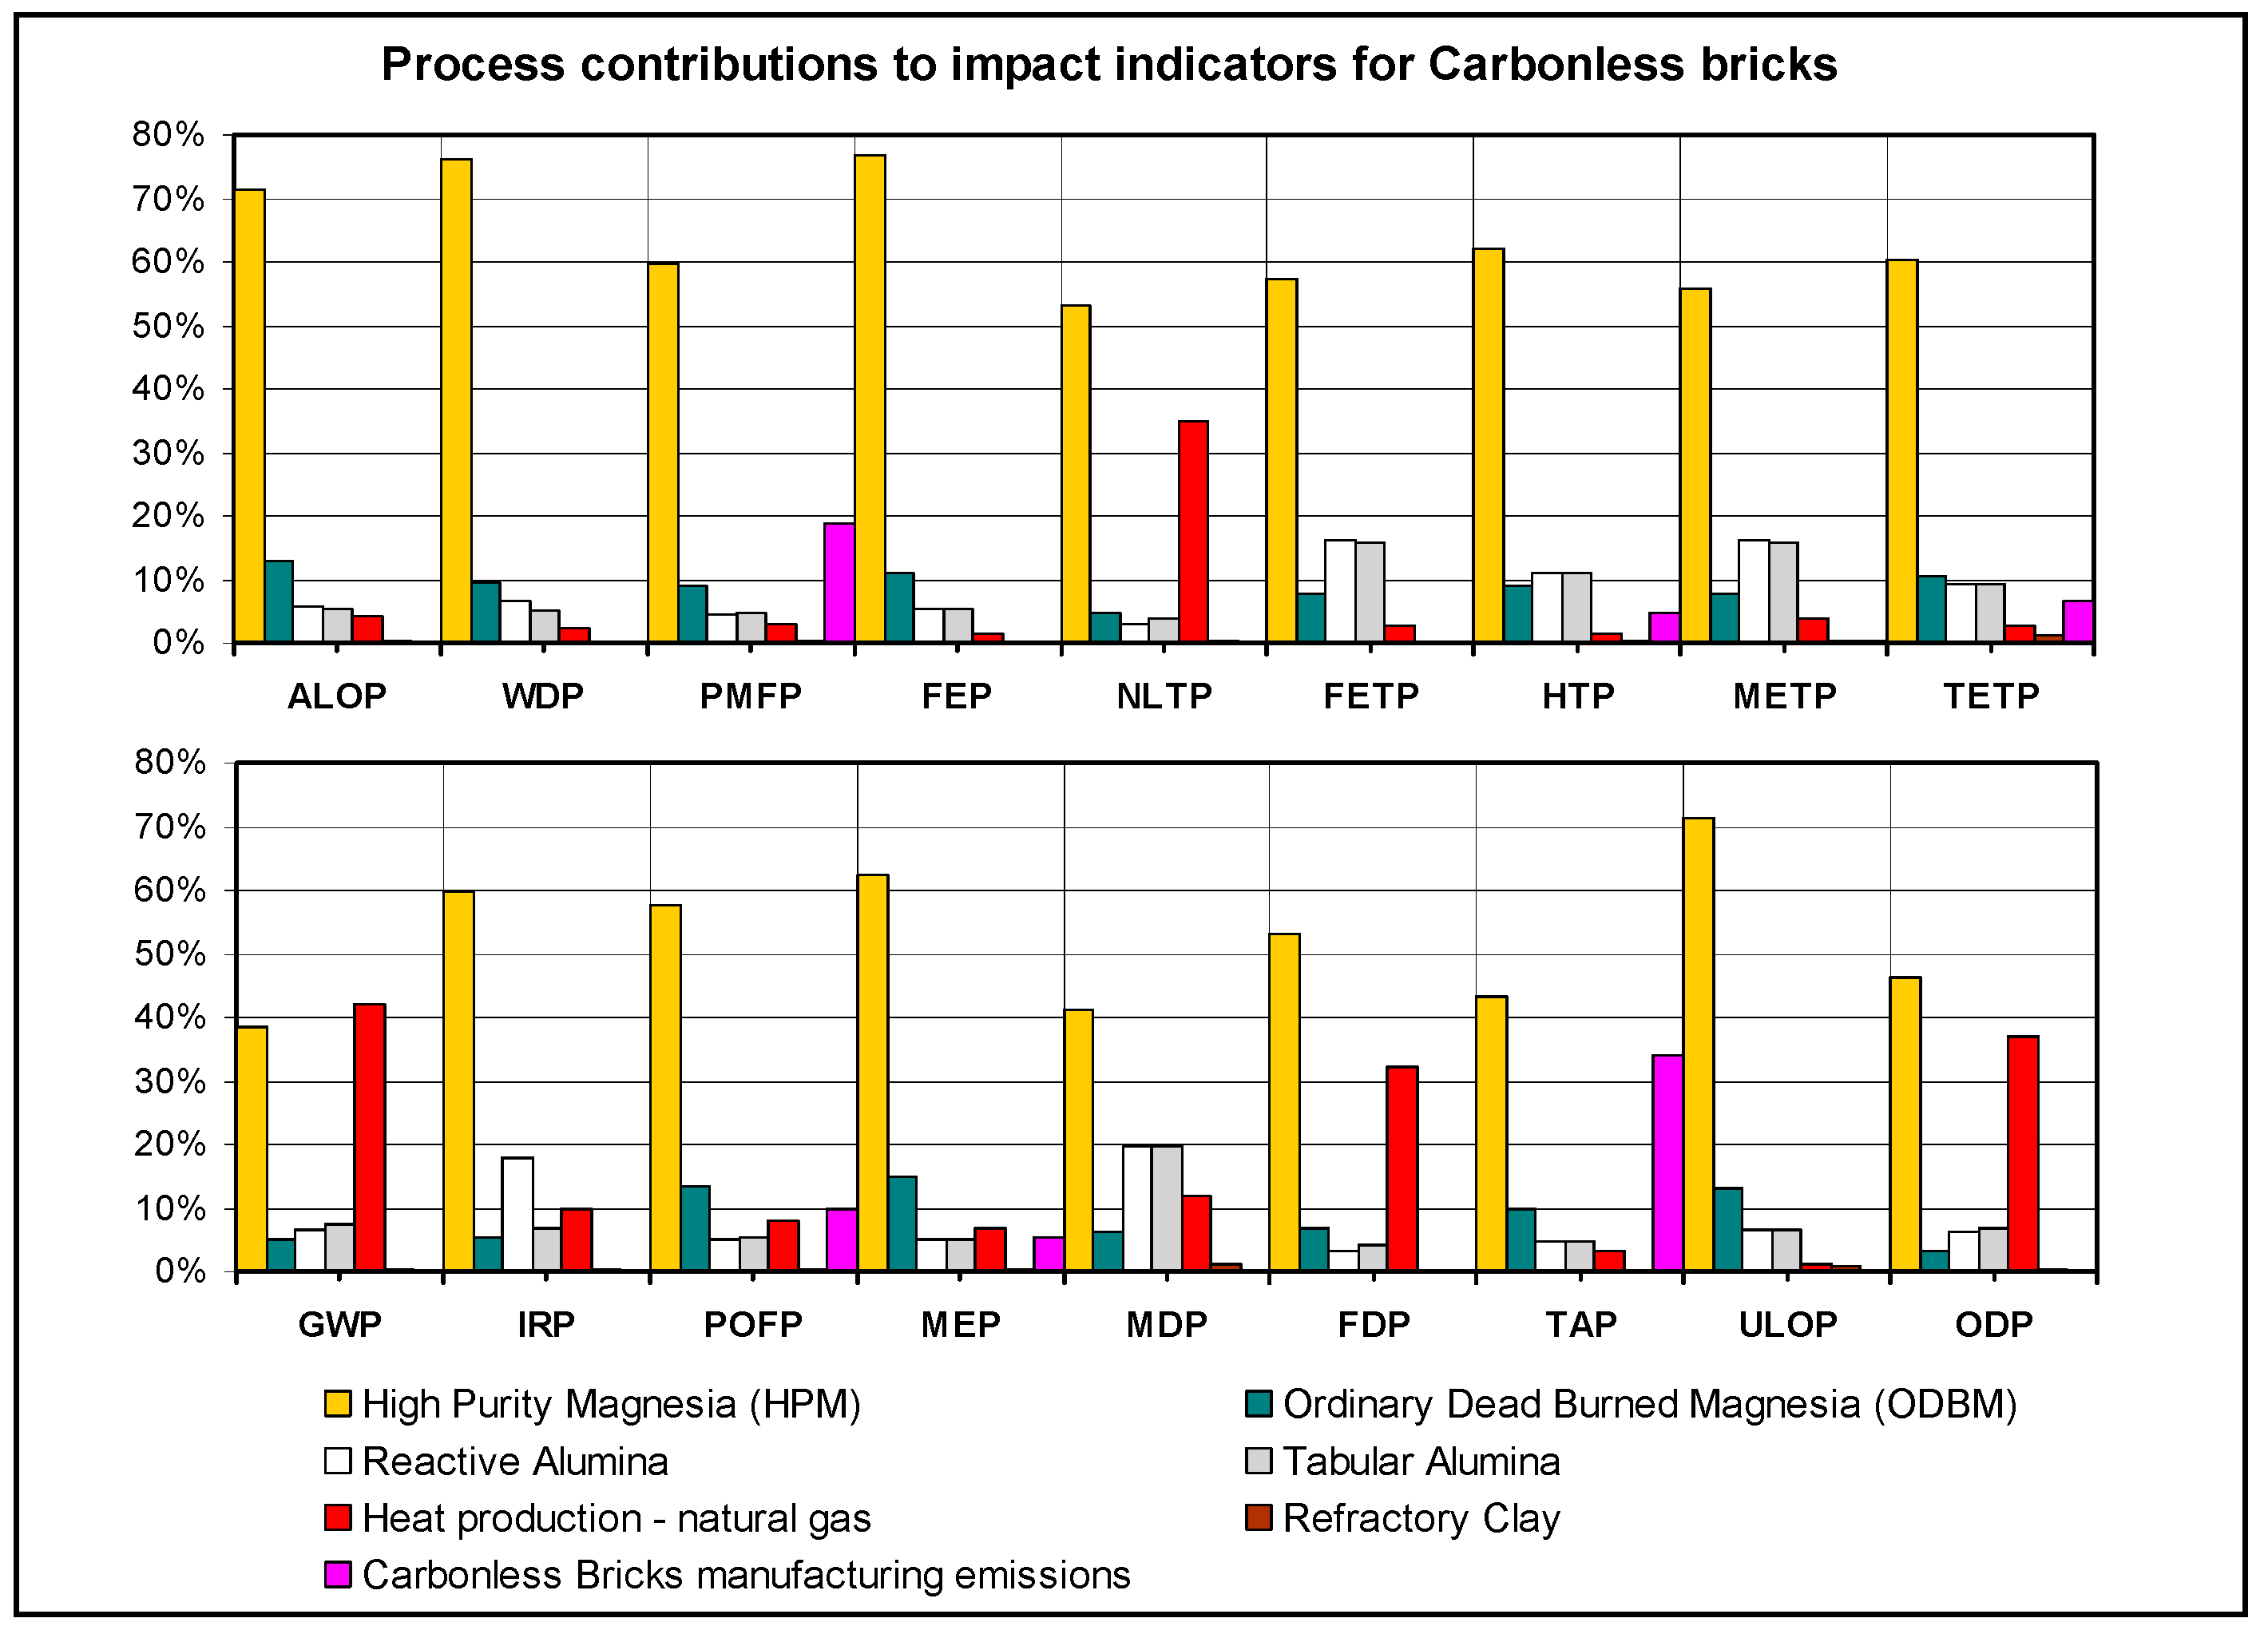
Figure 7.
Raw material transport contributions to impact indicators for MgO-C bricks.

Figure 8.
Raw material transport contributions to impact indicators for Carbonless bricks.

Figure 9.
Radar chart of the ReCiPe Midpoint (H) impact indicators as relative values, reporting the variant for the reference bricks’ product system in which FM is entirely substituted by HPM.
Figure 9.
Radar chart of the ReCiPe Midpoint (H) impact indicators as relative values, reporting the variant for the reference bricks’ product system in which FM is entirely substituted by HPM.

Table 1.
Weight percentage composition of the two compared refractory bricks (DBM: dead burnt magnesia—FM: fused magnesia—90/97: attained purity grade 90% or 97% of magnesia content).
Table 1.
Weight percentage composition of the two compared refractory bricks (DBM: dead burnt magnesia—FM: fused magnesia—90/97: attained purity grade 90% or 97% of magnesia content).
| Raw Material | MgO-C Mass % | Carbonless Mass % |
|---|---|---|
| DBM97 | 21 | 74.88 |
| DBM90 | / | 14.97 |
| FM97 | 60 | / |
| Graphite | 12 | / |
| Phenolic resin | 5 | / |
| Antioxidants (silicon) | 2 | / |
| Tabular alumina | / | 4 |
| Reactive alumina | / | 4 |
| Clay | / | 2 |
| Carboxylic acid salt of Aluminum | / | 0.15 |
| Total | 100 | 100 |
Table 2.
Main differences in the manufacturing process of the two types of bricks.
| Phase & Equipment | |||
|---|---|---|---|
| Molding Phase in a Hydraulic Press | Baking/Sintering Phase in a Gas Combustion Tunnel Kiln | ||
| Type of Pressing | Temperature and Duration | Energy Consumption (Thermal Energy) | |
| MgO-C Reference Bricks | Single press cycle at 2000 t | 200 °C for 24 h | 1800 MJ/t |
| Carbonless Bricks | Single press cycle at 1600 t | Drying at 100 °C for several hours – Sintering at around 1600 °C for around one hour | 5430 MJ/t |
Table 3.
Weight percentage adjustments for the MgO-C reference recipe.
| Raw Material | Before Heating | After Heating | Re-calculated Mass % |
|---|---|---|---|
| DBM97 | 21 | 21 | 21.54 |
| FM97 | 60 | 60 | 61.54 |
| Graphite | 12 | 12 | 12.31 |
| Phenolic resin (in structure) | 5 | 2.5 | 2.56 |
| Phenolic resin (volatile) | / | 2.5 | 2.56 |
| Antioxidants (silicon) | 2 | 2 | 2.05 |
| Total (Solid Mass fraction only) | 100 | 97.5 | 100 |
Table 4.
Emissions as mol% and as weight% composition for a novolac-type phenolic resin, and as mass (with the assumed volatile fraction) referred to one tonne of refractory bricks.
Table 4.
Emissions as mol% and as weight% composition for a novolac-type phenolic resin, and as mass (with the assumed volatile fraction) referred to one tonne of refractory bricks.
| Substance | Water | CO | CO2 | CH4 | Phenol | Xylenol | Benzene | Toluene | H2 |
|---|---|---|---|---|---|---|---|---|---|
| mol% (at 1000 °C) | 23.4 | 5.5 | 1.6 | 10 | 7.1 | 1.8 | 0.2 | 0.3 | 50.1 |
| Molecular weight (g/mol) | 18.0153 | 28.0101 | 44.0095 | 16.0425 | 94.1112 | 122.1600 | 78.1118 | 92.1384 | 2.0159 |
| Weight% | 22.93 | 8.38 | 3.83 | 8.72 | 36.34 | 11.96 | 0.85 | 1.50 | 5.49 |
| Mass (kg) | 5.878 | 2.148 | 0.982 | 2.237 | 9.318 | 3.066 | 0.218 | 0.385 | 1.408 |
Table 5.
Original literature data values and adjusted LCI for the process “Open Magnesite Minin”.
| Input/Output | Flow | Value in [22] | Adjusted Value for Yield = 0.5 |
|---|---|---|---|
| Materials consumption | Strip mine (kg) | 1087 1 | 2000 |
| Water (m3) | 0.0065 | 0.011960 | |
| Energy consumption | Electricity (kWh) | 0.327 | 0.601656 |
| Diesel (kg) | 0.268 | 0.493100 | |
| Emissions to air | CO2 (kg) | 0.069215 | 0.127351 |
| CO (kg) | 0.010648 | 0.019592 | |
| NOx (kg) | 0.005686 | 0.010462 | |
| Dust (kg) | 0.01076 | 0.019798 | |
| Water vapour (m3) | 0.0065 | 0.011960 | |
| Waste | Magnesite tailings (kg) | 51 (60%) | 600 |
| Valuable materials | Tailings powder from open magnesite mining (kg) | 34 (40%) | 400 |
| Output wanted | Magnesite Extracted (kg) | 1000 | 1000 |
1 The mass balance with this original value is not respected since it should be 1085 kg.
Table 6.
Absolute values of the impact indicators and relative reductions (in brackets) for the two product systems of reference bricks and Carbonless bricks.
Table 6.
Absolute values of the impact indicators and relative reductions (in brackets) for the two product systems of reference bricks and Carbonless bricks.
| Impact Category | MgO-C Ref. Bricks | Carbonless Bricks |
|---|---|---|
| Agricultural Land Occupation (m2a) | 74.27 | 11.63 (−84.3%) |
| Water Depletion (m3) | 6.67 | 1.49 (−77.6%) |
| Particulate Matter Form. (kg PM10-Eq) | 11.14 | 2.83 (−74.6%) |
| Freshwater Eutrophication (kg P-Eq) | 1.41 | 0.41 (−71%) |
| Freshwater Ecotoxicity (kg 1.4-DCB-Eq) | 30.61 | 10.21 (−66.6%) |
| Human Toxicity (kg 1.4-DCB-Eq) | 985.37 | 352.45 (−64.2%) |
| Marine Ecotoxicity (kg 1.4-DCB-Eq) | 28.16 | 10.26 (−63.6%) |
| Terrestrial Ecotoxicity (kg 1.4-DCB-Eq) | 1.81E-1 | 7.38E-2 (−59.2%) |
| Climate Change—GWP100 (kg CO2-Eq) | 2059.04 | 894.86 (−56.5%) |
| Ionizing Radiation (kg U235-Eq) | 78.74 | 41.37 (−47.5%) |
| Photochem. Oxidant Form. (kg NMVOC) | 7.68 | 4.04 (−47.5%) |
| Marine Eutrophication (kg N-Eq) | 2.28 | 1.31 (−42.7%) |
| Metal Depletion (kg Fe-Eq) | 26.31 | 15.38 (−41.5%) |
| Fossil Depletion (kg oil-Eq) | 744.43 | 504.07 (−32.3%) |
| Terrestrial Acidification (kg SO2-Eq) | 10.08 | 7.56 (−25%) |
| Urban Land Occupation (m2a) | 17.03 | 14.18 (−16.7%) |
| Natural Land Transformation (m2) | 2.61E-1 | 2.67E-1 (+2.2%) |
| Ozone Depletion (kg CFC-11-Eq) | 1.23E-4 | 1.27E-4 (+3.7%) |
Table 7.
Absolute values of the impact indicators and relative reductions (in brackets) for the two examined product systems (carbonless bricks and reference bricks) and for the variant of reference bricks with FM substituted by HPM.
Table 7.
Absolute values of the impact indicators and relative reductions (in brackets) for the two examined product systems (carbonless bricks and reference bricks) and for the variant of reference bricks with FM substituted by HPM.
| Impact Category | MgO-C Ref. Bricks | Carbonless Bricks | MgO-C Reference Bricks with FM Substituted by HPM |
|---|---|---|---|
| Particulate Matter Form. (kg PM10-Eq) | 11.14 | 2.83 (−74.6%) | 3.095 (−72.2%) |
| Marine Ecotoxicity (kg 1.4-DCB-Eq) | 28.16 | 10.26 (−63.6%) | 10.85 (−61.5%) |
| Freshwater Ecotoxicity (kg 1.4-DCB-Eq) | 30.61 | 10.21 (−66.6%) | 11.24 (−63.3%) |
| Human Toxicity (kg 1.4-DCB-Eq) | 985.37 | 352.45 (−64.2%) | 413.48 (−58%) |
| Climate Change—GWP100 (kg CO2-Eq) | 2059.04 | 894.86 (−56.5%) | 1011.3 (−50.9%) |
| Freshwater Eutrophication (kg P-Eq) | 1.41 | 0.41 (−71%) | 0.53 (−62.1%) |
| Fossil Depletion (kg oil-Eq) | 744.43 | 504.07 (−32.3%) | 541.66 (−27.2%) |
| Marine Eutrophication (kg N-Eq) | 2.28 | 1.31 (−42.7%) | 1.51 (−33.9%) |
| Water Depletion (m3) | 6.67 | 1.49 (−77.6%) | 2.63 (−60.6%) |
| Metal Depletion (kg Fe-Eq) | 26.31 | 15.38 (−41.5%) | 19.19 (−27%) |
| Photochem. Oxidant Form. (kg NMVOC) | 7.68 | 4.04 (−47.5%) | 5.49 (−28.5%) |
| Terrestrial Ecotoxicity (kg 1.4-DCB-Eq) | 1.81E-1 | 7.38E-2 (−59.2%) | 1.46E-1 (−19.1%) |
| Ionising Radiation (kg U235-Eq) | 78.74 | 41.37 (−47.5%) | 70.57 (−10.4%) |
| Urban Land Occupation (m2a) | 17.03 | 14.18 (−16.7%) | 16.69 (−2%) |
| Agricultural Land Occupation (m2a) | 74.27 | 11.63 (−84.3%) | 73.64 (−0.9%) |
| Terrestrial Acidification (kg SO2-Eq) | 10.08 | 7.56 (−25%) | 6.2 (−38.5%) |
| Ozone Depletion (kg CFC-11-Eq) | 1.23E-4 | 1.27E-4 (+3.7%) | 1.1E-4 (−10.2%) |
| Natural Land Transformation (m2) | 2.61E-1 | 2.67E-1 (+2.2%) | 2.45E-1 (−6.4%) |
© 2019 by the authors. Licensee MDPI, Basel, Switzerland. This article is an open access article distributed under the terms and conditions of the Creative Commons Attribution (CC BY) license (http://creativecommons.org/licenses/by/4.0/).
Share and Cite
MDPI and ACS Style
Boenzi, F.; Ordieres-Meré, J.; Iavagnilio, R. Life Cycle Assessment Comparison of Two Refractory Brick Product Systems for Ladle Lining in Secondary Steelmaking. Sustainability 2019, 11, 1295. https://doi.org/10.3390/su11051295
AMA Style
Boenzi F, Ordieres-Meré J, Iavagnilio R. Life Cycle Assessment Comparison of Two Refractory Brick Product Systems for Ladle Lining in Secondary Steelmaking. Sustainability. 2019; 11(5):1295. https://doi.org/10.3390/su11051295
Chicago/Turabian StyleBoenzi, Francesco, Joaquín Ordieres-Meré, and Raffaello Iavagnilio. 2019. "Life Cycle Assessment Comparison of Two Refractory Brick Product Systems for Ladle Lining in Secondary Steelmaking" Sustainability 11, no. 5: 1295. https://doi.org/10.3390/su11051295
Note that from the first issue of 2016, this journal uses article numbers instead of page numbers. See further details here.