The Role of Green Attributes in Production Processes as Well as Their Impact on Operational, Commercial, and Economic Benefits

 , , , and
Abstract
:1. Introduction
1.1. Green Attributes in a Production Process
- Use of environmentally friendly raw materials [17]
1.2. Benefits of a Green Manufacturing Process
1.3. Research Problem, Objective, and Contribution
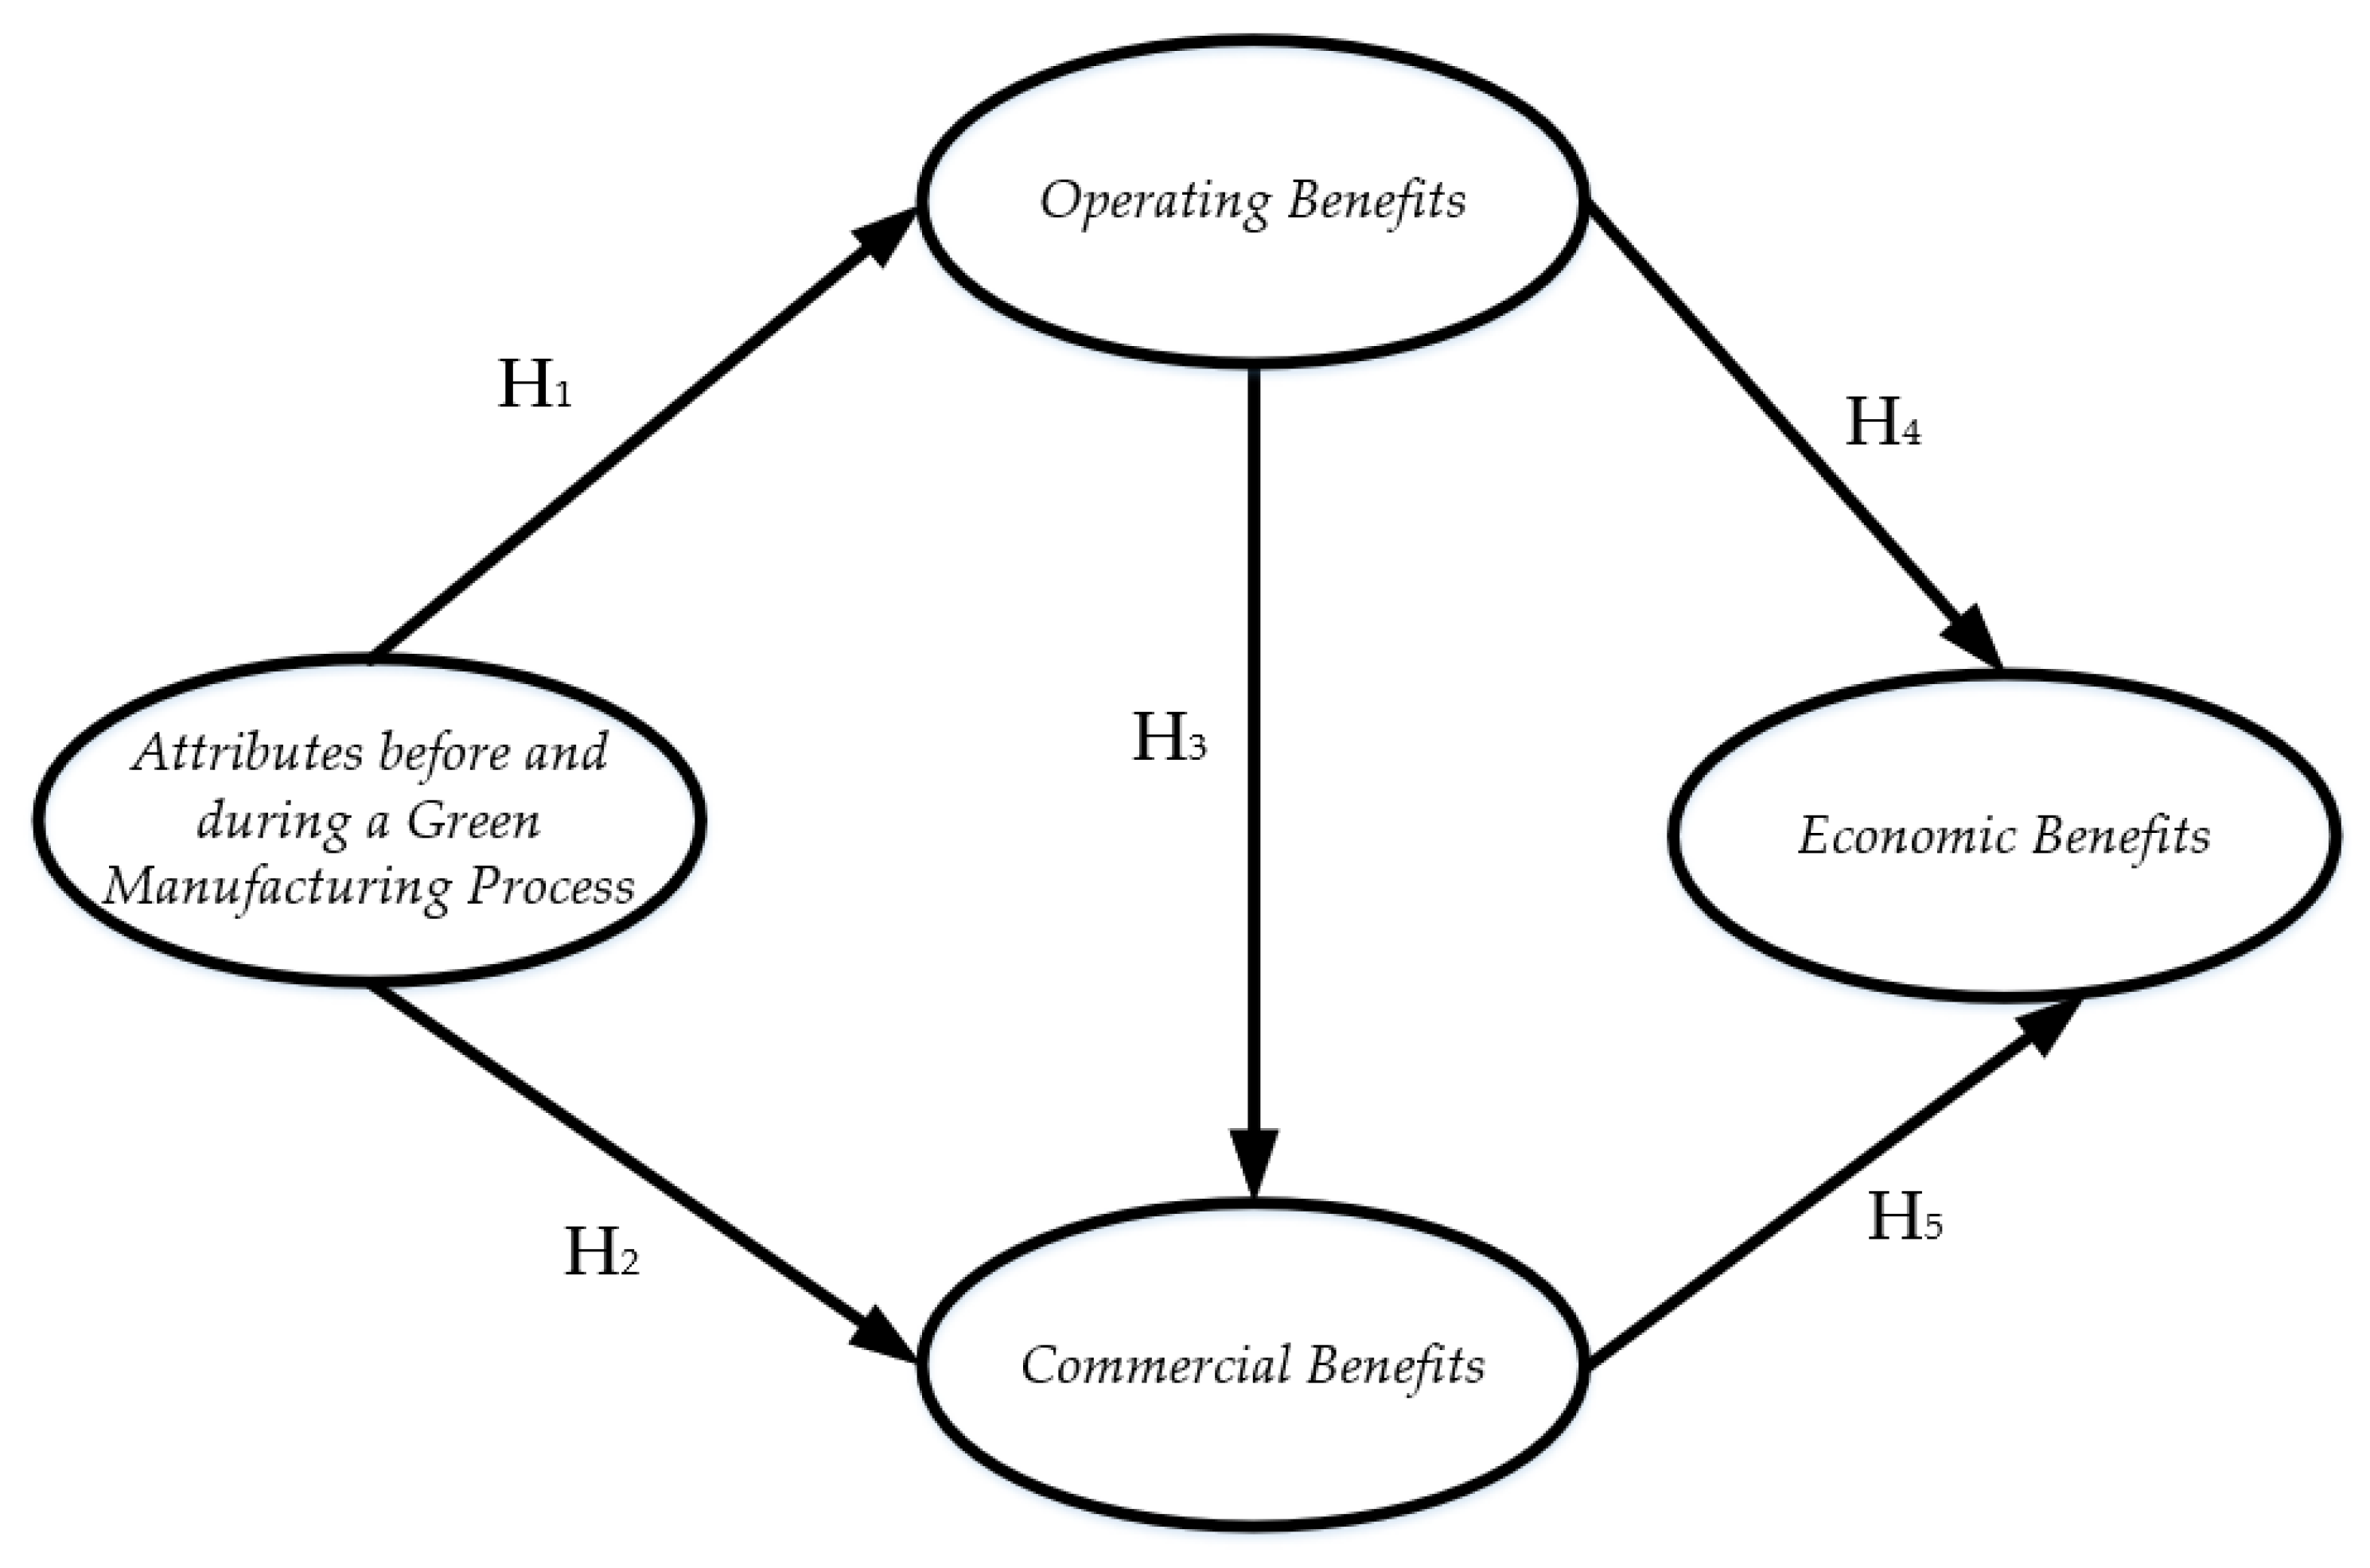
2. Hypothesis and Literature Review
3. Materials and Methods
3.1. Literature Review
3.2. Survey Design
3.3. Data Acquisition
3.4. Statistical Debugging
- Identifying missing values that were not answered in the survey; if the percentage of missing values is under 10%, then it is replaced by the median of the item; however, if the percentage is higher, then that questionnaire is discarded.
- Identifying extreme values in each item in order to replace it with the median, since the values obtained are on a Likert scale.
- Identifying uncommitted respondents by estimating the standard deviation in every questionnaire; cases with a standard deviation under 0.35 are discarded.
3.5. Data Validation
- R2 and adjusted R2 are estimated to measure the predictive validity of the model, where values greater than 0.2 are required [60].
- Q2 is estimated to measure the non-parametric predictive validity and values greater than zero and similar to R2 are expected [13].
- The Cronbach’s alpha and composite reliability index are used to measure the internal reliability, which requires values greater than 0.7 [64]; these indexes are obtained iteratively, since sometimes by eliminating any attributes or benefits, their values increased.
- The Average Variance Extracted (AVE) is used to measure the convergent validity, where values greater than 0.5 are required [28].
3.6. Statistical Description of the Sample
3.7. Development of the Structural Equation Modelling
- Y is a dependent latent variable
- β0 is the regression coefficient for the intercept
- βi values are the regression coefficients (for independent latent variables 1 to p) that have a direct effect on Y.
- βi is the estimated value for a relationship between two variables;
- 1.96 is the Z value for a 95% confidence value for a two-tailed test;
- SE is the standard error for βi.
- Average path coefficient (APC), where p-associated values under 0.05 are required.
- Average R-squared (ARS) and Average Adjusted R-squared (AARS), which require p-associated values under 0.05.
- Average block variance inflation factor (AVIF) and Average full collinearity VIF (AFVIF), which require values under 5.
- Tenenhaus GoF Index (GoF) that estimates the data adjustment in the model, which requires values over 0.36.
3.8. Sensitivity Analysis
4. Results
4.1. Demographic Data of the Sample
4.2. Latent Variables Validation
4.3. Structural Equation Model
4.4. Sensitivity Analysis
5. Practical and Theoretical Implications
5.1. Theoretical Implications
5.2. Practical Implications
- The GM implementation is a continuous process that must be monitored throughout the production system; there are attributes that must be evaluated before and during the production process.
- The execution of activities that provide the Attributes before and during a Green Manufacturing Process helps to obtain Operating Benefits, since there is a probability that this will occur of 0.485 and Commercial Benefits with a probability of 0.566 to happen. In addition, the previous information indicates that managers must have a tracking system for GM practices in order to have control of them and make the necessary adjustments and guarantee the desired benefits, especially those of an operational type, since the commercial and economic benefits depend on them. Also, in the event of low levels of execution of the activities associated with the obtained attributes that characterize the GM process, there is also a risk of having low Operating Benefits (probability of 0.416) and Commercial Benefits (probability of 0.485).
- Operating Benefits at a high level guarantee the obtaining of high Commercial Benefits (probability of 0.586); therefore, the way that it is implemented should be a priority for managers when implementing GM. However, if these operating benefits are low for any reason, the risk of obtaining low Commercial Benefits is 0.762; if there is a very high value, since the implementation is associated with aspects related to the product quality and cost, it means these are not attractive to the customer, so the company loses market opportunities.
- According to the previous information, it is concluded that high levels of Operating Benefits bring Commercial Benefits, and these in turn bring Economic Benefits. In fact, it can be observed that it is not possible to have high economic benefits when there are low Operating Benefits, which again indicates that managers should focus on aspects associated with the cost, quality, and company image. Moreover, there is a high risk of having financial problems when Operating Benefits are not obtained, since when they have low levels, there is a high risk that the Economic Benefits are low (probability of 0.833).
- Companies must guarantee Commercial Benefits at high levels in order to obtain Economic Benefits at that same level (probability of 0.510), since, if there are low levels for the first variable, there is a high risk of also having low levels in Economic Benefits (probability 0.739).
5.3. Future Studies
6. Conclusions
- The monitoring of green attributes before and during the production process allows us to evaluate the company’s GM process and facilitates the obtaining of operational benefits in the production line and commercial benefits to clients.
- The operational benefits obtained from implementing a GM process help to improve the commercial and economic benefits to the companies.
- Commercial Benefits obtained by implementing GM facilitate the increase of economic benefits for companies.
Author Contributions
Funding
Acknowledgments
Conflicts of Interest
Appendix A. Latent variables validation

| Items | Operating Benefits | Commercial Benefits | Economic Benefits | ABP and ADP |
| Increasement in the quality of their processes | 21,569 | |||
| Product design improvement | 21,509 | |||
| Increasement in its technological innovation | 20,976 | |||
| Optimization in the use of available resources | 21,521 | |||
| Low product rework | 21,465 | |||
| Greater competitiveness, productivity, and efficiency | 22,469 | |||
| Increasement in the quality of the final product | 21,682 | |||
| Local market expansion | 22,164 | |||
| Better customer service | 21,920 | |||
| Increasement in the number of products classified as green | 22,032 | |||
| Greater environmental certifications | 21,925 | |||
| Increasement in sales | 21,939 | |||
| Increasement in economic gains | 22,382 | |||
| Reduction of marketing costs | 22,799 | |||
| Reduction of material waste | 22,192 | |||
| Reduction of production costs | 22,711 | |||
| Reduction of workforce for reprocessing | 22,512 | |||
| Cost reduction for guarantees | 22,318 | |||
| Attributes before the process | 24,866 | |||
| Attributes during the process | 24,866 |
| Items | Operating Benefits | Commercial Benefits | Economic Benefits | ABP and ADP | ||||
| Increasement in the quality of their processes | 0.754 | 0.905 | ||||||
| Product design improvement | 0.752 | 0.903 | ||||||
| Increasement in its technological innovation | 0.733 | 0.884 | ||||||
| Optimization in the use of available resources | 0.752 | 0.903 | ||||||
| Low product rework | 0.750 | 0.901 | ||||||
| Greater competitiveness, productivity, and efficiency | 0.786 | 0.936 | ||||||
| Increasement in the quality of the final product | 0.758 | 0.909 | ||||||
| Local market expansion | 0.775 | 0.925 | ||||||
| Better customer service | 0.766 | 0.917 | ||||||
| Increasement in the number of products classified as green | 0.770 | 0.921 | ||||||
| Greater environmental certifications | 0.767 | 0.917 | ||||||
| Increasement in sales | 0.767 | 0.918 | ||||||
| Increasement in economic gains | 0.783 | 0.933 | ||||||
| Reduction of marketing costs | 0.797 | 0.947 | ||||||
| Reduction of material waste | 0.776 | 0.926 | ||||||
| Reduction of production costs | 0.794 | 0.944 | ||||||
| Reduction of workforce for reprocessing | 0.787 | 0.937 | ||||||
| Cost reduction for guarantees | 0.780 | 0.931 | ||||||
| Attributes before the process | 0.869 | 1.018 | ||||||
| Attributes during the process | 0.869 | 1.018 | ||||||
Appendix B. Z ratios and confidence intervals for β
| Latent variables | Operating Benefits | Commercial Benefits | ABP and ADP |
| Operating Benefits | 15.45 | ||
| Commercial Benefits | 17.315 | 5.681 | |
| Economic Benefits | 11.86 | 10.491 |
| Latent variables | Operating Benefits | Commercial Benefits | ABP and ADP | |||
| Operating Benefits | 0.532 | 0.687 | ||||
| Commercial Benefits | 0.601 | 0.754 | 0.153 | 0.315 | ||
| Economic Benefits | 0.396 | 0.553 | 0.344 | 0.502 | ||
References
- Tseng, M.-L.; Islam, M.S.; Karia, N.; Fauzi, F.A.; Afrin, S. A literature review on green supply chain management: Trends and future challenges. Resour. Conserv. Recycl. 2019, 141, 145–162. [Google Scholar] [CrossRef]
- Singh, N.; Jain, S.; Sharma, P. Determinants of proactive environmental management practices in Indian firms: An empirical study. J. Clean. Prod. 2014, 66, 469–478. [Google Scholar] [CrossRef]
- Kara, S.; Singh, A.; Philip, D.; Ramkumar, J. Quantifying green manufacturability of a unit production process using simulation. Proc. CIRP 2015, 29, 257–262. [Google Scholar] [CrossRef]
- Denisa, M.; Zdenka, M. Perception of implementation processes of green logistics in SMEs in Slovakia. Procedia Econ. Financ. 2015, 26, 139–143. [Google Scholar] [CrossRef]
- Maruthi, G.D.; Rashmi, R. Green Manufacturing: It’s tools and techniques that can be implemented in manufacturing sectors. Mater. Today Proc. 2015, 2, 3350–3355. [Google Scholar] [CrossRef]
- Paul, I.D.; Bhole, G.P.; Chaudhari, J.R. A review on green manufacturing: It’s important, methodology and its application. Procedia Mater. Sci. 2014, 6, 1644–1649. [Google Scholar] [CrossRef]
- Thanki, S.; Govindan, K.; Thakkar, J. An investigation on lean-green implementation practices in Indian SMEs using analytical hierarchy process (AHP) approach. J. Clean. Prod. 2016, 135, 284–298. [Google Scholar] [CrossRef]
- Govindan, K.; Diabat, A.; Madan Shankar, K. Analyzing the drivers of green manufacturing with fuzzy approach. J. Clean. Prod. 2015, 96, 182–193. [Google Scholar] [CrossRef]
- Rehman, M.A.A.; Shrivastava, R.L.; Shrivastava, R.R. Comparative analysis of two industries for validating green manufacturing (GM) framework: An Indian scenario. J. Inst. Eng. India Ser. C 2016, 98, 203–218. [Google Scholar] [CrossRef]
- Charmondusit, K.; Gheewala, S.H.; Mungcharoen, T. Green and sustainable innovation for cleaner production in the Asia-Pacific region. J. Clean. Prod. 2016, 134, 443–446. [Google Scholar] [CrossRef]
- Sun, L.-Y.; Miao, C.-L.; Yang, L. Ecological-economic efficiency evaluation of green technology innovation in strategic emerging industries based on entropy weighted TOPSIS method. Ecol. Indic. 2017, 73, 554–558. [Google Scholar] [CrossRef]
- Woo, C.; Kim, M.G.; Chung, Y.; Rho, J.J. Suppliers’ communication capability and external green integration for green and financial performance in Korean construction industry. J. Clean. Prod. 2016, 112, 483–493. [Google Scholar] [CrossRef]
- Chan, H.K.; Yee, R.W.Y.; Dai, J.; Lim, M.K. The moderating effect of environmental dynamism on green product innovation and performance. Int. J. Prod. Econ. 2016, 181, 384–391. [Google Scholar] [CrossRef]
- Oncel, S.S. Green energy engineering: Opening a green way for the future. J. Clean. Prod. 2017, 142, 3095–3100. [Google Scholar] [CrossRef]
- Chen, S.-C.; Hung, C.-W. Elucidating the factors influencing the acceptance of green products: An extension of theory of planned behavior. Technol. Forecast. Soc. Chang. 2016, 112, 155–163. [Google Scholar] [CrossRef]
- Grekova, K.; Calantone, R.J.; Bremmers, H.J.; Trienekens, J.H.; Omta, S.W.F. How environmental collaboration with suppliers and customers influences firm performance: Evidence from Dutch food and beverage processors. J. Clean. Prod. 2016, 112, 1861–1871. [Google Scholar] [CrossRef]
- Rehman, M.A.; Seth, D.; Shrivastava, R.L. Impact of green manufacturing practices on organisational performance in Indian context: An empirical study. J. Clean. Prod. 2016, 137, 427–448. [Google Scholar] [CrossRef]
- Teles, C.D.; Ribeiro, J.L.D.; Tinoco, M.A.C.; ten Caten, C.S. Characterization of the adoption of environmental management practices in large Brazilian companies. J. Clean. Prod. 2015, 86, 256–264. [Google Scholar] [CrossRef]
- Ahi, P.; Searcy, C. An analysis of metrics used to measure performance in green and sustainable supply chains. J. Clean. Prod. 2015, 86, 360–377. [Google Scholar] [CrossRef]
- Govindan, K.; Rajendran, S.; Sarkis, J.; Murugesan, P. Multi criteria decision making approaches for green supplier evaluation and selection: A literature review. J. Clean. Prod. 2015, 98, 66–83. [Google Scholar] [CrossRef]
- Wang, Y.; Huscroft, J.R.; Hazen, B.T.; Zhang, M. Green information, green certification and consumer perceptions of remanufctured automobile parts. Resour. Conserv. Recycl. 2018, 128, 187–196. [Google Scholar] [CrossRef]
- Neumüller, C.; Lasch, R.; Kellner, F. Integrating sustainability into strategic supplier portfolio selection. Manag. Decis. 2016, 54, 194–221. [Google Scholar] [CrossRef]
- Lin, K.-P.; Tseng, M.-L.; Pai, P.-F. Sustainable supply chain management using approximate fuzzy DEMATEL method. Resour. Conserv. Recycl. 2018, 128, 134–142. [Google Scholar] [CrossRef]
- Bai, C.; Sarkis, J.; Dou, Y. Corporate sustainability development in China: Review and analysis. Ind. Manag. Data Syst. 2015, 115, 5–40. [Google Scholar] [CrossRef]
- Jayaram, J.; Avittathur, B. Green supply chains: A perspective from an emerging economy. Int. J. Prod. Econ. 2015, 164, 234–244. [Google Scholar] [CrossRef]
- Chunguang, B.; Joseph, S. Determining and applying sustainable supplier key performance indicators. Supply Chain Manag. Int. J. 2014, 19, 275–291. [Google Scholar] [CrossRef]
- Sáez-Martínez, F.J.; Lefebvre, G.; Hernández, J.J.; Clark, J.H. Drivers of sustainable cleaner production and sustainable energy options. J. Clean. Prod. 2016, 138, 1–7. [Google Scholar] [CrossRef]
- Zailani, S.; Govindan, K.; Iranmanesh, M.; Shaharudin, M.R.; Sia Chong, Y. Green innovation adoption in automotive supply chain: The Malaysian case. J. Clean. Prod. 2015, 108, 1115–1122. [Google Scholar] [CrossRef]
- Luthra, S.; Govindan, K.; Kannan, D.; Mangla, S.K.; Garg, C.P. An integrated framework for sustainable supplier selection and evaluation in supply chains. J. Clean. Prod. 2017, 140, 1686–1698. [Google Scholar] [CrossRef]
- Dubey, R.; Gunasekaran, A.; Samar Ali, S. Exploring the relationship between leadership, operational practices, institutional pressures and environmental performance: A framework for green supply chain. Int. J. Prod. Econ. 2015, 160, 120–132. [Google Scholar] [CrossRef]
- Qian, L.; Soopramanien, D. Incorporating heterogeneity to forecast the demand of new products in emerging markets: Green cars in China. Technol. Forecast. Soc. Chang. 2015, 91, 33–46. [Google Scholar] [CrossRef]
- Kang, H.S.; Lee, J.Y.; Choi, S.; Kim, H.; Park, J.H.; Son, J.Y.; Kim, B.H.; Noh, S.D. Smart manufacturing: Past research, present findings, and future directions. Int. J. Precis. Eng. Manuf. Green Technol. 2016, 3, 111–128. [Google Scholar] [CrossRef]
- Zhu, Q.; Sarkis, J. Green marketing and consumerism as social change in China: Analyzing the literature. Int. J. Prod. Econ. 2016, 181 Pt B, 289–302. [Google Scholar] [CrossRef]
- Ma, P.; Zhang, C.; Hong, X.; Xu, H. Pricing decisions for substitutable products with green manufacturing in a competitive supply chain. J. Clean. Prod. 2018, 183, 618–640. [Google Scholar] [CrossRef]
- Seth, D.; Rehman, M.A.A.; Shrivastava, R.L. Green manufacturing drivers and their relationships for small and medium(SME) and large industries. J. Clean. Prod. 2018, 198, 1381–1405. [Google Scholar] [CrossRef]
- Lü, Y.-L.; Geng, J.; He, G.-Z. Industrial transformation and green production to reduce environmental emissions: Taking cement industry as a case. Adv. Clim. Chang. Res. 2015, 6, 202–209. [Google Scholar] [CrossRef]
- Saufi, N.A.A.; Daud, S.; Hassan, H. Green growth and corporate sustainability performance. Procedia Econ. Financ. 2016, 35, 374–378. [Google Scholar] [CrossRef]
- Pampanelli, A.B.; Found, P.; Bernardes, A.M. A lean & green model for a production cell. J. Clean. Prod. 2014, 85, 19–30. [Google Scholar] [CrossRef]
- Kirezieva, K.; Jacxsens, L.; Hagelaar, G.J.L.F.; van Boekel, M.A.J.S.; Uyttendaele, M.; Luning, P.A. Exploring the influence of context on food safety management: Case studies of leafy greens production in Europe. Food Policy 2015, 51, 158–170. [Google Scholar] [CrossRef]
- Luan, C.-J.; Tien, C.; Chen, W.-L. Which “green” is better? An empirical study of the impact of green activities on firm performance. Asia Pac. Manag. Rev. 2016, 21, 102–110. [Google Scholar] [CrossRef]
- Soubihia, D.F.; Jabbour, C.J.C.; de Sousa Jabbour, A.B.L. Green manufacturing: Relationship between adoption of green operational practices and green performance of Brazilian ISO 9001-certified firms. Int. J. Precis. Eng. Manuf. Green Technol. 2015, 2, 95–98. [Google Scholar] [CrossRef]
- Roy, M.; Khastagir, D. Exploring role of green management in enhancing organizational efficiency in petro-chemical industry in India. J. Clean. Prod. 2016, 121, 109–115. [Google Scholar] [CrossRef]
- BR, R.K.; Agarwal, A.; Sharma, M.K. Lean management—A step towards sustainable green supply chain. Compet. Rev. 2016, 26, 311–331. [Google Scholar] [CrossRef]
- Lim, M.K.; Tseng, M.-L.; Tan, K.H.; Bui, T.D. Knowledge management in sustainable supply chain management: Improving performance through an interpretive structural modelling approach. J. Clean. Prod. 2017, 162, 806–816. [Google Scholar] [CrossRef]
- Lin, M.-H.; Hu, J.; Tseng, M.-L.; Chiu, A.S.F.; Lin, C. Sustainable development in technological and vocational higher education: Balanced scorecard measures with uncertainty. J. Clean. Prod. 2016, 120, 1–12. [Google Scholar] [CrossRef]
- Rajeev, A.; Pati, R.K.; Padhi, S.S.; Govindan, K. Evolution of sustainability in supply chain management: A literature review. J. Clean. Prod. 2017, 162, 299–314. [Google Scholar] [CrossRef]
- Yu, F.; Xue, L.; Sun, C.; Zhang, C. Product transportation distance based supplier selection in sustainable supply chain network. J. Clean. Prod. 2016, 137, 29–39. [Google Scholar] [CrossRef]
- Kong, D.; Feng, Q.; Zhou, Y.; Xue, L. Local implementation for green-manufacturing technology diffusion policy in China: From the user firms’ perspectives. J. Clean. Prod. 2016, 129, 113–124. [Google Scholar] [CrossRef]
- Hursen, C.; Chun, S.-H.; Hwang, H.J.; Byun, Y.-H. Application to small and medium enterprises. Proced. Soc. Behav. Sci. 2015, 186, 862–867. [Google Scholar] [CrossRef]
- Jaggernath, R.; Khan, Z. Green supply chain management. World J. Entrep. Manag. Sustain. Dev. 2015, 11, 37–47. [Google Scholar] [CrossRef]
- Govindan, K. Sustainable consumption and production in the food supply chain: A conceptual framework. Int. J. Prod. Econ. 2018, 195, 419–431. [Google Scholar] [CrossRef]
- Fercoq, A.; Lamouri, S.; Carbone, V. Lean/green integration focused on waste reduction techniques. J. Clean. Prod. 2016, 137, 567–578. [Google Scholar] [CrossRef]
- Huang, X.-X.; Hu, Z.-P.; Liu, C.-S.; Yu, D.-J.; Yu, L.-F. The relationships between regulatory and customer pressure, green organizational responses, and green innovation performance. J. Clean. Prod. 2016, 112, 3423–3433. [Google Scholar] [CrossRef]
- Zhu, W.; He, Y. Green product design in supply chains under competition. Eur. J. Oper. Res. 2017, 258, 165–180. [Google Scholar] [CrossRef]
- Ji, P.; Ma, X.; Li, G. Developing green purchasing relationships for the manufacturing industry: An evolutionary game theory perspective. Int. J. Prod. Econ. 2015, 166, 155–162. [Google Scholar] [CrossRef]
- Gorane, S.J.; Kant, R. Supply chain practices: An implementation status in Indian manufacturing organisations. Benchmarking Int. J. 2016, 23, 1076–1110. [Google Scholar] [CrossRef]
- De Oliveira, U.R.; Espindola, L.S.; da Silva, I.R.; da Silva, I.N.; Rocha, H.M. A systematic literature review on green supply chain management: Research implications and future perspectives. J. Clean. Prod. 2018, 187, 537–561. [Google Scholar] [CrossRef]
- Gandhi, N.S.; Thanki, S.J.; Thakkar, J.J. Ranking of drivers for integrated lean-green manufacturing for Indian manufacturing SMEs. J. Clean. Prod. 2018, 171, 675–689. [Google Scholar] [CrossRef]
- Mittal, V.K.; Sindhwani, R.; Kapur, P.K. Two-way assessment of barriers to lean–green manufacturing system: Insights from India. Int. J. Syst. Assur. Eng. Manag. 2016, 7, 400–407. [Google Scholar] [CrossRef]
- Sen, P.; Roy, M.; Pal, P. Exploring role of environmental proactivity in financial performance of manufacturing enterprises: A structural modelling approach. J. Clean. Prod. 2015, 108, 583–594. [Google Scholar] [CrossRef]
- Mittal, V.K.; Sangwan, K.S. Prioritizing drivers for green manufacturing: Environmental, social and economic perspectives. Proced. CIRP 2014, 15, 135–140. [Google Scholar] [CrossRef]
- McDonagh, P.; Prothero, A. Sustainability marketing research: Past, present and future. J. Mark. Manag. 2014, 30, 1186–1219. [Google Scholar] [CrossRef]
- Bai, C.; Sarkis, J. Improving green flexibility through advanced manufacturing technology investment: Modeling the decision process. Int. J. Prod. Econ. 2017, 188, 86–104. [Google Scholar] [CrossRef]
- Han, J.H.; Wang, Y.; Naim, M. Reconceptualization of information technology flexibility for supply chain management: An empirical study. Int. J. Prod. Econ. 2017, 187, 196–215. [Google Scholar] [CrossRef]
- Rezaei, J.; Nispeling, T.; Sarkis, J.; Tavasszy, L. A supplier selection life cycle approach integrating traditional and environmental criteria using the best worst method. J. Clean. Prod. 2016, 135, 577–588. [Google Scholar] [CrossRef]
- Awasthi, A.; Govindan, K.; Gold, S. Multi-tier sustainable global supplier selection using a fuzzy AHP-VIKOR based approach. Int. J. Prod. Econ. 2018, 195, 106–117. [Google Scholar] [CrossRef]
- Gualandris, J.; Klassen, R.D.; Vachon, S.; Kalchschmidt, M. Sustainable evaluation and verification in supply chains: Aligning and leveraging accountability to stakeholders. J. Oper. Manag. 2015, 38, 1–13. [Google Scholar] [CrossRef] [Green Version]
- Iacobucci, D.; Posavac, S.S.; Kardes, F.R.; Schneider, M.J.; Popovich, D.L. Toward a more nuanced understanding of the statistical properties of a median split. J. Consum. Psychol. 2015, 25, 652–665. [Google Scholar] [CrossRef]
- Kock, N.; Verville, J.; Danesh-Pajou, A.; DeLuca, D. Communication flow orientation in business process modeling and its effect on redesign success: Results from a field study. Decis. Support Syst. 2009, 46, 562–575. [Google Scholar] [CrossRef]
- Richter, N.F.; Cepeda, G.; Roldán, J.L.; Ringle, C.M. European management research using partial least squares structural equation modeling (PLS-SEM). Eur. Manag. J. 2016, 34, 589–597. [Google Scholar] [CrossRef]
- Farooq, M.S.; Salam, M.; Fayolle, A.; Jaafar, N.; Ayupp, K. Impact of service quality on customer satisfaction in Malaysia airlines: A PLS-SEM approach. J. Air Transp. Manag. 2018, 67, 169–180. [Google Scholar] [CrossRef]
- Ojha, D.; Struckell, E.; Acharya, C.; Patel, P.C. Supply chain organizational learning, exploration, exploitation, and firm performance: A creation-dispersion perspective. Int. J. Prod. Econ. 2018, 204, 70–82. [Google Scholar] [CrossRef]
- Qi, Y.; Huo, B.; Wang, Z.; Yeung, H.Y.J. The impact of operations and supply chain strategies on integration and performance. Int. J. Prod. Econ. 2017, 185, 162–174. [Google Scholar] [CrossRef]
- Hair, J.F.; Ringle, C.M.; Sarstedt, M. Editorial-partial least squares structural equation modeling: Rigorous applications, better results and higher acceptance. Long Range Plan 2013, 46, 1–12. [Google Scholar] [CrossRef]
- Kock, N. WarpPLS 6.0 User Manual; ScriptWarp Systems: Laredo, TX, USA, 2018. [Google Scholar]


| Demographic Data | Frequency | % | |
|---|---|---|---|
| Gender | Male | 362 | 64,758 |
| Female | 190 | 33,989 | |
| *NOS | 7 | 1252 | |
| ** T = 559 | T = 100 | ||
| Industrial Sector | Automotive | 342 | 61,180 |
| Plastics | 72 | 12,880 | |
| Metal—mechanical | 49 | 8766 | |
| Medical | 34 | 6082 | |
| Electronic | 30 | 5367 | |
| Electric | 19 | 3399 | |
| Aeronautics | 7 | 1252 | |
| NOS | 6 | 1073 | |
| T = 559 | T = 100 | ||
| Years of experience in the work position | 2–5 | 185 | 33,095 |
| 6–10 | 128 | 22,898 | |
| 1–2 | 119 | 21,288 | |
| 10–20 | 97 | 17,352 | |
| 20–30 | 28 | 5009 | |
| NOS | 2 | 0.358 | |
| T = 559 | T = 100 | ||
| Latent Variable Coefficients | Attributes before and during a Green Manufacturing Process | Operating Benefits | Commercial Benefits | Economic Benefits |
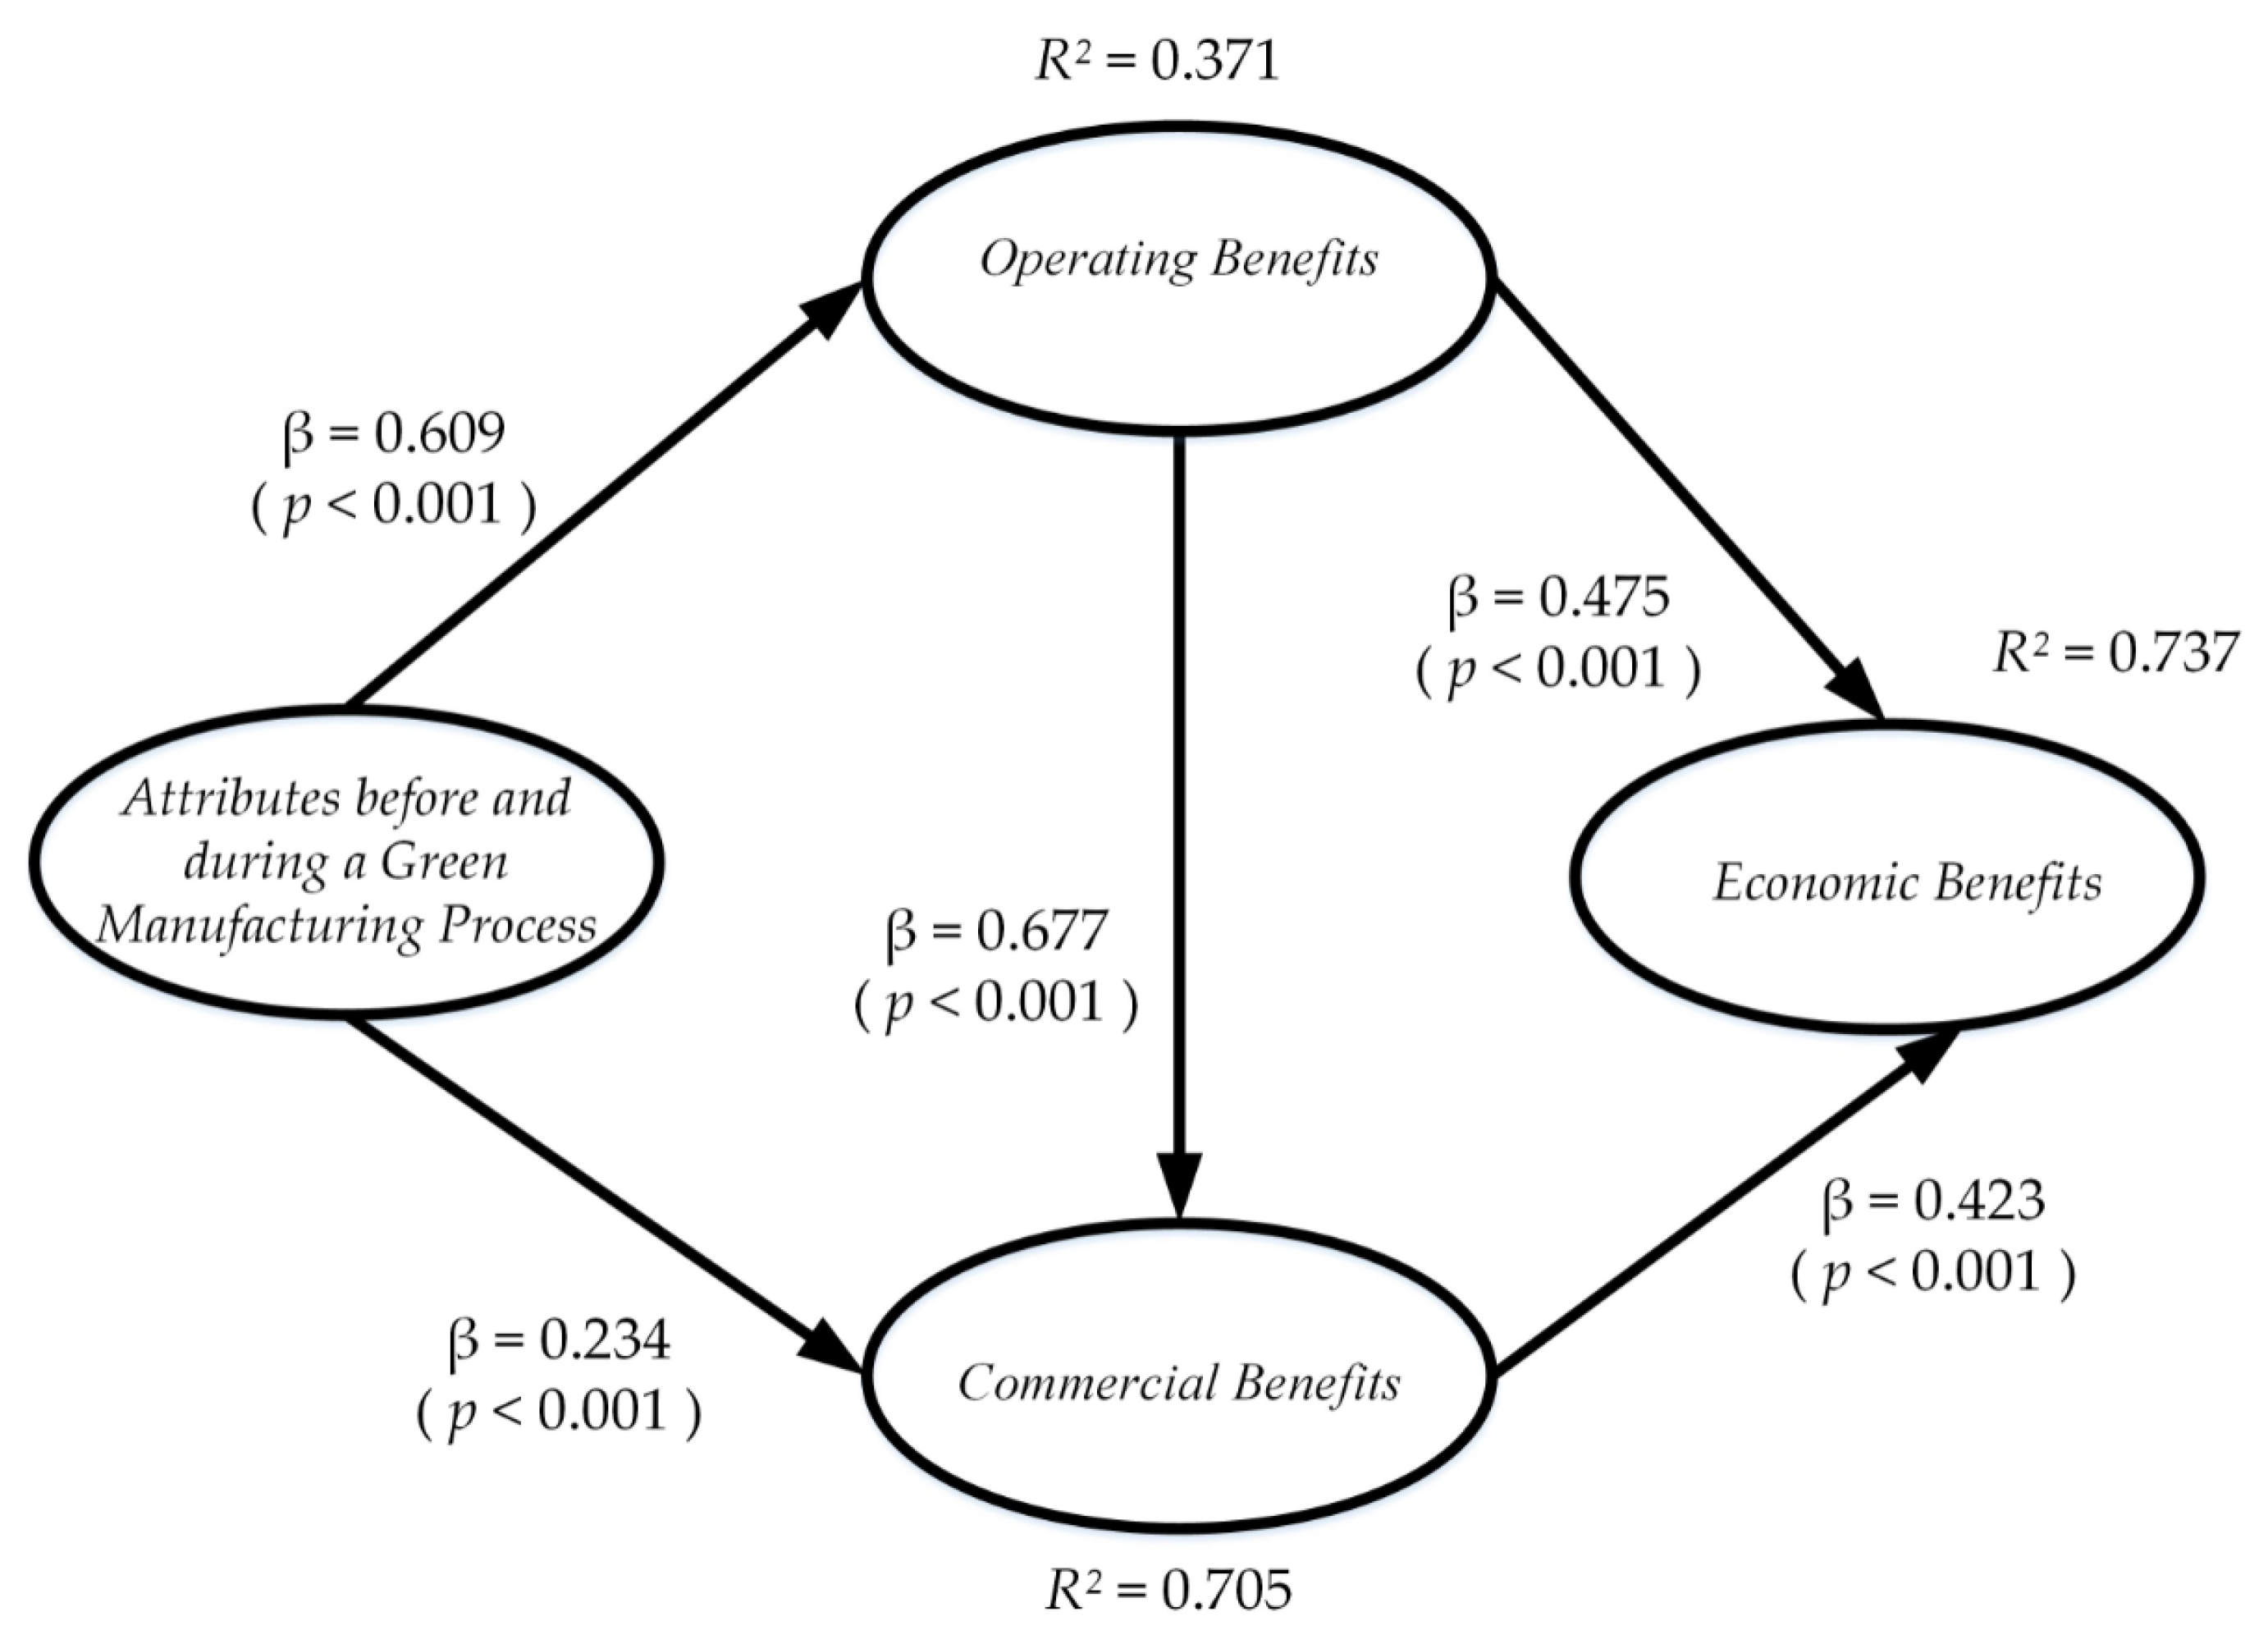
| R2 | 0.371 | 0.705 | 0.737 | |
| Adj. R2 | 0.370 | 0.704 | 0.736 | |
| Composite Reliability | 0.942 | 0.940 | 0.909 | 0.952 |
| Cronbach’s Alpha | 0.877 | 0.925 | 0.866 | 0.941 |
| AVE | 0.890 | 0.690 | 0.714 | 0.737 |
| Full Collinearity VIF | 1.772 | 3.928 | 4.026 | 3.764 |
| Q2 | 0.372 | 0.705 | 0.738 |
| Indexes for the Model Validation |
|---|
| Average path coefficient (APC) = 0.484, p < 0.001 |
| Average R-squared (ARS) = 0.604, p < 0.001 |
| Average adjusted R-squared (AARS) = 0.603, p < 0.001 |
| Average block VIF (AVIF) = 2.379, acceptable if ≤ 5, ideally ≤ 3.3 |
| Average full collinearity VIF (AFVIF) = 3.373, acceptable if ≤ 5, ideally ≤ 3.3 |
| Tenenhaus GoF (GoF) = 0.677, small ≥ 0.1, medium ≥ 0.25, large ≥ 0.36 |
| Hypothesis | Independent Variable | Dependent Variable | β | R2 | p-Value | Conclusion |
|---|---|---|---|---|---|---|
| H1 | Attributes before and during a Green Manufacturing Process | Operating Benefits | 0.609 | 0.371 | p < 0.001 | Accepted |
| H2 | Attributes before and during a Green Manufacturing Process | Commercial Benefits | 0.234 | 0.150 | p < 0.001 | Accepted |
| H3 | Operating Benefits | Commercial Benefits | 0.677 | 0.555 | p < 0.001 | Accepted |
| H4 | Operating Benefits | Economic Benefits | 0.475 | 0.392 | p < 0.001 | Accepted |
| H5 | Commercial Benefits | Economic Benefits | 0.423 | 0.345 | p < 0.001 | Accepted |
| To | From | R2 | ||
| Operating Benefits | Commercial Benefits | Attributes before and during a Green Manufacturing Process | ||
| Operating Benefits | 0.371 | 0.371 | ||
| Commercial Benefits | 0.555 | 0.150 | 0.705 | |
| Economic Benefits | 0.392 | 0.345 | 0.737 | |
| Type Effect | From | To | |
|---|---|---|---|
| Indirect | Attributes before and during a Green Manufacturing Process | Commercial Benefits | 0.413 (p < 0.001) ES = 0.265 |
| Attributes before and during a Green Manufacturing Process | Economic Benefits | 0.563 (p < 0.001) ES = 0.310 | |
| Operating Benefits | Economic Benefits | 0.286 (p < 0.001) ES = 0.236 | |
| Total | Attributes before and during a Green Manufacturing Process | Operating Benefits | 0.609 (p < 0.001) ES = 0.371 |
| Attributes before and during a Green Manufacturing Process | Commercial Benefits | 0.647 (p < 0.001) ES = 0.416 | |
| Attributes before and during a Green Manufacturing Process | Economic Benefits | 0.563 (p < 0.001) ES = 0.310 | |
| Operating Benefits | Commercial Benefits | 0.677 (p < 0.001) ES = 0.555 | |
| Operating Benefits | Economic Benefits | 0.761 (p < 0.001) ES = 0.628 | |
| Commercial Benefits | Economic Benefits | 0.423 (p <0.001) ES = 0.345 |
| From | Attributes before and during a Green Manufacturing Process | Operating Benefits | Commercial Benefits | |||||
| To | Level | + | − | + | − | + | − | |
| P (i) | 0.177 | 0.181 | 0.156 | 0.150 | 0.186 | 0.165 | ||
| Operating Benefits | + | 0.156 | & 0.086 If 0.485 | & 0.007 If 0.040 | ||||
| − | 0.150 | & 0.007 If 0.040 | & 0.075 If 0.416 | |||||
| Commercial Benefits | + | 0.186 | & 0.100 If 0.566 | & 0.004 If 0.020 | & 0.091 If 0.586 | & 0.000 If 0.000 | ||
| − | 0.165 | & 0.004 If 0.020 | & 0.088 If 0.485 | & 0.002 If 0.011 | & 0.114 If 0.762 | |||
| Economic Benefits | + | 0.161 | & 0.081 If 0.517 | & 0.000 If 0.00 | & 0.095 If 0.510 | & 0.004 If 0.022 | ||
| − | 0.159 | & 0.000 If 0.000 | & 0.125 If 0.833 | & 0.000 If 0.000 | & 0.122 If 0.739 | |||
© 2019 by the authors. Licensee MDPI, Basel, Switzerland. This article is an open access article distributed under the terms and conditions of the Creative Commons Attribution (CC BY) license (http://creativecommons.org/licenses/by/4.0/).
Share and Cite
Mendoza-Fong, J.R.; García-Alcaraz, J.L.; Díaz-Reza, J.R.; Jiménez-Macías, E.; Blanco-Fernández, J. The Role of Green Attributes in Production Processes as Well as Their Impact on Operational, Commercial, and Economic Benefits. Sustainability 2019, 11, 1294. https://doi.org/10.3390/su11051294
Mendoza-Fong JR, García-Alcaraz JL, Díaz-Reza JR, Jiménez-Macías E, Blanco-Fernández J. The Role of Green Attributes in Production Processes as Well as Their Impact on Operational, Commercial, and Economic Benefits. Sustainability. 2019; 11(5):1294. https://doi.org/10.3390/su11051294
Chicago/Turabian StyleMendoza-Fong, José Roberto, Jorge Luis García-Alcaraz, José Roberto Díaz-Reza, Emilio Jiménez-Macías, and Julio Blanco-Fernández. 2019. "The Role of Green Attributes in Production Processes as Well as Their Impact on Operational, Commercial, and Economic Benefits" Sustainability 11, no. 5: 1294. https://doi.org/10.3390/su11051294