Article

Optimal Coupling of Straw and Synthetic Fertilizers Incorporation on Soil Properties, Active Fe Dynamics, and Greenhouse Gas Emission in Jasminum sambac (L.) Field in Southeastern China

1
Institute of Geography, Fujian Normal University, Fuzhou 350007, China
2
Institute of Geographical Sciences and Natural Resources Research, Chinese Academy of Sciences, Beijing 100101, China
3
Key Laboratory of Environment Remediation and Ecological Health, Ministry of Education, Zhejiang University, Hangzhou 310058, China
4
CSIC, Global Ecology Unit CREAF-CSIC-UAB, 08913 Bellaterra, Catalonia, Spain
5
CREAF, 08913 Cerdanyola del Vallès, Catalonia, Spain
6
Ministry of Agriculture Key Laboratory of Crop Nutrition and Fertilization, Institute of Agricultural Resources and Regional Planning, Chinese Academy of Agricultural Sciences, Beijing 100081, China
7
Department of Geography and Resource Management, The Chinese University of Hong Kong, Hong Kong, China
*
Author to whom correspondence should be addressed.
Sustainability 2019, 11(4), 1092; https://doi.org/10.3390/su11041092
Submission received: 31 December 2018 / Revised: 1 February 2019 / Accepted: 15 February 2019 / Published: 19 February 2019
(This article belongs to the Section Sustainable Agriculture)

Abstract

:
In agriculture, synthetic fertilizers have played a key role in enhancing food production and keeping the world’s population adequately fed. China’s participation is essential to global efforts in reducing greenhouse gas (GHG) emissions because it is the largest producer and consumer of synthetic fertilizers. A field experiment was conducted in a Jasminum sambac (L.) field to evaluate the impact different doses of fertilizers (half, standard, and double) and their combination with straw on ecosystem (including crop plants and soil) GHG emissions. The results showed that in comparison with the control or straw treatments, the straw + standard fertilizer treatment increased the soil water content. The fertilizer treatments decreased the soil pH, but the straw and combination treatments, especially the straw + standard fertilizer treatment, had higher soil pH in comparison with the fertilizer treatment. The active soil Fe (Fe2+ and Fe3+) concentration was slightly increased in the straw + standard fertilizer treatment in comparison with the control. Moreover, fertilizer increased the CO2 emission, and we detected a positive interaction between the straw application and the double fertilization dose that increased CO2 emission, but the straw + standard fertilizer treatment decreased it. Fertilizer decreased CH4 and N2O emissions, but when straw and fertilizer treatments were applied together, this increased CH4 and N2O emissions. Overall, considering the soil properties and GHG emissions, the straw + standard fertilizer treatment was the best method to enhance soil water retention capacity, improve soil acid, and mitigate greenhouse gas emissions for sustainable management of J. sambac dry croplands.

1. Introduction

Croplands are the ecosystems that support human life [1]. Synthetic fertilizers play a key role in the continuous increase of agriculture production. Currently, considering the environmental benefits that sustainable agriculture management provide, reduction of synthetic fertilizers by combination amendments of them with organic fertilizer or straw are used to decrease gas emissions and improve soil conditions [2,3]. Organic and inorganic fertilizer amendments cause distinct effects on soil properties. In general, long-term amendment of synthetic fertilizers can decrease soil pH, but when combining synthetic fertilizer with organic straw and manure, the pH will be higher than when using the sole synthetic fertilizer amendment [4]. Different soil environment conditions and management methods, including different types and fertilizer combinations can cause different responses in available Fe concentration, soil water content, pH, and salinity [5,6,7].
Global warming induced by increasing greenhouse gas (GHG) concentrations in the atmosphere is a matter of great environmental concern. The agroecosystems play a substantial role in the global budget of GHGs [8]. Agriculture is responsible for about 50% of the global anthropogenic CH4 and for about 60% of N2O [9], and it can be an important source or sink of GHGs. Agricultural CH4 and N2O emissions have increased by nearly 17% from 1990 to 2005 [9], and agricultural N2O emissions are predicted to increase between 23 and 60% by 2030 due to increased synthetic fertilizers and manure nitrogen inputs [10]. However, the effects of fertilization on soil GHG emissions are complicated, with conflicting results reported [11,12,13,14,15].
Fertilization, especially the application of synthetic fertilizers, is one of the most important and commonly used methods for plantation management and has a significant effect on soil GHGs emissions [15,16,17,18]. Nitrogen (N) fertilizer applications have been reported to increase primary production in most terrestrial ecosystems across the world [19], but their effects on soil GHGs emissions are not fully understood or they are contradictory [11,12,13,14,15,18,20,21]. These contradictory results may be attributed to differences in the initial C and N status, the microbial community composition, the fertilizer type and application rate [11,12,16]. For organic amendment types in the field, such as straw addition, CO2 and CH4 emission increased, but combination amendments with steel slag or biochar decreased the CO2 and CH4 emissions [6]. Therefore, considering different mixes of fertilizer amendments may be the most effective practice for agriculture sustainability. Changes or responses to increases in GHGs emissions mainly depend on a number of microbial-mediated processes in soils, and these processes are influenced by many environmental factors such as atmospheric, plant, and soil properties [22,23,24]. Fertilization management can influence soil variables such as soil Fe3+, temperature, pH, and salinity that strongly influence soil GHGs emissions [6,24].
To the best of our knowledge, no information is available on the effects of combined straw and fertilizer amendments on GHGs emissions in subtropical J. sambac plantations. A better understanding of the suitability of this combined amendment to reduce GHGs is needed, as the jasmine tea productions increasing globally. The impacts and consequences of the combined application of straw and synthetic fertilizer on soil nutrient fertility and GHGs emission, however, are poorly known. This information would provide the tools for introducing new management strategies (such as the combination of straw and synthetic fertilizers) to achieve long-term optimal nutrient conditions for the system as a whole, including an equilibrium among soil quality, crop yield and quality and the pollution/eutrophication risk from the leaching of excess exchangeable soil nutrients.
Jasminum sambac (L.) is a perennial and water-intensive crop, and the jasmine flower is the most important raw material for Jasmine sambac tea production. Developing effective strategies to enhance or maintain the yield of J. sambac flowers without increasing GHGs emissions from J. sambac plantations in subtropical China is considered an important policy for minimizing future problems of adverse climate change. More than half of the jasmine tea in China is produced in Fuzhou City [25,26,27]. Moreover, the organic cultivation of jasmine can increase agricultural income in comparison with common cultivation methods. Previous experiments have observed that the jasmine flower production yield did not significantly change under organic versus conventional management [28]. Moreover, after organic cultivation, soil pH and soil carbon, nitrogen, and phosphorus concentrations improved [28].
We aimed to test whether straw application, both alone and in combination with fertilizer, can improve soil conditions for jasmine production and simultaneously reduce GHGs emissions. We conducted a field study using control (CK), and different doses of standard fertilizer and straw addition. The objectives of this study were: (1) to examine the combined effects of straw and fertilizer on soil active Fe chemical forms, pH, salinity, temperature, and water content; (2) assess the active Fe dynamics and its response to soil properties; and (3) determine the relationships between environmental factors and GHG emissions. Investigating the suitability of straw and fertilizer amounts and the combination method for the management of J. sambac plantations and GHGs emissions is necessary for finding better ways to improve fertilizer efficiency without environmental risks.

2. Materials and Methods

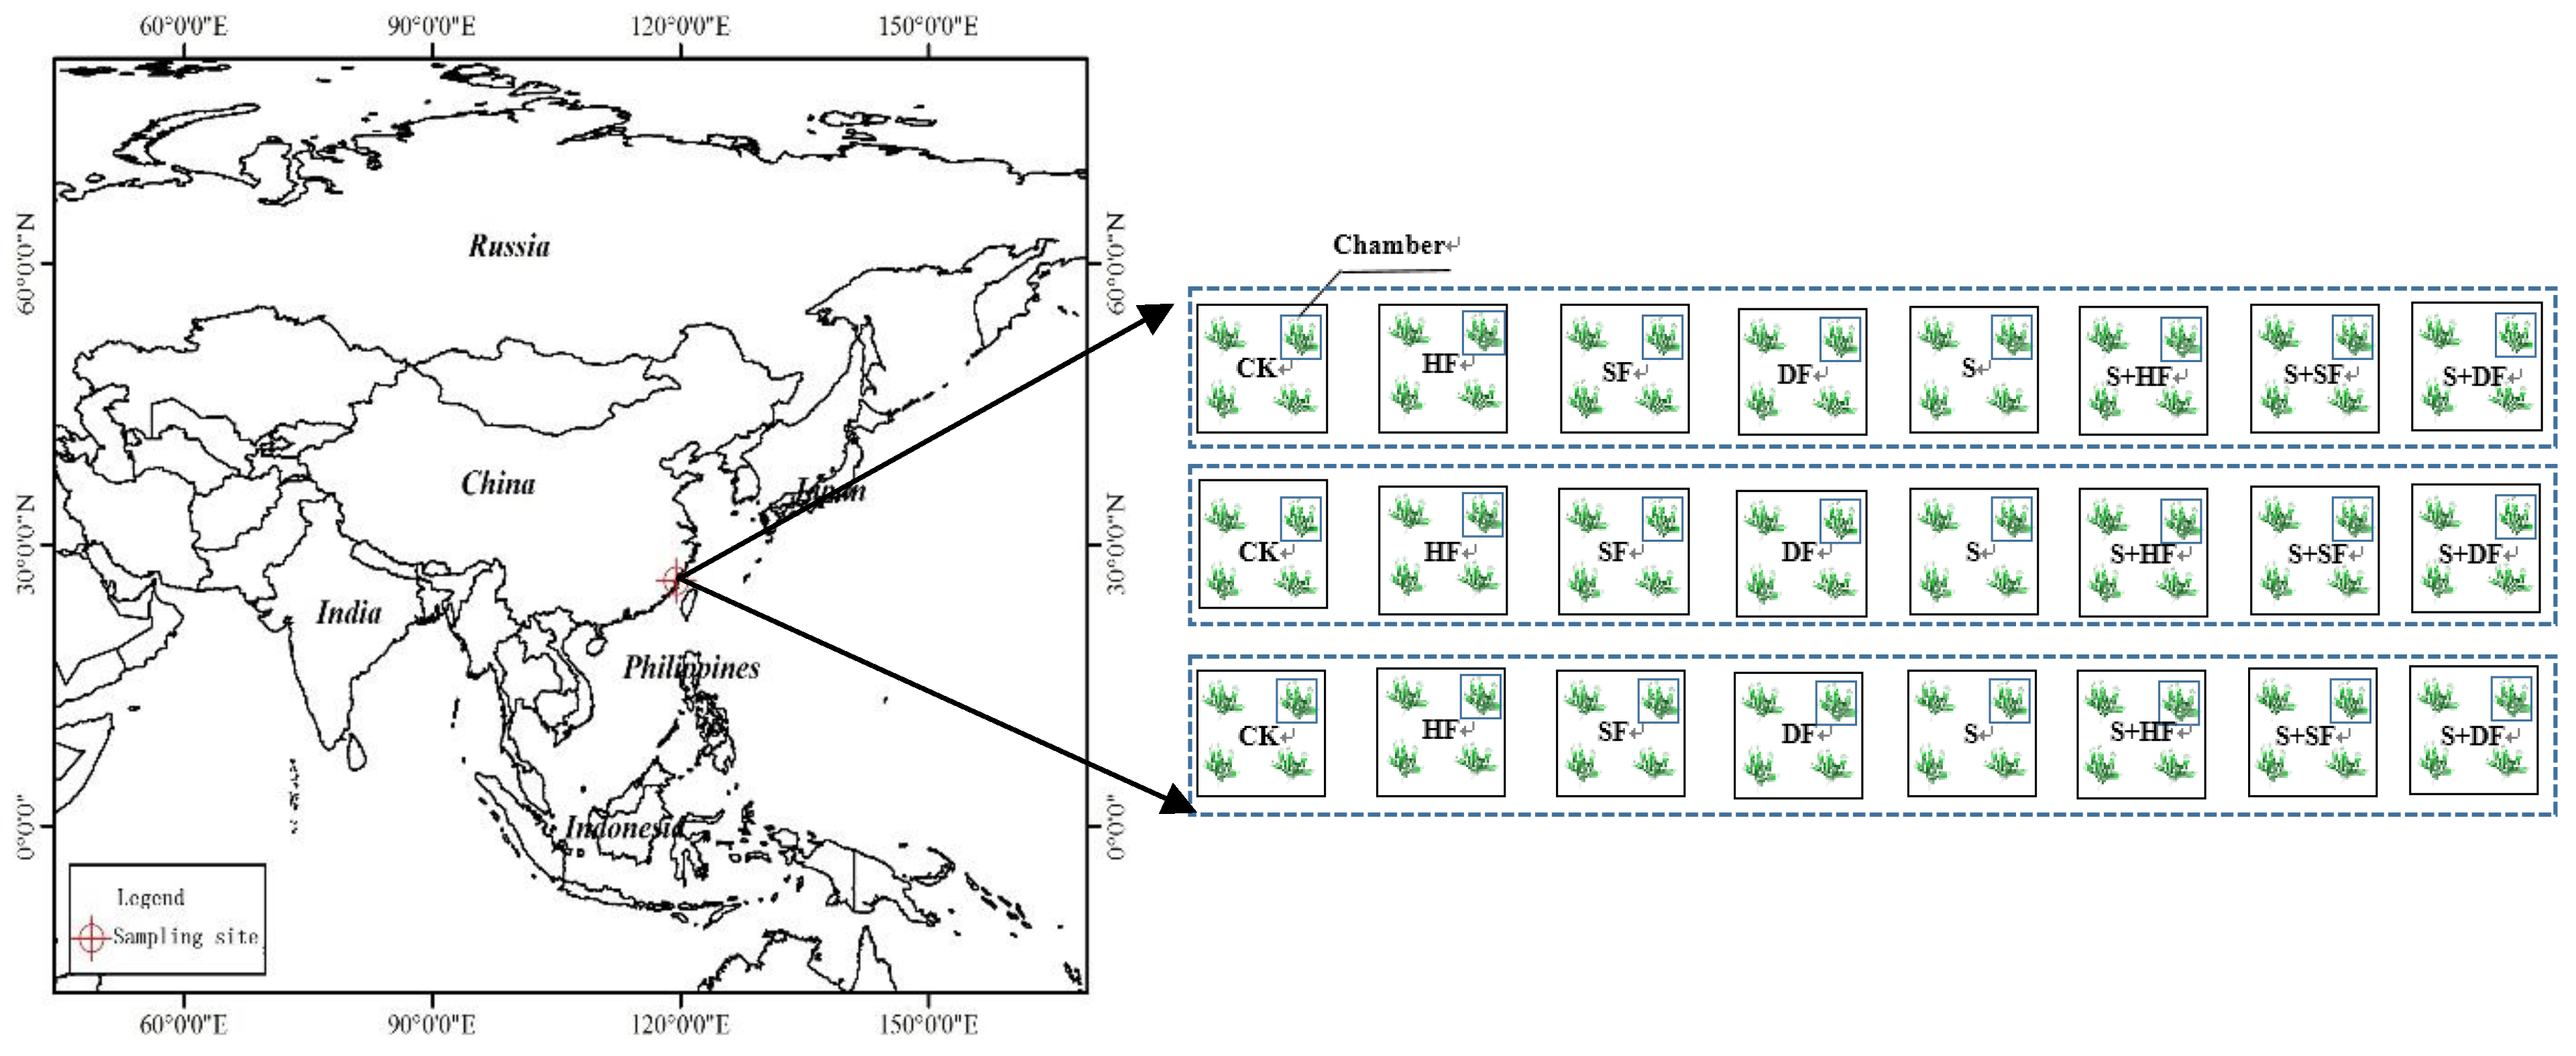
2.1. Study Site and Experimental Design

A field experiment was conducted in the Difengjiang field of Jasminum sambac (L.) Aiton of the Fujian Minrong Tea Co., Ltd. (Figure 1, 25°59′10″N, 119°20′7″E) in Fujian Province, China, during the J. sambac growing season from April to October. This region has a subtropical monsoonal climate, with a mean air temperature of about 25 °C during the study period and a mean annual precipitation of approximately 1400 mm. About 80% of the total rainfall is concentrated in the rainy season between May and October. The soil in the J. sambac field contained 25, 59 and 16% sand, silt and clay, respectively. The soil at the beginning of the study period had a bulk density of 1.2 g cm−3, pH of 4.4, salinity of 0.15 mS cm−1 and concentrations of total carbon, total N, total P and total potassium of 11.7, 1.1, 0.5 and 13.3 g kg−1, respectively. Air temperatures and humidity during the studied period are shown in Figure S1.
The J. sambac was cultivated using a ridge and ditch system, with 100 cm of land (ridge) being left for plant growth between the ditches. The ridge height was 20 cm. Double-valve J. sambac branches 10 cm long were transplanted by hand into the ridges in April 2008 and have grown for seven years. The cultivation density was 1300 plants per plot of 20 m2. The J. sambac was cut to about 7 cm at the end of March or early April each year when the air temperature was about 20 °C. The J. sambac field was not plowed, but the soil was ridged each year after the J. sambac was cut. J. Sambac branches and leaves began to grow from early April to early May. Budding and infancy were from early May to the end of May. Flowering was from early June to the end of September, when the final growth period began. A complete fertilizer (N:P2O5:K2O = 16:16:16%) was applied in two unequal splits.
The common management method is standard fertilization with synthetized fertilizers. For standard fertilization, the first application was 130 kg ha−1 one day after the J. sambac was cut, and the second application was 100 kg ha−1 one day after the first J. sambac flowers were collected. In order to find the best fertilization management, we set decrement and increment fertilization treatments; moreover, we also set the combination of straw and fertilization to find the best choice for J. sambac production and the environment values. In the study site straw was never previously applied. In our study straw was applied at a rate of 3.5 Mg ha−1. The treatments involved in the experimental design are shown in Table 1. Triplicate plots (each one 20 m2) were established for the seven treatments and control in a completely randomized block design with three blocks (replicates of each control/treatment) (Figure 1). We used straw because it can provide basically two great advantages: it is in high availability and second using it as amendment we can improve water-holding capacity.

2.2. Measurement of CO2, CH4, and N2O Emissions

The experimental period was from April 2015 to March 2016. Static closed chambers were used to measure ecosystem level CO2, CH4, and N2O emissions, as described by Wang et al. [5]. The chambers were made of rigid PVC and consisted of two parts, an upper opaque compartment (100 cm height, 30 cm width, 30 cm length) placed on a permanently installed bottom collar (10 cm height, 30 cm width, 30 cm length). Each chamber had two battery-operated fans to mix the air inside the chamber headspace, an internal thermometer to monitor temperature changes during gas sampling and a gas-sampling port with a neoprene rubber septum at the top of the chamber for collecting gas samples from the headspace. Three replicate chambers in each treatment were developed. The chambers had a vent to avoid pressure buildup. The measured emissions included the contributions from both above and below ground plant biomass, and the soils.
Gas emissions weremeasured for all chambers twice weekly during the growing season and four times a week during the other seasons. The temperature in the chamber did not significantly change during the 30 min sampling process. Gas samples were collected from the chamber headspace using a 100-ml plastic syringe with a three-way stopcock 0, 15, and 30 min after chamber deployment. The samples were immediately transferred to 100-ml air-evacuated aluminum-foil bags (Delin Gas Packaging Co., Ltd., Dalian, China) sealed with butyl rubber septa and transported immediately to the laboratory for the analysis of CO2, CH4, and N2O.
CO2, CH4, and N2O concentrations in the headspace air samples were determined by gas chromatography (Shimadzu GC-2010 and Shimadzu GC-2014, Kyoto, Japan) using a stainless steel Porapak Q column (2m length, 4mm OD, 80/100 mesh). A methane-conversion furnace, flame ionization detector (FID) and electron-capture detector (ECD) were used for the determination of the CO2, CH4, and N2O concentrations, respectively. The operating temperatures of the column, injector and detector for the determination of CO2, CH4, and N2O concentrations were adjusted to 45, 100 and 280 °C; to 70, 200 and 200 °C and to 70, 200, and 320 °C, respectively. Helium (99.999% purity) was used as a carrier gas (30 ml min−1), and a make-up gas (95% argon and 5% CH4) was used for the ECD. CO2 concentration in samples was measured by first conversion to methane with a methane-conversion furnace, and thereafter determination with a flame ionization detector (FID). CH4 concentration was measured with a flame ionization detector (FID) and N2O concentration was measured with an electron-capture detector (ECD). In each sampling date we sampled in each chamber. Gas samples were collected from the chamber headspace using a 100-ml plastic syringe with a three-way stopcock 0, 15 and 30 min after chamber deployment. Each sample was immediately transferred to 100-ml air-evacuated aluminum-foil bags (Delin Gas Packaging Co., Ltd., Dalian, China) sealed with butyl rubber septa. Each aluminum-foil bag gas sample was used to determine the CO2 concentration (Shimadzu GC-2010), CH4 concentration (Shimadzu GC-2010), and N2O concentration (Shimadzu GC-2014) by three gas different injections and chromatographies. The gas chromatograph was calibrated before and after each set of measurements using 503, 1030, and 2980 μlCO2 l−1 in He; 1.01, 7.99 and 50.5 μlCH4 l−1 in He and 0.2, 0.6, and 1.0 μlN2O l−1 in He (CRM/RM Information Center of China) as standards. CO2, CH4, and N2O emissions were then calculated as the rate of change in the mass of CO2, CH4, and N2O per unit of surface area and per unit of time. Three injections were used for each analysis. One sample was injected to the GC for each analysis. The detection limits of the instrument for CO2, CH4, and N2O were 1, 0.1 and 0.05 ppm, respectively.

2.3. Measurement of Soil Properties

Three replicates of the soil samples were collected from each treatment. The samples were transported to the laboratory and stored at 4 °C until analysis and analyzed as in Wang et al. (2916) [28]. Briefly, the temperature, pH, salinity and water content of the top 15 cm of soil were measured in situ at each plot on each sampling day. Temperature and pH were measured with a pH/temperature meter (IQ Scientific Instruments, Carlsbad, CA, USA), salinity was measured using a 2265FS EC meter (Spectrum Technologies Inc., Paxinos, PA, USA) and water content was measured using a TDR 300 meter (Spectrum Field Scout Inc., Aurora, CO, USA). Soil bulk density was measured from three 5 × 3 cm cores per layer. The soil particle size (clay, silt and sand) was measured by a Mastersizer 2000 laser particle-size analyzer (Malvern Scientific Instruments, Suffolk, UK). C and N concentrations were determined using a Vario MAX CN Elemental Analyzer (Elementar Scientific Instruments, Hanau, Germany). Total soil P concentration was determined by perchloric-acid digestion followed by ammonium-molybdate colorimetry and measurement using a UV-2450 spectrophotometer (Shimadzu Scientific Instruments, Kyoto, Japan). Total K concentration was determined by FP 640 flame photometry (Shanghai Electronic Technology Instruments, Shanghai, China).
Soil samples were collected from the top 15 cm layer from each plot for the determination of active Fe3+ ion and Fe2+ ion. The total active Fe concentration was determined by digesting fresh soil samples with 1M HCl. This total active soil Fe constitutes a proxy of the Fe soil fraction available for plants. Fe2+ ions were extracted using 1,10-phenanthrolineand measured spectrometrically [29]. The Fe3+ concentration was calculated by subtracting the Fe2+ concentration from the total Fe concentration [29].

2.4. Statistical Analysis

To disentangle the possible interaction effects between time and treatments, we used repeated-measures analyses of variance (RM-ANOVA). The relationships between Fe dynamics, GHG emissions and soil properties were determined by Pearson correlation analysis. The significance of treatments was tested by Bonferroni’s post hoc tests. These statistical analyses were performed using SPSS Statistics 18.0 (SPSS Inc., Chicago, IL, USA).
We also performed multivariate statistical analyses using general discriminant analysis (GDA) to determine the overall differences of soil salinity, pH, water content, total active Fe concentration, Fe2+ concentration and Fe3+ concentration, soil temperature and CO2, CH4, and N2O emissions among control and the different fertilization and straw treatments. We used sampling dates as an independent categorical variable. Discriminant analyses consist of a supervised statistical algorithm that derives an optimal separation between groups established a priori by maximizing between-group variance while minimizing within-group variance. GDA is thus an appropriate tool for identifying the variables most responsible for the differences among groups while controlling for the component of the variance due to other categorical variables—in this case, sampling dates. The GDAwas performed using Statistica 8.0 (StatSoft, Inc., Tulsa, OK, USA).

3. Results

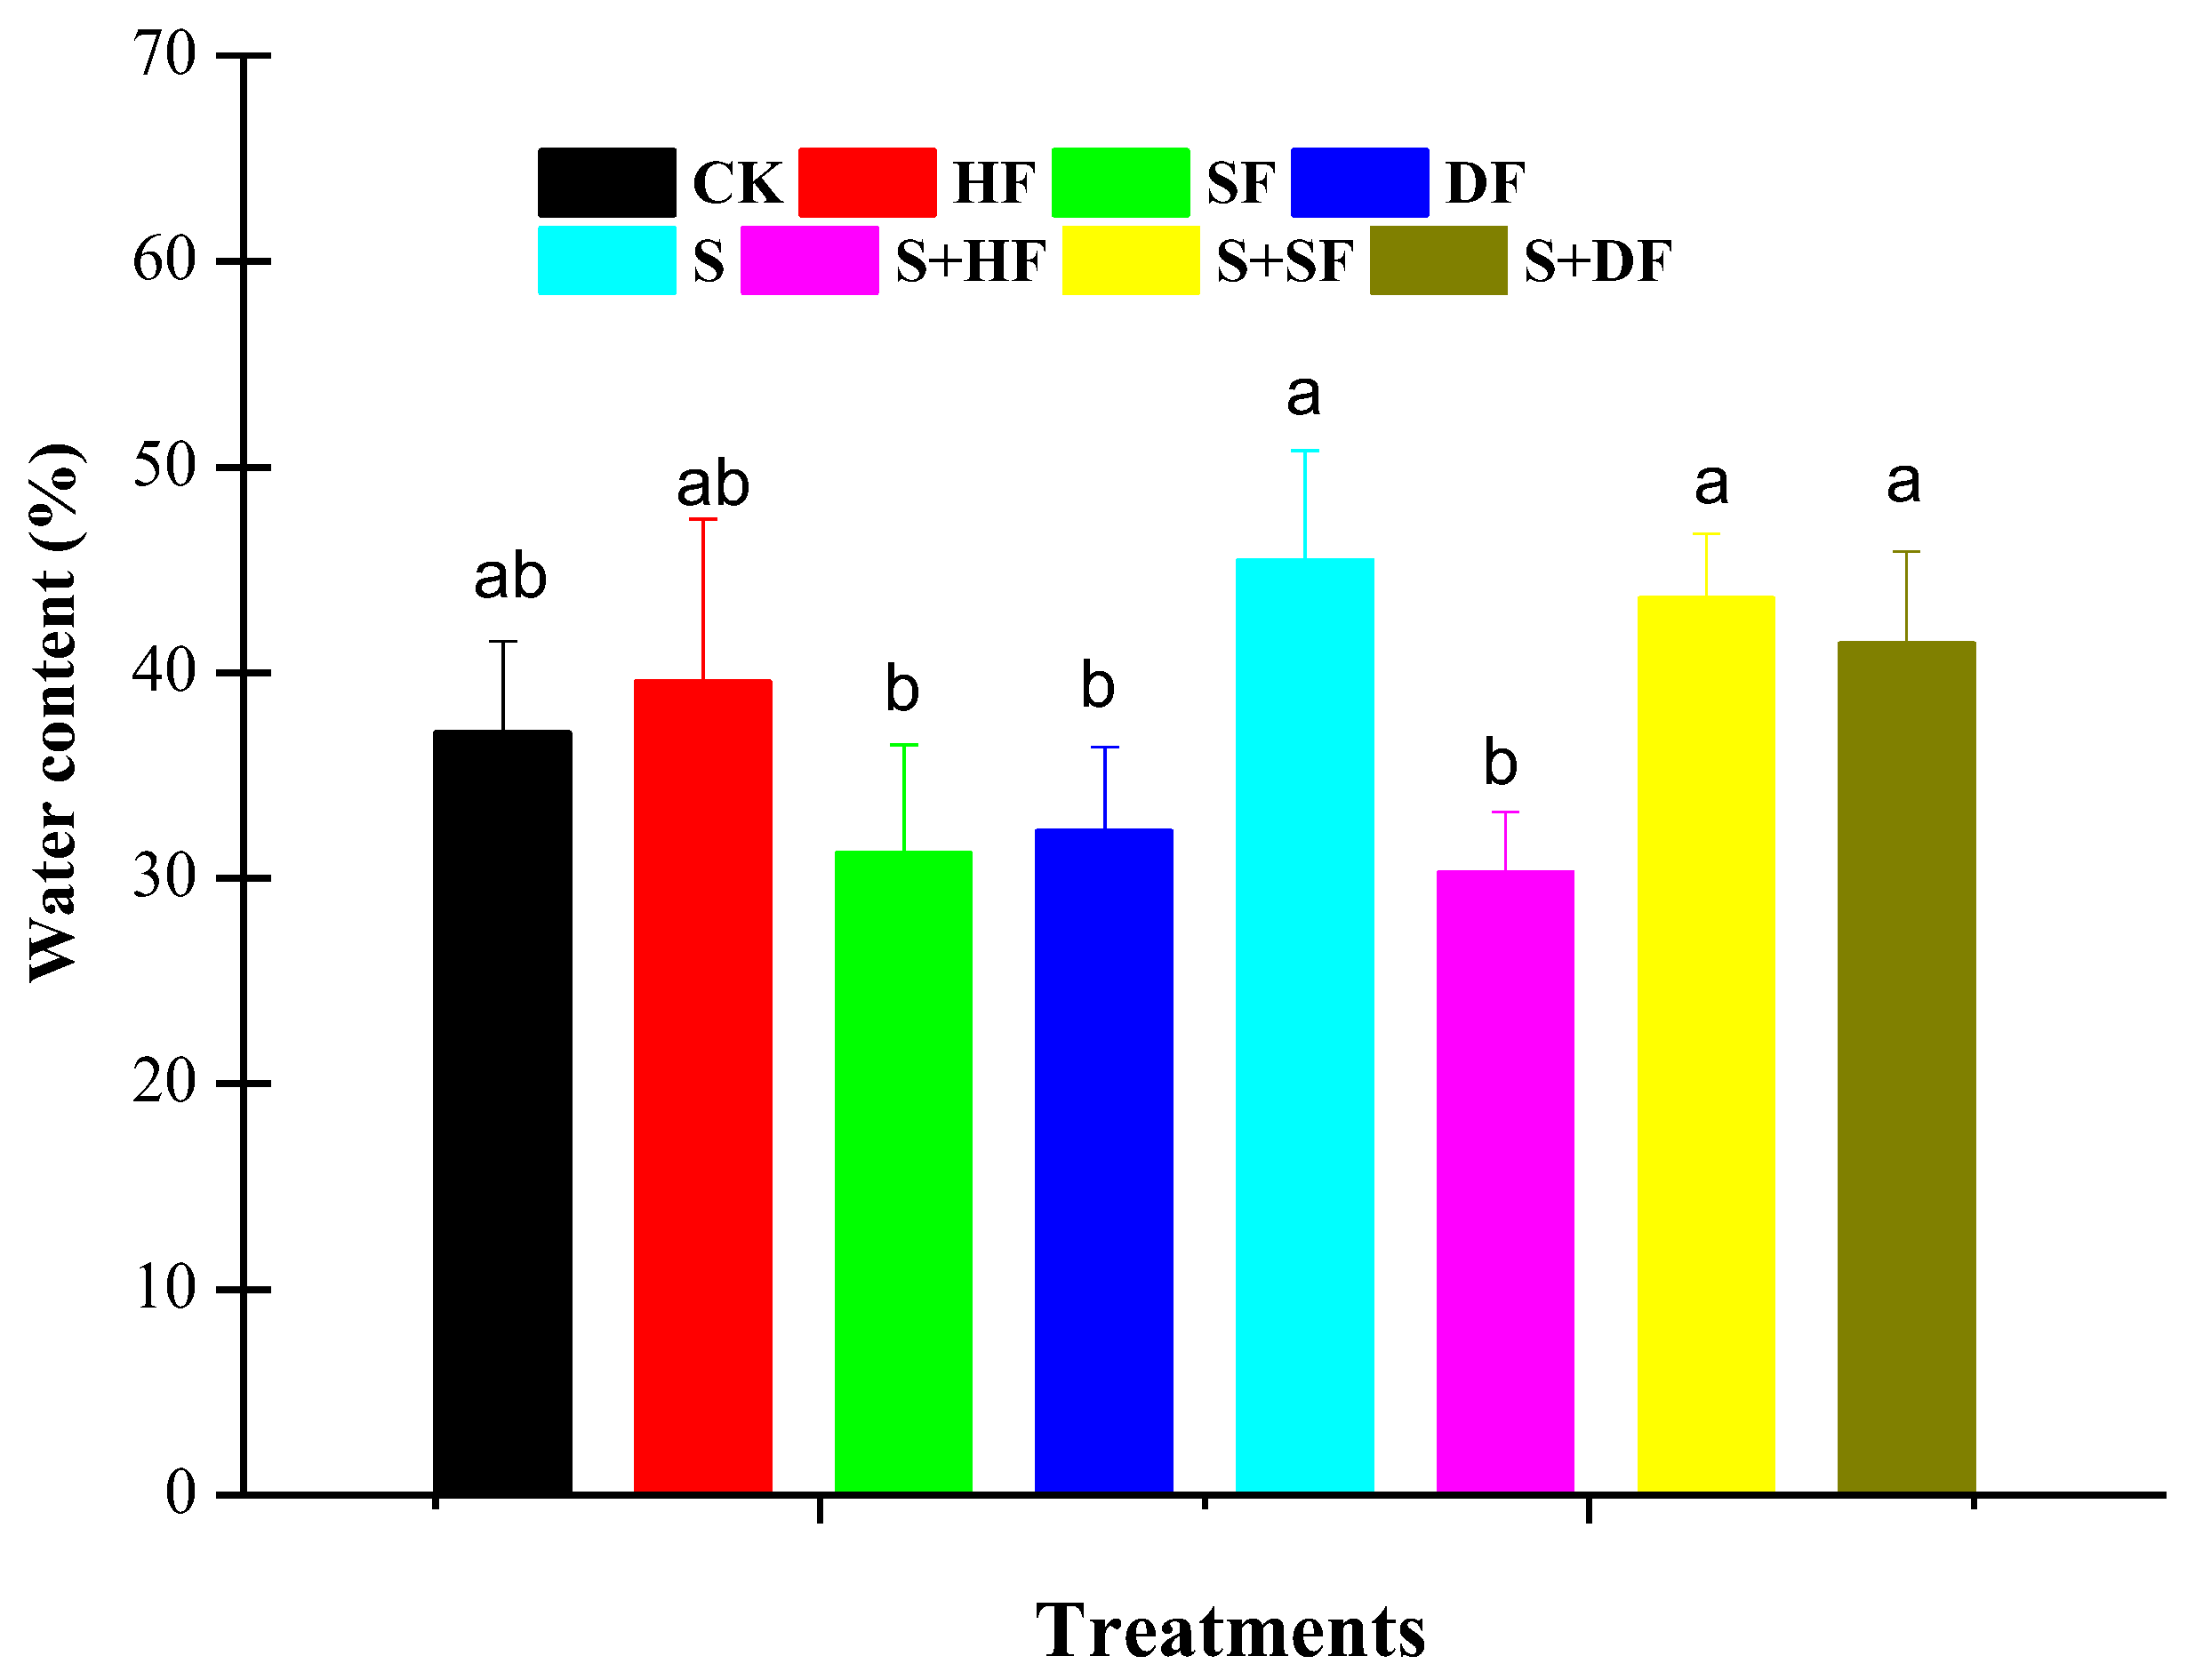
3.1. Soil and Properties

The soil water content varied significantly across sampling dates, and the interactions between treatments and sampling dates (p < 0.01, Table 2, Figure 2), but not for treatments. Soil water content was higher in the straw treatment compared with the control (an increase of about 17.5%); this was especially the case for the straw + standard fertilizer treatment, which was significantly higher than that of the control (p < 0.05), as it showed an increment of about 22.6% (p < 0.05). Moreover, this was also higher than that of the standard fertilizer treatment, which showed an increment of about 14.8% (p < 0.05). Soil temperature varied significantly across treatments, sampling dates, and the interactions between treatment and sampling date (p < 0.01, Table S1, Figure 3). Compared with the control, the soil temperature was relatively low in the only-straw treatment, at about 1%. Soil pH varied significantly across treatments, sampling dates, and the interactions between treatments and sampling dates (p < 0.01, Table S1, Figure 3). In general, the standard and double fertilizer amendments significantly decreased the soil pH in comparison with the control (p < 0.05)—this was about 10.4% and 15.7%. However, the straw + standard fertilizer and double fertilizer amendments increased the soil pH in comparison with the relative fertilizer treatments (about 2.7% and 6.0%). Soil salinity varied significantly across sampling dates (p < 0.01, Table S1, Figure 3), but not for the interactions between treatments and sampling dates and treatments. Salinity was higher in the straw treatment than in the control, and it increased by about 39.8%. This was especially the case for the straw + standard fertilizer treatment, which was significantly higher than that of the control (p < 0.05), and showed an increase of about 74.2%. During the experiment, plants receiving only fertilizer grew less in height (25 ± 1.2 cm) than plants receiving both fertilizer and straw (30 ± 1.4 cm) (p < 0.05).

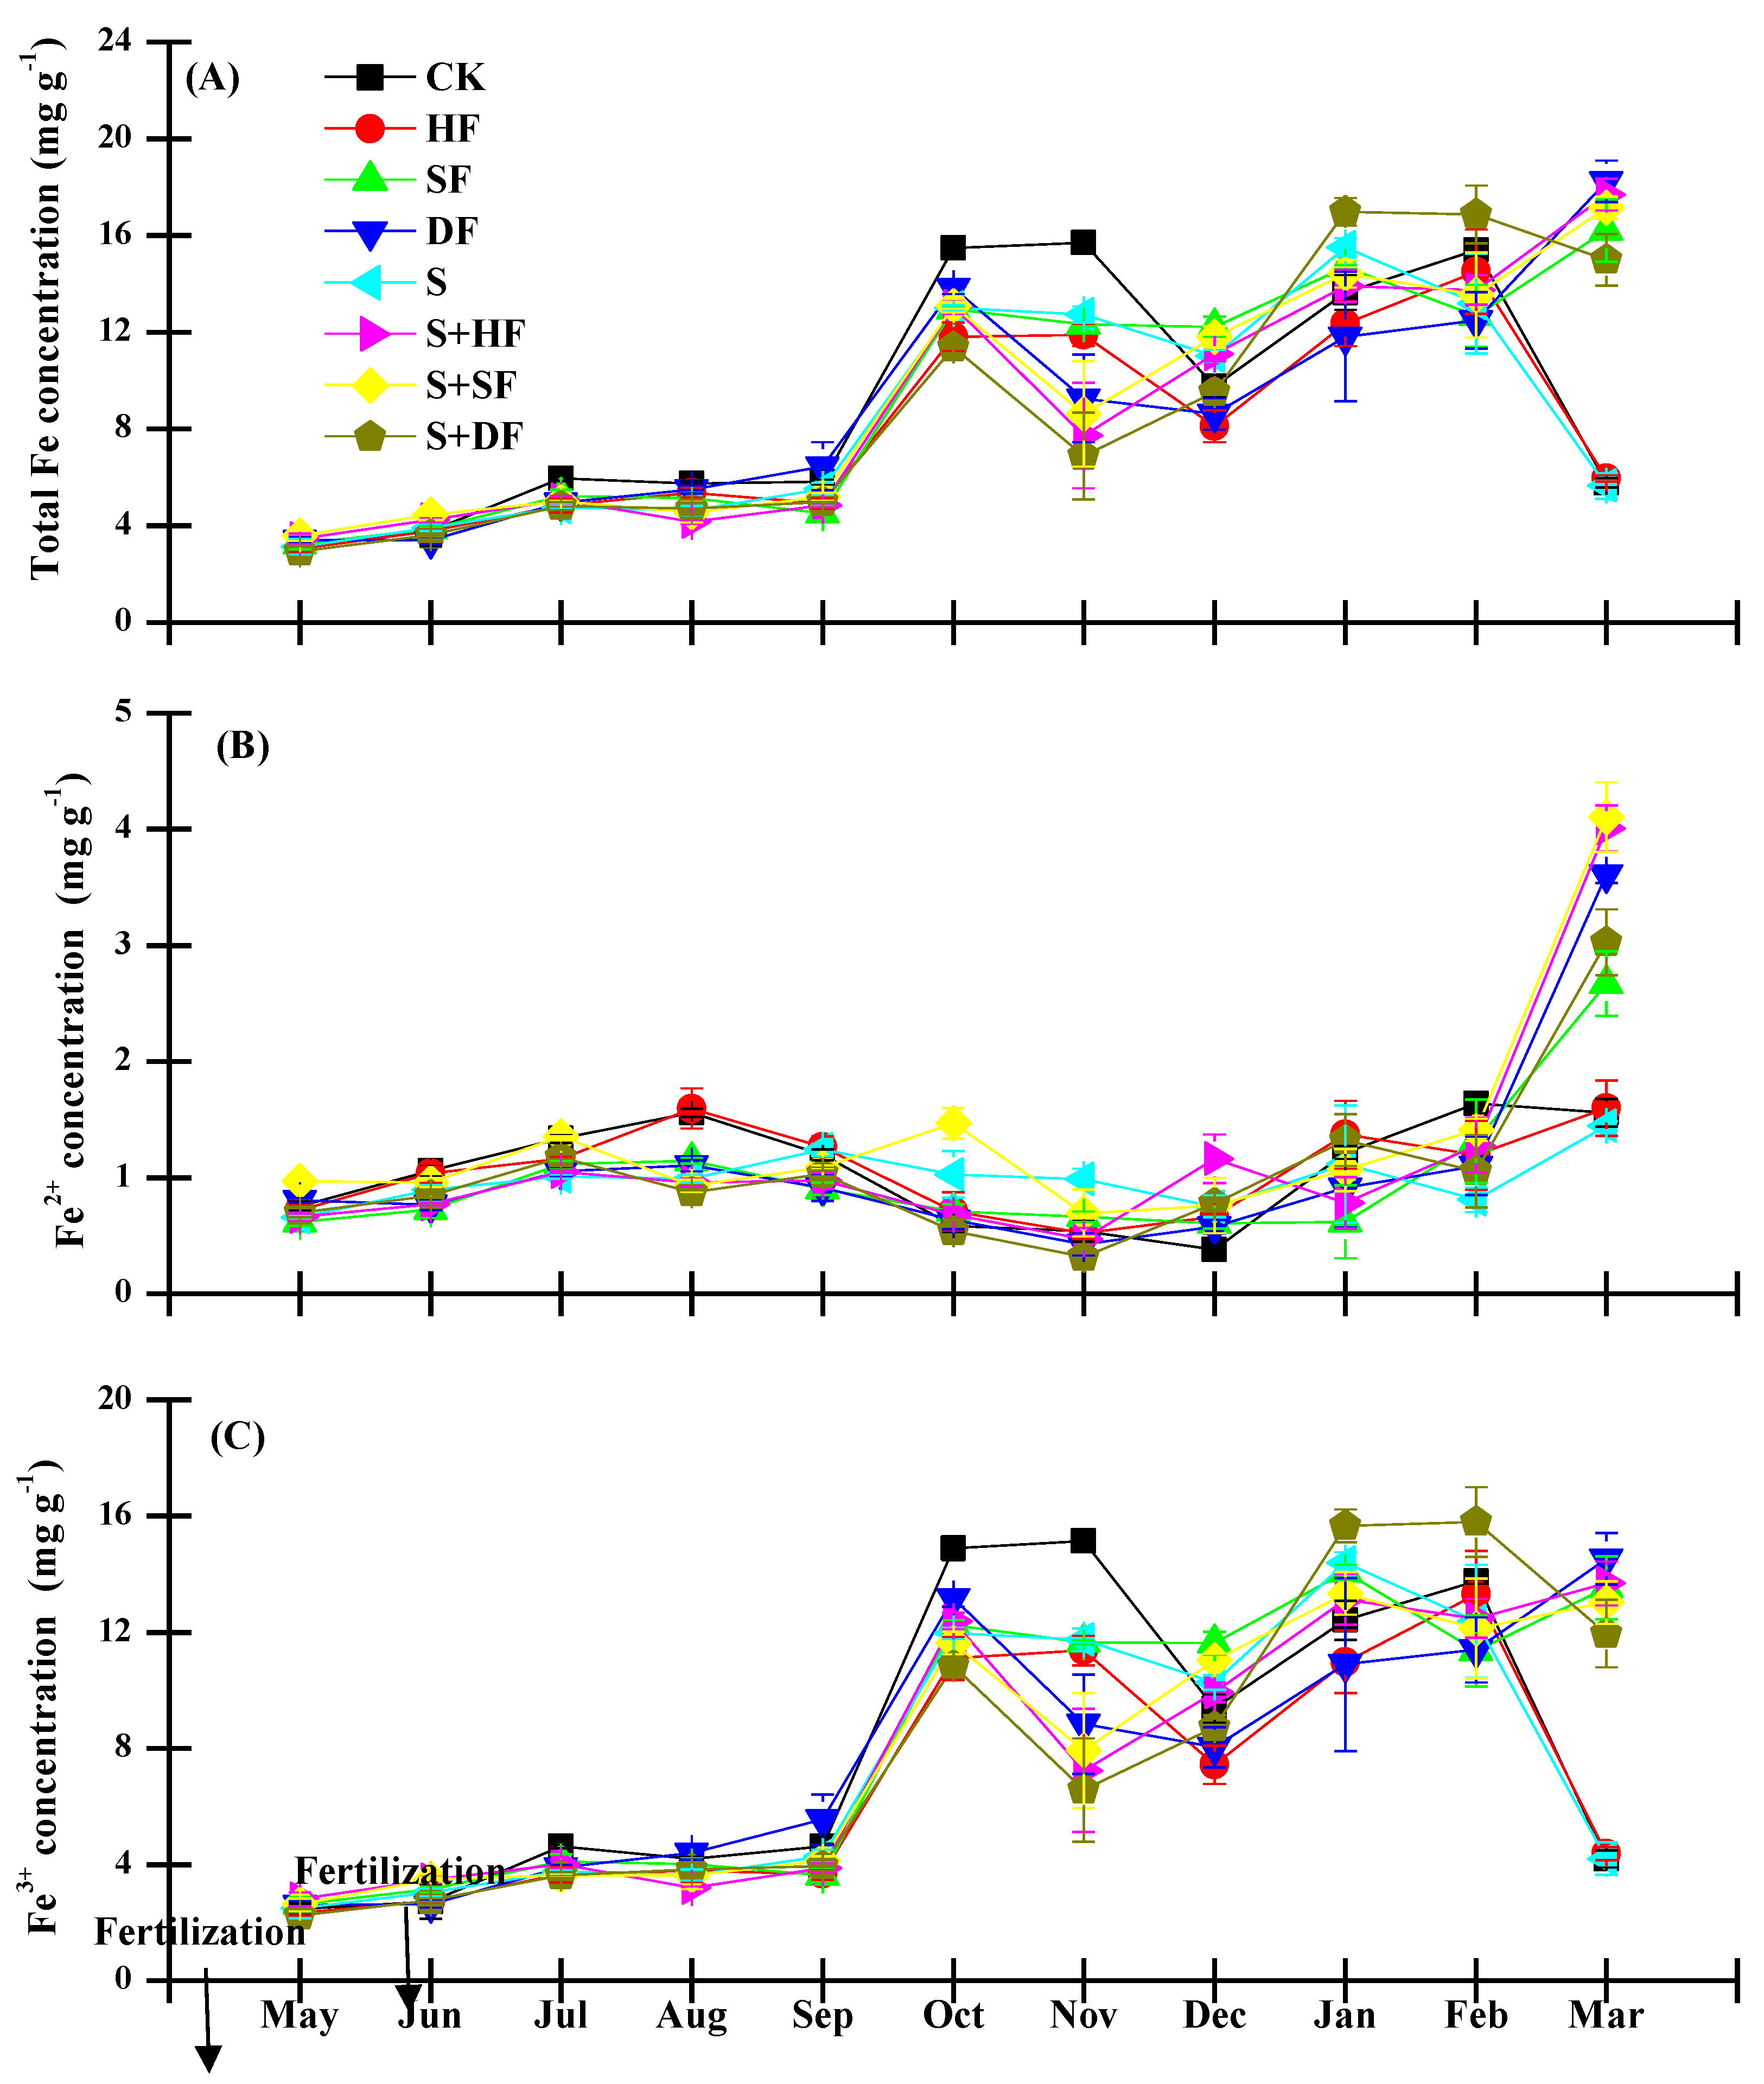
3.2. Soil Active Fe Dynamics

Soil total active iron, in the form of Fe2+ and Fe3+, varied significantly across treatments, sampling dates, and the interactions between treatments and sampling dates (p < 0.01, Table S1, Figure 4). In general, active iron, including total active Fe, Fe2+, and Fe3+ concentrations, were higher after September until the J. sambac was cut in the next year. In general, for total active Fe, the half and double fertilizer treatments decreased the concentrations in comparison with the control, by about 14% and 2%; however, the standard fertilizer treatment increased total active Fe by about 3%. The straw, straw + half fertilizer, and straw + double fertilizer treatments also decreased the total active Fe in comparison with the control, by about 7%, 1%, and 3%, respectively; however, the straw + standard fertilizer treatment increased Fe by about 1%. It appeared that this treatment represented the optimum fertilizer value for active Fe production. For the Fe2+ concentration, the straw + standard fertilizer treatment significantly increased the concentration by about 25%. For the Fe3+ concentration, straw, and the combined amendments with different amounts of fertilizer all decreased the concentration, and this may be due to straw being associated with Fe2+.

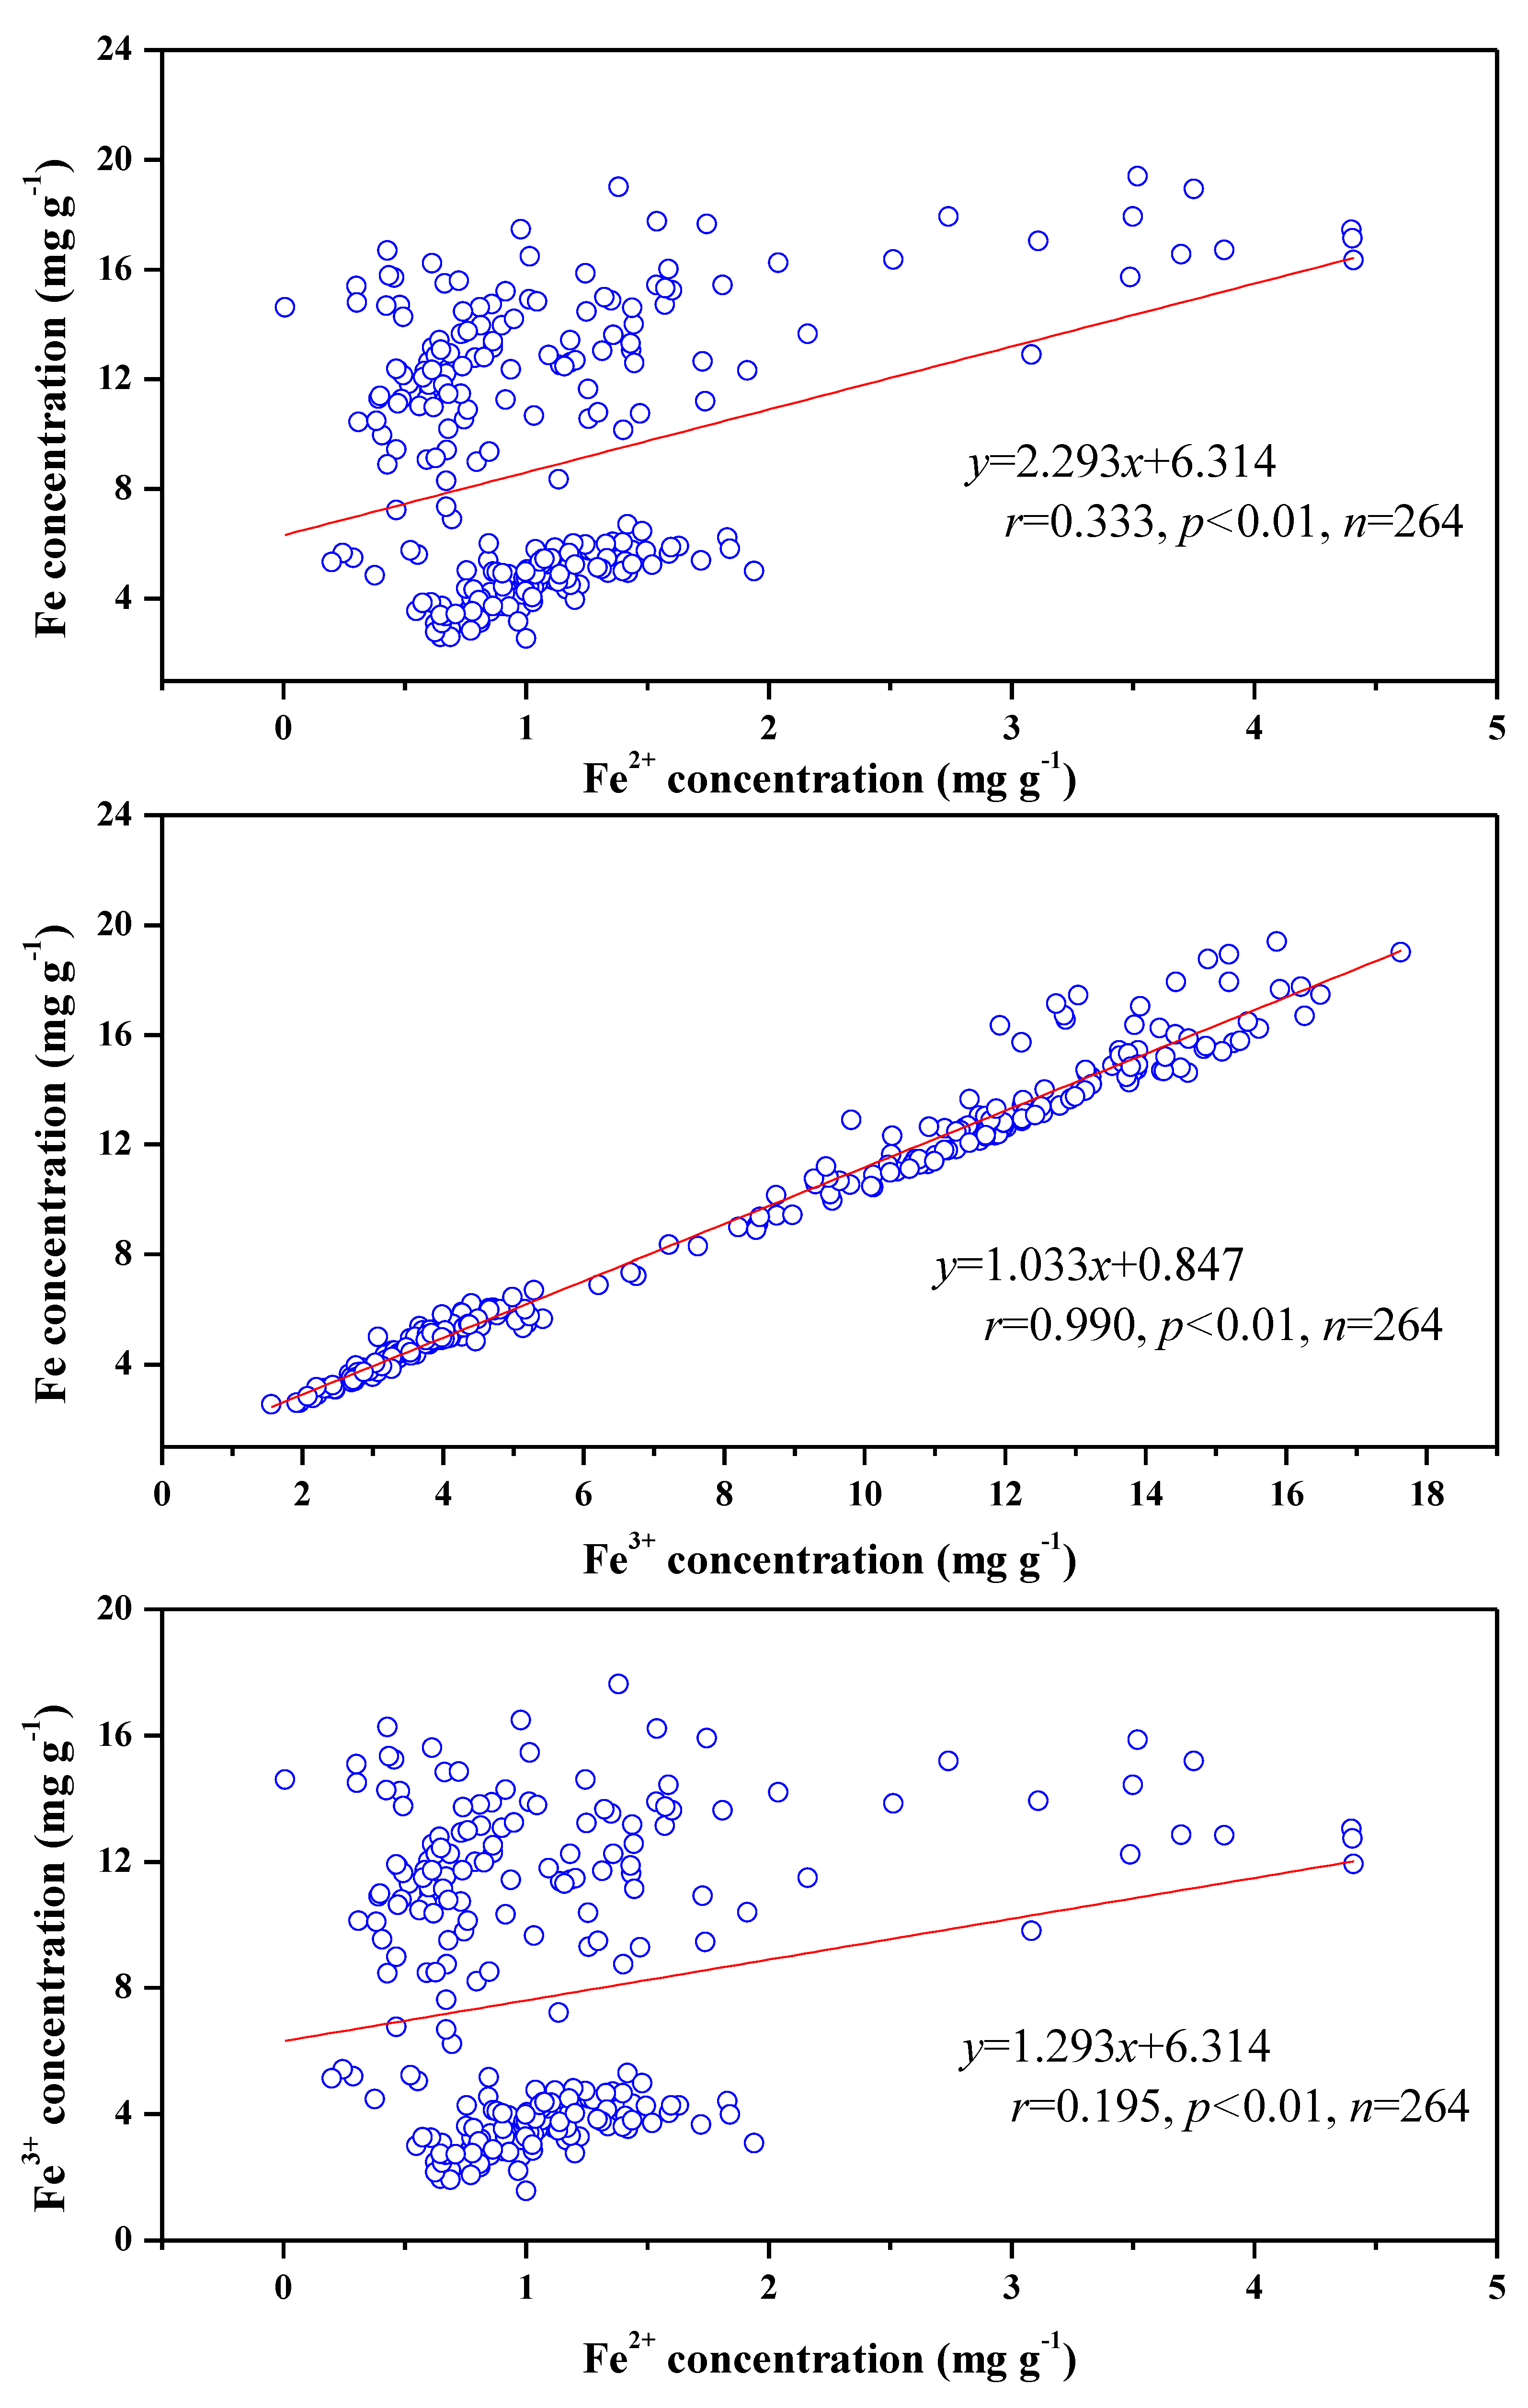
3.3. Relationship between Soil Fe Dynamics and Soil Properties

Soil total active Fe, Fe2+, and Fe3+ were all significantly and positively correlated with each other (Figure 5, Table S2). Whereas, soil active Fe and Fe3+ were positively related with soil pH in standard fertilization, straw + half fertilization, straw + standard fertilization, and straw + double fertilization treatments, soil Fe2+ was negatively related with soil pH in standard fertilization and straw + half fertilization treatments (Table S2). Soil Fe2+ was significantly and positively correlated with soil water content in control, straw, and straw + double fertilization treatments (Table S2).

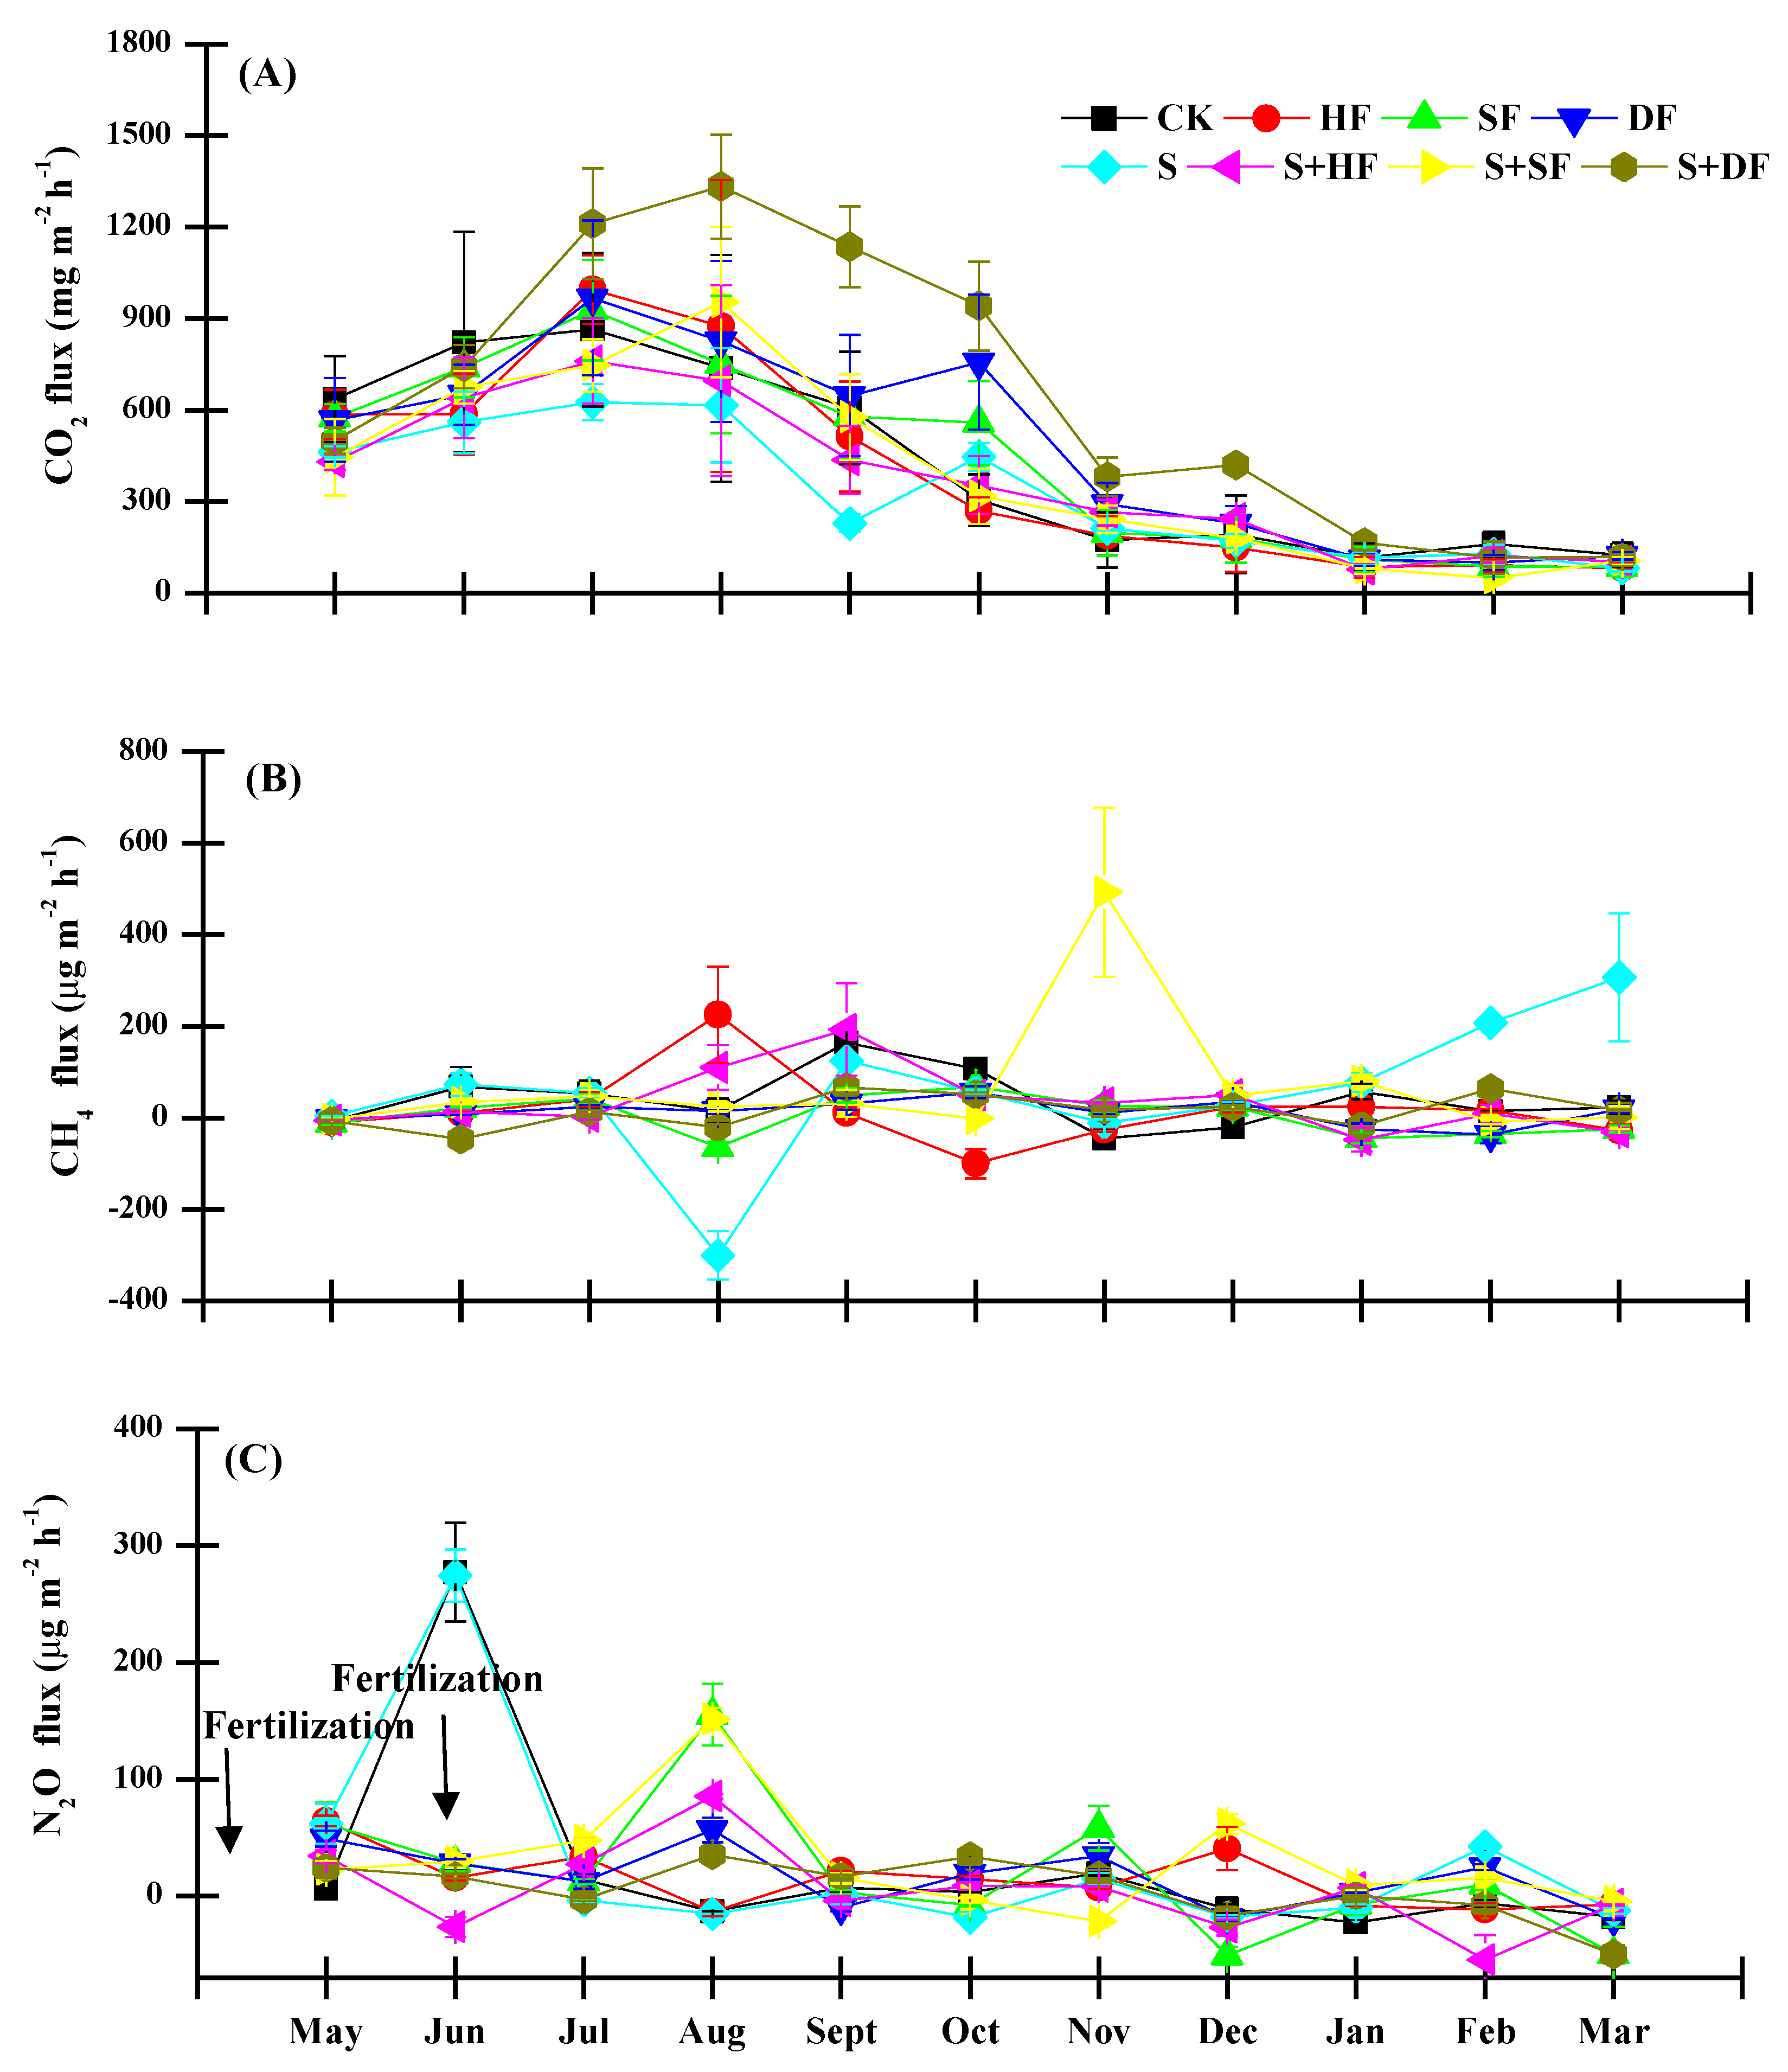
3.4. Greenhouse Gas Emissions

CO2 emissions varied significantly in each sampling date across treatments (Table 2, Figure 6), but not for the interactions between treatments and sampling dates. In general, CO2 emissions increased from March (<640 mg m−2 h−1), and reach a peak in July (>625 mg m−2 h−1), and then decreased as the temperature declined and J. sambac growth slowed until the J. sambac was cut in the next year (Figure 6). In general, the CO2 emissions were higher in the standard and double fertilizer treatments, which increased by about 1% and 11% in comparison with the control; however, the optimum straw or combination of straw and fertilizer amendment, such as straw, straw + half fertilizer, and straw + standard fertilizer treatments lowered the CO2 emissions in comparison with the control, about 23%, 13%, and 8%, respectively.
CH4 emissions varied significantly across different sampling dates and in different form depending on treatments (Table 2, Figure 6). In general, fertilizer treatments decreased the CH4 emission: the half, standard, and double fertilizer treatments decreased CH4 by about 57%, 89%, and 69% in comparison with the control, respectively. However, the straw treatment increased the CH4 emission, by about 45%. Moreover, the CH4 emission in the straw + half fertilizer, straw + standard fertilizer and straw + double fertilizer treatments were increased in comparison with the half, standard and double fertilizer treatments (Figure 6).
N2O varied significantly across different sampling dates and in different form depending on treatments (Table 2, Figure 6). In general, N2O emissions were higher before September and only had a significant emission peak for the control and fertilizer treatments, and then decreased as the temperature declined and J. sambac growth slowed until the J. Sambac was cut in the next year (Figure 6). In general, fertilizer treatments decreased the N2O emission: the half, standard, and double fertilizer treatments decreased N2O by about 39%, 16%, and 30% in comparison with the control, respectively. Moreover, the combinations of straw and fertilizer lowered the N2O emission more: the straw + half fertilizer and straw + double fertilizer treatments decreased N2O in comparison with the half fertilizer and double fertilizer treatments, by about 67% and 62%.

3.5. Relationship Between GHG and Soil Properties

CO2 emission was significantly and positively correlated with the N2O emission only in control, straw + half and straw + double fertilization (p < 0.01, Table S3). CO2 emission was significantly and positively correlated with soil temperature in all treatments and with soil salinity in control, double fertilization and straw + double fertilization treatment (Table S3), and was significantly and negatively correlated with soil water content in control and standard fertilization treatment, total active Fe in all treatments, Fe2+ only in straw + double fertilization and with Fe3+ in all treatments (Table S3). CH4 emission was significantly and positively correlated with soil pH in half fertilization treatment (Table S3). CH4 emission was significantly and positively correlated with soil temperature in double fertilization treatment and with soil salinity in standard fertilization and straw + double fertilization treatments (Table S3). N2O emissions were positively related with soil temperature in straw and straw + fertilization treatments with soil salinity in straw + half fertilization and was negatively correlated with soil water content in straw + half fertilization treatment, with soil pH in control, straw, straw + half fertilization, and straw + standard fertilization, with total active Fe in all treatment less in straw + standard fertilization and straw + double fertilization, with Fe2+ in half fertilization treatment and with Fe3+ in half, standard, and double fertilization treatments and straw + half fertilization treatment (p < 0.01, Table S3).

3.6. Plant Height

In most of the treatments plants tend to reach higher height than in controls but only plants growing in straw + double fertilization plots grow significantly more in height than plants in control and in half fertilization plots (Figure S2).

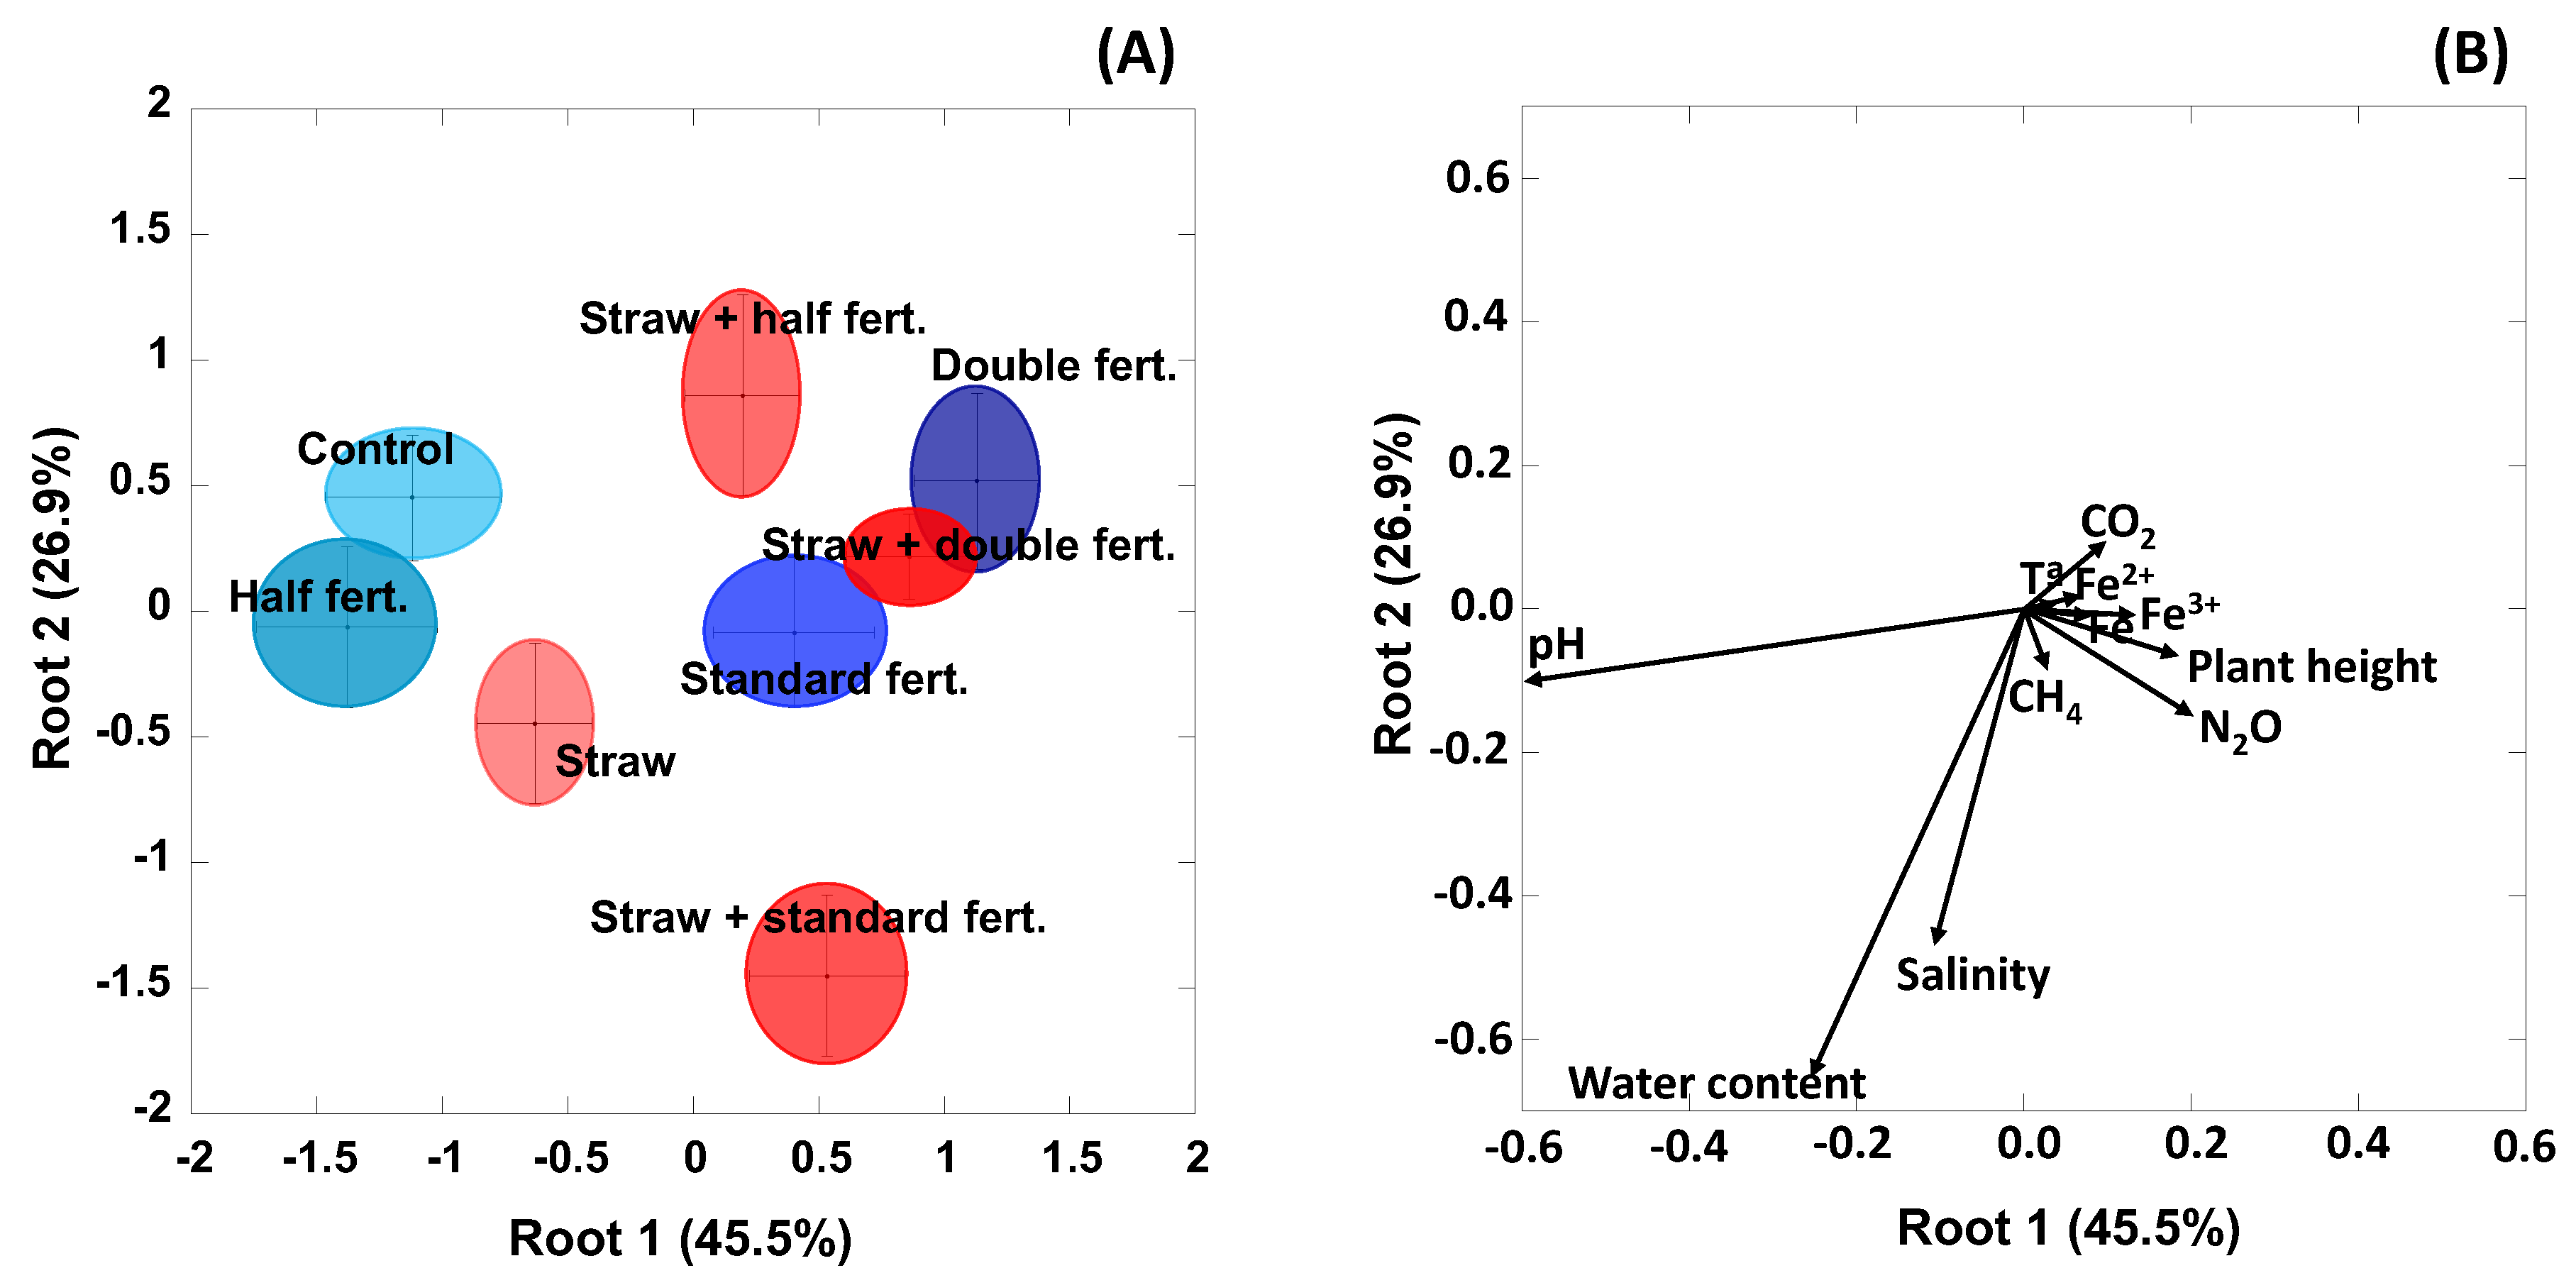
3.7. General Discriminant Analysis

The plot formed by the first two roots of the GDA, with all studied variables as independent continuous variables, showed that the treatment with straw + standard fertilization was clearly placed along route 2 towards the highest soil water content and salinity, variables that mainly loaded the second root (Figure 7). This analysis also showed that soil pH, plant height, and N2O emissions are the variables that mainly loaded root 1, whereas soil water content and soil salinity mainly loaded root 2 and, thus, were the variables that mainly separated the different treatments (Tables S4 and S5, Figure 7). Thus this multivariate analysis clearly showed that soil traits and plant size had highly proportion role in treatment overall differences whereas soil emissions have lower role in treatment differences (Tables S4 and S5, Figure 7). Most treatments were separated in the GDA model (Table S5), and we observed that straw plus standard fertilization was separated from other treatments including control and only standard fertilization by higher soil water content and salinity and did not differ practically for gas emissions that in fact had low separation role among treatments.

4. Discussion

4.1. Effects of Straw, Fertilizer Doses, and Their Combination on Soil Properties

Soil water content was higher in the straw treatment in comparison with the fertilizer treatment, which could be attributed to the ability of straw in absorbing water, therefore keeping the soil wetter. Also, the addition of straw could reduce soil temperature and hence evaporation of soil water, which helps to retain water in the soil [30]. The average soil water content during the studied crop period was higher in straw, straw + standard fertilization and straw + double fertilization treatment (Figure 2). The soil pH was lower in the fertilizer treatments compared with the control, because of nitrification of NH4+ from the fertilizer, leading to the most acid material being kept in the soil, thereby decreasing the soil pH [31]. These lower nitrification rates in only fertilization treatments are consistent with the lower soil pH in these treatments given that the optimum pH for nitrification is around 8.5. However, the combination amendment of straw and fertilizer increased the soil pH compared with the fertilizer treatments, especially for the straw + standard fertilizer treatment, which could be explained by straw containing many alkaline compounds [5,27]. Salinity was higher for the straw + fertilizer treatments compared with the fertilizer treatments and control. Straw contains numerous elements essential for plant growth, including nitrogen, phosphorus, potassium, calcium, sodium, etc. [3,32,33] that following straw decomposition could contribute to increase of salinity. Moreover, the optimum fertilizer promotes straw decomposition [34] and then these elements, including nitrogen, phosphorus, potassium, calcium, sodium, etc., can be released more quickly.

4.2. Effects of Straw, Fertilizer Doses, and Their Combination on Active Iron Dynamics in the Soil

In general, total active Fe and Fe3+ concentrations were lower in treatment plots compared with the control, except for the straw + standard fertilizer treatment, for which Fe3+ was the main form of total active Fe, which was similar to previous work [6]. Moreover, in our study, Fe3+ ions and total active iron was significantly correlated, which is consistent with Fe characteristics in dry land sites [6]. In our study, the Fe3+ concentration was decreased by the fertilizer treatment. The fertilizer included N in NH4+ form, which could stimulate the production of hydroxylamine through the biological oxidation of NH4+ in dryland conditions. Hydroxylamine may have further reacted to result in the chemical reduction of Fe3+ [35] or may have induced microbial activity by Fe3+ reduction [36]. The straw also decreased Fe3+ concentration, likely because it is a carbon substrate that can promote Fe3+ reduction [37] and thus lower the Fe3+ concentration. Furthermore, straw, alone and in combination with fertilizer, increased plant growth [38], and more Fe can be absorbed and accumulated in plant biomass. Moreover, in our study, the pH was lower than 7.0, which does not favor rapid Fe2+ oxidation, thereby lowering Fe3+ production [39]. In our study, soil pH was lower in the fertilizer treatment compared with the control, and therefore had lower Fe3+ concentrations after fertilizer amendments. The period from July to September coincided with summer and thus with strong rain and irrigation. Under these conditions, controls and half fertilization treatment would have less capacity to affect soil’s interchangeable complex and thus mobilization of more H+ than other treatments. They also have less capacity to retain water in soil in particular with respect treatments providing straw and thus partially avoiding leaching.

4.3. Active Iron Correlations and Their Influencing Factors

Soil total active Fe, Fe2+, and Fe3+ were all significantly and positively correlated with each other. The results showed that the different forms of soil Fe were the transformation substrates for each other [40,41,42]. Soil Fe3+ was significantly and negatively correlated with soil salinity, because higher salinity inhibits bacterial iron oxidation [43], then Fe3+ was lowered once the soil Fe3+ was absorbed by the plant [44], thus lowering the Fe3+ concentration in the soil. Soil Fe2+ was significantly and positively correlated with soil water content, which can induce flooding and the development of anaerobic conditions favoring Fe3+ ion reduction [45], and microbial Fe3+ ion reduction, and increasing Fe2+ concentration [46].

4.4. Effects of Straw, Fertilizer Doses, and Their Combination on CO2 Emission

CO2 emission varied seasonally, increasing with plant growth and temperature. Temperature controls CO2 production and emission by increasing soil microbial activity [47], as well as altering plant respiration. The observed relationships between CO2 emissions and plant growth were consistent because more active plant activity was likely associated with greater rates of growth and activity, thereby favoring higher overall ecosystem CO2 emissions. In general, the CO2 emissions were higher in the fertilizer treatments compared with the control for several potential reasons. Firstly, fertilization, such as N fertilization, promotes the deposition of photosynthetically derived C into soil organic carbon pools [48], and soil CO2 emissions could increase after the labile carbon substrates increase [49]. Secondly, fertilizer can provide many nutrients for microbial growth [50], and an increase in microbial activity promotes soil respiration and thus the emission of CO2 [51]. Thirdly, NH4+ from fertilizers can be oxidized to NO3 when soil is drained, increasing soil NO3 concentration. The NO3 would be reduced when the soil is reflooded by the mechanism that oxidizes organic carbon producing CO2 [5]. Moreover, the NH4+ amendment may have been associated with Fe3+ ion reduction by improving N supply for iron reducing bacteria, which would also increase the production and release of CO2 as described on the previous sentence. [52]. Moreover, the Fe3+ ion reduction increment should also decrease the number of iron plaques on the roots, which would promote root ventilation and increase the transport of materials throughout the plants [53], so more CO2 is produced and transported through the internal system of the plants. Moreover, in the straw + standard fertilizer treatments in particular, we observed a decrease of CO2 emission in comparison with the control. Some studies have already observed that fertilization management among farming practices can be the best tool to drive soil organic carbon(SOC) balances in cropping lands [54]. Both standard fertilization treatment and standard fertilization despite not having significantly different consequences in plant growth, thus have different soil CO2 emissions. This strongly suggested that the low ecosystem CO2 emissions observed following straw incorporation was probably due to microbial changes rather than plant root activities.

4.5. Effects of Straw, Fertilizer Doses, and Their Combination on CH4 Emission

The different peak and lowest fluxes of CH4 were caused mainly by the integrative effect of soil pH, salinity, and water content [24]. In our study, fertilizer treatment decreased CH4 emissions. Fertilizer included N in the form of NH4+, which can quickly oxidize to NO3 in aerobic dryland [55]. NO3 is the most important electron acceptor, which can inhibit methane production [5], because NO3 reducing bacteria tends to outcompete methanogens. Moreover, methane can be oxidized by NO3 through nitrate reducing bacteria and later denitrification-dependent anaerobic methane oxidation can increase methane oxidation [56]. In addition, NO3 reduction produces nitrite, and nitrite can have a toxic effect on methane producing microbes, and therefore inhibiting methane production [57]. Moreover, the NH4+ amendment in our study may have been associated with Fe3+ ion reduction [52], which, as one of the most important electron acceptors, should also decrease CH4 production via a similar mechanism as NO3. Besides the above, fertilization also increases the availability of nutrients and raises the plant biomass, which will promote soil oxygen concentration, and then inhibit CH4 production and emissions from microbes. Moreover, the straw, straw + half fertilizer, and straw + standard fertilizer treatments increased the CH4 emission. Straw would lead to more organic C input into soils, and thus, as the production substrate increases, CH4 emission increases [58]. Moreover, in our study, the soil water content also increased for the straw, alone and in combination with the fertilizer. This water increment induces a relatively anaerobic environment, which promotes methane production [59].

4.6. Effects of Straw, Fertilizer Doses, and Their Combination on N2O Emission

N2O emission was higher during the first month of fertilizer application as compared to later stages. A high N2O emission during the first month was probably associated to the conversion of nitrate (coming from NH4+ oxidation) from N fertilizer into N2O [60] because the beginning of our experiment was during the rainy season in the study areas. A decreased N2O emission after the first month would be explained by the decreased availability of nitrate because of its conversion into N2O. Previous studies have reported significant increases in N2O emissions upon addition of fertilizers and a subsequent decrease with time [61,62,63]. High N2O emissions were observed in all treatments during the initial stage of fertilizer application, suggesting that addition of the N substrate increased microbial activity [60]. However, in general, the averaged N2O emissions were lower in the fertilizer treatments, because the study area was N limited. Indeed, a previous study reported decreased N2O emissions in the same paddy fields after fertilizer amendment [64]. In our study, the N added in the fertilizer was quickly absorbed into the plant biomass, which lowered the soil N concentration, thereby leading to decreased N2O production and emissions. We also observed that under straw treatments, the N2O emissions were also decreased, which was related to increased C:N substrate input that strengthened the N limitation in the soil [5]. However, if straw and fertilizer are used, as in the straw + fertilizer treatment, N2O emissions can also be increased.

4.7. Relationship between GHG and Soil Properties

CO2 emission was positively correlated with the N2O emission. This could be due to the production of both of these GHGs occurring simultaneously, and NO3 reduction can also produce these GHGs. Despite these results some previous studies have observed that, CO2 can limit the NH4+-oxidizer microbe populations [65]. CO2 emission was significantly and positively correlated with soil temperature. Temperature controls CO2 production and emission not only by increasing soil microbial activity [47], but also by altering plant respiration [48]. Moreover, CO2 emission was significantly and positively correlated with soil salinity in our study and the salinity was relatively low (<1 mS cm−1). Salinity is formed by the presence of numerous elements, including nitrogen, phosphorus, potassium, calcium, sodium, etc., which are essential for plant [66] and microbe growth [67], therefore favoring higher plant and microbe CO2 emissions. However, CO2 emission was significantly and negatively correlated with soil water content, consistent with higher anaerobic conditions, which would lead to lower respiration and CO2 emission [68]. Moreover, the CO2 emission was significantly and negatively correlated with soil active Fe because Fe is the most important cementing material, which can combine carbon by chemical bonds, and make it more stable [69]. Following this, the active carbon substrate is lowered, which then decreases the organic matter metabolic use and mineralization, thus reducing CO2 production and emission [70].
CH4 emission was significantly and positively correlated with soil pH. This relationship is consistent in our study because the soil is acidic; this type of soil inhibits methane producing microbes and methane production. Therefore, the optimum methane production occurs when the pH is near neutral, and methane production increases as the pH rises.
N2O emission was significantly and positively correlated with soil temperature, because as temperature increases, soil microbial NH4+ oxidation is promoted, and the nitrification process can produce more N2O and increase N2O emission [71]. N2O emission was significantly and positively correlated with soil salinity. A previous study showed that a salinity increment promoted N2O emission [72]. In our study, NO3 was the main N substrate in the dryland, and the N2O production pathway maybe dominated by denitrification, which was promoted as salinity increased, and was then responsible for higher N2O production and emission [73]. N2O emission was significantly and negatively correlated with soil pH; N2O production is enhanced in slightly acidic pH [74], but in our study, the soil pH value was habitually lower than 7.0, thereby favoring the negative correlation. Moreover, N2O emission was significantly and negatively correlated with soil Fe2+ and Fe3+. This is associated with the role of Fe as the most important cementing material, which can combine organic matter, including N, by chemical bonds, and thus decreasing N availability, which will then decrease N2O production and emission [75].

4.8. Best Management Practices to Improve Soil Properties and Reduce GWP

Our results showed that the straw + standard fertilizer treatment increased average soil water content during the studied year after treatment applications, thus indicating a better soil capacity to retain water, which is very important for a good management of dryland management. More data of other sites and for longer periods including several years are necessary to corroborate this result. The first 15 cm of soil depth, during the crop period there was on average 683 × 103 kg·ha−1 of water in straw + standard fertilization treatment whereas in only standard fertilization treatment the water content was 594 × 103 kg·ha−1. The results, despite based only in one-year measurements strongly suggest that straw application could be an effective measure for increasing water storage as well as for conserving soil water. This will be especially important in crops in dry conditions such as Jasmine. Straw can also avoid soil dispersion and sealing by heavy rains in the rainy season of this subtropical zone, thus more nutrients can be stored in the soil and increase J. sambac growth. The results thus provide a clear clue that the use of straw has a great potential to enhance soil water content and therefore to improve crop productivity. This could be a relevant improvement since the areas of jasmine cultivation in China are more than 12,000 hm−2 and they are on expanding (China Tea Circulation Association, 2017). Moreover, China has millions of ha of dry crops, a part of J. sambac dry, where straw could be also applied. Water and nutrient increments would increase plant growth in those dryland areas [5,76,77,78].
Soils amended with straw, alone and in combination with synthetic fertilizer, had higher pH in comparison with soils with only fertilizer treatment. This effect can help to solve the soil acidity problem, which is very important in dryland soils where long-term synthetic N fertilization intensifies soil acidification [79]. Soil acidity reduces yield, root growth, and nutrient uptake [80]. Organic material, such as manure or straw, can improve the soil pH [5,77,79], thus increasing the soil nutrient retention capacity and thus availability for plants, and can therefore increase the crop yield [77].
In the subtropical zone, plant growth is significantly limited by nutrient availability, especially N [81]. In our study, the active Fe decreased after application of fertilizer, straw, and in combination treatments, except in the straw + standard fertilizer treatment. In a previous study, an amendment of steel slag, rich in Fe, in the paddy field increased the rice yield [77], and this may also be possible for J. sambac growth and production, especially when combined with straw.
Moreover, in our study, synthetic fertilizer increased the CO2 emission, but the straw + standard fertilizer treatment decreased it, which revealed that the proper management and optimum combination of straw and fertilizer can provide better control of CO2 emissions in drylands. However, fertilizer decreased CH4 and N2O emissions, and in the case of these both gasses, the straw + fertilizer treatment increased their emissions. The results of this study are consistent with previous studies showing that the application of straw improves fertilization management by maintaining yield while diminishing GHGs emissions [82]. Moreover, jasmine crops emit less CO2 and CH4 and more N2O than rice crops in this area of China [83].

Supplementary Materials

The following are available online at https://www.mdpi.com/2071-1050/11/4/1092/s1, Figure S1: Air temperature and air humidity, Figure S2: Plant height in control and distinct treatments, Table S1: RM-ANOVAs of the soil properties, Table S2: Correlation among different soil variables, Table S3: Correlations of CO2, CH4 and N2O gas emission with the different soil variables, Table S4: Main effects of the variables in the GDA analysis, Table S5: Test statistics for squared Mahalanobis distances among treatments and control in the GDA analysis.

Author Contributions

C.W., W.W., and Q.M. designed the experiment; C.W. and W.W. performed the experiment; C.W., W.W., A.A.A., J.S., and D.Y.F.L. provided data analyses; and C.W., X.L., W.W., A.A.A., J.S., H.W., and J.P. co-wrote the paper.

Funding

Funding was provided by the National Science Foundation of China (41571287; 31000209), Research Project of Public Institute of Fujian Province (2018R1034-1), Science and Technology Program of Fuzhou City (2016-N-86), and Outstanding Young Research Talents in Higher Education of Fujian Province (2017), European Research Council Synergy grant ERC-SyG-2013-610028 IMBALANCE-P, Spanish Government grant CGL2016-79835-P, and Catalan Government grant SGR 2017-1005.

Acknowledgments

The authors would like to thank Xiaohui Liu, Guixiang Chen, Xiaoting Huang, and Xu Song for their assistance with field sampling.

Conflicts of Interest

The authors declare no conflict of interest.

References

  1. Ford, A.; Gilroy, G. What agriculture will support human life? Curr. Anthropol. 2015, 56, 776–777. [Google Scholar] [CrossRef]
  2. Parmar, D.K.; Verma, T.S.; Deor, B.S.; Mishra, A.; Vermani, A. Enhancing yield and profitability of a western himalayan vegetable production system by balancing nutrient inputs through farmyard manure and synthetic fertilizer applications. J. Sustain. Agric. 2007, 29, 89–99. [Google Scholar] [CrossRef]
  3. Zhang, B.; Pang, C.; Qin, J.; Liu, K.; Xu, H.; Li, H. Rice straw incorporation in winter with fertilizer-n application improves soil fertility and reduces global warming potential from a double rice paddy field. Biol. Fert. Soils 2013, 49, 1039–1052. [Google Scholar] [CrossRef]
  4. Liu, E.K.; Yan, C.R.; Mei, X.R.; He, W.Q.; Bing, S.H.; Ding, L.P.; Liu, Q.; Liu, S.; Fan, T. Long-term effect of chemical fertilizer, straw, and manure on soil chemical and biological properties in Northwest China. Geoderma 2010, 158, 173–180. [Google Scholar] [CrossRef]
  5. Wang, W.; Lai, D.Y.F.; Sardans, J.; Wang, C.; Datta, A.; Pan, T.; Zeng, C.; Bartrons, M.; Peñuelas, J. Rice straw incorporation affects global warming potential differently in early vs. late cropping seasons in Southeastern China. Field Crop. Res. 2015, 181, 42–51. [Google Scholar] [CrossRef] [Green Version]
  6. Liu, X.; Yan, J.; Yang, W.; Zeng, Y.; Zeng, C.; Wang, W. Effects of straw amendment with industrial and agricultural wastes on carbon emission from jasmine plantation. Acta Sci. Circumst. 2017, 37, 1555–1563. [Google Scholar]
  7. Li, Y.T.; Bai, D.S.; Zhang, F.S.; Jiang, R.F.; Mao, D.R. Effect of acidic rhizosphere fertilizer on the soil pH and Fe availability of calcareous soil. Plant Nutr. Fert. Sci. 2003, 9, 312–316. [Google Scholar]
  8. Hou, H.; Peng, S.; Xu, J.; Yang, S.; Mao, Z. Seasonal variations of CH4 and N2O emissions in response to water management of paddy fields located in Southeast China. Chemosphere 2012, 89, 884–892. [Google Scholar] [CrossRef]
  9. Intergovernmental Panel on Climate Change (IPCC). Climate change 2007: The physical science basis. In Contribution of Working Group I to the Fourth Assessment Report of the Intergovernmental Panel on Climate Change; Solomon, S., Qin, D., Manning, M., Chen, Z., Marquis, M., Averyt, K.B., Tignor, M., Miller, H.L., Eds.; Cambridge University Press: Cambridge, UK; New York, NY, USA, 2007. [Google Scholar]
  10. FAO (Food and Agricultural Organization of the United Nations). OECD-FAO Agricultural Outlook 2010–2030; FAO: Rome, Italy, 2009. [Google Scholar]
  11. Zhang, W.; Mo, J.M.; Yu, G.R.; Fang, Y.T.; Li, D.J.; Lu, X.K.; Wang, H. Emissions of nitrous oxide from three tropical forests in Southern China in response to simulated nitrogen deposition. Plant Soil 2008, 306, 221–236. [Google Scholar] [CrossRef] [Green Version]
  12. Janssens, I.A.; Dieleman, W.; Luyssaert, S.; Subke, J.A.; Reichstein, M.; Ceulemans, R.; Ciais, P.; Dolman, A.J.; Grace, J.; Matteucci, G.; et al. Reduction of forest soil respiration in response to nitrogen deposition. Nat. Geosci. 2010, 3, 315–322. [Google Scholar] [CrossRef]
  13. Zhang, T.; Zhu, W.; Mo, J.; Liu, L.; Dong, S. Increased phosphorus availability mitigates the inhibition of nitrogen deposition on CH4 uptake in an old-growth tropical forest, southern China. Biogeosciences 2011, 8, 2805–2813. [Google Scholar] [CrossRef]
  14. Krause, K.; Niklaus, P.A.; Schleppi, P. Soil-atmosphere fluxes of the greenhouse gases CO2, CH4 and N2O in a mountain spruce forest subjected to long-term N addition and to tree girdling. Agric. For. Meteorol. 2013, 181, 61–68. [Google Scholar] [CrossRef]
  15. Tu, L.H.; Hu, T.X.; Zhang, J.; Li, X.W.; Hu, H.L.; Liu, L.; Xiao, Y.L. Nitrogen addition stimulates different components of soil respiration in a subtropical bamboo ecosystem. Soil Biol. Biochem. 2013, 58, 255–264. [Google Scholar] [CrossRef]
  16. Mo, J.; Zhang, W.; Zhu, W.; Gundersen, P.; Fang, Y.; Li, D.; Wang, H. Nitrogen addition reduces soil respiration in a mature tropical forest in southern China. Glob. Chang. Biol. 2008, 14, 403–412. [Google Scholar] [CrossRef]
  17. Deng, Q.; Zhou, G.; Liu, J.; Liu, S.; Duan, H.; Zhang, D. Responses of soil respiration to elevated carbon dioxide and nitrogen addition in young subtropical forest ecosystems in China. Biogeosciences 2010, 7, 315–328. [Google Scholar] [CrossRef] [Green Version]
  18. Gao, Q.; Hasselquist, N.J.; Palmroth, S.; Zheng, Z.M.; You, W.H. Short-term response of soil respiration to nitrogen fertilization in a subtropical evergreen forest. Soil Biol. Biochem. 2014, 76, 297–300. [Google Scholar] [CrossRef]
  19. Elser, J.J.; Bracken, M.E.; Cleland, E.E.; Gruner, D.S.; Harpole, W.S.; Hillebrand, H.; Ngai, J.T.; Seabloom, E.W.; Shurin, J.B.; Smith, J.E. Global analysis of nitrogen and phosphorus limitation of primary producers in freshwater, marine and terrestrial ecosystems. Ecol. Lett. 2007, 10, 1135–1142. [Google Scholar] [CrossRef] [Green Version]
  20. Zhang, W.; Mo, J.M.; Zhou, G.Y.; Gundersen, P.; Fang, Y.T.; Lu, X.K.; Zhang, T.; Dong, S.F. Methane uptake responses to nitrogen deposition in three tropical forests in southern China. J Geophys. Res. Atmos. 2008, 113, D11116. [Google Scholar] [CrossRef]
  21. Jassal, R.S.; Black, T.A.; Trofymow, J.A.; Roy, R.; Nesic, Z. Soil CO2 and N2O flux dynamics in a nitrogen-fertilized Pacific Northwest Douglas-fir stand. Geoderma 2010, 157, 118–125. [Google Scholar] [CrossRef]
  22. Sutton-Grier, A.E.; Megonigal, J.P. Plant species traits regulate methane production in freshwater wetland soils. Soil Biol. Biochem. 2011, 43, 413–420. [Google Scholar] [CrossRef] [Green Version]
  23. Luo, G.J.; Kiese, R.; Wolf, B.; Butterbach-Bahl, K. Effects of soil temperature and moisture on methane uptake and nitrous oxide emissions across three different ecosystem types. Biogeosciences 2013, 10, 3205–3219. [Google Scholar] [CrossRef] [Green Version]
  24. Wang, C.; Lai, D.Y.F.; Sardans, J.; Wang, W.; Zeng, C.; Peñuelas, J. Factors related with CH4 and N2O emissions from a paddy field: Clues for management implications. PLoS ONE 2017, 12, e0169254. [Google Scholar] [CrossRef] [PubMed]
  25. Xu, G.Q.; Fang, S.H.; Xia, T. Advances of Jasmine Tea processing technology. Tea Fujian 2001, 23, 10–12. [Google Scholar]
  26. Yang, J.F.; Fu, T.L.; Ye, N.X.; Chen, Q.; Zheng, N.H.; Sun, Y.; Yuan, D.S.; Guo, Y.Q.; Chen, Y.R.; Lin, G.S.; et al. Fujian Jasmine Tea; Xiamen University Press: Xiamen, Chiana, 2008; pp. 55–57. [Google Scholar]
  27. Xu, R.; Zhao, A.; Yuan, J.; Jiang, J. pH buffering capacity of acid soils from tropical and subtropical regions of China as influenced by incorporation of crop straw biochars. J. Soil Sediment. 2012, 12, 494–502. [Google Scholar] [CrossRef]
  28. Wang, W.; Min, Q.; Sardans, J.; Wang, C.; Asensio, D.; Bartrons, M.; Peñuelas, J. Organic cultivation of jasmine and tea increases carbon sequestration by changing plant and soil stoichiometry. Agron. J. 2016, 108, 1636–1648. [Google Scholar] [CrossRef]
  29. Wang, W.; Sardans, J.; Lai, D.Y.F.; Wang, C.; Zeng, C.; Tong, C.; Liang, Y.; Peñuelas, J. Effects of steel slag application on greenhouse gas emissions and crop yield over multiple growing seasons in a subtropical paddy field in China. Field Crop. Res. 2015, 171, 146–156. [Google Scholar] [CrossRef] [Green Version]
  30. Siczek, A.; Frąc, M. Soil microbial activity as influenced by compaction and straw mulching. Int. Agrophys. 2012, 26, 65–69. [Google Scholar] [CrossRef] [Green Version]
  31. Thomson, C.J.; Marschner, H.; Römheld, V. Effect of nitrogen fertilizer form on pH of the bulk soil and rhizosphere, and on the growth, phosphorus, and micronutrient uptake of bean. J. Plant Nutr. 1993, 16, 493–506. [Google Scholar] [CrossRef]
  32. Sharma, S.K.; Shayam, D.; Sharma, Y.K. Effect of paddy straw and paper mill effluent on physico-chemical properties of soil. J. Struct. Chem. 2012, 11, 137–138. [Google Scholar]
  33. Mcclaugherty, C.A.; Pastor, J.; Aber, J.D.; Melillo, J.M. Forest litter decomposition in relation to soil nitrogen dynamics and litter quality. Ecology 1985, 66, 266–275. [Google Scholar] [CrossRef]
  34. Zhou, S.; Xiao, Y.; Xiang, Y.; Huang, C.; Tang, J.; Han, B.; Luo, C. Effects of simulated nitrogen deposition on the substrate quality of foliar litter in a natural evergreen broad-leaved forest in the rainy area of Western China. Acta Ecol. Sin. 2016, 36, 7428–7434. [Google Scholar]
  35. Bengtsson, G.; Fronaeus, S.; Bengtsson-Kloo, L. The kinetics and mechanism of oxidation of hydroxylamine by iron (III). J. Chem. Soc. Dalton 2002, 12, 2548–2552. [Google Scholar] [CrossRef]
  36. Noubactep, C. On the mechanism of microbe inactivation by metallic iron. J. Hazard. Mater. 2011, 198, 383–386. [Google Scholar] [CrossRef] [Green Version]
  37. Liptzin, D.; Silver, W.L. Effects of carbon additions on iron reduction and phosphorus availability in a humid tropical forest soil. Soil Biol. Biochem. 2009, 41, 1696–1702. [Google Scholar] [CrossRef]
  38. Rivera-Cruz, M.D.C.; Narcía, A.T.; Ballona, G.C.; Kohler, J.; Caravaca, F.; Roldán, A. Poultry manure and banana waste are effective biofertilizer carriers for promoting plant growth and soil sustainability in banana crops. Soil Biol. Biochem. 2008, 40, 3092–3095. [Google Scholar] [CrossRef]
  39. Yang, X.; Chasteen, N.D. Ferroxidase activity of ferritin: Effects of pH, buffer and Fe(II) and Fe(III) concentrations on Fe(II) autoxidation and ferroxidation. Biochem. J. 1999, 338, 615–618. [Google Scholar] [CrossRef] [PubMed]
  40. Dubinsky, E.A.; Silver, W.L.; Firestone, M.K. Tropical forest soil microbial communities couple iron and carbon biogeochemistry. Ecology 2010, 91, 2604–2612. [Google Scholar] [CrossRef] [Green Version]
  41. Lentini, C.J.; Wankel, S.D.; Hansel, C.M. Enriched iron(III)-reducing bacterial communities are shaped by carbon substrate and iron oxide mineralogy. Front. Microbiol. 2012, 3, 404. [Google Scholar] [CrossRef]
  42. Yang, W.H.; Liptzin, D. High potential for iron reduction in upland soils. Ecology 2015, 96, 2015–2020. [Google Scholar] [CrossRef]
  43. Cameron, F.J.; Jones, M.V.; Edwards, C. Effects of salinity on bacterial iron oxidation. Curr. Microbiol. 1984, 10, 353–356. [Google Scholar] [CrossRef]
  44. Qiu, W.; Dai, J.; Wang, N.; Guo, X.; Zhang, X.; Zuo, Y. Effects of fe-deficient conditions on Fe uptake and utilization in P-efficient soybean. Plant Physiol. Biochem. 2017, 112, 1–8. [Google Scholar] [CrossRef] [PubMed]
  45. Lovley, D.R.; Phillips, E.J. Organic matter mineralization with reduction of ferric iron in anaerobic sediments. Appl. Environ. Microbiol. 1986, 51, 683–689. [Google Scholar] [PubMed]
  46. Weber, F.A.; Hofacker, A.F.; Voegelin, A.; Kretzschmar, R. Temperature dependence and coupling of iron and arsenic reduction and release during flooding of a contaminated soil. Environ. Sci. Technol. 2010, 44, 116–122. [Google Scholar] [CrossRef] [PubMed]
  47. Vogel, J.G.; Suau, L.J.; Martin, T.A.; Jokela, E.J. Long-term effects of weed control and fertilization on the carbon and nitrogen pools of a slash and loblolly pine forest in north-central Florida. Can. J. For. Res. 2011, 41, 552–567. [Google Scholar] [CrossRef]
  48. Fang, J.; Zhao, K.; Liu, S. Factors affecting soil respiration in reference with temperature’s role in the global scale. Chin. Geogr. Sci. 1998, 8, 246–255. [Google Scholar] [CrossRef]
  49. Ge, T.; Liu, C.; Yuan, H.; Zhao, Z.; Wu, X.; Zhu, Z.; Brookes, P.; Wu, J. Tracking the photosynthesized carbon input into soil organic carbon pools in a rice soil fertilized with nitrogen. Plant Soil 2015, 392, 17–25. [Google Scholar] [CrossRef]
  50. Inselsbacher, E.; Wanek, W.; Ripka, K.; Hackl, E.; Sessitsch, A.; Strauss, J.; Zechmeister-Boltenstern, S. Greenhouse gas fluxes respond to different N fertilizer types due to altered plant-soil-microbe interactions. Plant Soil 2011, 343, 17–35. [Google Scholar] [CrossRef]
  51. Adewopo, J.B.; Silveira, M.L.; Xu, S.; Gerber, S.; Sollenberger, L.E.; Martin, T.A. Long-term grassland intensification impacts on particle-size soil carbon fractions: Evidence from carbon-13 abundance. Soil Sci. Soc. Am. J. 2015, 79, 1198–1205. [Google Scholar] [CrossRef]
  52. Luo, X.; Liu, S.; Gao, H.X.; Liao, H.Y.; Tontiwachwuthikul, P.; Liang, Z.W. An improved fast screening method for single and blended amine-based solvents for post-combustion CO2 capture. Sep. Purif. Technol. 2016, 169, 279–288. [Google Scholar] [CrossRef]
  53. Huang, B.; Rachmilevitch, S.; Xu, J. Root carbon and protein metabolism associated with heat tolerance. J. Exp. Bot. 2012, 63, 3455–3465. [Google Scholar] [CrossRef] [Green Version]
  54. Buyanovsky, G.A.; Wagner, G.H. Carbon cycling in cultivated land and its global significance. Glob. Chang. Biol. 1998, 4, 131–141. [Google Scholar] [CrossRef]
  55. Laughlin, R.J.; Stevens, A.R.J.; Müller, A.C.; Watson, C.J. Evidence that fungi can oxidize NH4+ to NO3 in a grassland soil. Eur. J. Soil Sci. 2008, 59, 285–291. [Google Scholar] [CrossRef]
  56. Bannert, A.; Bogen, C.; Esperschütz, J.; Koubová, A.; Buegger, F.; Fischer, D.; Radl, V.; Fu, R.; Chroňáková, A.; Evlhottová, D.; et al. Anaerobic oxidation of methane in grassland soils used for cattle husbandry. Biogeosciences 2012, 9, 3891–3899. [Google Scholar] [CrossRef] [Green Version]
  57. Wang, W.Q.; Zeng, C.S.; Tong, C. Reviews on electron acceptors of controlling methane production from Wetlands. Sci. Geogr. Sin. 2009, 29, 300–306. [Google Scholar]
  58. Xu, S.; Shi, X.; Zhao, Y.; Yu, D.; Li, C.; Wang, S.; Tan, M.; Sun, W. Carbon sequestration potential of recommended management practices for paddy soils of China, 1980–2050. Geoderma 2011, 166, 206–213. [Google Scholar] [CrossRef]
  59. Praeg, N.; Wagner, A.O.; Illmer, P. Effects of fertilisation, temperature and water content on microbial properties and methane production and methane oxidation in subalpine soils. Eur. J. Soil Biol. 2014, 65, 96–106. [Google Scholar] [CrossRef]
  60. Xie, B.; Gu, J.; Yu, J.; Han, G.; Zheng, X.; Xu, Y.; Lin, H. Effects of n fertilizer application on soil N2O emissions and CH4 uptake: A two-year study in an apple orchard in Eastern China. Atmosphere 2017, 8, 181. [Google Scholar] [CrossRef]
  61. Klumpp, K.; Bloor, J.M.G.; Ambus, P.; Soussana, J.F. Effects of clover density on N2O emissions and plant-soil n transfers in a fertilised upland pasture. Plant Soil 2011, 343, 97–107. [Google Scholar] [CrossRef]
  62. Zhou, M.; Bo, Z.; Butterbach-Bahl, K.; Tao, W.; Bergmann, J.; Brüggemann, N.; Wang, Z.; Li, T.; Kuang, F. Nitrate leaching, direct and indirect nitrous oxide fluxes from sloping cropland in the purple soil area, Southwestern China. Environ. Pollut. 2012, 162, 361–368. [Google Scholar] [CrossRef]
  63. Toyoda, S.; Yano, M.; Nishimura, S.; Akiyama, H.; Hayakawa, A.; Koba, K.; Sudo, S.; Yagi, K.; Makabe, A.; Tobari, Y.; et al. Characterization and production and consumption processes of N2O emitted from temperate agricultural soils determined via isotopomer ratio analysis. Glob. Biogeochem. Cycles 2011, 25, GB2008. [Google Scholar] [CrossRef]
  64. Wang, W.; Sardans, J.; Wang, C.; Tong, C.; Ji, Q.; Peñuelas, J. Effects of fertilization on porewater nutrients, greenhouse-gas emissions and rice productivity in a subtropical paddy field. Exp. Agric. 2018. [Google Scholar] [CrossRef]
  65. Kinsbursky, R.S.; Saltzman, S. CO2-nitrification relationships in closed soil incubation vessels. Soil Biol. Biochem. 1990, 22, 571–572. [Google Scholar] [CrossRef]
  66. Zhu, Q.; Pan, Y.Z.; Zhao, L. The effects of N, P, K, and Ca on plant growth and nutrient content of Lily leaves. Acta Pratacult. Sin. 2012, 21, 274–284. [Google Scholar]
  67. Zhong, F.; Zhao, J.; Sun, R.G.; Li, Z.P.; Wang, W.P. Spatial distribution of soil nutrients and soil microbes in five arbore-bushe-grass lands at the south-north hills in lanzhou, China. Acta Pratacult. Sin. 2010, 25, 990–1000. [Google Scholar]
  68. Liu, H.; Li, F.; Jia, Y. Effects of shoot removal and soil water content on root respiration of spring wheat and soybean. Environ. Exp. Bot. 2006, 56, 28–35. [Google Scholar] [CrossRef]
  69. Osher, L.J.; Matson, P.A.; Amundson, R. Effect of land use change on soil carbon in Hawaii. Biogeochemistry 2003, 65, 213–232. [Google Scholar] [CrossRef]
  70. Cleveland, C.C.; Nemergut, D.R.; Schmidt, S.K.; Townsend, A.R. Increases in soil respiration following labile carbon additions linked to rapid shifts in soil microbial community composition. Biogeochemistry 2007, 82, 229–240. [Google Scholar] [CrossRef]
  71. Larsen, K.S.; Andresen, L.C.; Beier, C.; Jonasson, S.; Albert, K.R.; Ambus, P.; Arndal, M.F.; Carter, M.S.; Christensen, S.; Holmstrup, M.; et al. Reduced N cycling in response to elevated CO2, warming, and drought in a Danish heathland: Synthesizing results of the CLIMAITE project after two years of treatments. Glob. Chang. Biol. 2011, 17, 1884–1899. [Google Scholar] [CrossRef]
  72. Reddy, N.; Crohn, D.M. Effects of soil salinity and carbon availability from organic amendments on nitrous oxide emissions. Geoderma 2014, 235–236, 363–371. [Google Scholar] [CrossRef]
  73. Gillam, K.M.; Zebarth, B.J.; Burton, D.L. Nitrous oxide emissions from denitrification and the partitioning of gaseous losses as affected by nitrate and carbon addition and soil aeration. Can. J. Soil Sci. 2008, 88, 133–143. [Google Scholar] [CrossRef] [Green Version]
  74. Dalal, R.C.; Wang, W.; Robertson, G.P.; Parton, W.J. Nitrous oxide emission from Australian agricultural lands and mitigation options: A review. Soil Res. 2003, 41, 165–195. [Google Scholar] [CrossRef]
  75. Bai, E.; Li, W.; Li, S.; Sun, J.; Peng, B.; Dai, W.; Jiang, P.; Han, S. Pulse increase of soil N2O emission in response to N addition in a temperate forest on Mt Changbai, Northeast China. PLoS ONE 2014, 9, e102765. [Google Scholar] [CrossRef]
  76. Li, S.X.; Wang, Z.H.; Li, S.Q.; Gao, Y.J.; Tian, X.H. Effect of plastic sheet mulch, wheat straw mulch, and maize growth on water loss by evaporation in dryland areas of China. Agric. Water Manag. 2013, 116, 39–49. [Google Scholar] [CrossRef]
  77. Wang, W.; Lai, D.Y.F.; Wang, C.; Pan, T.; Zeng, C. Effects of rice straw incorporation on active soil organic carbon pools in a subtropical paddy field. Soil Tillage Res. 2015, 152, 8–16. [Google Scholar] [CrossRef]
  78. Wang, W.; Zeng, C.; Sardans, J.; Zeng, D.; Wang, C.; Bartrons, M.; Peñuelas, J. Industrial and agricultural wastes decreased greenhouse-gas emissions and increased rice grain yield in a subtropical paddy field. Exp. Agric. 2018, 54, 623–640. [Google Scholar] [CrossRef]
  79. Cai, Z.; Wang, B.; Xu, M.; Zhang, H.; He, X.; Zhang, L.; Gao, S. Intensified soil acidification from chemical n fertilization and prevention by manure in an 18-year field experiment in the red soil of Southern China. J. Soils Sediments 2015, 15, 260–270. [Google Scholar] [CrossRef]
  80. Zu, C.; Li, Z.G.; Yang, J.F.; Yu, H.; Sun, Y.; Tang, H.L.; Yost, R.; Wu, H.S. Acid soil is associated with reduced yield, root growth and nutrient uptake in black pepper (Piper nigrum L.). J. Agric. Sci. 2014, 5, 466–473. [Google Scholar]
  81. Wang, W.; Sardans, J.; Zeng, C.; Zhong, C.; Li, Y.; Peñuelas, J. Response of soil nutrient concentrations and stoichiometry to different land uses in a subtropical wetland. Geoderma 2014, 232–234, 459–470. [Google Scholar] [CrossRef]
  82. Bhattacharyya, P.; Roy, K.S.; Neogi, S.; Adhya, T.K.; Rao, K.S.; Manna, M.C. Effects of rice straw and nitrogen fertilization on greenhouse gas emissions and carbon storage in tropical flooded soil planted with rice. Soil Tillage Res. 2012, 124, 119–130. [Google Scholar] [CrossRef]
  83. Wang, C.; Li, X.; Min, Q.; Wang, W.; Sardans, J.; Zeng, C.; Tong, C.; Peñuelas, J. Responses of greenhouse-gas emissions to land-use change from rice to jasmine production in subtropical China. Atmos. Environ. 2019, 201, 391–401. [Google Scholar] [CrossRef]
Figure 1. Locations of the study area, sampling site (▲) in Fujian Province, southeastern China.
Sustainability 11 01092 g001
Figure 2. Soil water content (Mean ± S.E., average during the studied period) in CK, HF, SF, DF, S, S + HF, S + SF, and S + DF treatments. Bar above the lines represents standard errors. CK: control, HF: half fertilizer, SF: standard fertilizer, DF: double fertilizer, S: straw, S + HF: straw + half fertilizer, S + SF: straw + standard fertilizer, S + DF: straw + double fertilizer. Different letters indicate significant differences among treatments.
Sustainability 11 01092 g002
Figure 3. Soil and plant physicochemical properties (Mean ± S.E., in each month during the studied period). (A) soil temperature (B) soil moisture, (C) soil pH and (D) soil salinity during the whole observation period in CK, HF, SF, DF, S, S + HF, S + SF, and S + DF treatments. Bar above the lines represents standard errors. CK: control, HF: half fertilizer, SF: standard fertilizer, DF: double fertilizer, S: straw, S + HF: straw + half fertilizer, S + SF: straw + standard fertilizer, S + DF: straw + double fertilizer.
Sustainability 11 01092 g003
Figure 4. Iron soil concentration (Mean ± S.E., in each month during the studied period). (A) total Fe (B) Fe2+ (C) Fe3+ in CK, HF, SF, DF, S, S + HF, S + SF, and S + DF treatments during the whole observation period. CK: control, HF: half fertilizer, SF: standard fertilizer, DF: double fertilizer, S: straw, S + HF: straw + half fertilizer, S + SF: straw + standard fertilizer, S + DF: straw + double fertilizer.
Sustainability 11 01092 g004
Figure 5. Pair-wise relationships between soil total Fe and Fe2+ (Top), soil total Fe and Fe3+ (Middle), and soil Fe2+ and Fe3+ (Bottom) in all treatments during the whole observation period.
Sustainability 11 01092 g005
Figure 6. Greenhouse gas emissions (Mean ± S.E., in each month during the studied period). (A) N2O–N (B) CH4–C (C) CO2–C in CK, HF, SF, DF, S, S + HF, S + SF and S + DF treatments. Bar above the lines represents standard errors. CK: control, HF: half fertilizer, SF: standard fertilizer, DF: double fertilizer, S: straw, S + HF: straw + half fertilizer, S + SF: straw + standard fertilizer, S + DF: straw + double fertilizer.
Sustainability 11 01092 g006
Figure 7. Results of the General Discriminant Analysis (GDA) performed with soil pH, water content, salinity, temperature, total Fe, Fe2+, and Fe3+, plant height, and soil CO2, CH4, and N2O emissions as independent continuous variables, different treatments as dependent categorical grouping variables, and the time of sampling as the controlling categorical independent variable. Layout (A) showed the distribution (mean ± 95% confidence intervals) of different treatments and the control in the layout formed by the first two roots of the GDA, together explaining 72.4% of the total variance. Plot (B) shows the independent variable distributions according to their layouts on these first two root axes.
Sustainability 11 01092 g007
Table 1. Characteristic of the control and treatments of this experiment.
TreatmentStraw First Time Fertilizer (One Day after The J. sambac Was Cut)Second Time Fertilizer (One Day after the First J. sambac Flowers Were Collected)
No fertilizer + no straw (control, CK)NoNoNo
Half fertilization + no straw (HF)No65 kg ha−150 kg ha−1
Standard fertilization + no straw (SF)No130 kg ha−1100 kg ha−1
Double fertilization + no straw (DF)No260 kg ha−1200 kg ha−1
No fertilizer + straw (S)3.5 Mg ha−1NoNo
Half fertilization + straw (S + HF)3.5 Mg ha−165 kg ha−150 kg ha−1
Standard fertilization + straw (S + SF)3.5 Mg ha−1130 kg ha−1100 kg ha−1
Double fertilization + straw (S + DF)3.5 Mg ha−1260 kg ha−1200 kg ha−1
Table 2. Summary of the repeated-measures analyses of variances (RM-ANOVAs) for the greenhouse-gas emissions for the various amendments.
IndexVariables dfMSFP
Treatments72,013,690 1.27 <0.01
CO2Time1023,182,135 42.71 <0.01
Treatments × Time704,654,081 1.23 0.15
Treatments7119,844 4.07 <0.01
CH4Time10155,3774.94 <0.01
Treatments × Time701,689,456 7.68 <0.01
Treatments720,378 11.71 <0.01
N2OTime10212,118 85.85 <0.01
Treatments × Time70488,849 28.26 <0.01

